

Abstract
Mutation rates of microsatellites vary greatly among loci. The causes of this heterogeneity remain largely enigmatic yet are crucial for understanding numerous human neurological diseases and genetic instability in cancer. In this first genome-wide study, the relative contributions of intrinsic features and regional genomic factors to the variation in mutability among orthologous human–chimpanzee microsatellites are investigated with resampling and regression techniques. As a result, we uncover the intricacies of microsatellite mutagenesis as follows. First, intrinsic features (repeat number, length, and motif size), which all influence the probability and rate of slippage, are the strongest predictors of mutability. Second, mutability increases nonuniformly with length, suggesting that processes additional to slippage, such as faulty repair, contribute to mutations. Third, mutability varies among microsatellites with different motif composition likely due to dissimilarities in secondary DNA structure formed by their slippage intermediates. Fourth, mutability of mononucleotide microsatellites is impacted by their location on sex chromosomes vs. autosomes and inside vs. outside of Alu repeats, the former confirming the importance of replication and the latter suggesting a role for gene conversion. Fifth, transcription status and location in a particular isochore do not influence microsatellite mutability. Sixth, compared with intrinsic features, regional genomic factors have only minor effects. Finally, our regression models explain ∼90% of variation in microsatellite mutability and can generate useful predictions for the studies of human diseases, forensics, and conservation genetics.
Microsatellites, i.e., tandemly recurring nucleotide sequences of short (1–6 bp) motifs, are ubiquitous in eukaryotic genomes and undergo rapid length changes due to insertion or deletion of one or multiple repeat units (Ellegren 2004; Pearson et al. 2005). Microsatellite mutation rates are high (10−4–10−2 mutations per locus per generation in humans) and vary greatly among loci (Ellegren 2004). The causes of this variation are not completely understood but are of great interest because microsatellite instability is implicated in cancer (Oda et al. 2005), expansions of microsatellites are responsible for over 40 neurological disorders (Pearson et al. 2005), and microsatellites are widely used markers in forensics and conservation genetics (Ellegren 2004).
The most commonly proposed mutation mechanism for microsatellites is strand slippage, occurring predominantly during replication (Ellegren 2004); because of homology among microsatellite repeats, the two DNA strands might realign incorrectly after dissociation, introducing a loop at one strand and leading to microsatellite expansion/contraction (Ellegren 2004). However, experimental evidence indicates formation of unorthodox secondary DNA structures at microsatellites not only during replication but also during recombination and repair, with mismatch repair (MMR) being the dominant type of repair for microsatellites (Pearson et al. 2005). Thus, mechanisms other than replication slippage might contribute to microsatellite mutations.
The mutation rate at a microsatellite in part depends on its intrinsic features, e.g., the number of repeated units, length (in base pairs), and the repeated motif. Microsatellites with a greater number of repeats are more mutable due to the increased probability of slippage (Ellegren 2004). At the same time, microsatellites with greater length, irrespective of the number of repeats, usually possess more complex and stable non-B-DNA conformations and this can also facilitate slippage and elevate mutation rates (Webster et al. 2002). Moreover, mutation rates of microsatellites equal in length were found to be inversely proportional to their motif sizes (lengths of the repeated unit in base pairs) (Chakraborty et al. 1997). Finally, due to dissimilarities in secondary DNA structure, mutation rates might vary among microsatellites with different motif composition (Baldi and Baisnee 2000). To date, these features have not been considered together or on a genome-wide scale.
Genomic features varying regionally are also expected to contribute to variation in microsatellite mutation rates (Ellegren 2004). High local substitution rates cause frequent repeat interruptions that make slippage less likely and decrease microsatellite mutation rates (Rolfsmeier and Lahue 2000). Local recombination rates might affect microsatellite mutation rates if some new length-variants originate through unequal crossing over or gene conversion (Ellegren 2004; Pearson et al. 2005). Relatedly, microsatellites might be less stable if they are located within Alu repeats (Clark et al. 2004) because these repeats are known to mediate recombination (Batzer and Deininger 2002). Transcription can influence microsatellite mutation rates through alterations of DNA structure (Mochmann and Wells 2004; Pearson et al. 2005) or interference with replication (Krasilnikova et al. 1998).
If mutations at microsatellites result mostly from replication slippage in the germline, then microsatellites located on sex chromosomes and autosomes should have distinct mutation rates because of the different number of DNA replication rounds they undergo (Y > autosomes > X) (Li et al. 2002). Clearly, the microsatellite mutation process is a function of inherent sequence properties as well as chromosomal and regional genomic factors. A comprehensive model evaluating the relative importance of these features is needed.
Recently Webster et al. (2002) identified microsatellites at orthologous locations in 5 Mb of human–chimpanzee alignments and studied their mutability, or the average squared difference in the number of repeats between orthologous loci. Since some microsatellite mutations involve expansions/contractions by several repeated units (Ellegren 2004), mutability reflects both mutation rate and variance in mutation step size (Webster et al. 2002); most human pedigree studies found that only <15% of microsatellite mutations are multistep changes (Ellegren 2004). The approach proposed by Webster et al. (2002) is not affected by ascertainment bias in identifying microsatellites and effectively captures germline (and not somatic) mutations.
Here we study the mutability of uninterrupted microsatellites from genome-wide human–chimpanzee alignments. We investigate how microsatellite mutability depends on repeat number, microsatellite length, and motif size and composition, as well as transcription status, location on sex chromosomes vs. autosomes, local nucleotide substitution and recombination rates, GC content, and interspersed repeat content.
Results and Discussion
Identification of orthologous microsatellites
We initially identified all uninterrupted microsatellites with motif size from one to four in human and chimpanzee (see Methods). We focused on uninterrupted microsatellites because they are easier to define and detect than interrupted microsatellites (Buschiazzo and Gemmell 2006; Leclercq et al. 2007). Mono- through tetranucleotide microsatellites were examined because they are more abundant than penta- and hexanucleotide microsatellites (Lai and Sun 2003), allowing a more detailed analysis. Next, we filtered out microsatellites that had (1) no orthologous microsatellites in one of the species and/or (2) low-quality sequences in chimpanzee and/or (3) different repeated motifs at orthologous locations in human and chimpanzee and/or (4) neighboring microsatellites within 10 bp (because adjacent microsatellites might affect each other’s mutation rates) (Almeida and Penha-Goncalves 2004) and/or (5) fewer than nine repeats for mononucleotide repeats, or fewer than four repeats for other microsatellites (because the probability of slippage at such small repeat numbers is very low [Lai and Sun 2003], considering microsatellites below slippage threshold did not change our results) (data not shown). This resulted in 2,107,841 orthologous microsatellite pairs. For most pairs with unequal repeat number, microsatellites were longer in human than in chimpanzee (data not shown), supporting observations from other studies (Vowles and Amos 2006). For all subsequent analyses, unless noted otherwise, we utilized intergenic and intronic autosomal microsatellites, including 744,769, 952,382, 97,098, and 76,074 mono-, di-, tri-, and tetranucleotides, respectively (Table S1).
Effects of repeat number, motif size, and length on mutability
Microsatellites were binned into groups according to repeat number and motif size. Mutability (per locus per generation), based on the average squared difference in repeat number between orthologs, was calculated for each group separately (see Methods).
Our analysis confirms that mutability grows with repeat number (Fig. 1A), most likely due to an increase in the probability of slippage (Pearson et al. 2005). Remarkably, depending on the number of repeats, mutability of microsatellites with the same motif size varies more than 100-fold! The relationship between mutability and repeat number appears to be, by and large, exponential, supporting other studies (e.g., Eckert et al. 2002a; Webster et al. 2002). However, we discovered that the mutability function follows a steep ascent at lower repeat numbers and a more moderate one at higher repeat numbers (see below). Among microsatellites with high repeat numbers (n > 15), the mutability is lowest for mononucleotides, followed by dinucleotides, and highest for tri- and tetranucleotides (the last two have low abundance at high repeat numbers, and thus their curves are shorter).
Figure 1.

Dependence of microsatellite mutability on repeat number (A) and length (B). Mutability is per locus per generation. The bands around the curves indicate the 2.5th and 97.5th percentiles of empirical distributions obtained through a resampling procedure (see Methods). Only points with at least 30 microsatellites are plotted.
Longer motifs induce higher mutability for microsatellites with the same repeat number through increase in length; greater lengths indicate more complex and stable stretches of unorthodox DNA conformations (Sinden 1994) that might elevate mutability. Indeed, mutability grows exponentially not only with repeat number (Fig. 1A) but also with microsatellite length (Fig. 1B), consistent with an earlier report (Webster et al. 2002), although again with noticeable slope changes at smaller vs. greater lengths. However, length being equal, mutability is conspicuously lower for microsatellites with longer motifs, corroborating a study of human population data (Chakraborty et al. 1997). From our data, after ∼20–25 bp, the extrapolated intercepts of the mutability function decrease with motif size, while the slopes remain approximately constant.
The lower mutability for microsatellites with longer motifs (length being equal) (Fig. 1B) suggests that motif size also has a separate negative effect on mutability. For fixed length, longer motifs indicate lower repeat number, and this adversely affects slippage (see above). In addition, longer motifs, on average, have a lower rate of slippage-synthesis (Schlotterer and Tautz 1992), potentially causing decreased mutability.
The intriguing shift in slope of the mutability function as repeat number (or length) increases (Fig. 1) is particularly marked for dinucleotides (for which an intermediate phase with mutability independent of either repeat number or length is also present, see below), but the shift is still noticeable for other microsatellites. A steeper slope under ∼15–20 bp might be explained by the rapid growth in the fraction of orthologs that underwent mutations (Fig. S1A; see Appendix). Biologically, different processes might contribute to microsatellite mutations at smaller vs. greater lengths.
At smaller lengths (below ∼15–20 bp), slippage loop intermediates are short and efficiently corrected by polymerase exonucleolytic proofreading (Kroutil et al. 1996) and MMR (Sia et al. 1997), resulting in low fractions of mutated microsatellites (Fig. S1A). The efficiency of these repair processes decreases sharply as microsatellite length increases (Kroutil et al. 1996; Sia et al. 1997). In this range, even small gains in length allow formation of larger loops leading to ineffective repair, elevation of the proportion of orthologs with mutations (Fig. S1A), and, as a result, a steep slope in the mutability function (Fig. 1B). At greater lengths (over ∼15–20 bp), MMR and exonucleolytic proofreading are ineffective (Kroutil et al. 1996; Sia et al. 1997), possibly creating distinctive mutation dynamics and a different slope of the mutability function.
Additionally, for smaller lengths, polymerase extension efficiency (during slippage) depends on length (Eckert et al. 2002a) and this also might contribute to a steep slope in the mutability function. Indeed, both the slippage loop and primer terminus (the point of DNA synthesis during slippage) are physically covered by polymerase if they are separated by ≤16 nucleotides (for human polymerase β). Thus, at smaller lengths, the greater the distance between slippage loop and primer terminus, the higher the efficiency of polymerase extension due to reduced structural interference of the slippage loop with the extension process. At greater lengths, the structural alterations caused by the slippage loop are too distant from the primer terminus to influence polymerase efficiency, potentially moderating the slope of the mutability function. More pronounced growth of mutation rates at low vs. high repeat numbers was suspected in an experimental study (Eckert et al. 2002a).
For dinucleotides, mutability is virtually constant between repeat number 10 and 15 (Fig. 1A). Interestingly, the decay of the frequency distribution for dinucleotides decelerates within a similar range of repeat numbers (Fig. S1C; Lai and Sun 2003). Therefore, dinucleotides with 10–15 repeats might be influenced by processes additional to replication slippage, including selection for yet unknown functions (e.g., facilitation of recombination), more efficient repair (Almeida and Penha-Goncalves 2004), and differences in rates of expansions and contractions; the latter was suggested to explain the frequency distribution (Xu et al. 2000).
Effect of motif composition on mutability
To assess the effect of motif composition, we computed mutability for groups of microsatellites binned by repeat number, motif size, and motif composition. Among mononucleotides (Fig. 2A), the mutability is significantly higher for (A)n than (C)n microsatellites, at least at low repeat numbers (n < 17). This is largely supported by experimental assays (Boyer et al. 2002). Possible causes of distinct mutability for (A)n vs. (C)n include differences in secondary DNA structure, stacking interactions, and stabilities of looped intermediates during replication slippage (Karthikeyan et al. 1999; Sagher et al. 1999). Few (C)n microsatellites were observed with more than 20 repeats, reflecting their hypermutability (Boyer et al. 2002) and/or their ability to form triplex and four-stranded structures (i-motifs and G-quartets), interfering with transcription (Sinden 1994).
Figure 2.

Dependence of microsatellite mutability on motif composition for mononucleotide (A) and dinucleotide (B) microsatellite loci. See description of Figure 1.
Four types of dinucleotide motifs differ in their mutability patterns (Fig. 2B). The majority of (CG)n microsatellites are short, possibly due to high point mutation rates at methylated CpG sites. Among the remaining three dinucleotides, (AT)n runs exhibit the highest mutability. For n < 12, the mutability is significantly higher for (AC)n than (AG)n, while for n > 15, the pattern is reversed. Why do dinucleotides with different motifs have distinct mutability? First, since slippage involves loss and reforming of hydrogen bonds (Sinden 1994), the highest mutability observed for (AT)n can be attributed to a smaller number of hydrogen bonds in its double-stranded DNA than in that for either (AC)n or (AG)n. Second, the ranks of motif mutability ((AT)n > (AG)n > (AC)n) correspond to the ranks of stability of their hairpins facilitating slippage; (AT)n hairpins are the most stable due to Watson-Crick pairing, and (AG)n forms stronger hairpins compared with (AC)n (Casasnovas et al. 1993). Third, differences in secondary DNA structure among motifs might affect their mutability; (AG)n forms DNA triplexes; (AT)n can form four-stranded cruciforms; and both (CA)n and (GC)n form Z-DNA (Sinden 1994; Hile et al. 2000). Fourth, the probability of either utilization of misaligned intermediates by polymerase or of their escape from repair might also depend on motif composition (Bachtrog et al. 2000; Hile et al. 2000). These processes likely have unique properties depending on cell type and species, potentially explaining differences in results between the present study and analyses of human lymphoblastoid cells (Hile et al. 2000) and Drosophila (Bachtrog et al. 2000).
Among trinucleotides (Fig. S2A; Table S2), (AAG)n has the highest mutability, while microsatellites with other motifs display more similar behaviors. Expansion of the (AAG)n microsatellite in frataxin causes Friedrich’s ataxia (Pearson et al. 2005); (AAG)n forms triplex DNA and is associated with Alu elements (Clark et al. 2004). The genome-wide mutability of (AGC)n and (CCG)n, expansions of which at some loci also cause diseases (Pearson et al. 2005), is similar to that of motifs not currently known to be associated with diseases (Fig. S2A; Table S2). Consistent with our observations for dinucleotides (see above), trinucleotides also present a negative correlation between mutability and the number of hydrogen bonds in a motif at repeat numbers 4–9 (Table S3). This trend is also evident for tetranucleotides with small repeat numbers (4–5; Table S3).
The highest mutability among tetranucleotides (Fig. S2B; Table S2) is found for (AAAG)n and (AAGG)n, while mutability does not differ significantly among other motifs according to our resampling analysis. We observe lower mutability for (AGAT)9 than for either (AAAG)9 or (AAGG)9; the latter two microsatellites do not significantly differ in mutability (Fig. S2B). This is inconsistent with results of Eckert et al. (2002b), where (AGAT)9 was found to have the highest mutation rates, followed by (AAAG)9 and then by (AAGG)9. Since our study captures historical mutations in germline cells, while Eckert and colleagues (2002b) determined microsatellites mutation rates in human lymphoblastoid cells, the differences between the two studies suggest distinct environments in germline vs. somatic cells. Mutations in the (AGGC)n microsatellite located in the zinc finger protein 9 gene cause myotonic dystrophy type 2 (Pearson et al. 2005), although microsatellites with this motif have a comparatively low genome-wide mutability (Fig. S2B).
Effects of transcription, location in different isochores, and interspersed repeats on mutability
Mutability does not differ significantly between untranscribed (intergenic) and transcribed (intronic) microsatellites (Fig. S3), contradicting a hypothesis about the role of transcription in their mutations (Krasilnikova et al. 1998; Mochmann and Wells 2004; Pearson et al. 2005). Since the majority of the human genome might be transcribed at least occasionally (Kapranov et al. 2007), this result may be in part due to an inability to identify truly untranscribed regions. Microsatellite mutability also remains similar between different isochores (Fig. S4).
Intriguingly, mononucleotides (99.9% of them are (A)n runs) with low repeat numbers (n < 16) have higher mutability when they are inside or overlap with Alu repeats (Fig. 3A). Among these microsatellites, mutability increases from older to younger Alu subfamilies (AluJ < AluS < AluY). An association between distributions of (A)n repeats and Alus has been attributed to the fact that the latter possess middle and 3′ (tail) A-rich regions (Batzer and Deininger 2002; Roy-Engel et al. 2002). Elevated mutability of microsatellites in Alus may be due to a high frequency of gene conversion among these elements dispersed in the genome (Roy et al. 2000; Batzer and Deininger 2002; Webster et al. 2005), leading to greater differences in microsatellite repeat number at orthologous locations between species. Since gene conversion is facilitated by sequence similarity, younger Alu subfamilies undergo it more frequently than do older subfamilies (Roy et al. 2000; Batzer and Deininger 2002; Webster et al. 2005) and thus might have higher microsatellite mutability. Additionally, the L1 endonuclease might “revisit” (introduce nicks at) the AT-rich cleavage sites present at Alu ends (Jurka 1997), facilitating slippage at poly(A) tails and thus increasing mutability. At intermediate repeat numbers (n = 17–30), mononucleotides have lower mutability when located within Alus (Fig. 3A). This repeat number range coincides with the mean size of the 3′ A-rich tails of Alus potentially maintained by selection for their effective replication or transcription (Roy-Engel et al. 2002). Interestingly, the effect of location in Alus is only evident for mononucleotide microsatellites, potentially because of their high abundance in these repeats (352,812 mononucleotides are located in Alus). It is likely that we lose power to capture this effect for other microsatellites (Fig. S5) because they are present in relatively low numbers in Alus (only 30,826, 14,430, and 30,291 di-, tri-, and tetranucleotides, respectively, are located in Alus). Location in LINEs does not affect mutability (Figs. 3A; S5), even though a substantial number of microsatellites (at least mono- and dinucleotides, data not shown) are present at these repeats.
Figure 3.

Dependence of mononucleotide microsatellite mutability on location inside vs. outside of interspersed repetitive elements (A; AluY, AluJ, AluS, and LINEs) and chromosome type (B; X, Y, or autosomes). See description of Figure 1.
Effects of chromosome type on mutability
Microsatellite mutability was similar among different autosomes (data not shown). To evaluate the effect of chromosome type, we binned microsatellites into groups according to repeat number, motif size, and location on chromosomes X, Y, or autosomes (sex chromosome microsatellites were added at this point in the analysis). For mononucleotides (Fig. 3B), mutability is frequently significantly higher on Y than on other chromosomes, and higher on autosomes than on X for most repeat numbers, although often nonsignificantly (this pattern is not influenced by location inside vs. outside of Alus) (data not shown). This is consistent with replication-related mechanisms and male origin of many mononucleotide microsatellite mutations because of the higher number of replications in the male than the female germline (Ellegren 2004). In agreement with this, several pedigree analyses indicated higher microsatellite mutation rates in human males than females (e.g., Brinkmann et al. 1998; Ellegren 2000). For the mononucleotide data presented here, the male-to-female mutation rate ratio (α) is equal to 2.37 (95% CI = 1.49–2.80), 2.03 (95% CI = 1.50–2.76), and 2.31 (95% CI = 1.71–2.83) for the Y/A, X/A, and Y/X comparisons, respectively. In a comparison of polymorphism levels of human X-linked vs. autosomal microsatellites, α was also about 2 (Huttley et al. 2000). While these values are significantly greater than 1, arguing for importance of replication, they are inconsistent with replication errors being the sole source of microsatellite mutations (one would then expect α close to about 6, the ratio in the numbers of germline cell divisions between males and females in higher primates) (Li et al. 2002). This conclusion should be taken with caution because the effect of ancestral polymorphism for closely related species (Li et al. 2002) was not accounted for in our α estimates due to lack of polymorphism data.
The differences in mutability among X, Y, and autosomes are greater for mononucleotides (Fig. 3B) than other microsatellites (Fig. S6), and thus replication errors might contribute more to mutations in the mononucleotide microsatellites, consistent with a higher rate of slippage for shorter motifs (Schlotterer and Tautz 1992). Additionally, the relative contributions of replicative vs. nonreplicative slippage might differ for mutations at mononucleotide vs. other microsatellites; it is known that slippage occurs during not just replicative but also other DNA synthesis, e.g., in the course of long-tract DNA repair (Harfe and Jinks-Robertson 2000).
Explaining variation in microsatellite mutability
To assess the relative significance of the features discussed above, we computed mutability for genome-wide groups of microsatellites binned by repeat number, motif size, and location on sex chromosomes or autosomes, and regressed it on repeat number, motif size, and length (which can be thought of as an “interaction term” between repeat number and motif size) as quantitative predictors, adding chromosome type as a categorical predictor. We calculated the predictors’ relative contributions to variability explained (see Methods), which allows us to contrast their roles in determining mutability. The model explains 90.8% of the variation in mutability among microsatellite groups (Table 1, column 1). Microsatellite length (positive effect), motif size (negative effect), and repeat number (positive effect) are the strongest predictors. Chromosome type is a significant although weaker predictor. Similar results are obtained restricting the analysis to microsatellites with high repeat number, i.e., with strictly parallel mutability functions in Figure 1B (data not shown).
Table 1.
Multiple regression models for log mutability (per locus per generation) of genomewide and local microsatellite groups

For each predictor, the relative contribution to the variability explained (RCVE; see Methods) is indicated and the significance (log10 P-value with Bonferroni correction for multiple tests applied) is given in parentheses. For significant quantitative predictors, red indicates a positive effect on mutability; blue, a negative effect. For each model, the multiple R2 is indicated (adjusted R2’s were almost identical to multiple R2).
aOnly (A)n microsatellites were used.
bRepeat number was used in conjuction with its square root, the lower between the two log10P-values is provided.
cCategorical variable, the lower log10 P-value is provided.
dn.s. = not significant.
Since motif size is a pivotal determinant of mutability (Fig. 1), we investigated groups of mono-, di-, tri-, and tetranucleotide microsatellites in separate regressions, applying a further binning for motif composition and adding the latter as a categorical predictor in each regression (Table 1, columns 2–5). The regressions explain ∼79%–97% of the variation in mutability, the strongest predictor being repeat number, and motif composition also being significant in all regressions. Chromosome type is significant only for mononucleotides, supporting our previous observations (Figs. 3B; S6).
The relative contribution to variability explained (RCVE) of repeat number is lower in the regression including all microsatellites vs. the regressions including microsatellites with individual motif sizes (e.g., 0.03 vs. 0.35). This is at least partially explained by the fact that neither motif size nor length was taken into account in the latter regressions. Since repeat number, motif size, and length are correlated, in regressions lacking the last two variables, repeat number “absorbs” their contributions. The sum of RCVEs for repeat number, length, and motif size in the regression including all microsatellites (e.g., 0.03 + 0.07 + 0.04 = 0.14) is lower (although similar in order of magnitude) to the RCVE for repeat number in the fits for individual motif sizes (e.g., 0.35) because in the former regression, the RCVE of each predictor is “suppressed” by the presence of the other correlated predictors.
Genomic features and microsatellite mutability
To address the possibility that mutability of microsatellites might be affected by their genomic environment, we broke the human genome into 538 5-Mb windows and, within windows, binned microsatellites by repeat number and motif size. This created 10,204 microsatellite groups, each associated with a repeat number, motif size, and 5-Mb window. Only groups consisting of at least 30 microsatellites were considered to ensure accuracy in the mutability estimates; this limits our analysis to microsatellites with low repeat numbers, which are the most numerous, and excludes microsatellites located on chromosome Y. We call these groups “local” (anchored to a particular genomic location) to distinguish them from the “genome-wide” groups considered in the previous sections. Substantial variation was observed among local groups; mutability divided by repeat number varied ∼10-fold for mono- and dinucleotides and approximately fourfold for tri- and tetranucleotides (Fig. S7).
Repeating the regression analysis described above for the mutability of local groups (Table 1, upper right) largely confirms our findings based on genome-wide groups (Table 1, upper left). The lower R2 values in regressions for local groups in comparison to those for genome-wide groups for each of mono-, di-, tri-, and tetranucleotides can be explained by the greater variability in mutability among the former (individual local groups contain much fewer microsatellites, so mutability estimates contain more “noise”). Additionally, the regressions for local microsatellite groups are restricted to the steeper part of the mutability function, and this can also contribute to some differences (both in RCVEs and in R2 values) between regressions for genome-wide vs. local groups.
Unexpectedly, expanding the regression fitted on all local groups, and on local groups of mono-, di-, and tri- and tetranucleotides separately, to include several genomic features calculated in 5-Mb windows (Table S4) results in very modest increases in explained variability, although some such features (GC content, substitution rate, recombination rate, and Alu and L1 densities) are found to be significant (albeit weak) predictors (Table 1, lower right). The 5-Mb scale might not be fine enough to investigate the effects of genomic features that vary on smaller scales (e.g., substitution and recombination rates) (Gaffney and Keightley 2005; Spencer et al. 2006); currently, smaller scales cannot be considered as the paucity of microsatellites per window would lead to unreliable mutability estimates.
In a separate analysis, we had a sufficient number of (A)n microsatellites per window to analyze their 1-Mb local groups. Here, adding genomic features to the regression increases the variability explained by 5.1% (Table 1, last column). In particular, besides repeat number and chromosome type, recombination rate and Alu content are found to be significant positive predictors. These results, and the fact that recombination is a weak but significant predictor in most regressions fitted for 5-Mb local groups, suggest some role for recombination in generating microsatellite mutations. Such a role might be underestimated in the present study because we correlate human–chimpanzee microsatellite mutability with human recombination rates, which are known to differ from chimpanzee recombination rates at least at some scales (Ptak et al. 2005). The role of substitutions might also be underestimated here because interrupted and neighboring microsatellites, expected to be most affected by substitutions, are excluded from our analysis. Our preliminary screens of 5-Mb windows support a positive correlation between substitution rates and frequency of microsatellite orthologs with interruption in one species (data not shown).
Conclusions
Parsing the contributions of multiple features to microsatellite mutability enables us to speculate about the mechanisms underlying microsatellite mutations. We show that repeat number, motif size, and length determine most of the interlocus variation in microsatellite mutability. This observation, in conjunction with the differences in mutability between sex chromosomes and autosomes (observed especially for mononucleoitides), supports replication slippage as the predominant mechanism of mutagenesis. Also, we hypothesize that nonuniformity of the mutability function across microsatellite lengths may be due to exonucleolytic proofreading and MMR differing in efficiency depending on length (Kroutil et al. 1996; Sia et al. 1997). Moreover, we show that genome-wide and for all motif sizes, microsatellites with different motif composition have distinct patterns of mutability, potentially as a result of dissimilarities in stability of slipped DNA structures and recognition by repair systems. Thus, the outcome of mutation processes at uninterrupted microsatellites might depend on an interplay between slippage and repair. Our results suggest that the role of recombination in microsatellite mutations is secondary.
The lack of evidence for a substantial effect of local genomic features on microsatellite mutability will have to be re-evaluated at smaller scales, when such analysis becomes feasible, i.e., when multiple primate genomes are sequenced. This should be complemented by the incorporation of additional genomic features (e.g., methylation profiles and locations of replication origins) contingent on the availability of their genome-wide maps. Furthermore, using an outgroup to separate microsatellite expansions and contractions might clarify whether dissimilarities in their rates at different repeat numbers contribute to shaping the mutability functions observed here. Orangutan, whose genomic sequences are currently being generated, might represent a more suitable outgroup than macaque for this analysis because the lower divergence between human (or chimpanzee) and orangutan guarantees smaller errors in estimating ancestral states at microsatellites.
The present study excluded interrupted microsatellites, known to mutate at lower rates than uninterrupted microsatellites with similar repeat numbers (Almeida and Penha-Goncalves 2004). Future investigations should consider interrupted microsatellites to represent evolutionary events more realistically by accounting for the effect of nucleotide substitutions. Of additional interest for further research is the influence of genomic and contextual features on the dynamics of microsatellite birth (Buschiazzo and Gemmell 2006).
Our regression models, which explain very large shares of the variation in mutability (∼90%) can have useful applications. First, they can assist in predicting which disease-causing microsatellites are likely to have high rates of de novo mutations. Second, they can guide the choice of microsatellites most suitable for forensic applications. Third, since levels of polymorphism are proportional to mutation rate under neutrality, they can aid in identifying polymorphic microsatellites for population and conservation genetic analyses, assuming most of the trends captured here are conserved among species.
Methods
Orthologous microsatellite loci
Uninterrupted microsatellites were identified in the human (hg18) and chimpanzee (panTro2) genomes separately, using Sputnik (C. Abajian, http://espressosoftware.com/pages/sputnik.jsp) with a minimum score of 4, a mismatch penalty of −1000, and enabling detection of mononucleotides. BLASTZ alignments available at the UCSC Genome Browser (www.genome.ucsc.edu) were used to identify orthologous microsatellites.
To test whether the parameters (minimum score of 4 and mismatch penalty of −1000) and the chosen algorithm (Sputnik) influence our results, we also identified orthologous human–chimpanzee microsatellites on chromosome X using Sputnik with a minimum score of 7 and a mismatch penalty of −6 and using Tandem Repeat Finder (Benson 1999) with alignment weights of 2, 7, and 7 and a minimum threshold score of 20, as suggested by Leclercq et al. (2007). Next, we applied the same filtering steps (see above), binned microsatellites by repeat number, and calculated mutability per bin (Fig. S8). The mutability functions look similar (Fig. S8), with some evidence that our method performs better in identifying short microsatellites. Importantly, all three approaches produce the “shift” in slopes observed for the mutability function.
Mutability
Microsatellites were binned into groups by repeat number, motif size, and also other features, where required. If each such group contained at least 30 microsatellites, its mutability was estimated as by Webster et al. (2002):
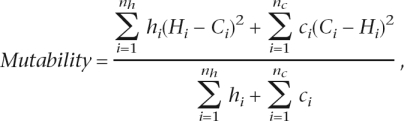 |
where Hi is the human repeat number for each of nh orthologous microsatellite pairs sorted according to repeat number in human, Ci is the chimpanzee repeat number of each of nc pairs of orthologs sorted according to repeat number in chimpanzee, and hi and ci are correction parameters equal to 1 or 2. The mutability was calculated per locus per generation assuming 20-yr generation time and 5 Myr human–chimpanzee divergence time, similar to the method of Webster et al. (2002).
The numerator in the mutability formula has two summation terms because it is unknown whether mutation occurred in human or chimpanzee lineage. To calculate the first term, we assigned the ancestral state to human and considered any human–chimpanzee difference in repeat number at each pair of orthologs as a mutation in chimpanzee. To calculate the second term, we assigned the ancestral state to chimpanzee and considered any difference in repeat number as a mutation in human. For the first term, binning is based on repeat numbers in human microsatellites, while for the second term, it is based on repeat numbers in chimpanzee microsatellites. Note that, as the difference in repeat numbers is squared, microsatellite expansions and contractions contribute equally to the calculated mutability.
Following the method of Webster et al. (2002), the correction parameters (hi and ci) were used to account for microsatellite contraction mutations below a threshold (nine repeats for mononucleotide microsatellites and four repeats for other microsatellites). If at locus i the human repeat number Hi is considered ancestral, the corresponding repeat number in the chimpanzee ortholog is Ci > Hi and if (Hi − (Ci − Hi)) is below the threshold, the mutation is counted twice, i.e., hi = 2, to account for a possible contraction mutation of the same magnitude (but leading to a microsatellite below threshold) at a different locus in chimpanzee. Otherwise, hi = 1. For instance, if a human mononucleotide microsatellite has 10 repeats and its chimpanzee ortholog has 12 repeats, then (H − (C − H)) = 8, which is below the threshold of nine repeats. To account for a possible missed contraction mutation in chimpanzee from 10 to eight repeats (a mutation of a similar magnitude but occurring in the opposite direction), such a mutation is counted twice, i.e., hi = 2. Otherwise, hi = 1. A similar correction was applied when the chimpanzee genome was considered ancestral. We assumed rates of microsatellite expansions and contractions at each repeat number to be equal.
Here we required at least 30 microsatellites in a group to calculate its mutability. A minimal number of 40 microsatellites in a group was also considered, leading to similar results, while a minimal number of 20 led to very broad variability in mutability estimates (data not shown).
Genome-wide analyses
Each motif was analyzed together with its reverse complement. Microsatellites located in the pseudoautosomal regions (based on human genome annotations) were excluded. The male-to-female mutation rate ratio (α) was calculated as by Miyata et al. (1987) for each repeat number separately. The median α values across all repeat numbers were then computed for Y/A, X/A, and Y/X. A resampling procedure (see below) was used to estimate the 95% confidence intervals for α. The Alu and LINE sets and the intronic and intergenic sets of microsatellites were created in Galaxy (www.g2.bx.psu.edu) based on human annotations in the UCSC Genome Browser. Microsatellites were assigned to isochores based on (Costantini et al. 2006).
Resampling procedure
Human–chimpanzee autosomal alignments were broken into 2876 1-Mb windows according to human coordinates. Next, 1000 “bootstrapped” versions of these alignments were created by randomly sampling windows with replacement (entire 1-Mb windows, and not the alignment columns within them, were shuffled so microsatellites stayed intact). For each of the 1000 “bootstrapped” alignments, mutability was calculated for each group of microsatellites, resulting in an empirical distribution of mutability for every point shown in figures. The 2.5th and 97.5th percentiles of these empirical bootstrap distributions were plotted. For Figures 3B and S6, we additionally generated 1000 “bootstrapped” alignments for each of the two sex chromosomes.
Regression and window-based analyses
Regressions were carried out within the R statistical package (www.r-project.org). The relevant set of predictors was identified with the best subsets procedure (lowest Mallow’s Cp) (Kutner et al. 2005). Variance inflation factors (VIFs) (Kutner et al. 2005) calculated for each predictor were below 10 (data not shown), thus, the regressions were not adversely affected by multicollinearity. To account for the curvature in log mutability observed in Figure 1A, in addition to repeat number, its square root was included to the terms used in the best subsets selection procedure. The models selected by the best subset procedure were pruned by removing terms that were non-significant after Bonferroni correction for multiple testing. Data points with absolute values of standardized residuals greater than 3 and with high Cook’s distance were removed as outliers (Kutner et al. 2005). Plots of residuals vs. fits and normal probability plots of the residuals were inspected for all regressions.
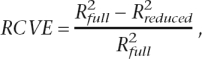
For each regression, we calculated the RCVE attributable to each predictor as
 |
where  and
and  are the R2 (share of explained variability) for the full model and the model after dropping the predictor of interest. The numerators of the RCVEs do not add up to (and the RCVEs do not add up to one) whenever there are correlated predictors, as their contributions can overlap. The RCVE is used here in place of the more commonly used partial R2. Since the RCVE’s denominator is the same for all predictors in the same model, we find this measure more intuitive.
Genomic features (Table S4) were calculated in 5-Mb and 1-Mb windows based on human annotations from the UCSC Genome Browser using Galaxy. The LD-based recombination rates were from Myers et al. (2005). Human–macaque (hg18-rhMac2) substitution rates, used instead of human–chimpanzee ones to avoid effects of ancestral polymorphisms (Li et al. 2002), were calculated from alignments of interspersed repeats inserted in the human–macaque common ancestor employing the REV substitution model implemented in PAML (Yang 1997). Genomic features were added to the regressions derived with the approach described above. For the window-based analysis, we excluded windows due to low sequence or ancestral repeat coverage (windows with >50% of their length in Ns or with <30% of their length in ancestral repeats) or due to lack of recombination data (with >3 Mb and with >0.6 Mb without any genetic markers for 5-Mb and 1-Mb windows, respectively).
Acknowledgments
We thank Kristin Eckert, Maria Krasilnikova, Eric Rivals, Melissa Wilson, and three anonymous reviewers for their suggestions on the manuscript; Erika Kvikstad for providing Perl scripts; and Adil Sarwar for his assistance at the early stages of this project. This study was funded in part by NIH grants RO1-GM072264 to K.D.M. and R01-HG002238 to Webb Miller.
Footnotes
[Supplemental material is available online at www.genome.org.]
Article published online before print. Article and publication date are at http://www.genome.org/cgi/doi/10.1101/gr.7113408
Appendix
Dependence of mutability on proportion of orthologs that underwent mutations (orthologs with different repeat number)
The mutability formula can be rewritten as
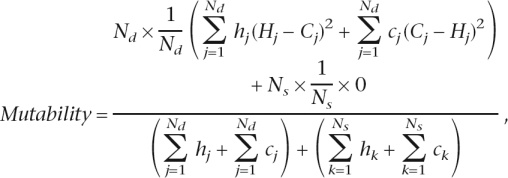 |
where Nd is the number of orthologs with different repeat number and Ns is the number of orthologs with the same repeat number, and the other symbols are as explained in the mutability formula in the Methods section. Orthologs with the same repeat number do not contribute to the numerator in this equation because the difference in repeat number for each of them ((Hj – Cj) and (Cj – Hj)) is equal to 0, i.e., Ns × (1/Ns) × 0 = 0. Thus, mutability is the product of two factors: the fraction of orthologs with different repeat number (Nd divided by the denominator, with the latter taking correction parameters into account; factor A), and the average squared difference in repeat number between these orthologs (factor B).
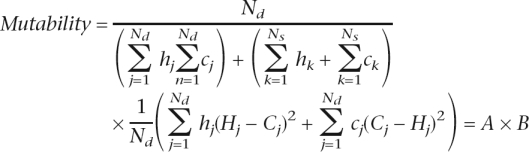 |
Factor A grows quickly with length until ∼15–20 bp, then decelerates and reaches a plateau shortly after, when the majority of orthologs differ in repeat number (Fig. S1A). In contrast, factor B steadily increases throughout the length range (Fig. S1B). Input of both factors (and dominance of factor A) might lead to a steeper slope under ∼20 bp, while input of solely factor B might explain a more moderate slope over ∼20 bp.
References
- Almeida P., Penha-Goncalves C., Penha-Goncalves C. Long perfect dinucleotide repeats are typical of vertebrates, show motif preferences and size convergence. Mol. Biol. Evol. 2004;21:1226–1233. doi: 10.1093/molbev/msh108. [DOI] [PubMed] [Google Scholar]
- Bachtrog D., Agis M., Imhof M., Schlotterer C., Agis M., Imhof M., Schlotterer C., Imhof M., Schlotterer C., Schlotterer C. Microsatellite variability differs between dinucleotide repeat motifs-evidence from Drosophila melanogaster. Mol. Biol. Evol. 2000;17:1277–1285. doi: 10.1093/oxfordjournals.molbev.a026411. [DOI] [PubMed] [Google Scholar]
- Baldi P., Baisnee P.F., Baisnee P.F. Sequence analysis by additive scales: DNA structure for sequences and repeats of all lengths. Bioinformatics. 2000;16:865–889. doi: 10.1093/bioinformatics/16.10.865. [DOI] [PubMed] [Google Scholar]
- Batzer M.A., Deininger P.L., Deininger P.L. Alu repeats and human genomic diversity. Nat. Rev. Genet. 2002;3:370–379. doi: 10.1038/nrg798. [DOI] [PubMed] [Google Scholar]
- Benson G. Tandem repeats finder: A program to analyze DNA sequences. Nucleic Acids Res. 1999;27:573–580. doi: 10.1093/nar/27.2.573. [DOI] [PMC free article] [PubMed] [Google Scholar]
- Boyer J.C., Yamada N.A., Roques C.N., Hatch S.B., Riess K., Farber R.A., Yamada N.A., Roques C.N., Hatch S.B., Riess K., Farber R.A., Roques C.N., Hatch S.B., Riess K., Farber R.A., Hatch S.B., Riess K., Farber R.A., Riess K., Farber R.A., Farber R.A. Sequence dependent instability of mononucleotide microsatellites in cultured mismatch repair proficient and deficient mammalian cells. Hum. Mol. Genet. 2002;11:707–713. doi: 10.1093/hmg/11.6.707. [DOI] [PubMed] [Google Scholar]
- Brinkmann B., Klintschar M., Neuhuber F., Huhne J., Rolf B., Klintschar M., Neuhuber F., Huhne J., Rolf B., Neuhuber F., Huhne J., Rolf B., Huhne J., Rolf B., Rolf B. Mutation rate in human microsatellites: Influence of the structure and length of the tandem repeat. Am. J. Hum. Genet. 1998;62:1408–1415. doi: 10.1086/301869. [DOI] [PMC free article] [PubMed] [Google Scholar]
- Buschiazzo E., Gemmell N.J., Gemmell N.J. The rise, fall and renaissance of microsatellites in eukaryotic genomes. Bioessays. 2006;28:1040–1050. doi: 10.1002/bies.20470. [DOI] [PubMed] [Google Scholar]
- Casasnovas J.M., Huertas D., Ortiz-Lombardia M., Kypr J., Azorin F., Huertas D., Ortiz-Lombardia M., Kypr J., Azorin F., Ortiz-Lombardia M., Kypr J., Azorin F., Kypr J., Azorin F., Azorin F. Structural polymorphism of d(GA.TC)n DNA sequences. Intramolecular and intermolecular associations of the individual strands. J. Mol. Biol. 1993;233:671–681. doi: 10.1006/jmbi.1993.1544. [DOI] [PubMed] [Google Scholar]
- Chakraborty R., Kimmel M., Stivers D.N., Davison L.J., Deka R., Kimmel M., Stivers D.N., Davison L.J., Deka R., Stivers D.N., Davison L.J., Deka R., Davison L.J., Deka R., Deka R. Relative mutation rates at di-, tri-, and tetranucleotide microsatellite loci. Proc. Natl. Acad. Sci. 1997;94:1041–1046. doi: 10.1073/pnas.94.3.1041. [DOI] [PMC free article] [PubMed] [Google Scholar]
- Clark R.M., Dalgliesh G.L., Endres D., Gomez M., Taylor J., Bidichandani S.I., Dalgliesh G.L., Endres D., Gomez M., Taylor J., Bidichandani S.I., Endres D., Gomez M., Taylor J., Bidichandani S.I., Gomez M., Taylor J., Bidichandani S.I., Taylor J., Bidichandani S.I., Bidichandani S.I. Expansion of GAA triplet repeats in the human genome: Unique origin of the FRDA mutation at the center of an Alu. Genomics. 2004;83:373–383. doi: 10.1016/j.ygeno.2003.09.001. [DOI] [PubMed] [Google Scholar]
- Costantini M., Clay O., Auletta F., Bernardi G., Clay O., Auletta F., Bernardi G., Auletta F., Bernardi G., Bernardi G. An isochore map of human chromosomes. Genome Res. 2006;16:536–541. doi: 10.1101/gr.4910606. [DOI] [PMC free article] [PubMed] [Google Scholar]
- Eckert K.A., Mowery A., Hile S.E., Mowery A., Hile S.E., Hile S.E. Misalignment-mediated DNA polymerase β mutations: Comparison of microsatellite and frame-shift error rates using a forward mutation assay. Biochemistry. 2002a;41:10490–10498. doi: 10.1021/bi025918c. [DOI] [PubMed] [Google Scholar]
- Eckert K.A., Yan G., Hile S.E., Yan G., Hile S.E., Hile S.E. Mutation rate and specificity analysis of tetranucleotide microsatellite DNA alleles in somatic human cells. Mol. Carcinog. 2002b;34:140–150. doi: 10.1002/mc.10058. [DOI] [PubMed] [Google Scholar]
- Ellegren H. Heterogeneous mutation processes in human microsatellite DNA sequences. Nat. Genet. 2000;24:400–402. doi: 10.1038/74249. [DOI] [PubMed] [Google Scholar]
- Ellegren H. Microsatellites: Simple sequences with complex evolution. Nat. Rev. Genet. 2004;5:435–445. doi: 10.1038/nrg1348. [DOI] [PubMed] [Google Scholar]
- Gaffney D.J., Keightley P.D., Keightley P.D. The scale of mutational variation in the murid genome. Genome Res. 2005;15:1086–1094. doi: 10.1101/gr.3895005. [DOI] [PMC free article] [PubMed] [Google Scholar]
- Harfe B.D., Jinks-Robertson S., Jinks-Robertson S. DNA mismatch repair and genetic instability. Annu. Rev. Genet. 2000;34:359–399. doi: 10.1146/annurev.genet.34.1.359. [DOI] [PubMed] [Google Scholar]
- Hile S.E., Yan G., Eckert K.A., Yan G., Eckert K.A., Eckert K.A. Somatic mutation rates and specificities at TC/AG and GT/CA microsatellite sequences in nontumorigenic human lymphoblastoid cells. Cancer Res. 2000;60:1698–1703. [PubMed] [Google Scholar]
- Huttley G.A., Jakobsen I.B., Wilson S.R., Easteal S., Jakobsen I.B., Wilson S.R., Easteal S., Wilson S.R., Easteal S., Easteal S. How important is DNA replication for mutagenesis? Mol. Biol. Evol. 2000;17:929–937. doi: 10.1093/oxfordjournals.molbev.a026373. [DOI] [PubMed] [Google Scholar]
- Jurka J. Sequence patterns indicate an enzymatic involvement in integration of mammalian retroposons. Proc. Natl. Acad. Sci. 1997;94:1872–1877. doi: 10.1073/pnas.94.5.1872. [DOI] [PMC free article] [PubMed] [Google Scholar]
- Kapranov P., Willingham A.T., Gingeras T.R., Willingham A.T., Gingeras T.R., Gingeras T.R. Genome-wide transcription and the implications for genomic organization. Nat. Rev. Genet. 2007;8:413–423. doi: 10.1038/nrg2083. [DOI] [PubMed] [Google Scholar]
- Karthikeyan G., Chary K.V., Rao B.J., Chary K.V., Rao B.J., Rao B.J. Fold-back structures at the distal end influence DNA slippage at the proximal end during mononucleotide repeat expansions. Nucleic Acids Res. 1999;27:3851–3858. doi: 10.1093/nar/27.19.3851. [DOI] [PMC free article] [PubMed] [Google Scholar]
- Krasilnikova M.M., Samadashwily G.M., Krasilnikov A.S., Mirkin S.M., Samadashwily G.M., Krasilnikov A.S., Mirkin S.M., Krasilnikov A.S., Mirkin S.M., Mirkin S.M. Transcription through a simple DNA repeat blocks replication elongation. EMBO J. 1998;17:5095–5102. doi: 10.1093/emboj/17.17.5095. [DOI] [PMC free article] [PubMed] [Google Scholar]
- Kroutil L.C., Register K., Bebenek K., Kunkel T.A., Register K., Bebenek K., Kunkel T.A., Bebenek K., Kunkel T.A., Kunkel T.A. Exonucleolytic proofreading during replication of repetitive DNA. Biochemistry. 1996;35:1046–1053. doi: 10.1021/bi952178h. [DOI] [PubMed] [Google Scholar]
- Kutner M.H., Nachtsheim C.J., Neter J., Li W., Nachtsheim C.J., Neter J., Li W., Neter J., Li W., Li W. Applied linear statistical models. McGraw-Hill; New York: 2005. [Google Scholar]
- Lai Y., Sun F., Sun F. The relationship between microsatellite slippage mutation rate and the number of repeat units. Mol. Biol. Evol. 2003;20:2123–2131. doi: 10.1093/molbev/msg228. [DOI] [PubMed] [Google Scholar]
- Leclercq S., Rivals E., Jarne P., Rivals E., Jarne P., Jarne P. Detecting microsatellites within genomes: significant variation among algorithms. BMC Bioinformatics. 2007;8:125. doi: 10.1186/1471-2105-8-125. [DOI] [PMC free article] [PubMed] [Google Scholar]
- Li W.H., Yi S., Makova K., Yi S., Makova K., Makova K. Male-driven evolution. Curr. Opin. Genet. Dev. 2002;12:650–656. doi: 10.1016/s0959-437x(02)00354-4. [DOI] [PubMed] [Google Scholar]
- Miyata T., Hayashida H., Kuma K., Mitsuyasu K., Yasunaga T., Hayashida H., Kuma K., Mitsuyasu K., Yasunaga T., Kuma K., Mitsuyasu K., Yasunaga T., Mitsuyasu K., Yasunaga T., Yasunaga T. Male-driven molecular evolution: A model and nucleotide sequence analysis. Cold Spring Harb. Symp. Quant. Biol. 1987;52:863–867. doi: 10.1101/sqb.1987.052.01.094. [DOI] [PubMed] [Google Scholar]
- Mochmann L.H., Wells R.D., Wells R.D. Transcription influences the types of deletion and expansion products in an orientation-dependent manner from GAC*GTC repeats. Nucleic Acids Res. 2004;32:4469–4479. doi: 10.1093/nar/gkh787. [DOI] [PMC free article] [PubMed] [Google Scholar]
- Myers S., Bottolo L., Freeman C., McVean G., Donnelly P., Bottolo L., Freeman C., McVean G., Donnelly P., Freeman C., McVean G., Donnelly P., McVean G., Donnelly P., Donnelly P. A fine-scale map of recombination rates and hotspots across the human genome. Science. 2005;310:321–324. doi: 10.1126/science.1117196. [DOI] [PubMed] [Google Scholar]
- Oda S., Maehara Y., Ikeda Y., Oki E., Egashira A., Okamura Y., Takahashi I., Kakeji Y., Sumiyoshi Y., Miyashita K., Maehara Y., Ikeda Y., Oki E., Egashira A., Okamura Y., Takahashi I., Kakeji Y., Sumiyoshi Y., Miyashita K., Ikeda Y., Oki E., Egashira A., Okamura Y., Takahashi I., Kakeji Y., Sumiyoshi Y., Miyashita K., Oki E., Egashira A., Okamura Y., Takahashi I., Kakeji Y., Sumiyoshi Y., Miyashita K., Egashira A., Okamura Y., Takahashi I., Kakeji Y., Sumiyoshi Y., Miyashita K., Okamura Y., Takahashi I., Kakeji Y., Sumiyoshi Y., Miyashita K., Takahashi I., Kakeji Y., Sumiyoshi Y., Miyashita K., Kakeji Y., Sumiyoshi Y., Miyashita K., Sumiyoshi Y., Miyashita K., Miyashita K., et al. Two modes of microsatellite instability in human cancer: Differential connection of defective DNA mismatch repair to dinucleotide repeat instability. Nucleic Acids Res. 2005;33:1628–1636. doi: 10.1093/nar/gki303. [DOI] [PMC free article] [PubMed] [Google Scholar]
- Pearson C.E., Nichol Edamura K., Cleary J.D., Nichol Edamura K., Cleary J.D., Cleary J.D. Repeat instability: Mechanisms of dynamic mutations. Nat. Rev. Genet. 2005;6:729–742. doi: 10.1038/nrg1689. [DOI] [PubMed] [Google Scholar]
- Ptak S.E., Hinds D.A., Koehler K., Nickel B., Patil N., Ballinger D.G., Przeworski M., Frazer K.A., Paabo S., Hinds D.A., Koehler K., Nickel B., Patil N., Ballinger D.G., Przeworski M., Frazer K.A., Paabo S., Koehler K., Nickel B., Patil N., Ballinger D.G., Przeworski M., Frazer K.A., Paabo S., Nickel B., Patil N., Ballinger D.G., Przeworski M., Frazer K.A., Paabo S., Patil N., Ballinger D.G., Przeworski M., Frazer K.A., Paabo S., Ballinger D.G., Przeworski M., Frazer K.A., Paabo S., Przeworski M., Frazer K.A., Paabo S., Frazer K.A., Paabo S., Paabo S. Fine-scale recombination patterns differ between chimpanzees and humans. Nat. Genet. 2005;37:429–434. doi: 10.1038/ng1529. [DOI] [PubMed] [Google Scholar]
- Rolfsmeier M.L., Lahue R.S., Lahue R.S. Stabilizing effects of interruptions on trinucleotide repeat expansions in Saccharomyces cerevisiae. Mol. Cell. Biol. 2000;20:173–180. doi: 10.1128/mcb.20.1.173-180.2000. [DOI] [PMC free article] [PubMed] [Google Scholar]
- Roy A.M., Carroll M.L., Nguyen S.V., Salem A.H., Oldridge M., Wilkie A.O., Batzer M.A., Deininger P.L., Carroll M.L., Nguyen S.V., Salem A.H., Oldridge M., Wilkie A.O., Batzer M.A., Deininger P.L., Nguyen S.V., Salem A.H., Oldridge M., Wilkie A.O., Batzer M.A., Deininger P.L., Salem A.H., Oldridge M., Wilkie A.O., Batzer M.A., Deininger P.L., Oldridge M., Wilkie A.O., Batzer M.A., Deininger P.L., Wilkie A.O., Batzer M.A., Deininger P.L., Batzer M.A., Deininger P.L., Deininger P.L. Potential gene conversion and source genes for recently integrated Alu elements. Genome Res. 2000;10:1485–1495. doi: 10.1101/gr.152300. [DOI] [PubMed] [Google Scholar]
- Roy-Engel A.M., Salem A.H., Oyeniran O.O., Deininger L., Hedges D.J., Kilroy G.E., Batzer M.A., Deininger P.L., Salem A.H., Oyeniran O.O., Deininger L., Hedges D.J., Kilroy G.E., Batzer M.A., Deininger P.L., Oyeniran O.O., Deininger L., Hedges D.J., Kilroy G.E., Batzer M.A., Deininger P.L., Deininger L., Hedges D.J., Kilroy G.E., Batzer M.A., Deininger P.L., Hedges D.J., Kilroy G.E., Batzer M.A., Deininger P.L., Kilroy G.E., Batzer M.A., Deininger P.L., Batzer M.A., Deininger P.L., Deininger P.L. Active Alu element “A-tails”: Size does matter. Genome Res. 2002;12:1333–1344. doi: 10.1101/gr.384802. [DOI] [PMC free article] [PubMed] [Google Scholar]
- Sagher D., Hsu A., Strauss B., Hsu A., Strauss B., Strauss B. Stabilization of the intermediate in frameshift mutation. Mutat. Res. 1999;423:73–77. doi: 10.1016/s0027-5107(98)00227-9. [DOI] [PubMed] [Google Scholar]
- Schlotterer C., Tautz D., Tautz D. Slippage synthesis of simple sequence DNA. Nucleic Acids Res. 1992;20:211–215. doi: 10.1093/nar/20.2.211. [DOI] [PMC free article] [PubMed] [Google Scholar]
- Sia E.A., Kokoska R.J., Dominska M., Greenwell P., Petes T.D., Kokoska R.J., Dominska M., Greenwell P., Petes T.D., Dominska M., Greenwell P., Petes T.D., Greenwell P., Petes T.D., Petes T.D. Microsatellite instability in yeast: dependence on repeat unit size and DNA mismatch repair genes. Mol. Cell. Biol. 1997;17:2851–2858. doi: 10.1128/mcb.17.5.2851. [DOI] [PMC free article] [PubMed] [Google Scholar]
- Sinden R.R. DNA structure and function. Academic Press; San Diego: 1994. [Google Scholar]
- Spencer C.C., Deloukas P., Hunt S., Mullikin J., Myers S., Silverman B., Donnelly P., Bentley D., McVean G., Deloukas P., Hunt S., Mullikin J., Myers S., Silverman B., Donnelly P., Bentley D., McVean G., Hunt S., Mullikin J., Myers S., Silverman B., Donnelly P., Bentley D., McVean G., Mullikin J., Myers S., Silverman B., Donnelly P., Bentley D., McVean G., Myers S., Silverman B., Donnelly P., Bentley D., McVean G., Silverman B., Donnelly P., Bentley D., McVean G., Donnelly P., Bentley D., McVean G., Bentley D., McVean G., McVean G. The influence of recombination on human genetic diversity. PLoS Genet. 2006;2:e148. doi: 10.1371/journal.pgen.0020148. [DOI] [PMC free article] [PubMed] [Google Scholar]
- Vowles E.J., Amos W., Amos W. Quantifying ascertainment bias and species-specific length differences in human and chimpanzee microsatellites using genome sequences. Mol. Biol. Evol. 2006;23:598–607. doi: 10.1093/molbev/msj065. [DOI] [PubMed] [Google Scholar]
- Webster M.T., Smith N.G., Ellegren H., Smith N.G., Ellegren H., Ellegren H. Microsatellite evolution inferred from human-chimpanzee genomic sequence alignments. Proc. Natl. Acad. Sci. 2002;99:8748–8753. doi: 10.1073/pnas.122067599. [DOI] [PMC free article] [PubMed] [Google Scholar]
- Webster M.T., Smith N.G., Hultin-Rosenberg L., Arndt P.F., Ellegren H., Smith N.G., Hultin-Rosenberg L., Arndt P.F., Ellegren H., Hultin-Rosenberg L., Arndt P.F., Ellegren H., Arndt P.F., Ellegren H., Ellegren H. Male-driven biased gene conversion governs the evolution of base composition in human alu repeats. Mol. Biol. Evol. 2005;22:1468–1474. doi: 10.1093/molbev/msi136. [DOI] [PubMed] [Google Scholar]
- Xu X., Peng M., Fang Z., Peng M., Fang Z., Fang Z. The direction of microsatellite mutations is dependent upon allele length. Nat. Genet. 2000;24:396–399. doi: 10.1038/74238. [DOI] [PubMed] [Google Scholar]
- Yang Z. PAML: A program package for phylogenetic analysis by maximum likelihood. Comput. Appl. Biosci. 1997;13:555–556. doi: 10.1093/bioinformatics/13.5.555. [DOI] [PubMed] [Google Scholar]