

Abstract
We have discovered several novel features exhibited by microtubules (MTs) in migrating newt lung epithelial cells by time-lapse imaging of fluorescently labeled, microinjected tubulin. These cells exhibit leading edge ruffling and retrograde flow in the lamella and lamellipodia. The plus ends of lamella MTs persist in growth perpendicular to the leading edge until they reach the base of the lamellipodium, where they oscillate between short phases of growth and shortening. Occasionally “pioneering” MTs grow into the lamellipodium, where microtubule bending and reorientation parallel to the leading edge is associated with retrograde flow. MTs parallel to the leading edge exhibit significantly different dynamics from MTs perpendicular to the cell edge. Both parallel MTs and photoactivated fluorescent marks on perpendicular MTs move rearward at the 0.4 μm/min rate of retrograde flow in the lamella. MT rearward transport persists when MT dynamic instability is inhibited by 100-nM nocodazole but is blocked by inhibition of actomyosin by cytochalasin D or 2,3-butanedione–2-monoxime. Rearward flow appears to cause MT buckling and breaking in the lamella. 80% of free minus ends produced by breakage are stable; the others shorten and pause, leading to MT treadmilling. Free minus ends of unknown origin also depolymerize into the field of view at the lamella. Analysis of MT dynamics at the centrosome shows that these minus ends do not arise by centrosomal ejection and that ∼80% of the MTs in the lamella are not centrosome bound. We propose that actomyosin-based retrograde flow of MTs causes MT breakage, forming quasi-stable noncentrosomal MTs whose turnover is regulated primarily at their minus ends.
The now classic conception that the cytoplasmic microtubule (MT)1 complex (CMTC) in interphase tissue culture cells is organized by a peri-nuclear MT organizing center, the centrosome, from which MTs emanate out towards the cell periphery, was originally gleaned from electron microscopic analysis (Porter, 1966) and immunofluorescent localization of tubulin (Brinkley et al., 1975, 1981). MTs have intrinsic polarity, and in cells the so-called “minus” ends of the MTs face towards the centrosome, while the “plus” ends face away from it (Euteneuer and McIntosh, 1981). Studies that have followed the incorporation and turnover of microinjected, labeled tubulin in cytoplasmic MTs in a variety of non-neuronal cells have revealed that the interphase CMTC is quite dynamic, with tubulin subunits in MTs exhibiting half lives on the order of several to ten minutes (Saxton et al., 1984; Soltys and Borisy, 1985; Sammak et al., 1987; Sammak and Borisy, 1988b ; Pepperkok et al., 1990; Rodionov and Borisy, 1994). MTs in solution and MTs nucleated from isolated centrosomes in vitro undergo an unusual type of assembly/disassembly behavior known as dynamic instability, in which MTs coexist in growing and shrinking populations that inter-convert infrequently and stochastically (Mitchison and Kirschner, 1984b ). The parameters of MT dynamic instability, defined as growth, shortening, the transition from growth to shortening (catastrophe), and the transition from shortening to growth (rescue; Walker et al., 1988) have been determined for individual MT plus ends in the thin peripheral regions of living interphase cells of several types (Cassimeris et al., 1988; Sammak and Borisy, 1988a ,b; Shulze and Kirschner, 1988; Shelden and Wadsworth, 1993). These studies have led to the prevailing view that MT turnover in interphase cells is due to dynamic instability at the plus ends of MTs, while the minus MT ends are centrosome bound and quiescent (for review see Wade and Hyman, 1997).
After the discovery of MT dynamic instability, Kirschner and Mitchison (1986) proposed that selective regulation of specific parameters of dynamic instability at the plus ends of individual MTs in cells could allow for remodeling of the CMTC during transitions from interphase to mitosis, during cell shape change, and during cell migration. We have chosen to examine the individual dynamics, arrangement, and turnover of MTs at various sites in the cell during migration to test these predictions.
Migrating cells are morphologically polarized, with a broad, flat lamella that contains MTs and membranous organelles. The lamella terminates in a ruffling lamellipodia at the leading edge that faces the direction of migration and from which MTs are generally absent (see Fig. 1 D; for review see Heath and Holifield, 1991). Ruffling and protrusion of the leading edge is dependent on directed filamentous actin (F-actin) assembly nucleated at or near the inner plasma membrane surface along the leading edge (Wang et al., 1985; Forscher and Smith, 1988; Okabe and Hirokawa, 1989, 1991; Symons and Mitchison, 1991). After nucleation, F-actin within the lamellipodia is transported rearward (Wang et al., 1985; Forscher and Smith, 1988; Theriot and Mitchison, 1991, 1992; Lin and Forscher, 1995). Although controversial, the movement of F-actin within the lamellipodium is thought to be coupled to protrusive movement of the leading edge and to also drive the rearward movement of cell surface-bound beads and/or membrane receptors towards the cell center (Forscher and Smith, 1988; Lin and Forscher, 1995; for reviews see Mitchison and Cramer, 1996, and Lin et al., 1994). In neuronal growth cones, the rearward movement of F-actin and surface markers has been demonstrated to be myosin dependent (Lin et al., 1996).
Figure 1.

Cytoskeletal architecture of a migrating newt lung epithelial cell. Cells were fixed and processed for immunofluorescent localization of tubulin to visualize MTs (B) and stained with Texas red-phalloidin to localize F-actin (C). MTs are relatively straight and extend radially from the centrosome, while in the cell body they are very sinuous. In the lamella, MTs are generally oriented either parallel or perpendicular to the cell edge. F-actin is concentrated in the lamella and lamellipodia. In D the outline of the phase image of the cell (A) was traced, and the regions of the cell referred to in the text are defined as follows: Nu, nucleus; La, lamella (between gray dotted and dashed lines); Lp, lamellipodia (between gray dashed line and cell edge); CB, cell body (behind thick dotted line); thick gray dotted line, base of the lamella; thick gray dashed line, base of lamellipodia; arrows show the direction of retrograde flow. Several examples of perpendicular MTs (thin white lines) and parallel MTs (thin white dashed lines) are traced from the image in B as well. Bar, 15 μm.
The role of MTs in cell migration is largely unknown. Although some small, specialized cell types such as keratocytes or neutrophils do not require MTs for motility (Zigmond et al., 1981; Euteneuer and Schliwa, 1984), MTs are required for the movement of larger complex cells (Vasiliev et al., 1970). When MTs are depolymerized in fibroblasts, the cell's polarized morphology is lost, the ruffling activity normally confined to the leading edge becomes evenly distributed along the entire cell margin, and the cells no longer move (Vasiliev et al., 1970). Futhermore, if migrating cells at the edge of a monolayer wound (Liao et al., 1995) or neuronal growth cones (Tanaka et al., 1995) are treated with agents that inhibit MT assembly/disassembly dynamics without decreasing polymer mass or altering MT arrangement, migration slows considerably, implying that MT dynamic instability is required for cell migration. It also seems that proper arrangement of MTs is needed during cell migration and that this may be maintained by F-actin–based retrograde flow. When retrograde flow is inhibited by cytochalasin poisoning of actin assembly in actively migrating cells (Terasaki and Reese, 1993) or neuronal growth cones (Forscher and Smith, 1988), many MTs extend into the lamellipodia or growth cone and become bent and random in orientation. In addition, when MTs are oriented perpendicular to the direction of rearward flow, they are transported rearward at the same rate as surface markers (Mikhailov and Gundersen, 1995). Together, these observations suggest that the MT dynamic instability and actin-based retrograde flow may work together to model and remodel the MT cytoskeleton as a cell migrates and that this is required for continued movement.
In this study, we examine MT dynamics in living migratory epithelial cells from primary cultures of newt lung. We find, as predicted, subsets of MTs whose dynamics may be differentially regulated during migration. In addition, we make novel observations on the organization and dynamics of MTs in migrating cells that differ considerably from the classic conception of MTs studied historically in stationary cells, and have implications for the mechanism of MT turnover in migrating cells. In large part, these differences arise from the interaction of MTs with actomyosin-based retrograde flow in the lamella during cell migration.
Materials and Methods
Preparation of Labeled Tubulins
Phosphocellulose-purified porcine brain tubulin was prepared as described in Walker et al. (1988). Tubulin was conjugated to X-rhodamine succinimidyl ester (Molecular Probes, Eugene, OR) by the method of Hyman et al. (1991). The final dye-to-protein ratio was ∼1:1. C2CF-labeled tubulin (Mitchison, 1989) was the kind gift of Arshad Desai and Tim Mitchison (University of California, San Francisco, CA).
Cell Culture and Experimental Manipulations
Primary cultures of newt (Taricha granulosa) lung were established on No. 1.5 coverslips (Corning, Corning, NY) in Rose chambers as described in Rieder and Hard (1990). 5–10-d-old cultures were used for experiments.
For imaging MT dynamics, cells on the periphery of the epithelial sheet that extends from the lung explant were chosen for microinjection. These cells are specialized for migration and possess a thin, flat lamella that is ideal for microscopy. To view MT dynamics at the centrosome, peripheral cells in which the centrosome was positioned beneath the nucleus were chosen for time lapse imaging. In these cells, the MTs emanating from the centrosome were held in a relatively two-dimensional array by the overlying nucleus, and MT dynamics at the centrosome were visible in one focal plane. Cells were microinjected with ∼1/10 the cellular volume of 2 mg/ml X-rhodamine–labeled tubulin in injection buffer (50 mM K Glutamate, 0.5 mM KCl, pH 7.0) using the microinjection system described in Waters et al. (1996). For photoactivation experiments, cells were microinjected with a mixture of 0.5 mg/ml X-rhodamine–labeled tubulin and 5.0 mg/ml C2CF-labeled tubulin as described in Waters et al. (1996). After injection, coverslips of cells were allowed to recover for 1–2 h before being mounted on a slide with a double-stick tape chamber in culture media containing 0.3–0.6 U/ml of the oxygen-scavenging enzyme, Oxyrase (Oxyrase, Inc., Mansfield, OH; Waterman-Storer et al., 1993; Mikhailov and Gundersen, 1995) and sealed with valap (1:1:1 mixture of petroleum jelly, lanolin, and paraffin).
Cytochalasin-D (2.5 μM from a 1,000× stock in dimethylsulfoxide), BDM (2,3 butanedione-2-monoxime, 20 mM from a freshly prepared 100× aqueous stock), or nocodazole (100 nM from 10,000× stock in dimethylsulfoxide) were diluted into Oxyrase-containing culture media, and coverslips of microinjected cells were mounted in this mixture and observed by microscopy within 3 to 5 min, or the mixture was perfused by a peristaltic pump onto cells mounted on coverslips in a custom-designed microscope perfusion chamber kindly lent by Rich Cole and Conly Rieder (Wadsworth Center, Albany, NY; Rieder and Alexander, 1990).
To view the retrograde movement of cell surface components, aminated 1 μm Cascade blue latex microspheres (Molecular Probes) were adhered to the cell surface. The microspheres were first washed two times by dilution into PBS (150 mM Na-phosphate, 50 mM NaCl, pH, 7.4) and 20 min of centrifugation at 30,000 rpm in a TLS55 rotor (Beckman Instr., Palo Alto, CA). The final pellet of beads was resuspended in 5 mM Hepes (pH, 7.25), sonicated 1.5 min with a microtip (output = 6; Branson Sonifer 250; Branson, Danbury, CT), and added to culture media at a final dilution of 1:300 of the original stock. This solution was perfused onto cells in a slide/double stick tape chamber. The chamber was incubated 10 min upside down, rinsed out with 3 vol of Oxyrase-containing media, sealed, and the cells imaged within 5 min.
For localization of MTs and F-actin in cells, coverslips of cells were simultaneously fixed and lysed for 5 min in PHEM buffer (60 mM PIPES, 25 mM Hepes, 10 mM EGTA, 2 mM MgSO4, pH, 7.0) containing 0.5% formaldehyde, 0.5% glutaraldehyde, 0.5% Triton X-100, followed by fixation for 10 min in PHEM buffer containing 1% formaldehyde. Coverslips were rinsed in PHEM buffer, reduced with sodium borohydride, rinsed in PBS, and incubated in block (PBS containing 5% donkey serum [Jackson Immunoresearch Laboratory, West Grove, PA]) for 45 min. Cells were then incubated for 1 h in monoclonal rat anti–yeast tubulin antibody YL 1/2 (Serotec, Oxford, UK) diluted 1:50 in block, rinsed in PBS, and incubated 45 min in fluorescein-conjugated donkey anti–rat IgG (Jackson Immunoresearch Laboratory) diluted 1:10 in block containing 6 μ/μl of Texas red-conjugated phalliodin (Molecular Probes). After rinsing, coverslips were mounted on slides in 50% glycerol/50% PBS containing n-propyl gallate.
Multi-Mode Time-Lapse Microscopy
Digital images of cells were obtained using the multi-mode fluorescence microscope system described in Salmon et al. (1994) and Salmon and Waters (1996). This consists of a microscope (Microphot FXA; Nikon, Melville, NY) equipped with a 60×/1.4 NA Plan Apo differential interference contrast (DIC) objective and a 1.4 NA condenser and optical components for phase contrast and DIC image formation. For multiple wavelength epifluorescence imaging, epi-illumination was provided by an HBO 100-W mercury arc lamp and passed through a dual filterwheel apparatus (Metaltek, Raleigh, NC) containing an electronically controlled shutter, a neutral density filterwheel, and an excitation filterwheel with filters for X-rhodamine (570 nm), fluorescein (490 nm), and Cascade blue or photoactivation (360 nm). Shutter and filterwheel timing and position were controlled by a controller (Ludl Biopoint, Hawthorne, NY) and MetaMorph software (Universal Imaging Corp., Media, PA). Excitation illumination was reflected off of a triple wavelength dichroic mirror and through the objective lens. Fluorescence emission from the specimen passed through a triple band-pass emission filter (for 450, 510–530, and 620–650 nm), and images were collected with a cooled CCD camera (C4880; Hamamatsu, Bridgewater, NJ). For phase contrast microscopy, images were collected using electronically shuttered (Uniblitz, Rochester, NY) 540-nm light. For time-lapse collection of DIC and fluorescence images, an electronic filterwheel (Ludl Biopoint) containing the DIC analyzer was placed in the aperture plane just in front of the camera (Shaw et al., 1997). DIC images were collected using green light shuttered between exposures and the analyzer in the light path at extinction with the polarizer and the Wollaston prism in place. To alternate with fluorescence images, the analyzer was rotated out of the light path and a fluorescence image taken as above. Shutter and filterwheel timing and position were controlled by MetaMorph software. Photoactivation of C2CF fluorescence was performed using a 25-μm × 1-mm slit (Melles Griot, Auburn, MA) placed in the field diaphragm image plane of the epi-illumination pathway as described in Waters et al. (1996).
Time-Lapse Video Enhanced DIC Microscopy
Dynamics of the cell periphery and the retrograde flow of surface ruffles were examined using the microscope system described in Tran et al. (1997a). This consists of a microscope (Universal; Zeiss, Inc., Thornwood, NY) with DIC optics, a Plan 100×/1.25 NA objective lens (Zeiss, Inc.), a 1.4 NA condenser, and illumination provided by a HBO 100-W mercury arc lamp and introduced into the microscope by an Ellis fiber optic scrambler (Technical Video, Woods Hole, MA). Images were recorded by a camera (C2400 Newvicon; Hamamatsu), processed in real time by an image processor (Argus 10; Hamamatsu), and recorded onto S-VHS tape at 36× time lapse with a VCR (AG–6750-A; Panasonic, Osaka, Japan).
Data Analysis
All position, length, and intensity measurements on digital images were made using the analysis functions of the MetaMorph software. To determine the parameters of MT dynamic instability, images of MTs were collected at 7-s intervals, and the positions of MT ends were recorded for each successive digital image in a time-lapse series. The values were imported into Microsoft Excel 7.0, and pixel measurements were converted to distance measurements by a calibration factor determined from images of a 10-μm grid. Instantaneous growth and shortening velocities were determined by regression analysis of plots of the distance of the MT end from the origin (the first point measured) versus time using RTM custom software (Walker et al., 1988). To determine accuracy in tracking MT ends, a single MT end in a time-lapse data series was retracked in duplicate and the difference between the duplicate measurements at each time point averaged 0.39 ± 0.18 μm (n = 1,298 points). Thus, differences in distance of <1 μm between two consecutive points were not counted as growth or shortening excursions. Pause was defined as slopes of <1.0 μm/ min (average values of growth or shortening were generally about five times this). Catastrophe and rescue frequencies were calculated for the population of MTs as described in Walker et al. (1988).
For comparison of the parameters of MT dynamic instability of MTs before and after the MT bent and ran parallel to the leading edge, MTs with angles of 0 to 30° from perpendicular to the leading edge of the cell were considered to be perpendicular to the leading edge. MTs with angles of 60 to 90° from perpendicular to the cell's leading edge were considered to be parallel to the leading edge. Thus, the period during which the MT was bending and was neither perpendicular nor parallel was not included in the averages.
To determine rates of rearward movement, the distance between the marker in question and the leading edge of the cell was determined for each time point along the axis of movement. The leading edge was chosen as a reference because it is the origin of retrograde flow. To monitor the movement of parallel MTs, a line was drawn along the axis of movement over the MT on each image in the series, and the intersection between the line and the MT served as a positional marker. To monitor the movement of aminated Cascade blue beads, the centroid of the bead was used as a marker (centroid = peak intensity of a linescan of intensity of fluorescence across the bead). For photoactivation experiments, a ∼2.5-μm-wide bar of C2CF fluorophore was uncaged 5–15 μm from and parallel to the cell's leading edge by 3-s exposure to unattenuated 360-nm UV light. This resulted in a 2.5-μm-wide mark of fluorescein tubulin on MTs that aligned perpendicular to the leading edge of the cell. The peak intensity of a linescan taken across the bar and along the axis of movement was used as a positional marker. When cells were treated with nocodazole, assembly/ disassembly-inhibited MT ends were used as markers.
Cells in which a relatively low level of X-rhodamine tubulin had been injected were chosen to analyze the treadmilling of MTs with two free ends. In these cells, the incorporation of labeled and unlabeled subunits resulted in MTs with distinct bright and dark “speckles” that served as internal fiduciary marks of the MT lattice.
When measuring the dynamics of MTs with both ends free, the plus end of the MT was defined as the end that grew, shortened, or paused, with kinetics similar to the plus ends of MTs growing towards the leading edge. The minus end was generally initially oriented towards the cell center and unlike plus ends, never grew but only shortened or paused. These definitions were made based on observations of the behavior of free MT plus and minus ends that were formed by MT breakage.
To quantify MT dynamics at the centrosome, the centrosome was assigned as the origin of an x–y coordinate system, and nucleations, catastrophes without rescue, releases, and the total number of MTs were determined for one quadrant of the coordinate system at a time. This was done because sometimes all four quadrants around the centrosome were not fully in focus in a single image plane or when the centrosome was not centered beneath the nucleus. When parameters of MT dynamics within a quadrant could not be accurately determined for these reasons, that quadrant was assigned the average values of the other quadrants, and the sum of the four quadrants was used for the final values for that cell. The average number of centrosomal MTs was determined by counting the number of MTs emanating from each quadrant of the centrosome at 5-min intervals. The average number of MTs in the lamella was determined by counting the plus ends visible in a ∼30 × 30 μm field of the lamella at 5-min intervals.
All data values are reported as mean ± SD. To determine significant differences between averages, unpaired t-tests assuming equal variance were performed with significant differences considered when P < 0.01.
Results
Retrograde Flow and Cytoskeletal Organization in Migrating Newt Lung Epithelial Cells
MT dynamics were examined in migrating cells on the periphery of the epithelial sheet that emanates at an average rate of 100 μm/d (0.07 μm/min) from an explant of newt (Taricha granulosa) lung tissue. The peripheral cells are the only cells within the sheet that are specialized for locomotion. They provide the force for extending the rest of the cells in the sheet, which are tightly adherent to one another (see Reider and Hard, 1990, for a complete description of this culture system). The peripheral cells are polarized, with a large, thin lamella (15–30 μm wide × ∼0.5–1.0 μm thick) that extends from the thicker (5–7 μm) cell body where the nucleus resides (Fig. 1, A and D). At the leading edge of the cell, there is typically a 3–5-μm-wide × <1-μm-thick lamellipodia. This architecture is typical of various types of migrating vertebrate tissue cells (Abercrombie et al., 1976).
Examination of these cells by time-lapse video enhanced DIC (VE-DIC) microscopy (not shown) revealed a rapid retrograde flow of thin DIC refractile membrane ruffles and particulate matter at 1.67 ± 0.32 μm/min (n = 13 “ruffles” in 4 cells) in the actively ruffling lamellipodia, and a slower rearward flow of refractile membrane folds and material at 0.42 ± 0.20 μm/min (n = 11 “ridges” in 4 cells; see Table II) in the rest of the lamella in front of the cell body. This pattern of retrograde flow in the lamellipodia and lamella is typical of many motile cell types including nerve growth cones, fibroblasts, and cells migrating into the “wound” of a monolayer (for reviews see Lin et al., 1994, and Mitchison and Cramer, 1996).
Table II.
Rates Rearward Transport of Markers in the Lamella of Newt Lung Cells*
| Rate of rearward movement (μm/min) | ||||||
|---|---|---|---|---|---|---|
| Marker in lamella | Control | 20 mM BDM‡ | 2.5 μM Cytochalasin D§ | |||
| DIC refractile ridges | 0.42 ± 0.20 (n = 11) | 0.13 ± 0.03 (n = 9) | 0.14 ± 0.03 (n = 7) | |||
| Parallel MTs | 0.46 ± 0.20 (n = 10) | 0.10 ± 0.16 (n = 6) | 0.07 ± 0.05 (n = 12) | |||
| Photoactived bar of C2CF tubulin | 0.30 ± 0.11 (n = 8) | 0.11 ± 0.08 (n = 6) | ||||
| Beads on cell surface | 0.41 ± 0.22 (n = 10) | |||||
| MT plus ends (100 nM nocodazole) | 0.39 ± 0.12 (n = 6) | |||||
Marker position measured relative to the leading edge of the cell.
Data taken within 5 min after application of BDM.
Data taken 10–15 min after application of cytochalasin D.
The MT and actin cytoskeletons of peripheral migratory cells were examined in fixed and stained specimens (Fig. 1, A–C). MTs emanating from the centrosome near the nucleus are predominantly straight or slightly curved and radial in orientation. MTs in the lamella are primarily oriented perpendicular to the leading edge of the cell, while a minority are oriented approximately parallel to the cell edge (Fig. 1, B and D). We define “perpendicular MTs” as those with angles of 0 to 30° from perpendicular to the leading edge of the cell (directly in front of that MT) and “parallel MTs” as those with angles of 60 to 90° from perpendicular to the cell's leading edge (see Materials and Methods). The organization of MTs within the cell body, but not directly emanating from the centrosome, is a complex mixture of both perpendicular and parallel-oriented MTs, many appearing convoluted and bent into sinuous shapes. The distribution of F-actin in peripheral cells was examined by staining with Texas red-conjugated phalloidin (Fig. 1 C). F-actin is much less concentrated in the cell body than in the lamella, where it is for the most part diffusely localized, with the exception of some radially oriented bundles that may be stress fibers. The highest concentration of F-actin (as determined by fluorescence intensity line scans across the lamella; not shown) is at 2–5 μm from the leading edge, at the actin marginal band at the base of the lamellipodia.
MT Plus End Dynamic Instability near the Leading Edge Is Regional and Dependent on MT Orientation
To examine MT dynamics in the lamella and lamellipodia, we microinjected peripheral cells of the epithelial sheet with X-rhodamine–conjugated tubulin and allowed incorporation of fluorescent subunits into MTs for 1 to 2 h. At the end of this time, the MT cytoskeleton was fully labeled with fluorescent subunits, as determined by fixation of injected cells and processing for immunolocalization of tubulin (not shown). We then obtained a time-lapse series of fluorescence images of the lamella at 7-s intervals. The plus ends of most perpendicular MTs in the lamella extended to the base of the lamellipodia, ∼5–10 μm from the leading edge. There they exhibited dynamic instability, asynchronously and frequently alternating between very short phases of growth and shortening (∼1–3 μm) and spending ∼40% of their time in “pause,” neither growing nor shortening (Table I). Thus, the bulk of the perpendicular MTs exhibited little net change in length over time, and their ends maintained a relatively constant position at the base of the lamellipodia (Fig. 2, MT at arrowhead, time 00:00–4:49).
Table I.
Assembly Dynamics of MT Ends in the Lamella of Newt Lung Epithelial Cells
| Fluorescent tubulin (present study) | VE-DIC | |||||||||
|---|---|---|---|---|---|---|---|---|---|---|
| Parameter | +MT end, perpendicular* (n = 22 MTs, 13 cells) | +MT end, parallel* (n = 22 MTs, 13 cells) | −MT end‡ (n = 32 MTs, 13 cells) | +MT end (Vasquez et al., 1997)§ | +MT end (Cassimeris et al., 1988)§ | |||||
| Growth rate (μm/min) | 4.5 ± 2.7 | 6.8 ± 3.9 | – | 4.9 ± 0.14 (270) | 7.2 ± 0.3 (42) | |||||
| Growth duration (min) | 0.6 ± 0.4 | 0.9 ± 0.7 | – | 1.06 | 1.2 ± 1.0 | |||||
| Shortening rate (μm/min) | 5.2 ± 4.3 | 7.6 ± 5.4 | 6.4 ± 5.9 | 14.3 ± 0.(161) | 17.3 ± 0.7 (35) | |||||
| Shortening duration (μm/min) | 0.5 ± 0.5 | 0.4 ± 0.2 | 0.7 ± 0.6 | 0.3 | 0.4 ± 0.3 | |||||
| Catastrophe frequency (min-1) | 1.57 | 0.61 | – | 0.96 | 0.84 | |||||
| Rescue frequency (min-1) | 2.31 | 2.59 | – | 3.12 | 2.64 | |||||
| Percentage time in growth/shortening/pause | 35.7/24.2/40.1 | 75.6/17.7/6.7 | 0/77.8/22.2 | – | – | |||||
For comparison of assembly dynamics of parallel and perpendicular MTs, 22 MTs that grew perpendicular to the cell's edge and then underwent a bend and grew parallel to the cell edge were followed. Assembly parameters were determined for the periods during which the MT was perpendicular or parallel. The period when the MT was bending was discounted in the averages.
Measurements include both shortening minus ends in which the MT breakage event that produced the minus end was observed as well as minus ends of unknown origin that depolymerized into the field of view from the direction of the cell center. MT orientation was not considered and stable minus ends that never exhibited shortening were not included in this analysis.
Values expressed as mean ± SEM; number of events measured in parentheses.
Figure 2.


Dynamics of MTs in the lamella and lamellipodia during protrusion of the leading edge. (A) A series of fluorescence micrographs of the leading edge of a cell that had been injected with X-rhodamine–labeled tubulin, elapsed time in min/sec in the upper right of each panel. The boundary of the cell can be seen in negative image because labeled tubulin subunits are diffusely fluorescent within the cell but not outside of the cell. Before protrusion of the cell edge (times 00:00–00:39) most MTs extend only as far as the one marked with an arrowhead, however some MTs, such as the one marked P, extend closer to the leading edge. As the leading edge advances (times 00:39–04:49), the plus end of the P MT approximately maintains its distance from the leading edge, while the MT at the arrowhead does not extend into the new protrusion until advancement of the leading edge has ceased (times 4:49–5:29). (B) Dynamic life history plots of the plus ends of the MTs marked in A in relation to the position of the cell edge. Distance from the origin (a point at the bottom edge of the micrograph at time 00:00) was plotted against time for images captured at 7-s intervals. The position of the edge was determined from fluorescence intensity linescans perpendicular to and across the leading edge. The “pioneer” MT steadily grows at about 2 μm/min during advancement of the leading edge (∼0–5 min). The proximal perpendicular MT undergoes very little net growth until advancement of the leading edge ceases (∼5 min), whereupon the MT rapidly grows at ∼8 μm/min. Bar, 10 μm.
However, several MTs often acted as “pioneers,” growing out of the lamella where most plus ends terminated, and extending closer to the leading edge within the lamellipodia (Fig. 2, MT “P”). When several pioneer MTs persisted in growth into a newly formed protrusion of the leading edge or pseudopodia, the protrusion persisted (Fig. 2, A and B, times 0:00–3:59) and the majority of ends grew into the new region after advancement of the leading edge ceased (Fig. 2, A and B, times 4:49–5:29).
When pairs of fluorescence images of MTs and high resolution DIC images of the lamella and lamellipodia were acquired at 9-s intervals, we were able to clearly see the relation between MT growth patterns and the retrograde flow near the cell edge (Fig. 3 A). Often as a pioneer MT grew into the lamellipodia, it appeared to “probe” the plasma membrane as its plus end grew and shortened (Fig. 3 A, time 0:00–1:56, and b, section 3 of graph). If the leading edge did not protrude, the tip of pioneer MTs became bent near the leading edge in the rapid rearward flow in the lamellipodia (Fig. 3 A, times 1:56–4:56, and B, section 4 of graph). This established the axis of growth fully parallel to the cell's edge (Fig. 3 A, times 5:32–7:28, and B, section 5 of graph), similar to observations on the formation of “parallel” MTs in migrating NRK cells (Mikhailov and Gundersen, 1995).
Figure 3.
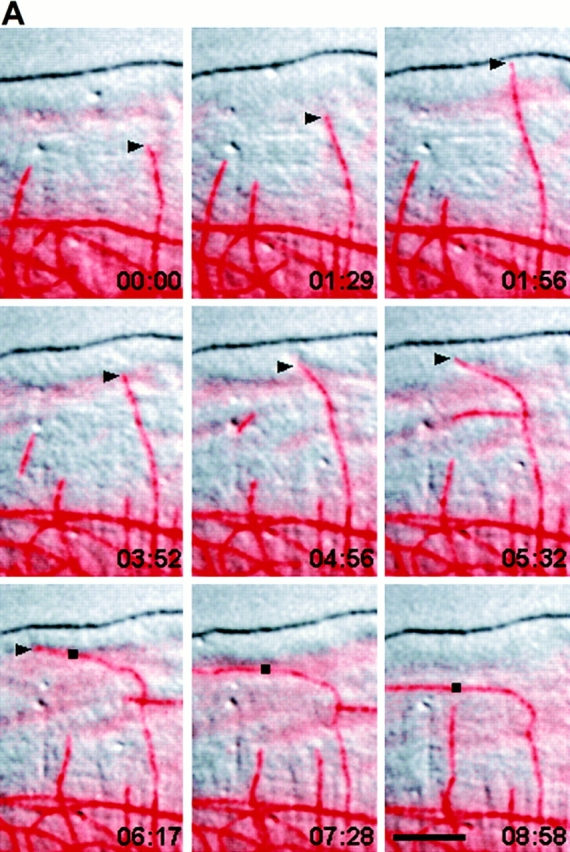

Bending, reorientation, and retrograde flow of a MT in the lamellipodia. (A) A series of micrographs in which the fluorescence image of X-rhodamine–labeled MTs (pseudocolored red) has been digitally superimposed onto the DIC image (in grayscale) of the lamella. Pairs of fluorescence and DIC images were captured within 1.5 s of each other at 9-s intervals; elapsed time in min/sec is in the lower right of each panel. The base of the lamellipodia can be seen as a slightly diffuse staining of X-rhodamine–labeled subunits ∼5 μm from the leading edge. Because the cell is slightly thicker in this region (not shown), the increased volume produces a higher amount of fluorescent label. (B) Dynamic life history plot of the distance of the MT end at the arrowhead in A from the origin (the position of the plus end at time 00:00) versus time. (C) Plot of the distance of a point on the MT (square in A) from the leading edge (directly in front of the point) versus time. The y axis is inverted for clarity. Initially, the MT plus end (arrowhead) perpendicular to the leading edge exhibits little net growth (section 1 of graph B). The MT then grows from within the lamella into the lamellipodia and touches the plasma membrane (time 00:00–01:56 in A; section 2 of graph B) and then undergoes dynamic instability as it “probes” the leading edge (times 01:56–03:52 in A; section 3 of graph B) and then bends within the lamellipodia (times 03:52–05:32 in A; section 4 of graph B), reestablishing its axis of growth parallel to the leading edge. The plus end then undergoes rapid net growth (times 05:32–07:28 in A; section 5 of graph B). The parallel portion of the MT (black square) then moves rearward away from the leading edge (times 6:17–8:58 in A; graph C). Bar, 10 μm.
Remarkably, we found that the new orientation of the MT significantly altered its plus end assembly dynamics. Once bent parallel to the leading edge, MTs gained length rapidly (Fig. 3 B, section 5 of graph). The assembly dynamics of 22 MTs in 11 cells that underwent a bend as described above were followed, and the parameters of dynamic instability before and after the occurrence of the bend were determined (Table I). This analysis indicated that the rapid gain in length after bending could be attributed to a significant (P < 0.01) increase in the duration of growth excursions as compared to before the formation of the bend, corresponding to an approximate doubling of the percent time spent in growth and greater than twofold reduction in the frequency of catastrophe (Table I). We also found that the rates of both growth and shortening were increased after bending parallel to the leading edge. Although this was found to be statistically significant (P < 0.01), it is possible that this difference may be attributed to the inaccuracy in measuring velocity values for the short growth and shortening excursions exhibited by the plus ends of perpendicular MTs (see discussion in Shelden and Wadsworth, 1993). The values for assembly dynamics of parallel MTs reported in the present study are more similar to parameters of dynamic instability reported previously for newt lung cells (Cassimeris et al., 1988; Vasquez et al., 1997) than the values we find for perpendicular MTs (Table I). In the previous studies, MTs chosen for analysis were only clearly visible by VE-DIC in regions of certain cells where the cytoplasm exhibited Brownian movement (Salmon, E.D., and C.M. Waterman-Storer, unpublished observations); thus those values for MT dynamic instability may have been biased.
MTs in the Lamella Are Continuously Moved Rearward
As noted above, the lamellipodia and lamella of migrating cells exhibited vigorous retrograde flow of material that was associated with MT bending and reorientation of MTs parallel to the cell's leading edge. Mikhailov and Gundersen (1995) have noted that MTs oriented parallel to the edge of migrating cells move rearward in the lamella. We also observed retrograde movement of parallel MTs in the lamella of our cells after MTs have bent and reoriented in the lamellipodia (Fig. 3 A, times 6:17–7:28, and C). Analysis of 10 parallel MTs in the lamellae of 10 X-rhodamine tubulin-labeled cells gave an average rearward transport rate of 0.46 ± 0.20 μm/min, not significantly different (P > 0.5) than the rate of movement of DIC refractile “ridges” in the lamella (Table II).
To determine if parallel MTs in the lamella were moving rearward at the same rate as components of the cell surface, the movement of surface-bound aminated Cascade blue latex beads and parallel X-rhodamine–labeled MTs in the lamella were analyzed by capturing pairs of fluorescence images at 3-min intervals. Although Cascade blue requires potentially harmful excitation in the UV (360 nm), only ∼10 1-s exposures of highly attenuated light (neutral density 2) were necessary to determine accurate rates of movement, and this had no effect on the ruffling or advancement of the cell edge during the observation period. 10 beads in 6 cells were analyzed and found to move rearward at exactly the same rate as parallel MTs at the same location (Fig. 4, A and B). The average rate of bead rearward movement was 0.41 ± 0.22 μm/min, not significantly different (P > 0.5) than the average rates of rearward movement of parallel MTs (Table II), in agreement with the observations in normal rat kidney cells by Mikhailov and Gundersen (1995).
Figure 4.


Rearward movement of surface-coupled beads and parallel MTs in the lamella. (A) Digitally superimposed fluorescence images (acquired within 1.5 s of each other) of a cell injected with X-rhodamine tubulin (red) that was mounted in media containing 1 μm aminated Cascade blue latex beads (light blue). Elapsed time in min/sec in the upper right of each panel. The bead denoted by the blue triangle is attached to the cell surface and moves rearward while overlying a parallel MT within the cell (green square). During the time period, the leading edge of the cell advanced. (B) Graph of the distance between the bead (light blue triangle) or parallel MTs (green square and yellow circle) and the leading edge of the cell in A versus time (images taken at 3-min intervals). The y axis is inverted for clarity. All three markers move away from the leading edge with identical velocities. Bar, 10 μm.
As a MT with a bend moved rearward in the lamella or lamellipodia, the vertex of the bend moved rearward at the same rate (Fig. 3, times 6:17–7:28), suggesting that the portion of the MT that was perpendicular to the cell edge and proximal to the bend was also moving rearward. This observation suggested that all MTs in the lamella, both parallel and perpendicular in orientation, are continuously transported rearward, in spite of the appearance of a relatively constant distance between the bulk of the plus ends and the leading edge of the cell. To test this hypothesis directly, we used photoactivation methods (Mitchison, 1989) to mark subunits in the lattice of perpendicularly oriented MTs in the lamella and monitor the position of the marked region relative to the cell edge. Cells were microinjected with a mixture of X-rhodamine tubulin and caged-fluorescein tubulin (1:10 X-rhodamine tubulin:C2CF tubulin, 5 mg/ml total), and a narrow (∼2.5 μm wide) bar of fluorescence was photoactivated by exposure to 3 s of unattenuated UV (360 nm) light, parallel to and ∼8–12 μm from the leading edge of the cell. This exposure to UV had no apparent effect on the ruffling activity or advancement of the cell edge. By taking pairs of rhodamine and fluorescein images at 3-min intervals after photoactivation, we found that fluorescein marks on MTs moved rearward from the leading edge at 0.30 ± 0.11 μm/min (n = 8; Fig. 5, A and B), somewhat slower on average but not significantly different (P > 0.5) than the rates of rearward movement of either parallel MTs, DIC refractile ridges, or surface-coupled beads (Table II). Although the photoactivated fluorescein marks in the lamella moved rearward, the positions of the MT plus ends remained nearly constant relative to the cell's edge, and the length of the of the X-rhodamine–labeled portion of the MTs between the mark and the cell edge increased (Fig. 5, A and B), indicating that the bulk of plus ends maintain a net growth rate of 0.3 μm/min.
Figure 5.


Rearward movement of the lattice of perpendicular MTs in the lamella. (A) Digitally overlaid and pseudocolored micrographs of a cell that was injected with a mixture of X-rhodamine (red)- and caged fluorescein (yellow–green)-labeled tubulins (captured at 3-min intervals within 1.5 s of each other). The cell was exposed to a 2.5-μm-wide bar of UV light to activate the fluorescein label just before the first image. Elapsed time (in min/ sec) is in the upper left of each panel. (B) Plots of relative fluorescence intensity (after background subtraction) versus position along the white line in A. Fluorescence loss due to photobleaching of C2CF during the total exposure time is <5% under similar conditions (not shown). The green lines represent intensity of uncaged fluorescein, and the red lines represent intensity of X-rhodamine. Time at which the scan was taken is denoted by the thickness of the plotted line. The position of the fluorescein-labeled subunits in the primarily perpendicular MTs moves rearward through the lamella over time (A, white arrowheads in B over the green scanlines mark the peak fluorescein intensity), while the level of the X-rhodamine–labeled MT polymer remains relatively constant across the lamella over time (red scan lines in B). Loss in intensity of the fluorescein signal over time is due to depolymerization of MTs through the marked region and photobleaching. Note that the fluorescein-labeled subunits move rearward as a relatively coherent bar (A), and the width of the bar increases very little over time (B). Bar, 10 μm.
Surprisingly, the rearward movement of the MT lattice was similar for all perpendicular MTs marked in a lamella, as marks on MTs that closely apposed one another maintained register, and the marks moved rearward as a coherent bar (Fig. 5 A). The integrated fluorescence intensity of a bar generally decreased only slightly during the ∼30–40-min period in which rearward movement was monitored (after background subtraction, to ∼75% of the value at time zero, not shown). This is presumably due to depolymerization of MTs through the marked region and photobleaching. In a few cases, a parallel MT happened to be within the photoactivated region, and it would move rearward at the same rate as the marks on the perpendicular MTs (not shown). These results demonstrate that all MTs in the lamella, both perpendicular and parallel, are continuously moving rearward at 0.3–0.4 μm/min.
Rearward Movement of MTs Continues When MT Plus End Assembly Is Blocked
Although the lattice of perpendicular MTs and parallel MTs move rearward in the lamella at similar rates, their movement could be driven by different mechanisms. One possibility is that perpendicular MTs are pushed rearward in the lamella by net plus end growth that exerts a pushing force against the leading edge of the cell or a barrier at the base of the lamellipodia. To test this hypothesis, we treated cells previously injected with X-rhodamine tubulin with 100 nM nocodazole to block MT plus end assembly/ disassembly dynamics (Vasquez et al., 1997). The positions and assembly dynamics of MT plus ends in the lamella were then monitored by acquiring images at 7-s intervals for 30 to 40 min (Fig. 6). Distance versus time plots of the movement of MT ends showed that the MTs did not undergo the growth and shortening characteristic of dynamic instability, but were in a continuous state of pause, as expected from Vasquez et al. (1997; Fig. 6 B). The assembly/ disassembly-inhibited plus ends moved slowly away from the leading edge at 0.39 ± 0.12 μm/min, similar to the rate of MT retrograde transport in untreated cells (Figs. 3 C and 4; Table II). It is possible that 100 nM nocodazole caused the MT plus ends to steadily depolymerize at this rate, giving the appearance of rearward flow. We rule this out because bends and curves in nocodazole-inhibited MTs moved rearward at the same rates as the plus ends (Fig. 6 A). After 40 min in 100-nM nocodazole, retrograde movement had cleared the 15–30-μm-wide lamella of all MTs, while regions near the nucleus still contained many sinuous MTs (not shown).
Figure 6.


Rearward flow of assembly-inhibited MT plus ends in the lamella. (A) Selected fluorescence micrographs from a series of a cell that was injected with X-rhodamine–labeled tubulin and then mounted in media containing 100 nM nocodazole to inhibit MT plus end assembly dynamics. Elapsed time after addition of nocodazole shown in the upper right of each panel. The positions of three MT plus ends are highlighted. (B) Dynamic life history plots of the distance of the plus ends of the three MTs marked in A from the leading edge of the cell versus time (images acquired at 7-s intervals). The y axis is inverted for clarity. The MT plus ends do not exhibit typical plus end dynamic instability but instead move slowly away from the cell edge at ∼0.4 μm/min (B). While moving rearward, the MTs maintain characteristic bending patterns (A), indicating that the movement of the plus end is not due to depolymerization. Bar, 10 μm.
Rearward Movement of MTs in the Lamella Is Sensitive to Cytochalasin D and BDM
MTs moved rearward in the lamella at the same rate as surface-bound beads (Fig. 4), suggesting that MT movement occurs by an actomyosin-based mechanism (Lin and Forscher, 1995; Lin et al., 1996). To provide further evidence for the role of F-actin in the rearward transport of MTs, we characterized the effect of the barbed-end F-actin assembly inhibitor, cytochalasin D (for review see Cooper, 1987), on retrograde transport in our cell type and then examined its effects on MT rearward transport. Time-lapse VE-DIC analysis of living cells perfused with 2.5 μM cytochalasin D showed that ruffling of the leading edge stopped rapidly after perfusion of the inhibitor, and the margin of the cell retracted, leaving behind membrane contacts with the coverslip and protrusions of the membrane (Fig. 7 A) that grew and shortened with similar dynamics as MT plus ends (not shown). After several minutes in cytochalasin D, the rearward movement of DIC refractile ridges was significantly reduced in the lamella as compared to controls (P < 0.01, Table II). Lower concentrations of cytochalasin D had little effect on retrograde flow, while higher concentrations caused the cell to detach from the coverslip. In cells treated with cytochalasin D for 15 min and then fixed and processed for immunofluorescence localization of tubulin (Fig. 7 B), MTs were more abundant as compared to untreated cells and extended to the cell edge. Texas red-phalliodin staining (Fig. 7 C) revealed that F-actin was depleted from the leading edge, the actin marginal band was disrupted, and F-actin became concentrated into bright puncta in the lamella. The rearward movement of parallel MTs was then analyzed in cells that had been previously microinjected with X-rhodamine tubulin and then treated with 2.5 μM cytochalasin D. Immediately after addition of cytochalasin D, parallel MTs continued to flow rearward (not shown). However, similar to the attenuated movement of surface markers, after 10 to 15 min, cytochalasin D induced a significant (P < 0.01) 84.7% reduction in the rate of movement of parallel MTs as compared to control (Table II). These results indicate that the continuous polymerization of actin is necessary for the rearward transport of MTs in the lamella.
Figure 7.

Affects of cytochalasin D and BDM on the architecture and cytoskeleton of the lamella and lamellipodia. VE-DIC images of the lamella of living cells (A and D) ∼5 min after the perfusion of 2.5 μM cytochalasin D (A) or 20 mM BDM (D) and an untreated cell (G), for comparison. In A, the leading edge formed protrusions as the plasma membrane retracted around growing MTs. In D, the lamellipodia continued to ruffle and exhibit retrograde flow, but this motility ended abruptly at the margin at the base of the lamellipodia. Within the lamella, retrograde flow was inhibited. Fluorescence images of microtubules (B and E, with anti-tubulin antibodies) and F-actin (C and F, with Texas red-phalloidin) in fixed cells treated for 20 min with 2.5 μM cytochalasin D (B and C) or for 5 min with 20 mM BDM (C and F). Treatment with cytochalasin D caused the lamellipodia to fill up with microtubules and for F-actin to concentrate into large puncta. Preservation of the membrane extensions shown by VE-DIC in A by fixation was not possible. Treatment with BDM left the microtubule array slightly bundled but relatively undisturbed and resulted in a large concentration of F-actin at the actin marginal band. Bar, 10 μm.
Evidence that the retrograde flow of F-actin in growth cones is driven by a myosin motor was provided by a study from Lin et al. (1996), where they demonstrated a dose- dependent inhibition of retrograde flow of surface-coupled beads by two distinct inhibitors of myosin; microinjection of n-ethyl-maleimide–inactivated myosin S-1 heads, or treatment with the myosin ATPase inhibitor, 2,3-butanedione–2-monoxime (BDM; Cramer and Mitchison, 1995). Based on this study, we sought to determine whether myosin activity was required for the rearward transport of MTs in our cells by treatment with BDM. Time-lapse VE-DIC imaging of newt lung cells perfused with 20 mM BDM revealed a rapid inhibition of the rearward movement of refractile ridges and surface-coupled beads in the lamella (Table II). Although the lamellipodia continued to ruffle and exhibit retrograde flow, the ruffles protruded abnormally and the rearward flow terminated abruptly at a well defined margin at the base of the lamellipodia (Fig. 7 D). In cells fixed after 5 min in 20 mM BDM, MTs were slightly bundled, but were not dramatically changed in density or arrangement in the lamella (Fig. 7 E), while F-actin was highly concentrated at the actin marginal band at the base of the lamellipodia (Fig. 7 F). The effects of BDM on the retrograde movement of either parallel or perpendicular MTs in the lamella was then tested. In cells injected with labeled tubulins, 20 mM BDM induced a significant (P < 0.01) 78.3% decrease in the rate of rearward transport of parallel MTs, while photoactivation methods revealed a significant (P < 0.01, 66.6%) reduction in the rate of perpendicular MT rearward transport as compared to controls (Table II).
Retrograde Flow Is Associated with Microtubule Breakage that Generates Quasi-Stable Noncentrosomal Microtubules
Local bending and buckling of otherwise straight or slightly curved MTs often was observed in the lamella as a result of continuous rearward transport of perpendicular MTs in the lamella. During retrograde flow of MTs, local buckling led to very tight bends and curves in the MT, which often broke (Fig. 8) at an average radius of curvature of 0.6 ± 0.15 μm (n = 7). We have never witnessed straight MTs breaking, indicating that breakage is only associated with local buckling, and not directly caused by photodamage (Vigers et al., 1988).
Figure 8.

MT breakage induced by local MT buckling in the lamella. Selected images from series of fluorescence micrographs of cells injected with X-rhodamine–labeled tubulin. Time in min/ sec is shown in the upper left of each panel. (A) A MT with local buckling broke at 11 s. The newly formed minus end (large arrowhead) shortened immediately after breakage, while the new plus end (small arrowhead) formed by the break shortened slightly before beginning to undergo dynamic instability (times 00:19–1:57). (B) A MT with local buckles broke (time = 00:10), forming a new minus end (large arrowhead) that remained stable and a new plus end that shortened before undergoing dynamic instability (times 00:20–01:59). Bar, 10 μm.
MT breakage created a new free plus end on the MT that broke and a portion of MT with a new free minus end and an old plus end. Just after breakage, 100% of the newly formed plus ends analyzed shortened at least slightly before beginning to exhibit growth and shortening behavior typical of the bulk population of plus ends (Fig. 8 and Table III). In contrast, 82% of the free minus ends formed by breakage neither grew nor shortened, but remained stable (Fig. 8 B). The other 18% of newly formed minus ends shortened immediately after breaking at an average rate of 6.43 ± 5.85 μm/min (Fig. 8 A, and Tables I and III) similar to the shortening rate of plus ends. Free minus ends never grew. For the most part, stabilized minus ends formed by breaking remained stable until the end of the recorded sequence of images or until rearward flow swept them into regions crowded with MTs and they were no longer visible. In a few cases minus ends that were stable after breakage began to rapidly shorten a few minutes later. If a free MT minus end produced by breakage began to shorten, it never restabilized but continued to shorten with intermittent pauses. Minus end shortening continued until the MT was fully consumed by minus end shortening catching up with the dynamic plus end (Fig. 9). Thus, minus ends produced by MT breaking were either stabilized or dynamic, with their dynamics consisting of only two states: shortening, which occupied 77.8% of their time, and pause, which occupied 22.2% (Table I, total analysis time = 167.3 min on 32 MTs in 15 cells).
Table III.
Assembly Behavior of New MT Ends Produced by MT Breakage in the Lamella Measured Immediately After Breakage
| MT end monitored (n = 5 cells, 11 MTs) | MT end behavior | |||||
|---|---|---|---|---|---|---|
| Remains stable | Grows | Shortens | ||||
| + end | 0% | 0% | 100% | |||
| − end | 82% | 0% | 18% | |||
Figure 9.

MT minus ends depolymerize into the field of view in the lamella. Fluorescence images from a series acquired at 7-s intervals of a cell injected with X-rhodamine–labeled tubulin. Elapsed time in min/sec is in the upper left of each panel. The leading edge of the cell is visible in negative image near the top of each panel. The positions of two different MT minus ends are highlighted with white and black arrowheads, respectively, in each panel. The minus end at the white arrow was present at the start of the sequence. The MT rapidly depolymerizes from the minus end (times 00:00–00:55) which then stabilizes and remains so (times 00:55–02:32) until the MT is consumed by plus end depolymerization (time 03:28). The minus end at the white arrow enters the field of view by rapid depolymerization (times 00:14– 00:55), which it continues until the MT is nearly consumed (times 00:55–03:28). Note that the plus end of this MT grows (times 02:12–03:28); thus a MT piece appears to move in the lamella as the minus end continues to depolymerize during the same time period. Bar, 10 μm.
MTs with Free Plus and Minus Ends Can Exhibit Treadmilling through the Lamella
Although a MT with a rapidly depolymerizing minus end was always eventually consumed by complete depolymerization, the lifetime before complete consumption appeared to be dependent on the MT orientation. When the MT was perpendicular to the leading edge, the plus end typically achieved very little net growth, and minus end depolymerization resulted in quick consumption of the MT (Fig. 9, white arrow). However, if the MT was aligned parallel to the leading edge, the net plus end growth characteristic of parallel MTs in these cells delayed the consumption of the MT by minus end depolymerization (Fig. 9, black arrow). Simultaneous net growth of the plus end and net shortening of the minus end resulted in a MT polymer that apparently treadmilled through the lamella, with its plus end leading, parallel to the edge of the cell at rates similar to the net rate of growth of the plus end of parallel MTs. During treadmilling, the piece of MT would continue to undergo retrograde flow, and alternately and randomly gain and lose length, until it finally was consumed.
We demonstrated that the movement of these small segments of MT was indeed treadmilling and not solely MT translocation by microinjecting cells with a relatively low level of X-rhodamine–labeled tubulin. Under these conditions, MTs were not evenly fluorescent but exhibited a distinct “speckled” bright and dark lattice. This variation in fluorescence intensity along the length of MTs is a property of stochastic incorporation when the fraction of labeled subunits is a small fraction (5%) of the total tubulin (Waterman-Storer, C.M., and E.D. Salmon, manuscript in preparation). Speckled MTs underwent dynamic instability with growth and shortening rates and transition frequencies similar to those for cells injected with higher levels of labeled tubulin (not shown). The bright and dark speckles served as internal fiduciary marks of the MT lattice, similar to the photoactivated marks described above, making it possible to analyze the addition and removal of tubulin subunits relative to the lattice of the MT. This showed that within a treadmilling piece of MT, the distance between an internal mark and the minus end would decrease over time, and distance between the mark and the plus end would increase over time, while the mark stayed nearly stationary relative to the lamella (Fig. 10). Although plus end growth was interspersed with periods of shortening and pause, and minus end shortening was interspersed with periods of pause, as long as there was net plus end growth and net minus end depolymerization, the polymer continued to treadmill in a plus end direction at the plus end growth rate of parallel MTs (6.8 μm/min), often for >30 μm. When plus end shortening or pause continued with concomitant minus end shortening, the MT fragment was then consumed by depolymerization. In addition to treadmilling, MT fragments exhibited very short (0.87 μm, n = 9), sudden translocations in the plus end direction, as indicated by movements of speckles in the MT lattice (Fig. 10). Because the translocations often occurred within the 7-s interval between images, their velocity could not be accurately determined. Because the translocations occurred at an average frequency of only once every 4.06 min, they represented a minor component of the forward motion of MT fragments.
Figure 10.


Treadmilling of a MT in the lamella. (A) Fluorescence micrographs (taken at 9-s intervals) of a region in the lamella of a cell that had been injected with a relatively low level of X-rhodamine–labeled tubulin. The featured MT was parallel to and ∼8 μm from the leading edge of the cell, which was at the right. The low level of labeled tubulin results in MTs that are unevenly fluorescent along their lengths. The position of the plus (top) and minus (bottom) ends of the MT are marked with white arrowheads, while the position of a dark (unlabeled) region of the MT lattice is marked with a black arrowhead. The polarity of the MT ends was identified when the MT broke (shown in the previous micrographs). The treadmilling MT was also undergoing retrograde flow toward the cell body (to the left). (B) Graph of the distance of the minus end, the plus end, and the dark mark in the MT lattice versus time. Distance was measured relative to the minus end of the MT. The arrow spans the portion of the graph represented in the micrographs in A. The plus end of the MT undergoes growth and shortening assembly dynamics typical of parallel MTs; long excursions of uninterrupted growth interspersed with short periods of pause or shortening. The minus end rapidly shortens, pauses for a relatively long period of time, and then resumes rapid shortening. The dark region of the lattice stays relatively stationary with respect to either end, with slight translocations of the lattice occurring at around 30–40 and 70 s (in graph B). Bar, 2 μm.
The Centrosome Contributes Very Few New Plus or Minus Ends to the Cellular Pool of MTs
Examination of time-lapse fluorescence series of images near the base of the lamella where the cell becomes thicker showed that the rearward flow of MTs ended here, and the MTs flowing into this region bent and buckled extensively (not shown). This likely produces the bent, convoluted, and random orientation of MTs in the region of the cell body between the lamella and the nucleus (as in Fig. 1 B). The minus ends of MTs (judged so by their orientation towards the cell body and the fact that they never grew) often entered the peripheral lamella from this region as they rapidly shortened towards the leading edge of the cell (Fig. 9). However, because the thickness of the cell in this region made resolution of individual MT breakage events very difficult, it was possible that these free minus ends were generated either by MT breakage or ejection from the centrosome. To differentiate between these two possibilities, we compared the rate at which MTs were released from the centrosome to the rate at which free minus ends depolymerized into the field of view in the lamella.
To image MT dynamics at the centrosome, peripheral cells in which the centrosome was positioned beneath the nucleus were chosen because the overlying nucleus provided both a clear image as well as a flattened array of MTs (Fig. 11). Images were acquired at 7-s intervals and time-lapse series examined for evidence of MT ejection from the centrosome. In 121.4 min of analysis time in six cells, only three MTs were ejected from the centrosome, a frequency of 0.02 ± 0.04/cell/min (Table IV). In spite of this low ejection frequency, free minus ends depolymerized into the ∼30 × 30 μm field of view at the lamella from the direction of the cell body at a frequency of 0.3 ± 0.2/min (Table IV). Thus, for a typical cell with ∼90 × 30 μm lamella, about one minus end depolymerizes into the lamella per minute. Since only 0.02 minus end is released from the centrosome per minute, the centrosome is not responsible for generating most of the free minus ends seen in the lamella.
Figure 11.

Dynamics of MTs at the centrosome. Fluorescence images from a series (taken at 7-s intervals) of a cell injected with X-rhodamine tubulin. Elapsed time in min/sec is in the upper right of each panel. The centrosome in this cell was positioned at the edge of the nucleus, so that half of the MTs emanating from the centrosome were visible beneath the nucleus. A MT was nucleated from the centrosome (small arrowhead) and grew radially out of the field of view (times 00:29–00:59). Another MT depolymerized from outside the field of view (large arrowhead) and was consumed by complete depolymerization all the way back to the centrosome (times 00:59–01: 59). Bar, 10 μm.
Table IV.
Comparison of the Nucleation and “Consumption” of MTs at the Centrosome to the Appearance and Disappearance of Plus Ends in the Lamella
| MTs/centrosome (MTs/5 min) | MT nucleations (MTs/min) | MTs depolymerizing to centrosome (MTs/min) | MT releases from centrosome (MTs/min) | |||||
|---|---|---|---|---|---|---|---|---|
| Centrosome (n = 7 cells) | 22.4 ± 9.6 | 2.9 ± 2.4 | 2.8 ± 2.6 | 0.02 ± 0.04 | ||||
| MTs/lamella (MTs/5 min) | MT + ends entering lamella (ends/min) | MT + ends depolymerizing out of lamella (ends/min) | MT − ends entering lamella* (ends/min) | |||||
| 90 × 30 μm Lamella‡ (n = 19 cells) | >90 | 6.9 ± 4.5 | 0.6 ± 0.9 | 0.9 ± 0.6 |
Minus ends could enter the field either by breaking within the field of view or depolymerizing towards the leading edge from outside the field of view.
Values were determined for a 30 × 30 microscopic field of view of the lamella and multiplied by three to give a value for a lamella of typical length.
The ability to compare MT numbers and dynamics at the centrosome to those within the lamella also allowed us to estimate the contribution of centrosomal MT dynamics to the turnover of MTs in the lamella and to estimate the total number of noncentrosomal MTs in these cells. At the cell edge, about seven new plus ends grew from the direction of the cell body and entered the field of view in a typical 90 × 30 μm lamella every minute (2.3 ± 0.3/min per 30 × 30 μm field = 6.9 ± 0.9 per 90 × 30 μm lamella). In contrast, 2.9 ± 2.4 MTs were nucleated at the centrosome per min (Table IV), and typically only half of these grew towards the lamella. The nucleation rate at the centrosome was also offset by an average of 2.8 ± 2.6 MTs that were consumed as they depolymerized without rescue all the way back to the centrosome (Table IV). Furthermore, we often observed that the same site on the centrosome repeatedly nucleated and consumed MTs (not shown). This suggests that most of the plus ends growing into the lamella do not originate by nucleation at the centrosome. We also found that only ∼0.6 ± 0.9 plus ends depolymerized out of a 90 × 30 μm lamella towards the cell body each minute. Instead, MT plus ends left the lamella either by becoming parallel to the leading edge and flowing rearward or by minus end depolymerization and consumption of the entire MT. This suggests that MT depolymerization from the lamella all the way back to the centrosome is a relatively infrequent event.
To determine the total number of noncentrosomal MTs, we calculated the difference between the number of MT minus ends bound to the centrosome and the number of plus ends in lamella. There were only 22.4 ± 9.6 MTs on average emanating from a centrosome (total number counted at 5-min intervals), and again, only about half of these extended towards the lamella. In contrast, there was always >90 plus ends in a 90 × 30 μm area of the lamella (counted at 5-min intervals; Table IV). This suggests that at most, between 11.2 and 22.1% of the ∼90 MT plus ends present in a 90 × 30 μm lamella could be bound at their minus ends to the centrosome, and at least 77.9–88.8% of MTs in the cell have noncentrosomal minus ends.
Discussion
In this study, we have discovered several novel features of MT dynamics in living migrating cells that have implications for the arrangement of MTs and the mechanism of polymer turnover in these cells that differ considerably from the prevailing view in which MTs are bound to centrosomes at their minus ends and turn over by dynamic instability at their free plus ends. These findings are outlined in Fig. 12, and below we discuss them in sequence, considering possible underlying mechanisms, related phenomena, and the implications for MT turnover in migrating cells.
Figure 12.

Model of MT arrangement and turnover in the lamella and lamellipodia of migrating newt lung epithelial cells. Thick lines represent MTs; dotted lines, the border between the lamella and lamellipodia; thin arrows, MT growth or shortening; arrowheads, sites of MT breakage; thick arrows, the direction of retrograde flow; dotted area, the putative zone of MT breakage at the base of the lamella; and circles, the centrosome. The numbers in the diagram refer to findings and hypotheses from this study. The cell is migrating to the right. 1, MTs in the lamella oriented perpendicular to the leading edge extend to the base of the lamellipodia, exhibit frequent and short dynamic instability, and show little net change in length. 2, Parallel MTs within the lamellipodia undergo catastrophe less often and exhibit net growth. 3, Parallel MTs and photoactivated marks on perpendicular MTs in the lamella (stars) move continuously towards the cell center at ∼0.4 μm/min. 4, F-actin (beaded lines) crosslinked to MTs is postulated to be moved rearward by myosin, which is bound to an unknown stationary structure (question mark) in the lamella. 5, MT breakage occurring at sites of local MT buckling. 6, Free minus ends formed by breakage are specifically capped (asterisks). 7, Treadmilling of MTs by net plus end growth and net minus end shortening. 8, <25% of all MTs in the cell are bound at their minus ends to the centrosome. 9, Cytoplasmic dynein bound to a membranous organelle (question mark) or other MT crosslinking proteins, are proposed to organize noncentrosomal MTs in the lamella.
Regional Regulation of Individual MT Dynamics
As predicted by Kirschner and Mitchison (1986), we have found that specific parameters of MT dynamic instability are significantly different depending on the location (Fig. 2) or orientation of individual MTs (Fig. 3 and Table I) within a migrating newt lung epithelial cell. Most MTs in the lamella oriented perpendicular to the leading edge extend to the base of the lamellipodia, exhibit frequent transitions, and show little net change in length (Fig. 12, #1), while “pioneer” MTs that enter the lamellipodia during protrusion and parallel MTs within the lamellipodia undergo catastrophe less often and exhibit net growth (Fig. 12, #2). Subsets of MTs that extend close to the cell edge have been observed previously in motile cells (Sammak and Borisy, 1988a ,b; Tanaka and Kirschner, 1991; Mikhailov and Gundersen, 1995), but differences in parameters of dynamic instability between the extended MTs and the bulk of the plus ends in those cells were not determined.
Wadsworth (Wadsworth, P. 1996. Mol. Biol. Cell. 7:3342a) has recently observed differences in catastrophe frequency and percent time in growth for MTs in the leading lamellipodia versus MTs in lateral regions of locomoting PtK cells, suggesting that specific regulation of catastrophe frequency may be a general means by which MT dynamics are regionally regulated during interphase in many cell types. In addition, a high concentration of activated factors that promote catastrophe may be responsible for the high frequency of transition observed for perpendicular MTs extending to the base of the lamellipodia. Recently, two such catastrophe-promoting factors have been identified: the Xenopus kinesin-related protein XKCM-1 (Walczak et al., 1996), and the oncoprotein Op-18/stathmin (Belmont and Mitchison, 1996). So far, the effects of XKCM1 on MT catastrophe have only been characterized in mitotic cytoplasm, and it is unknown how XKCM-1 is regulated and whether it is active during interphase. Importantly, a recent study from Cassimeris' lab has shown that Op-18/stathmin plays a key role in the regulation of MT dynamics in migrating newt lung cells, as microinjection with anti-Op-18/stathmin antibodies suppressed catastrophe and resulted in an increase in the number of perpendicular MTs in the lamella (Howell, B., H. Deacon, and L. Cassimeris, personal communication). How MTs would override regulation at the base of the lamellipodia and become pioneers within the lamellipodia is not known, although a possible candidate protein that could be envisioned to single out MTs to become pioneers is APC. In migrating cells, APC localizes only to the plus ends of MTs that are invading protrusions of the leading edge (Nathke et al., 1996), and it would be interesting to know the effects of APC on MT assembly dynamics.
MTs could also be prevented from entering the lamellipodia by structural constraints. Structures at the base of the lamellipodia that may be capable of forming a blockade to growth include the dense actin network at the F-actin marginal band, or regions of high cytoplasmic density distal to the MT ends. We have approached the latter question by following MT dynamics in cells that were microinjected with 24-nm fluorescein-labeled ficolls (kindly provided by K. Luby-Phelps, University of Texas Southwestern Medical School, Dallas, TX) that are known to be excluded from dense regions of cytoplasm in the periphery of 3T3 and PtK where MTs are absent (Provance et al., 1993). However, in newt lung cells we did not find that 24-nm ficolls were excluded from regions distal to perpendicular MT plus ends (Waterman-Storer, C., and E.D. Salmon, unpublished observations). Thus, if the constraint on MT growth at the base of the lamellipodia is structural, it is more likely to be provided by the actin marginal band. This is supported by the observation that treatment with either cytochalasin D or BDM inhibits retrograde flow, but cytochalasin D disrupts the actin marginal band and allows unconstrained growth of MTs, while BDM enhances the concentration of F-actin at the marginal band and does not allow unconstrained MT growth (Fig. 7). Forscher and Smith (1988) have noted similar effects in Aplysia bag cell growth cones, where treatment with cytochalasin B halts retrograde flow, results in extension of MTs into the growth cone, and disrupts actin that is concentrated distal to the plus ends of MTs. Treatment of growth cones with BDM, however, decreases the concentration of actin distal to the MT ends but causes retraction of the leading edge (Lin et al., 1996), which may also sterically hinder MT growth in a fashion similar to the actin marginal band.
Another surprising finding of the present study was that the orientation of a MT parallel to the leading edge of the cell affects the biochemistry of the MT end (Fig. 12, #2), decreasing catastrophe frequency and increasing growth and shortening rates. This also could be due to constraint of MT growth by the barrier of the plasma membrane when the MT is perpendicular to the leading edge within the lamellipodia, and when the MT bends and runs parallel to the cell edge it then can grow unconstrained. However, MTs in living cells have been observed to undergo catastrophe or rescue at the same site along the MT lattice or re-grow along the same sinuous path after rescue, suggesting that regulators of MT dynamic instability may be cytomatrix bound (Shulze and Kirschner, 1988), and this could be responsible for the effect of orientation on MT assembly observed in the present study. It is well established that some microtuble-associated proteins bind both actin and MTs (Griffith and Pollard, 1978, 1982; Selden and Pollard, 1983, 1986), and F-actin in the lamellipodia of various motile cell types is organized into a criss-cross weave. (Lewis and Bridgman, 1992; Small et al., 1995; for review see Small, 1988). Thus, a growing MT end could encounter a different density of F-actin–bound modulators of dynamic instability depending on its orientation with respect to the F-actin weave.
MT Retrograde Flow in the Lamella
A surprising finding of the present study was that all MTs in the lamella, both parallel and perpendicular to the cell edge, are continuously moving towards the cell center at ∼0.4 μm/min, the same rate as refractile “ridges” and surface-bound beads (Fig. 12, #3). Rearward movement of perpendicular MTs has not been detected in other studies in which MTs in the lamella have been marked (Sammak et al., 1987; Sammak and Borisy, 1988b ; Rodionov and Borisy, 1994, 1997a), in spite of the fact that some of these cell types were motile (Sammak et al., 1987; Sammak and Borisy, 1988b ). In these previous cases, the cells often appeared to have localized regions of ruffling along more than one edge, and it was not noted whether the cells exhibited retrograde flow of surface markers. In contrast, in regions of the cell facing the direction of migration where retrograde flow of surface markers occurs, parallel MTs flow rearward in NRK cells (Mikhailov and Gundersen, 1995), and there is evidence for a similar phenomenon in polarized Xenopus A-6 cells (Terasaki and Reese, 1993). Whether perpendicular MTs flow rearward in either of these cases was not tested. However, based on results of the present study, we would predict that retrograde flow of surface markers is concomitant with retrograde flow of both parallel and perpendicular MTs in migrating cells.
Although we documented that the rearward flow of MTs in the lamella was insensitive to concentrations of nocodazole that inhibited MT dynamics but sensitive to the actin polymerization inhibitor cytochalasin D and the myosin ATPase inhibitor BDM, the details of the mechanism of MT movement are still unclear. The fact that MTs move rearward at the same rate as surface markers (Table II) suggests that MTs are moving retrogradely at the same rate as F-actin in the lamella (Lin and Forscher, 1995) although this needs to be tested directly. If MTs and F-actin do move at the same rate, this suggests that they may be tethered to one another, forming a composite cytomatrix. This is supported by the observation that the lattice of MTs stays stationary with respect to the surrounding cytomatrix during the treadmilling of individual MTs (Fig. 9), implying links between tubulin subunits and the surrounding matrix. This further implies that all organelles that bind to either actin or MTs are also undergoing retrograde flow, as has been suggested for both the endoplasmic reticulum (Terasaki and Reese, 1993) and pinocytotic vesicles (Mikhailov and Gundersen, 1995). This composite cytomatrix could be moved by myosin, bound to a stationary structure in the lamella, and contracting or pulling rearward the F-actin meshwork with attached MTs (Fig. 12, #4). In this model, inhibition of actin polymerization at the leading edge would allow F-actin and MTs to continue to be drawn rearward by myosin until the lamella was emptied of the population of F-actin bound to MTs, which would explain the lag we observed in inhibition of MT retrograde flow by cytochalasin D treatment. In contrast, inhibition of myosin ATPase with BDM would immediately stop MT rearward flow, again consistent with what we observed. Which member(s) of the myosin superfamily would be responsible for the retrograde F-actin movement and to what stationary structure they are bound are open to question, and no myosins have yet been localized in newt lung epithelial cells. In other spread and polarized vertebrate cell types, isoforms of myosins I and II are variously either concentrated in the lamellipodia or localized to puncta in the lamella or growth cone (for review see Mooseker and Cheney, 1995).
Although the inhibitory effects of BDM on purified platelet myosin II and brain myosin V have been demonstrated (Cramer and Mitchison, 1995), its efficacy as a “generalized” inhibitor of muscle and nonmuscle myosin ATPases is not fully established. Furthermore, BDM inhibits muscle contraction by a combination of its inhibitory activities both on myosin (Herrmann et al., 1992), on cation channels in the plasma membrane (Schlichter et al., 1992) and sarcoplasmic reticulum (Phillips and Altschuld, 1996), and on ATP translocases in the mitochondrial membrane (Mojon et al., 1993). Thus, the inhibition of MT retrograde movement by BDM may be a secondary effect of ionic imbalances or metabolic defects. However, based on the demonstration by Lin et al. (1996) that BDM and competitive inhibition of actomyosin by microinjection of NEM-inactivated myosin heads have similar effects on retrograde flow, we favor the idea that MTs move rearward by the acto-myosin based mechanism described above.
MT Breakage and the Generation of Free MT Minus Ends
MT breakage that occurred at sites of local MT buckling (Fig. 12, #5) could either be the result of mechanical stress or the activity of one of the MT-severing factors, katanin (McNally and Vale, 1993), 56-kD homo-oligomeric–severing factor (Shiina et al., 1992), or EF1α (Shiina et al., 1994). Because MT breakage always occurred on buckled MTs at an average radius of curvature with a small standard deviation (0.6 ± 0.15 μm), we suspect that mechanics are relevant, although breaking MTs by bending in vitro has not been documented. However, this does not rule out the activity of severing proteins. Indeed, by electron microscopy, the 56-kD homo-oligomeric–severing factor has been observed to bind at kinks along the MT (Shiina et al., 1992). Instead of producing the kinks, as was suggested, the factor may preferentially bind to a stressed MT lattice. However, both katanin and the homo-oligomeric 56-kD severing factor are not thought to be active in interphase, so there may be other factors involved in the MT breakage we observed in newt lung cells.
When MTs assembled from pure tubulin in vitro are cut either by UV microbeam irradiation (Walker et al., 1989) or with a microneedle (Tran et al., 1997b ), plus ends formed by cutting shorter 100% of the time, while minus ends rarely shorten (∼10–25% of the time) and mostly begin to grow (∼75–90% of the time). Similarly, new plus ends formed by MT breakage in vivo always shortened immediately. Although free minus ends produced by breakage in the cell shortened a similar proportion of the time as is observed for cut MTs in vitro, minus ends formed by breakage in vivo never grew but were generally stabilized, undergoing neither growth nor shortening. This suggests that free minus ends formed by breakage in the cell are specifically capped (Fig. 12, #6), as has been suggested for MT minus ends in extracts of Xenopus (Gard and Kirschner, 1987) or sea urchin (Gliksman et al., 1992) eggs. MT minus ends in Drosophila centrosomes are capped by a ring of γ tubulin (Moritz et al., 1995), and γ tubulin has been localized to noncentrosomal sites at the apical region of polarized epithelial cells where noncentrosomal MTs originate (Meads and Schroer, 1996). Thus, it would be interesting to localize γ tubulin in newt lung cells. There also now is a general agreement between several recent studies that indicates that free minus ends in cells never grow, no matter whether they are produced by MT breakage (the present study), centrosome (or MT organizing center) release (Keating et al., 1997; Rodionov and Borisy, 1997b ; and the present study), or spontaneous nucleation (Yvon, A.M., and P. Wadsworth. 1996. Mol. Biol. Cell. 7:3341a). Thus, in addition to minus end capping factors, there must also be factors in the cell that specifically inhibit minus end growth and rescue.
Treadmilling behavior of MTs with two free ends produced by breakage was observed for a short period of time when dynamic instability by chance became coordinated between the two MT ends, resulting in net growth at the plus end and net shortening at the minus end (Fig. 12, #7). Similar to MTs in the periphery of cells in the present study, Keating et al. (1997) have observed MT treadmilling and translocation after MT minus ends are released from the centrosome. In these two cases, both MT plus and minus ends exhibited the transitions between growth, shortening, or pause that are typical for each end in vivo. In contrast, Rodionov and Borisy (1997b) recently showed that for a MT ejected from a noncentrosomal MT organizing center in a cellular fragment of an interphase melanophore, the plus end grew without transitions and the minus end shortened without transitions as the MT treadmilled towards the cell periphery. How control of dynamic instability in these cell fragments resulted in this behavior is unknown (for review see Waterman-Storer and Salmon, 1997).
Centrosomal and Noncentrosomal MTs
Surprisingly, we found that ∼80–90% of the MTs in migrating newt lung cells were not bound to the centrosome (Fig. 12, #8), however the specific mechanism by which the free-ended MTs were generated is not certain. Noncentrosomal MTs have been observed in many cell types, including neurons (Yu et al., 1993), polarized epithelial cells (Bre et al., 1987), sea urchin eggs (Harris et al., 1980), dictyostelium cells (Kitanishi and Fukui, 1987), as well as in fish scale cells (McBeath and Fujiwara, 1990) and other undifferentiated cells in culture (Brinkley et al., 1981) during treatment and/or recovery from conditions that depolymerize MTs. It has been assumed for the most part that noncentrosomal MTs are produced either by noncentrosomal nucleation or centrosomal release. Although noncentrosomal nucleation of MTs has been documented in cell extracts (Gard and Kirschner, 1987) and A498 cells (Yvon, A.M., and P. Wadsworth. 1996. Mol. Biol. Cell. 7:3341a), we have not seen any examples of this in our system. Additionally, in contrast to the recent study by Keating et al. (1997) who found in non-migratory PtK cells that about two MTs are released from the centrosome every minute, we found in migrating newt lung cells that MTs were rarely released from the centrosome. We thus suggest that the primary mechanism for generating free MT minus ends in migrating newt lung cells is by retrograde flow-driven MT breakage, and this further implies that the actomyosin cytoskeleton is indirectly responsible for the generation of noncentrosomal MTs during cell migration.
The observation that most MTs in these cells are not bound to the centrosome raises the question of how MTs are organized into a relatively parallel array in the lamella and continue to grow with their plus ends toward the leading edge when there is no constraint on orientation imposed at their minus ends by the centrosome. Rodionov and Borisy (1997a) have recently shown that MTs in fragments of interphase melanophores that lack centrosomes are organized into a radial array presumably by the minus end-directed MT motor activity of cytoplasmic dynein associated with membranous organelles. Cytoplasmic dynein has also been implicated in the organization of mitotic MTs into focused spindle poles in the absence of centrosomes in cells and cell extracts (for review see Waters and Salmon, 1997). Therefore, it is possible that cytoplasmic dynein also plays a role in the organization of noncentrosomal MTs in the lamella of migratory cells (Fig. 12, #9). However, when retrograde flow is stopped completely with cytochalasin in A-6 cells (Terasaki and Reese, 1993) or neuronal growth cones (Forscher and Smith, 1988; Lin and Forscher, 1995), MTs extending into the lamellipodia become bent and random in orientation, suggesting that F-actin itself or its retrograde movement may impose organization on MTs in the lamella. In the present study, treatment with concentrations of cytochalasin that slowed retrograde flow of MTs resulted in an increase in the number of MTs in the lamella, but the MTs did not become random in orientation. Problems with cell adhesion to the coverslip prevented us from testing the effects of higher concentrations or longer treatments with cytochalasin that stopped retrograde flow, thus it is uncertain whether F-actin retrograde flow is required for maintaining MT organization in the lamella of newt lung cells.
MT Turnover in Migrating Newt Lung Epithelial Cells
Our novel observations of MT dynamics and arrangement in migrating cells may in part explain the large discrepancy between the fast rates of MT polymer turnover measured in vivo and calculated values of MT polymer turnover based on parameters of plus end dynamic instability. These calculations have assumed that all minus ends are centrosome bound and that MTs are relatively stationary in the cell (Gliksman et al., 1993). From studies of MT re-growth after nocodazole treatment (Brinkley et al., 1981), and because we never saw spontaneous MT nucleation, we suggest that all MTs in migrating newt lung cells originally arise from a MT nucleated at the centrosome. However, we found that MT retrograde flow is associated with MT breakage, which creates noncentrosomal MTs. For the 10– 20% of MTs in newt lung cells that are bound to the centrosome, MT turnover is affected by parameters of plus end dynamic instability, and if MTs grow towards the leading edge, they are subject to retrograde flow, breakage, and the production of new plus and minus ends. For the noncentrosomal MTs, which make up the majority of MTs in these cells, we must consider both plus and minus end dynamic instability, retrograde flow, MT breakage, and the rate of minus end uncapping. Furthermore, MT retrograde flow in the lamella is accompanied by net growth at the plus ends that must be offset by net MT disassembly at the same rate somewhere else in the cell. Because ∼80% of the MTs in these cells are not bound to the centrosome, and because we have found no evidence for “poleward” movement of photoactivated marks on centrosome-bound MTs in interphase cells (Waterman-Storer, C.M., J. Waters, and E.D. Salmon, unpublished results), we do not think that polymer loss occurs near the centrosome, as is the case during poleward “flux” of MTs in kinetochore fibers in mitotic spindles (Mitchison, 1989; for review see Waters and Salmon, 1997). Thus, loss of polymer could occur either at a steady state from the noncentrosomal free minus ends of individual MTs or by plus and minus end depolymerization occurring at various sites within the lamella or cell body during retrograde flow. In addition, because “uncapping” of free minus ends produced by MT breakage always resulted in complete depolymerization of MTs, this may be a key point of regulation of MT turnover. Our results thus show that turnover of MTs in migrating cells is a complex problem involving regulation of multiple phenomena by multiple factors at different loci within the cell.
Acknowledgments
We wish to thank Lynne Cassimeris for sharing unpublished data and comments on the manuscript, Neal Gliksman for modifying the RTM software for tracking MTs in digital images using the MetaMorph software, Tim Mitchison and Arshad Desai for C2CF-tubulin, Kate Luby Phelps for fluorescent ficolls and dextrans, Rich Cole and Conly Rieder for lending their perfusion chamber, Louise Cramer for comments on the manuscript, and Albert Harris for lending his time-lapse VCR. Some of the initial observations on MT dynamics at the centrosome were made in collaboration with Mark Terasaki in the laboratory of Tom Reese at the Marine Biological Laboratory (Woods Hole, MA). We also thank Lynne Cassimeris, Julie Canman, Albert Harris, Tim Mitchison, Pat Wadsworth, Claire Walczak, Phong Tran, Mark Terasaki, Louise Cramer, and Julie Theriot for thoroughly stimulating E-mail and discussion. C.M. Waterman-Storer pays homage to Jennifer Waters for her expert advice on many technical aspects of this work.
Abbreviations used in this paper
- BDM
2,3-butanedione–2-monoxime
- CMTC
cytoplasmic microtubule complex
- DIC
differential interference contrast
- F-actin
filamentous actin
- MT
microtubule
- VE
video enhanced
Footnotes
Address all correspondence to Clare M. Waterman-Storer, Department of Biology, 607 Fordham Hall, University of North Carolina, Chapel Hill, NC 27599-3280. Tel.: (919) 962-2354. Fax: (919) 962-1625. E-mail: waterman @email.unc.edu and tsalmon@email.unc.edu
C.M. Waterman-Storer is a Fellow of the Jane Coffin Childs Memorial Fund for Research. This work was supported by National Institutes of Health grant GM 24364 to E.D. Salmon.
References
- Abercrombie, M., G.A. Dunn, and J.P. Heath. 1976. Locomotion and contraction in nonmuscle cells. In Contractile systems in non-muscle tissues. S.V. Perry, editor. Amsterdam, North-Holland Publishers. 3–11.
- Belmont LD, Mitchison TJ. Identification of a protein that interacts with tubulin dimers and increases the catastrophe rate of microtubules. Cell. 1996;84:623–631. doi: 10.1016/s0092-8674(00)81037-5. [DOI] [PubMed] [Google Scholar]
- Bre MH, Kreis TE, Karsenti E. Control of microtubule nucleation and stability in Madin-Darby canine kidney cells: the occurrence of noncentrosomal, stable detyrosinated microtubules. J Cell Biol. 1987;105:1283–1296. doi: 10.1083/jcb.105.3.1283. [DOI] [PMC free article] [PubMed] [Google Scholar]
- Brinkley BR, Fuller EM, Highfield DP. Cytoplasmic microtubules in normal and transformed cells in culture: analysis by tubulin antibody immunofluorescence. Proc Natl Acad Sci USA. 1975;72:4981–4985. doi: 10.1073/pnas.72.12.4981. [DOI] [PMC free article] [PubMed] [Google Scholar]
- Brinkley BR, Cox SM, Pepper DA, Wible L, Brenner SL, Pardue RL. Tubulin assembly sites and the organization of cytoplasmic microtubules in cultured mammalian cells. J Cell Biol. 1981;90:554–562. doi: 10.1083/jcb.90.3.554. [DOI] [PMC free article] [PubMed] [Google Scholar]
- Cassimeris L, Pryer NK, Salmon ED. Real-time observations of microtubule dynamic instability in living cells. J Cell Biol. 1988;107:2223–2231. doi: 10.1083/jcb.107.6.2223. [DOI] [PMC free article] [PubMed] [Google Scholar]
- Cooper JA. Effects of cytochalasin and phalloidin on actin. J Cell Biol. 1987;105:1473–1478. doi: 10.1083/jcb.105.4.1473. [DOI] [PMC free article] [PubMed] [Google Scholar]
- Cramer LP, Mitchison TJ. Myosin is involved in post-mitotic cell spreading. J Cell Biol. 1995;131:179–189. doi: 10.1083/jcb.131.1.179. [DOI] [PMC free article] [PubMed] [Google Scholar]
- Euteneuer U, McIntosh JR. Polarity of some motility-related microtubules. Proc Natl Acad Sci USA. 1981;78:372–376. doi: 10.1073/pnas.78.1.372. [DOI] [PMC free article] [PubMed] [Google Scholar]
- Euteneuer U, Schliwa M. Persistent, directional motility of cells and cytoplasmic fragments in the absence of microtubules. Nature (Lond) 1984;310:58–61. doi: 10.1038/310058a0. [DOI] [PubMed] [Google Scholar]
- Forscher P, Smith SJ. Actions of cytochalasins on the organization of actin filaments and microtubules in a neuronal growth cone. J Cell Biol. 1988;107:1505–1516. doi: 10.1083/jcb.107.4.1505. [DOI] [PMC free article] [PubMed] [Google Scholar]
- Gard DL, Kirschner MW. Microtubule assembly in cytoplasmic extracts of Xenopusoocytes and eggs. J Cell Biol. 1987;105:2191–2201. doi: 10.1083/jcb.105.5.2191. [DOI] [PMC free article] [PubMed] [Google Scholar]
- Gliksman NR, Parsons SF, Salmon ED. Okadaic acid induces interphase to mitotic-like microtubule dynamic instability by inactivating rescue. J Cell Biol. 1992;119:1271–1276. doi: 10.1083/jcb.119.5.1271. [DOI] [PMC free article] [PubMed] [Google Scholar]
- Gliksman NR, Skibbens RV, Salmon ED. How the transition frequencies of microtubule dynamic instability (nucleation, catastrophe, and rescue) regulate microtubule dynamics in interphase and mitosis: analysis using a Monte Carlo computer simulation. Mol Biol Cell. 1993;4:1035–1050. doi: 10.1091/mbc.4.10.1035. [DOI] [PMC free article] [PubMed] [Google Scholar]
- Griffith LM, Pollard TD. Evidence for actin filament–microtubule interaction mediated by microtubule-associated proteins. J Cell Biol. 1978;78:958–965. doi: 10.1083/jcb.78.3.958. [DOI] [PMC free article] [PubMed] [Google Scholar]
- Griffith LM, Pollard TD. The interaction of actin filaments with microtubules and microtubule-associated proteins. J Biol Chem. 1982;257:9143–9151. [PubMed] [Google Scholar]
- Harris P, Osborn M, Weber K. Distribution of tubulin-containing structures in the egg of the sea urchin Strongylocentrotus purpuratusfrom fertilization through first cleavage. J Cell Biol. 1980;84:668–679. doi: 10.1083/jcb.84.3.668. [DOI] [PMC free article] [PubMed] [Google Scholar]
- Heath JP, Holifield BF. Cell locomotion: new research tests old ideas on membrane and cytoskeletal flow. Cell Motil Cytoskeleton. 1991;18:245–257. doi: 10.1002/cm.970180402. [DOI] [PubMed] [Google Scholar]
- Herrmann C, Wray J, Travers F, Barman T. Effect of 2,3-butanedione monoxime on myosin and myofibrillar ATPases. An example of an uncompetitive inhibitor. Biochemistry. 1992;31:12227–12232. doi: 10.1021/bi00163a036. [DOI] [PubMed] [Google Scholar]
- Hyman A, Drechsel D, Kellogg D, Salser S, Sawin K, Steffen P, Wordeman L, Mitchison T. Preparation of modified tubulins. Methods Enzymol. 1991;196:478–485. doi: 10.1016/0076-6879(91)96041-o. [DOI] [PubMed] [Google Scholar]
- Keating TJ, Peloquin JG, Rodionov VI, Borisy GG. Microtubule release from the centrosome. Proc Natl Acad Sci USA. 1997;90:5078–5083. doi: 10.1073/pnas.94.10.5078. [DOI] [PMC free article] [PubMed] [Google Scholar]
- Kirschner M, Mitchison T. Beyond self-assembly: from microtubules to morphogenesis. Cell. 1986;45:329–342. doi: 10.1016/0092-8674(86)90318-1. [DOI] [PubMed] [Google Scholar]
- Kitanishi YT, Fukui Y. Reorganization of microtubules during mitosis in Dictyostelium: dissociation from MTOC and selective assembly/disassembly in situ. Cell Motil Cytoskeleton. 1987;8:106–117. [Google Scholar]
- Lewis AK, Bridgman PC. Nerve growth cone lamellipodia contain two populations of actin filaments that differ in organization and polarity. J Cell Biol. 1992;119:1219–1243. doi: 10.1083/jcb.119.5.1219. [DOI] [PMC free article] [PubMed] [Google Scholar]
- Liao G, Nagasaki T, Gundersen GG. Low concentrations of nocodazole interfere with fibroblast locomotion without significantly affecting microtubule level: implications for the role of dynamic microtubules in cell locomotion. J Cell Sci. 1995;108:3473–3483. doi: 10.1242/jcs.108.11.3473. [DOI] [PubMed] [Google Scholar]
- Lin CH, Forscher P. Growth cone advance is inversely proportional to retrograde F-actin flow. Neuron. 1995;14:763–771. doi: 10.1016/0896-6273(95)90220-1. [DOI] [PubMed] [Google Scholar]
- Lin CH, Thompson CA, Forscher P. Cytoskeletal reorganization underlying growth cone motility. Curr Opin Neurobiol. 1994;4:640–647. doi: 10.1016/0959-4388(94)90004-3. [DOI] [PubMed] [Google Scholar]
- Lin CH, Espreafico EM, Mooseker MS, Forscher P. Myosin drives retrograde F-actin flow in neuronal growth cones. Neuron. 1996;16:769–782. doi: 10.1016/s0896-6273(00)80097-5. [DOI] [PubMed] [Google Scholar]
- McBeath E, Fujiwara K. Microtubule detachment from the microtubule-organizing center as a key event in the complete turnover of microtubules in cells. Eur J Cell Biol. 1990;52:1–16. [PubMed] [Google Scholar]
- McNally, F.J., and R.D. Vale. Identification of katanin, an ATPase that severs and disassembles stable microtubules. Cell. 75:419–429. [DOI] [PubMed]
- Meads T, Schroer TA. Polarity and nucleation of microtubules in polarized epithelial cells. Cell Motil Cytoskeleton. 1995;32:273–288. doi: 10.1002/cm.970320404. [DOI] [PubMed] [Google Scholar]
- Mikhailov AV, Gundersen GG. Centripetal transport of microtubules in motile cells. Cell Motil Cytoskeleton. 1995;32:173–186. doi: 10.1002/cm.970320303. [DOI] [PubMed] [Google Scholar]
- Mitchison TJ. Polewards microtubule flux in the mitotic spindle: evidence from photoactivation of fluorescence. J Cell Biol. 1989;109:637–652. doi: 10.1083/jcb.109.2.637. [DOI] [PMC free article] [PubMed] [Google Scholar]
- Mitchison T, Kirschner M. Dynamic instability of microtubule growth. Nature (Lond) 1984a;312:237–242. doi: 10.1038/312237a0. [DOI] [PubMed] [Google Scholar]
- Mitchison T, Kirschner M. Microtubule assembly nucleated by isolated centrosomes. Nature (Lond) 1984b;312:232–237. doi: 10.1038/312232a0. [DOI] [PubMed] [Google Scholar]
- Mitchison TJ, Cramer LP. Actin-based cell motility and cell locomotion. Cell. 1996;84:371–379. doi: 10.1016/s0092-8674(00)81281-7. [DOI] [PubMed] [Google Scholar]
- Mojon D, Zhang W, Oetliker H. Inhibition by 2,3-butanedione-monoxime of mitochondrial ADP-dependent respiration and muscle contraction. Biochem Mol Biol Int. 1993;31:501–507. [PubMed] [Google Scholar]
- Mooseker MS, Cheney RE. Unconventional myosins. Annu Rev Cell Dev Biol. 1995;11:633–675. doi: 10.1146/annurev.cb.11.110195.003221. [DOI] [PubMed] [Google Scholar]
- Moritz M, Braunfeld MB, Sedat JW, Alberts B, Agard DA. Microtubule nucleation by γ-tubulin-containing rings in the centrosome. Nature (Lond) 1995;378:638–640. doi: 10.1038/378638a0. [DOI] [PubMed] [Google Scholar]
- Nathke IS, Adams CL, Polakis P, Sellin JH, Nelson WJ. The adenomatous polyposis coli tumor suppresser protein localizes to plasma membrane sites involved in active cell migration. J Cell Biol. 1996;134:165–179. doi: 10.1083/jcb.134.1.165. [DOI] [PMC free article] [PubMed] [Google Scholar]
- Okabe S, Hirokawa N. Incorporation and turnover of biotin- labeled actin microinjected into fibroblastic cells: an immunoelectron microscopic study. J Cell Biol. 1989;109:1581–1595. doi: 10.1083/jcb.109.4.1581. [DOI] [PMC free article] [PubMed] [Google Scholar]
- Okabe S, Hirokawa N. Actin dynamics in growth cones. J Neurosci. 1991;11:1918–1929. doi: 10.1523/JNEUROSCI.11-07-01918.1991. [DOI] [PMC free article] [PubMed] [Google Scholar]
- Pepperkok R, Bre MH, Davoust J, Kreis TE. Microtubules are stabilized in confluent epithelial cells but not in fibroblasts. J Cell Biol. 1990;111:3003–3012. doi: 10.1083/jcb.111.6.3003. [DOI] [PMC free article] [PubMed] [Google Scholar]
- Phillips RM, Altschuld RA. 2,3-Butanedione 2-monoxime (BDM) induces calcium release from canine cardiac sarcoplasmic reticulum. Biochem Biophys Res Commun. 1996;229:154–157. doi: 10.1006/bbrc.1996.1772. [DOI] [PubMed] [Google Scholar]
- Porter KR. Cytoplasmic microtubules and their function. Ciba Found Symp. 1966;8:308–356. [Google Scholar]
- Provance DW, Jr, McDowall A, Marko M, Luby-Phelps K. Cytoarchitecture of size-excluding compartments in living cells. J Cell Sci. 1993;106:565–577. doi: 10.1242/jcs.106.2.565. [DOI] [PubMed] [Google Scholar]
- Rieder CL, Alexander SP. Kinetochores are transported poleward along a single microtubule during chromosome attachment to the spindle. J Cell Biol. 1990;110:81–95. doi: 10.1083/jcb.110.1.81. [DOI] [PMC free article] [PubMed] [Google Scholar]
- Rieder CL, Hard R. Newt lung epithelial cells: cultivation, use, and advantages for biomedical research. Int Rev Cytol. 1990;122:153–220. doi: 10.1016/s0074-7696(08)61208-5. [DOI] [PubMed] [Google Scholar]
- Rodionov VI, Borisy GG. Self-centring activity of the cytoplasm. Nature (Lond) 1997a;386:170–173. doi: 10.1038/386170a0. [DOI] [PubMed] [Google Scholar]
- Rodionov VI, Borisy GG. Microtubule treadmilling in vivo. Science (Wash DC) 1997b;275:215–218. doi: 10.1126/science.275.5297.215. [DOI] [PubMed] [Google Scholar]
- Rodionov VI, Lim SS, Gelfand VI, Borisy GG. Microtubule dynamics in fish melanophores. J Cell Biol. 1994;126:1455–1464. doi: 10.1083/jcb.126.6.1455. [DOI] [PMC free article] [PubMed] [Google Scholar]
- Salmon, E.D., and J.C. Waters. 1996. A high resolution multimode digital imaging system for fluorescence studies of mitosis. In Analytical Use Of Fluorescent Probes In Oncology. E. Cohen and A. Hirschberg, editors. Plenum Press, New York. 349–356.
- Salmon ED, Inoue T, Desai A, Murray AW. High resolution multimode digital imaging system for mitosis studies in vivo and in vitro. Biol Bull (Woods Hole) 1994;187:231–232. doi: 10.1086/BBLv187n2p231. [DOI] [PubMed] [Google Scholar]
- Sammak PJ, Borisy GG. Direct observation of microtubule dynamics in living cells. Nature (Lond) 1988a;332:724–726. doi: 10.1038/332724a0. [DOI] [PubMed] [Google Scholar]
- Sammak PJ, Borisy GG. Detection of single fluorescent microtubules and methods for determining their dynamics in living cells. Cell Motil Cytoskeleton. 1988b;10:237–245. doi: 10.1002/cm.970100128. [DOI] [PubMed] [Google Scholar]
- Sammak PJ, Gorbsky GJ, Borisy GG. Microtubule dynamics in vivo: a test of mechanisms of turnover. J Cell Biol. 1987;104:395–405. doi: 10.1083/jcb.104.3.395. [DOI] [PMC free article] [PubMed] [Google Scholar]
- Saxton WM, Stemple DL, Leslie RJ, Salmon ED, Zavortink M, McIntosh JR. Tubulin dynamics in cultured mammalian cells. J Cell Biol. 1984;99:2175–2186. doi: 10.1083/jcb.99.6.2175. [DOI] [PMC free article] [PubMed] [Google Scholar]
- Schlichter LC, Pahapill PA, Chung I. Dual action of 2,3-butanedione monoxime (BDM) on K+ current in human lymphocytes. J Pharm Exp Ther. 1992;261:438–446. [PubMed] [Google Scholar]
- Schulze E, Kirschner M. New features of microtubule behavior observed in vivo. Nature (Lond) 1988;334:356–359. doi: 10.1038/334356a0. [DOI] [PubMed] [Google Scholar]
- Selden SC, Pollard TD. Phosphorylation of microtubule-associated proteins regulates their interaction with actin filaments. J Biol Chem. 1983;258:7064–7071. [PubMed] [Google Scholar]
- Selden SC, Pollard TD. Interaction of actin filaments with microtubules is mediated by microtubule-associated proteins and regulated by phosphorylation. Ann NY Acad Sci. 1986;466:803–812. doi: 10.1111/j.1749-6632.1986.tb38464.x. [DOI] [PubMed] [Google Scholar]
- Shelden E, Wadsworth P. Observation and quantification of individual microtubule behavior in vivo: microtubule dynamics are cell-type specific. J Cell Biol. 1993;120:935–945. doi: 10.1083/jcb.120.4.935. [DOI] [PMC free article] [PubMed] [Google Scholar]
- Shiina N, Gotoh Y, Nishida E. A novel homo-oligomeric protein responsible for an MPF-dependent microtubule-severing activity. EMBO (Eur Mol Biol Organ) J. 1992;11:4723–4731. doi: 10.1002/j.1460-2075.1992.tb05577.x. [DOI] [PMC free article] [PubMed] [Google Scholar]
- Shiina N, Gotoh Y, Kubomura N, Iwamatsu A, Nishida E. Microtubule severing by elongation factor 1 α. Science (Wash DC) 1994;266:282–285. doi: 10.1126/science.7939665. [DOI] [PubMed] [Google Scholar]
- Shaw SL, Yeh E, Bloom K, Salmon ED. Imaging GFP fusion proteins in Saccharomyces cerevisiae. . Curr Biol. 1997;7:701–704. doi: 10.1016/s0960-9822(06)00299-5. [DOI] [PubMed] [Google Scholar]
- Small JV. The actin cytoskeleton. Electron Microsc Rev. 1988;1:155–174. doi: 10.1016/s0892-0354(98)90010-7. [DOI] [PubMed] [Google Scholar]
- Small JV, Herzog M, Anderson K. Actin filament organization in the fish keratocyte lamellipodium. J Cell Biol. 1995;129:1275–1286. doi: 10.1083/jcb.129.5.1275. [DOI] [PMC free article] [PubMed] [Google Scholar]
- Soltys BJ, Borisy GG. Polymerization of tubulin in vivo: direct evidence for assembly onto microtubule ends and from centrosomes. J Cell Biol. 1985;100:1682–1689. doi: 10.1083/jcb.100.5.1682. [DOI] [PMC free article] [PubMed] [Google Scholar]
- Symons MH, Mitchison TJ. Control of actin polymerization in live and permeabilized fibroblasts. J Cell Biol. 1991;114:503–513. doi: 10.1083/jcb.114.3.503. [DOI] [PMC free article] [PubMed] [Google Scholar]
- Tanaka EM, Kirschner MW. Microtubule behavior in the growth cones of living neurons during axon elongation. J Cell Biol. 1991;115:345–363. doi: 10.1083/jcb.115.2.345. [DOI] [PMC free article] [PubMed] [Google Scholar]
- Tanaka E, Ho T, Kirschner MW. The role of microtubule dynamics in growth cone motility and axonal growth. J Cell Biol. 1995;128:139–155. doi: 10.1083/jcb.128.1.139. [DOI] [PMC free article] [PubMed] [Google Scholar]
- Terasaki M, Reese TS. Interactions among endoplasmic reticulum, microtubules, and retrograde movements of the cell surface. Cell Motil Cytoskeleton. 1993;29:291–300. doi: 10.1002/cm.970290402. [DOI] [PubMed] [Google Scholar]
- Theriot JA, Mitchison TJ. Actin microfilament dynamics in locomoting cells. Nature (Lond) 1991;352:126–131. doi: 10.1038/352126a0. [DOI] [PubMed] [Google Scholar]
- Theriot JA, Mitchison TJ. Comparison of actin and cell surface dynamics in motile fibroblasts. J Cell Biol. 1992;119:367–377. doi: 10.1083/jcb.119.2.367. [DOI] [PMC free article] [PubMed] [Google Scholar]
- Tran PT, Joshi P, Salmon ED. How subunits are lost from the shortening ends of microtubules. J Struct Biol. 1997a;118:107–118. doi: 10.1006/jsbi.1997.3844. [DOI] [PubMed] [Google Scholar]
- Tran PT, Walker RA, Salmon ED. A metastable intermediate state of microtubule dynamic instability that differs significantly between plus and minus ends. J Cell Biol. 1997b;138:105–117. doi: 10.1083/jcb.138.1.105. [DOI] [PMC free article] [PubMed] [Google Scholar]
- Vasiliev JM, Gelfand IM, Domnina LV, Ivanova OY, Komm SG, Olshevskaja LV. Effect of colcemid on the locomotory behavior of fibroblasts. J Embryol Exp Morphol. 1970;24:625–640. [PubMed] [Google Scholar]
- Vasquez RJ, Howell B, Yvon AMC, Wadsworth P, Cassimeris L. Nanomolar concentrations of nocodazole alter microtubule assembly in vitro and in vivo. Mol Biol Cell. 1997;8:973–985. doi: 10.1091/mbc.8.6.973. [DOI] [PMC free article] [PubMed] [Google Scholar]
- Vigers GP, Coue M, McIntosh JR. Fluorescent microtubules break up under illumination. J Cell Biol. 1988;107:1011–1124. doi: 10.1083/jcb.107.3.1011. [DOI] [PMC free article] [PubMed] [Google Scholar]
- Wade RH, Hyman AA. Microtubule structure and dynamics. Curr Opin Cell Biol. 1997;9:12–17. doi: 10.1016/s0955-0674(97)80146-9. [DOI] [PubMed] [Google Scholar]
- Walczak CE, Mitchison TJ, Desai A. XKCM1: a Xenopuskinesin-related protein that regulates microtubule dynamics during mitotic spindle assembly. Cell. 1996;84:37–47. doi: 10.1016/s0092-8674(00)80991-5. [DOI] [PubMed] [Google Scholar]
- Walker RA, O'Brien ET, Pryer NK, Soboeiro MF, Voter WA, Erickson HP, Salmon ED. Dynamic instability of individual microtubules analyzed by video light microscopy: rate constants and transition frequencies. J Cell Biol. 1988;107:1437–1448. doi: 10.1083/jcb.107.4.1437. [DOI] [PMC free article] [PubMed] [Google Scholar]
- Walker RA, Inoue S, Salmon ED. Asymmetric behavior of severed microtubule ends after ultraviolet-microbeam irradiation of individual microtubules in vitro. J Cell Biol. 1989;108:931–937. doi: 10.1083/jcb.108.3.931. [DOI] [PMC free article] [PubMed] [Google Scholar]
- Wang YL. Exchange of actin subunits at the leading edge of living fibroblasts: possible role of treadmilling. J Cell Biol. 1985;101:597–602. doi: 10.1083/jcb.101.2.597. [DOI] [PMC free article] [PubMed] [Google Scholar]
- Waterman-Storer CM, Salmon ED. Microtubule dynamics: treadmilling comes around again. Curr Biol. 1997;7:R369–R372. doi: 10.1016/s0960-9822(06)00177-1. [DOI] [PubMed] [Google Scholar]
- Waterman-Storer CM, Sanger JW, Sanger JM. Dynamics of organelles in the mitotic spindles of living cells: membrane and microtubule interactions. Cell Motil Cytoskeleton. 1993;26:19–39. doi: 10.1002/cm.970260104. [DOI] [PubMed] [Google Scholar]
- Waters JC, Salmon ED. Pathways of spindle assembly. Curr Opin Cell Biol. 1997;9:37–43. doi: 10.1016/s0955-0674(97)80149-4. [DOI] [PubMed] [Google Scholar]
- Waters JC, Mitchison TJ, Rieder CL, Salmon ED. The kinetochore microtubule minus end disassembly associated with poleward flux produces a force that can do work. Mol Biol Cell. 1996;7:1547–1558. doi: 10.1091/mbc.7.10.1547. [DOI] [PMC free article] [PubMed] [Google Scholar]
- Yu W, Centonze VE, Ahmad FJ, Baas PW. Microtubule nucleation and release from the neuronal centrosome. J Cell Biol. 1993;122:349–359. doi: 10.1083/jcb.122.2.349. [DOI] [PMC free article] [PubMed] [Google Scholar]
- Zigmond SH, Levitsky HI, Kreel BJ. Cell polarity: an examination of its behavioral expression and its consequences for polymorphonuclear leukocyte chemotaxis. J Cell Biol. 1981;89:585–592. doi: 10.1083/jcb.89.3.585. [DOI] [PMC free article] [PubMed] [Google Scholar]