

Abstract
The field of lipidomics is one of the most rapidly expanding areas of systems biology research. Considering the uniqueness and complexity of the lipidome in the nervous system (i.e., neurolipidome), neurolipidomics remains quite challenging but exciting. With the recent development of mass spectrometry (MS)-based lipidomics, particularly the rapid improvement of multi-dimensional MS-based shotgun lipidomics, much progress has been made in neurolipidomics. As the accelerated development of future technologies enables lipidomics penetrance into lower and lower abundance regions of mass contents of individual lipid molecular species, it can be anticipated that many biochemical mechanisms underlying lipid metabolism critical to neuronal disease states will be increasingly uncovered. Through exploiting the information content inherent in the complexity of neuronal lipid composition and kinetic turnover which can be revealed by neurolipidomics, substantial insights into neuronal plasticity and gene function can be gathered. Through neurolipidomics, the markers for these neuronal diseases which identify pathological alterations and are diagnostic of disease onset, progression or severity may potentially be discovered. Accordingly, with neurolipidomics, our understanding of the complexities of the nervous system will be undoubtedly accelerated, as many mysteries are resolved.
Keywords: Alzheimer’s disease, Apolipoprotein E, ceramide, 13C deisotoping, 13C isotopomer, Electrospray Ionization, Lipidome, Lipidomics, Mass Spectrometry, Multi-Dimensional Mass Spectrometry, Neurolipidomics, Phospholipids, Plasmalogen, Sphingolipids, Shotgun Lipidomics, Sulfatide, Review
2. INTRODUCTION
Lipidomics is a rapidly expanding research frontier (1-3), following the tremendous progresses of genomics and proteomics, all of which constitute the family of systems biology (4). The development of this new field is greatly driven by the need for the determination of the mechanisms of lipid-mediated disease; the identification of the phenotypic functions of genes involved in lipid metabolism; the discovery of lipid-related biomarkers (each of which can be used to predict an adverse event); and the evaluation of the efficacy of any intervention, among others. Lipidomics is defined as the large-scale study of the structure and function of lipids (i.e., the lipidome) within biological samples (e.g., tissues, organs, cells, organelles, subcellular membranes or microdomains (e.g., caveolae and/or lipid rafts), and biological fluids) (1), through the integration of multiple modern technologies (including mass spectrometry (MS), nuclear magnetic resonance (NMR) spectroscopy, fluorescence spectroscopy, and microfluidic devices). Although at its current stage, this field has been predominantly focused on the identification and quantitation of different lipid molecular species, the research in lipidomics will expand to include the dynamics of lipidomes, the subcellular organizations among lipidomes, and the interaction of lipids with lipids, proteins, other cellular moieties, and aggregate structures.
The recent emergence of lipidomics is due to the great recent technological advances (e.g., MS) coupled with the recent recognition of the role of lipids in many metabolic diseases (e.g., obesity, atherosclerosis, stroke, hypertension, and diabetes, which now are collectively referred to as the “metabolic syndrome” (5)) and neurodegenerative diseases (e.g., Alzheimer’s disease (AD) (6)). It has been widely recognized that the metabolism of individual lipid molecular species or individual lipid classes is interwoven and that it is not enough to conduct research on lipid metabolism only from an isolated system or only from the perspective of one molecular species or one lipid class. Therefore, the demands on a systems biology approach for studies of the metabolism of the entire lipidome of a given organelle, cell type, organ, biological system, or species greatly accelerates the development and progress of lipidomics. In the advancement of lipidomics, MS techniques (e.g., electrospray ionization MS (ESI/MS) and matrix-assisted laser desorption/ionization MS (MALDI/MS)) have played leading roles in lipid characterization, identification, and quantitation (see articles in this special issue). Particularly, ESI/MS is the most prominent and has enjoyed the most success since its advantages are apparent as discussed previously (7). Thus, it is evident that ESI/MS-based lipid analysis has become an essential tool for measuring cellular lipidomes during cellular perturbations and disease states (see (1, 7-12) for recent reviews).
Studies utilizing a lipidomics approach for the characterization of the nervous system and its disease states are being conducted in an increasing rate. However, due to its specificity and complexity, lipidomics research in the nervous system is quite challenging, exciting, and unique. These features of neuronal lipidomics lead to the creation of a particular subset of lipidomics, which has now been named “neurolipidomics” (13). Following the discussion of the challenge of neurolipidomics, the techniques available for facilitating this challenge will be summarized and some examples of studies in neurolipidomics will be given in this article. It is the author’s hope that this introductory review will further catalyze the growth of this sub-field and any interested readers are encouraged to consult other papers related to this topic (14-18).
3. THE CHALLENGES OF NEUROLIPIDOMICS
3.1. The nervous system is anatomically complicated and diverse
The nervous system is composed of the central nervous system (CNS) and the peripheral nervous system (PNS) (Figure 1). The CNS consists of the brain and the spinal cord. The brain is further divided into the brain stem (which includes the medulla, pons, middle brain, and cerebellum) and cerebrum (which consists of the telencephalon and the diencephalon) (19). The telencephalon includes the cerebral cortex, basal ganglia, and olfactory bulbs and the diencephalon includes the thalamus, hypothalamus, and epithalamus. The cerebral cortex is further divided into four sections: the occipital lobe, the temporal lobe, the parietal lobe, and the frontal lobe, each of which is associated with at least one distinct function (e.g., vision, hearing, and speech). The PNS consists of ganglia (which are enriched with neuronal cell bodies) and nerve bundles (which are comprised of axons, myelin sheaths, vascular capillaries, collagens, and other connective tissues). It can be speculated that the lipidome of each nervous system structure or region is different for the performance of distinct functions.
Figure 1.
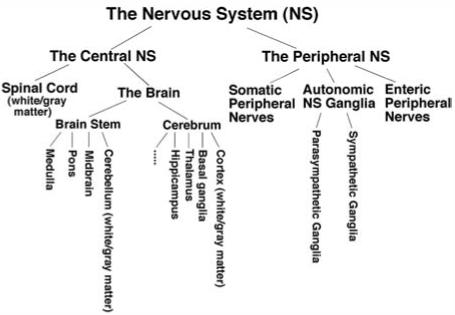
Schematic classification of the nervous system.
3.2. The nervous system contains the largest diversity of lipid classes and lipid molecular species
In comparison to other organs and/or systems in mammalians, the nervous system contains the largest diversity of lipid classes and lipid molecular species. For example, in addition to the presence of diverse phospholipid classes, the nervous system also contains a large portion of (glyco)sphingolipid classes which is so complex that this subset of the lipidome has now been termed as the “sphingolipidome” (20). Thousands of sphingolipid molecular species are present in the sphingolipidome and the majority of these sphingolipid molecular species are present in the nervous system. A comprehensive classification and nomenclature of the sphingolipidome can be found at the website of www.sphingomap.com. Cholesterol is very abundant in the nervous system. Thus, most of cholesterol metabolites can be found in the system. Moreover, many neurosteroids are uniquely present in the system (21).
To accommodate the different chemical linkages of aliphatic chains to the sn-1 position of the glycerol backbone in phospholipids, each phospholipid class is further divided into three subclasses (i.e., phosphatidyl, plasmenyl, and plasmanyl), corresponding to ester, vinyl ether, and alkyl ether linkages, respectively. Although the phosphatidyl subclass of phospholipids is predominant in most cellular membrane lipids, plasmenyl subclass species are the major phospholipid component in neuronal cell membranes (22, 23). Lipid molecular species containing very long fatty acyl chains (e.g., 22 and 24 carbons) are enriched in the nervous system relative to the other organs. Intriguingly, we have very recently identified that triacylglycerol (TG) mass content is abundant in the PNS ganglia and these TG molecular species contain a relatively large portion of acyl chains with odd-numbered carbons (24).
3.3. The mass range of neuronal lipid classes and molecular species is very broad
Nervous tissues contain large amount of lipids. The mass levels of lipids in nervous tissues are second only to the fat pads (i.e., adipose). Specifically, the mass content ratio of lipids to proteins is approximately 2000 nmol lipids/mg of protein (or approximately 0.2 mmol lipids/g of tissue wet weight) in white matter and approximately 800 nmol lipids/mg of protein while the fat pads contain up to 5000 nmol lipids/mg of protein in which over 80 mol% of lipids are TG. For comparison, liver tissues contain approximately 500 nmol lipids/mg of protein; heart or skeletal muscles contain approximately 250 nmol lipids/mg of protein; and most cultured cells have approximately 500 nmol lipids/mg of protein. In contrast to the fat pads, whose primary role is to serve as a reservoir for energy (i.e., TG) storage, nervous tissues are composed of a large variety of lipid classes, each of which plays a diverse role in neuronal functions.
3.4. The diversified neuronal lipids play multiple specific roles in the nervous system
The diversified neuronal lipids play multiple specific roles in the nervous system other than their general functions (e.g., forming an impermeable barrier separating intracellular and extracellular compartments, providing an appropriate hydrophobic matrix for membrane protein function and protein-lipid/protein-protein interactions, acting as reservoirs for energy depot which can be rapidly accessed at times of demand, and serving as the source of lipid second messengers of signal transduction). Indeed, lipid signaling in the nervous system is apparently much complicated than a second messenger does in a cell type. Piomelli has recently outlined the involvement of four lipid signaling pathways in the nervous system from neocortex to the processing of behavior (14). The enrichment of sphingolipids in myelin sheath relative to other locations in the nervous system and other systems indicates the involvement of these specific lipids in myelin packing and function which have been investigated through different animal models (25-27). Despite the enrichment of plasmalogen in the neurolipidome, a clear relationship between the abundance of plasmalogen and its role in the nervous system remains to be determined (28). However, it is demonstrated that membranes comprised of plasmalogen possess a compact membrane conformation and unique membrane dynamics in comparison to membranes comprised of its diacyl counterpart (29) and that plasmalogen facilitates membrane fusion and cell-cell communication (30, 31).
3.5. Some proteins related to lipids play different roles in the nervous system compared to other organs
Furthermore, most of the proteins are expressed in both the nervous system and the peripheral organs. However, whether an identical protein plays an identical role in both places remains to be determined since some proteins possess distinct functions in the nervous system vs. other organs or systems. Apolipoprotein E (apoE) is one example of such proteins. ApoE plays a prominent role in the transport and metabolism of plasma cholesterol and TG through its ability to interact with the low density lipoprotein (LDL) receptor and the LDL receptor-related protein (32, 33). However, such a role of apoE in the CNS is uncertain, but many studies demonstrated that apoE does not affect the cholesterol mass content or the phospholipid mass levels and composition in the CNS as a whole, although apoE may modulate cholesterol and phospholipid homeostasis in selective subcellular membrane compartments (34). In contrast to such a uncertainty, it has been demonstrated that apoE mediates sulfatide trafficking and metabolism in the CNS (35) and the PNS (Cheng, Jiang and Han, unpublished data).
3.6. Many neuronal diseases and/or disorders are associated with lipids
Apparently, any alteration in lipid metabolism, trafficking, and homeostasis would result in an associated disorder and/or disease. Accordingly, it is evident that more disorders and/or diseases that associated with the presence of the largest variety of lipid classes are present in the nervous system than any other organs or systems. Notably, plasmalogen deficiency is associated with cerebro-hepatorenal (Zellweger) syndromes and other similar peroxisomal disorders such as Refsum’s disease and Rhizomelic chondrodysplasia punctata (36); abnormal metabolism of cholesterol is a risk factor for multiple neuronal diseases such as stroke and AD (37-39); sulfatide accumulation is linked with multiple human diseases such as metachromatic leukodystrophy (40) whereas its deficiency is associated with AD (6, 41); cerebroside accumulation is connected with Krabbe’s disease (42); ceramide accumulation is associated with Farber’s disease (43); gangliosides accumulation is associated with Tay-Sachs disease and Sandhoff’s disease (44); and elevation of sphingomyelin and/or cholesterol mass content in the brain is present in Niemann-Pick disease (45, 46); among others. Even some common neurological disorders such as bipolar and Schizophrenia are likely associated with abnormal lipid metabolism.
3.7. Neurolipidomics is challenging but developing
Accordingly, these specificity and complexity in lipid metabolism, trafficking, homeostasis, and functions make the neurolipidome complex and neurolipidomics challenging. However, owing to the recent developments in lipidomics, particularly those in MS-based techniques (which will be further discussed in next section), it is now possible to conduct tissue specific, disease specific, lipid class specific, or gene specific neurolipidomic studies. As the dramatic improvement of MS and the better understanding of lipid chemistry for MS analysis in recent years, the detection limit has been lowered from the concentration of low pmol per microliter (47) to the level of atmol per microliter (48, 49). Therefore, the dynamic range for analyses of lipidomes has been dramatically extended so that we are currently able to identify and quantify those lipid classes only present in a very low mass content (e.g., lysophospholipids, ceramide, sphingosine-1-phosphate) (48, 50) and/or reach to the analyses of very low-abundant molecular species in many lipid classes that are present in medium or high total mass content (e.g., ethanolamine glycerophospholipids (GPEtn), cardiolipin) (48, 49). It can be expected that analyses of neurolipidomes in the near future will rather be a challenge of sample preparation and tissue isolation than an issue of the lipid analysis.
4. RECENT DEVELOPMENTS OF LIPIDOMICS FOR NEUROLIPIDOMES
Essentially, there are three main, independently-developed ESI/MS-based approaches present in current lipidomics practice, each of which possesses different advantages and some limitations which has been extensively discussed previously (7). These approaches are the multi-dimensional MS-based shotgun lipidomics after intrasource separation, the HPLC-coupled ESI/MS method, and the tandem mass spectrometry-based shotgun lipidomics. Both of the “shotgun lipidomics” approaches are developed after direct infusion and potentially both can be used as global analyses of individual lipid molecular species directly from a lipid extract of a biological sample without pre-chromatographic separation. An alternative approach of MS-based shotgun lipidomics has very recently been reported for profiling relative changes between different states (51, 52). In the LC-coupled ESI/MS method, both straight phase and reversed phase columns have been employed for lipid profiling. In this section, the principles of each approach, particularly the multi-dimensional MS-based shotgun lipidomics, will be briefly described. Moreover, a couple of general issues that are commonly present in lipidomics and related to the accurate quantitation of individual lipid molecular species will also be discussed.
4.1. The brief principles of multi-dimensional mass spectrometry-based shotgun lipidomics
Multi-dimensional MS-based shotgun lipidomics exploits the synergy between the proximal separation of lipid classes in the ion source and subsequent multi-dimensional mass spectrometry. Development of the multi-dimensional MS-based shotgun lipidomics approach was initiated at the very beginning stage when ESI/MS was employed for lipid analysis (47, 53). It dramatically evolved after the development of two-dimensional MS (54, 55) and has now been developed into a quite matured technology in lipidomics (7, 12) although further improvements in some aspects of this technology are still necessary. This technology includes multiple steps: the multiplexed extractions, intrasource separation and selective ionization, multi-dimensional MS identification of individual lipid molecular species, two-step quantitation, and data processing.
4.1.1. Multiplexed extractions
Sample preparation is the first key step in this shotgun lipidomics approach, which is so important that no one can do well on shotgun lipidomics analysis without a successful sample preparation. The lipids of each biological sample (commonly containing 50 to 500 μg of protein mass content from the cell, tissue, or membrane samples, or a small volume of biological fluids) can be extracted by solvent(s) under acidic, basic, and/or neutral conditions (i.e., multiplexed extractions). The pre-selected internal standards (at least one internal standard for each lipid class) are added to the extraction mixture prior to the conduction of extraction. Selection of an internal standard for a lipid class has been discussed in detail (7). The lipid extract should be further properly diluted to a concentration of less than 100 pmol per microliter of total lipids in chloroform/methanol (1:1, v/v) or other concentration depending on the solvents and analytical method employed to warrant the availability of a linear dynamic range prior to direct infusion of the diluted lipid solution to an ESI ion source. In addition, since a comparatively large volume of chloroform is used during extraction and the extraction procedure is repeated at least twice (i.e., 2 ml x 2) to extract a small amount of lipids (less than 1 mg of total lipids from the aforementioned biological samples), a good recovery of most of lipid classes is obtained. Moreover, the effect of a incomplete recovery of a lipid class on quantitation of this lipid class is eliminated by addition of at least one internal standard for the lipid class prior to the extraction. By these two measures, the differential recoveries of different individual molecular species in a lipid class are only a secondary factor and can be neglected.
4.1.2. Intrasource separation
ESI ion source behaves like an electrophoretic cell and can selectively separate different charged moieties under high electrical potential (typically ∼ 4 kV) (56, 57). Since different lipid classes possess different electrical properties, largely depending on the nature of the polar head groups (1, 7), electrospray ion source can be used to partially resolve lipid classes in a crude lipid extract into different categories based on the intrinsic electrical properties of each lipid class, which has now been referred to as intrasource separation of lipids (7, 12, 55). A successful strategy for intrasource separation of lipid classes based on their differential intrinsic electrical properties has been previously discussed in detail (1, 7, 12, 55) and demonstrated through a model mixture of phospholipids that represent the three categories of lipids (58). Through this approach, a comprehensive series of mass spectra can be obtained from a typical lipid extract of a biological sample (e.g., mouse cortex) (Figure 2).
Figure 2.
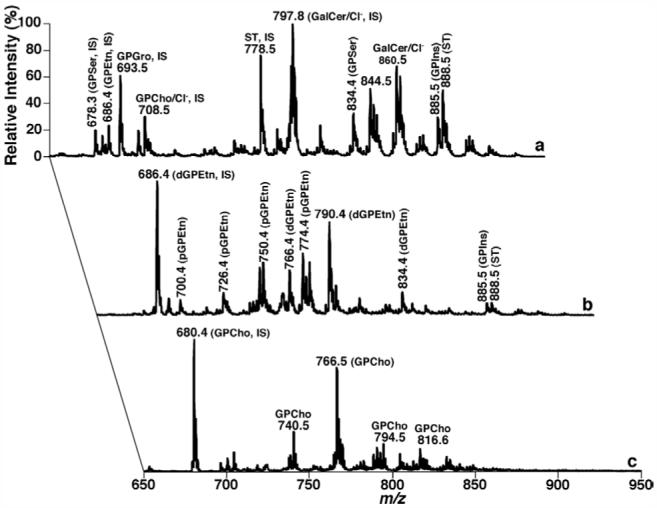
Electrospray ionization mass spectrometric analyses of the mouse cortex lipidome after intrasource separation and selective ionization. Spectrum a was acquired in the negative-ion mode directly from a lipid extract that was diluted to less than 50 pmol of total lipids per microliter. Spectrum b was acquired again in the negative-ion mode from the diluted lipid solution as used for spectrum a after addition of approximately 25 pmol LiOH per microliter to the lipid solution. Spectrum c was acquired in the positive-ion mode from the identical diluted lipid solution as used in spectrum b after direct infusion. “IS” denotes internal standard. GPCho is choline glycerophospholipid; GPEtn stands for ethanolamine glycerophospholipid; pGPEtn represents plasmalogen GPEtn; GPSer represents phosphatidylserine; GPIns indicates phosphatidylinositol; GalCer denotes galactosylceramide; and ST is sulfatide. All mass spectral traces are displayed after normalization to the base peak in each individual spectrum.
4.1.3. Multi-dimensional mass spectrometric identification of individual lipid molecular species
Multi-dimensional MS is analogous to multi-dimension nuclear magnetic resonance spectroscopy. Each additional dimension to the first dimension (i.e., a primary ion mass spectrum) in the family of multi-dimensional MS has been defined as a series of ramped changes in an instrumental condition (12). These instrumental variations include, but are not limited to, changes in ionization conditions (e.g., source temperature and spray voltage), in fragmentation conditions (e.g., fragments monitored in the tandem MS mode (e.g., neutral loss scanning or precursor ion scanning), collision gas pressure, collision energy, collision gas), and sample conditions (e.g., pH, solvent, concentration) (12). One dimension (which is frequently used to identify individual lipid molecular species) is the change in the specific loss of a neutral fragment or the yield of a fragmental ion in the tandem MS modes. Each specific loss of a neutral fragment or each specific fragmental ion in the tandem MS modes (i.e., neutral loss scanning or precursor ion scanning, respectively) identifies a building block of the lipid class (or group) of interest (12). For example, three moieties linked to the hydroxy groups of glycerol can be recognized as three building blocks and if we can identify these building blocks, then we are able to identify each individual glycerol-derived lipid molecular species in a given sample (12).
Similarly, Figure 3 shows a simplified structure of the entire sphingolipidome with three building blocks. The building block I (B1) represents a different polar moiety (linked to the oxygen at the C1 position of sphingoid base) including hydrogen, phosphoethanolamine, phosphocholine, galactose, glucose, lactose, sulfated galactose, and other complex sugar groups (corresponding to ceramide, ceramide phosphoethanolamine, sphingomyelin, cerebroside, glucosylceramide, lactosylceramide, sulfatide, and other glycosphingolipids such as gangliosides, respectively) (Figure 3). The building block II (B2) represents fatty acyl chains (acylated to the primary amine at the C2 position of sphingoid base) with or without the presence of a hydroxyl group which is usually located at the alpha or omega position (Figure 3). The building block III (B3) represents the aliphatic chains in all of possible sphingoid bases, which are carbon-carbon linkage to the C3 position of sphingoid bases and vary with the aliphatic chain length, the degree of unsaturation, the presence of branch, and the presence of an additional hydroxyl group (Figure 3). If we can identify these three building blocks, we are able to identify individual lipid molecular species of the sphingolipidome in a given sample. The crossing peaks of a given primary molecular ion in the first dimension from the building blocks in the second dimension represent the fragments of this given molecular ions under the conditions. Analysis of these crossing peaks (i.e., the fragments) allows us to identify the structure of the given molecular ion (12). For example, Figure 4 demonstrates the analyses of ceramide molecular species in the lipid extract of human occipital gray matter by two-dimensional MS which identifies the presence of over 40 ceramide molecular species. Specifically, the building block analyses of NL 327.3 and NL256.2 represent the ceramide molecular species containing sphingosine with and without the presence of a hydroxyl group in fatty amide, respectively; the building block analyses of NL 329.3 and NL 258.2 show the ceramide molecular species containing sphinganine with and without the presence of a hydroxyl group in fatty amide, respectively; and the building block analyses of NL 355.4 and NL 284.3 indicate the ceramide molecular species containing C20-sphingoid base with and without the presence of a hydroxyl group in fatty amide, respectively. In addition, the building block analyses of NL 240.2, NL 242.2, and NL 268.2 can be used for quantitation of ceramide molecular species in each individual subclasses of ceramide as previously described (50).
Figure 3.
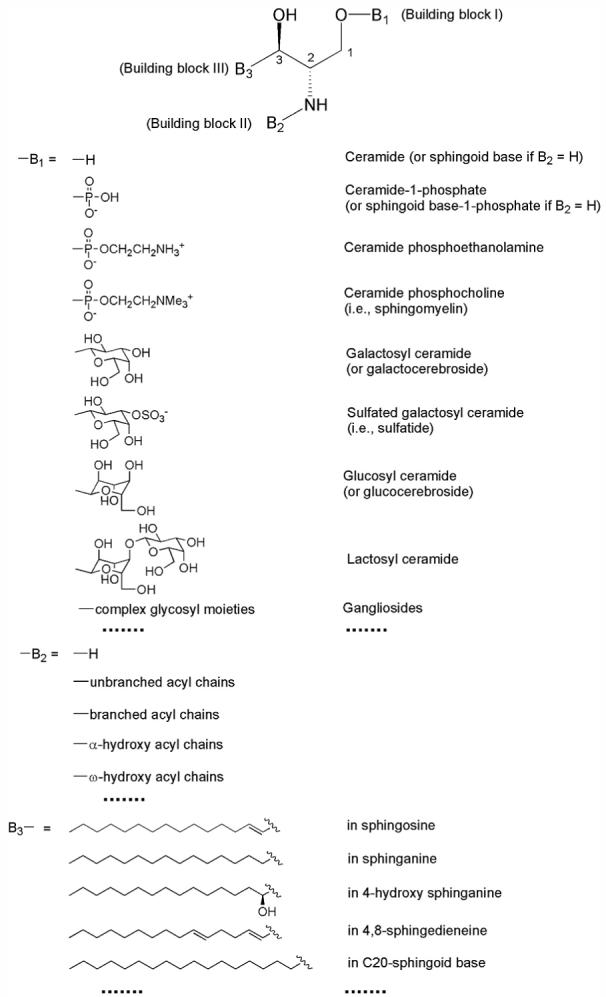
A simplified structural list of sphingolipidome with three building blocks. The building block I (B1) represents a different polar moiety (linked to the oxygen at the C1 position of sphingoid base). The building block II (B2) represents fatty acyl chains (acylated to the primary amine at the C2 position of sphingoid base) with or without the presence of a hydroxyl group which is usually located at the alpha or omega position. The building block III (B3) represents the aliphatic chains in all of possible sphingoid bases, which are carbon-carbon linked to the C3 position of sphingoid bases and vary with the aliphatic chain length, degree of unsaturation, the presence of branch, and the presence of an additional hydroxyl group.
Figure 4.

Analysis of ceramide molecular species in a lipid extract of post-mortem human occipital white matter by multi-dimensional mass spectrometry-based shotgun lipidomics. Lipids in human occipital white matter were extracted by a modified Bligh-Dyer procedure in the presence of 1 nmol C17:1 ceramide (used as an internal standard)/mg protein and 10 mM of LiCl. The lipid extract was directly infused into the ESI ion source using a Harvard syringe pump at a flow rate of 4 microliter per min after dilution of the extract to a concentration of approximately 100 pmol per microliter in 1:1 chloroform/methanol. A conventional ESI mass spectrum in the negative-ion mode was acquired prior to analysis of the building blocks of ceramide molecular species by neutral loss (NL) scanning. These building blocks of ceramide molecular species including sphingoid bases of sphingosine (NL 240.2, NL 256.2, and NL 327.3), sphinganine (NL 242.2, NL 258.2, and NL 329.3), and C20-sphingoid base (NL 268.2, NL 284.3, and NL 355.3) with or without presence of hydroxyl group in fatty amide chains as previously described (50). “IS” denotes internal standard; Cer stands for ceramide; CL represents doubly-charged cardiolipin; and GPSer represents phosphatidylserine. All mass spectral traces are displayed after normalization to the base peak in each individual spectrum. (Han, Unpublished data).
4.1.4. Two-step quantitation of individual lipid molecular species using multi-dimensional mass spectrometry
After identification of each individual molecular ions of a lipid class, quantitation in shotgun lipidomics is performed by a two-step procedure (12, 59). First, the abundant and non-overlapping molecular species of a class are quantified by ratiometric comparisons with a preselected internal standard of the class after 13C de-isotoping (which has been previously described (7, 49, 54)). Next, either all or some of the quantified molecular species of the class plus the pre-selected internal standard are used as standards to quantify the mass content of other lowabundance or overlapping molecular species using one or multiple tandem mass traces (each of which represents a specific building block of the class of interest) by two-dimensional MS. Through use of this second step in the quantitation process, the linear dynamic range of quantitation can be dramatically extended by eliminating background noise and by filtering the overlapping molecular species through a multi-dimensional approach (7). Of course, additional standards can be added if necessary, but in most cases, the naturally occurring distribution of acyl chain length and unsaturation is usually sufficient. It should be emphasized that it is important to select abundant molecular ions as standards for the second step of quantitation to minimize the propagation of experimental errors.
4.1.5. Bioinformatics and data processing
Bioinformatics for the multi-dimensional MS-based shotgun lipidomics, which includes a large variety of information about the fragments, physical properties, and chemical natures of lipid molecular species that can be determined by multi-dimensional MS, is under developing. However, an excel-based macro program which used the principles described previously (55) has been developed and will be described elsewhere. This program has been routinely used for ion peak selecting, baseline correcting, 13C isotopomer de-isotoping, ion peak ratiometrically-comparing, two-step quantitation performing, and data output.
4.2.Other mass spectrometry-based lipidomics approaches
4.2.1.HPLC-MS approach for lipidomics
When this approach is employed for quantitation of individual lipid molecular species, ESI/MS is essentially used as a mass detector (i.e., similar to a UV detector or other detectors, which is connected to an HPLC system) in most cases. The determined total ion current (TIC) can be used to reconstitute the TIC chromatograph for the purpose of lipid quantitation if a standard curve of a compound is established under identical experimental conditions. The combination of ESI/MS detection with HPLC separation and the sensitivity of TIC compared to other detection modalities make this approach an obvious choice for lipid profiling and for quantitation if great care is taken in establishing comparisons of ionization efficiencies of the molecules of interest with appropriate standard curves. Indeed, such a combination has been employed for many applications for the identification of lipid molecular species. However, lipid quantitation using this methodology on a large scale is quite limited (61) although analysis of a small number of lipids whose standard curves can be generated is quite common (62).
4.2.2.Tandem mass spectrometry-based shotgun lipidomics
In this approach, quantitative analyses of lipids after ESI is entirely based on tandem mass spectrometry (10, 60, 63, 64). At least two molecular species of a lipid class of interest are added as internal standards to the lipid extract during extraction of a biological sample. The choice of these standards should involve at least two criteria. One is that these compounds should be absent or present in very minimal amounts in the original lipid extract. The other is that these compounds should represent the physical properties (e.g., acyl chain length and unsaturation) of the entire lipid class of interest as closely as possible. Then, a unique tandem mass spectrometric analysis in either neutral loss or precursor-ion mode relative to the lipid class is performed. The concentration of each individual molecular species of the class of interest is then calculated from its ion peak intensity determined by the tandem mass spectrum by comparison with those of the internal standards. Using these standards, many experimental factors that may introduce experimental error are essentially eliminated. The advantages of this methodology are apparent and it has become increasingly popular for analyses of many selective lipid classes. However, some limitations of this method exist including the difficulty in selection of the standards and the effects of differential fragmentation kinetics of different molecular species on accurate quantitation, limited dynamic range for some lipid classes for each of which a sensitive tandem MS profiling is lack, among others (see discussions in ref. (7)).
4.3.Important issues that should be paid attention on in mass spectrometry-based lipidomics
4.3.1. Analysis in the low concentration region is the key for accurate quantitation of lipid molecular species
Unlike other analytes, lipids form aggregates as the lipid concentration increases and the degree of aggregation depends on the chemical properties of each individual molecular species including the polarity of the head group, the length of aliphatic chains, and the degree of unsaturation. Moreover, formation of lipid aggregation is also dependent on the solvent employed. The higher the hydrophobicity of a lipid molecular species and the more polar the solvent system is employed, the lower the concentration at which the lipids will aggregate. It is very difficult to ionize the lipid at its aggregate state and most of the aggregated particles will end up in the waste. Thus, as the lipid concentration increases, the ionization efficiency of lipid molecular species, particularly the ones containing long and saturated fatty acyl chains dramatically decreases as previously demonstrated (65). Therefore, it should be kept in mind that the lipid concentration in shotgun lipidomics as well as other ESI/MS techniques must be lower than that favoring aggregate formation. The upper limits of the total lipid concentrations of a biological extract is approximately 100 pmol per microliter in 2:1, 50 (up to 100 for multi-dimension MS due to intrasource separation) pmol per microliter in 1:1, and 10 pmol per microliter in 1:2 of chloroform/methanol. In such a low concentration region, ionization efficiency of different individual molecular species from the identical class is essentially identical (i.e., the commonly-called “ion suppression” is minimal) as demonstrated (49).
4.3.2. Internal control is essential in mass spectrometry-based lipidomics
The absolute intensity determined from many detectors (e.g., a UV detector or NMR) after calibration is directly proportional to the concentration of an analyte in the linear dynamic range which is so stable and less sensitive to the environment (e.g., the presence of “insert” substances) that independent researchers can essentially repeat a measurement. In contrast, the determination of the ion intensity of an analyte during LC/MS (including direct infusion) analysis depends on many factors including the sample preparation, the ionization conditions, the tuning conditions for the analyzer, and the analyzer and the detector used in the mass spectrometer, among others. As MS instruments become more and more sensitive, the influences of these factors on LC/MS get more and more severe. Thus, it would have some difficulties for researchers to repeat a measurement of absolute amounts of TIC for an analyte in an identical solution. In the case of lipidomics, we try to analyze a large number of lipid molecular species. Multiple repeated measurements from separate sample preparations are always necessary. Therefore, any changes during sample preparations (e.g., different amounts of aqueous residue in each sample) or ionization conditions will dramatically affect the determination of the absolute amounts of TIC of each individual ion, leading to a very large experimental error. To eliminate this type of artifact, one should include at least one standard for each individual lipid class as an internal control before MS analysis (it would be better to include them during lipid extraction) for comparison of all measurements. Accordingly, any unexpected changes during lipid analyses can be internally controlled. Any results obtained from sample analyses without any internal control are quite doubtful.
4.3.3. The effects of 13C isotopomer on quantitation of lipid molecular species should be considered
There are two types of effects of 13C isotopomer on lipid quantitation as previously described (7, 54) if deisotoping is not applied prior to quantitation. The first type of effect is resulting from the differences of carbon numbers between the individual lipid molecular species of interest and the selected internal standard for these species. The second type of effect is the one resulting from M+2 isotopomer of a molecular species on the quantitation of another molecular species in the same class which contains one less double bond. The magnitudes of these effects are varied and the correction factors of these effects can be calculated as described previously (7, 54). If multi-dimensional MS-based shotgun lipidomics is the choice for lipidomics, both effects on quantitation have to be considered. When tandem MS-based shotgun lipidomics is used for lipidomics, the first type of effect can be eliminated by using two or more internal standards of a class in the different mass regions but the type II effect should still be corrected. Whether it is necessary to correct these effects in HPLC-MS-based approach is case dependent. If HPLC can resolve a lipid class into individual molecular species and a calibration curve of each individual molecular species is established, no 13C isotopomer effects need to be considered. Otherwise, the effects of 13C isotopomer on quantitation should always be corrected or de-isotoping be performed. In practice, such correction has been applied in multiple cases (61, 66).
4.3.4. The effect of baseline noise on quantitation of low-abundant lipid molecular species should be considered
Baseline noise resulting from either chemical noise or electronic noise is always present in the mass spectrometric analysis. This issue is not a problem for quantitation of the abundant lipid molecular species in which the baseline ion current (or ion counts) is accounting for less than 5% of the ion current of each individual molecular ion in lipidomics. However, when our interests turn into low-abundant lipid molecular species, the effect of baseline noise on quantitation becomes severe and correction for the effect has to be considered, particularly when a quadrupole-type instrument is used for quantitation of lipids (49). In multi-dimensional MS-based shotgun lipidomics, this effect has been considered by quantitation of any individual ion by using the second quantitation step (see above) if the baseline ion current is accounting for over 5% of the ion current of an individual ion of interest. The effect of baseline noise on quantitation through TIC chromatograph reconstitution in the HPLC-MS approach should always be kept in mind since baseline noise is not easily detectable and is usually variable when a mobile phase gradient is employed.
5. EXAMPLES OF NEUROLIPIDOMICS
5.1. Neurolipidomics reveals distinct lipid profiles of ethanolamine glycerophospholipids present in gray matter and white matter
By using multi-dimensional MS-based shotgun lipidomics, we have identified distinct lipid profiles of GPEtn in gray matter and white matter in human brain (23). Briefly, negative-ion ESI/MS analyses of chloroform extracts of cortex gray matter from cognitively normal, post-mortem subjects in the presence of a small amount of LiOH demonstrate multiple predominant deprotonated ion peaks corresponding to GPEtn molecular species (Figure 5A). The enrichment of arachidonic and docosahexaenoic acids in lipid extracts of gray matter is demonstrated by the presence of abundant ion peaks in precursor-ion scanning of m/z 303.3 and 327.3, respectively, during multi-dimensional MS analyses (spectra not shown). The analysis results are remarkable for the presence of over 80 mol% of GPEtn in gray matter containing four or more double bonds at the sn-2 position and remarkable also for the presence of 55-60 mol% plasmalogen GPEtn (pGPEtn) in gray matter (23). In contrast to gray matter, negative-ion ESI/MS analyses of lipid extracts of white matter from different brain regions (e.g., superior frontal cortex, superior temporal cortex, inferior parietal cortex and cerebellum) from cognitively normal, post-mortem subjects in the presence of a small amount of LiOH demonstrated only one predominant peak at m/z 726.5 corresponding to 18:1-18:1 pGPEtn (Figure 5B). In addition, the analysis results found in white matter are remarkable for the facts that over 85 mol% of GPEtn are plasmalogen (vs. 55-60 mol% of GPEtn in gray matter) and over 50 mol% of GPEtn are comprised of molecular species containing one double bond at the sn-2 position (vs. < 15 mol% of those containing one double bond at the sn-2 position in gray matter) (23).
Figure 5.
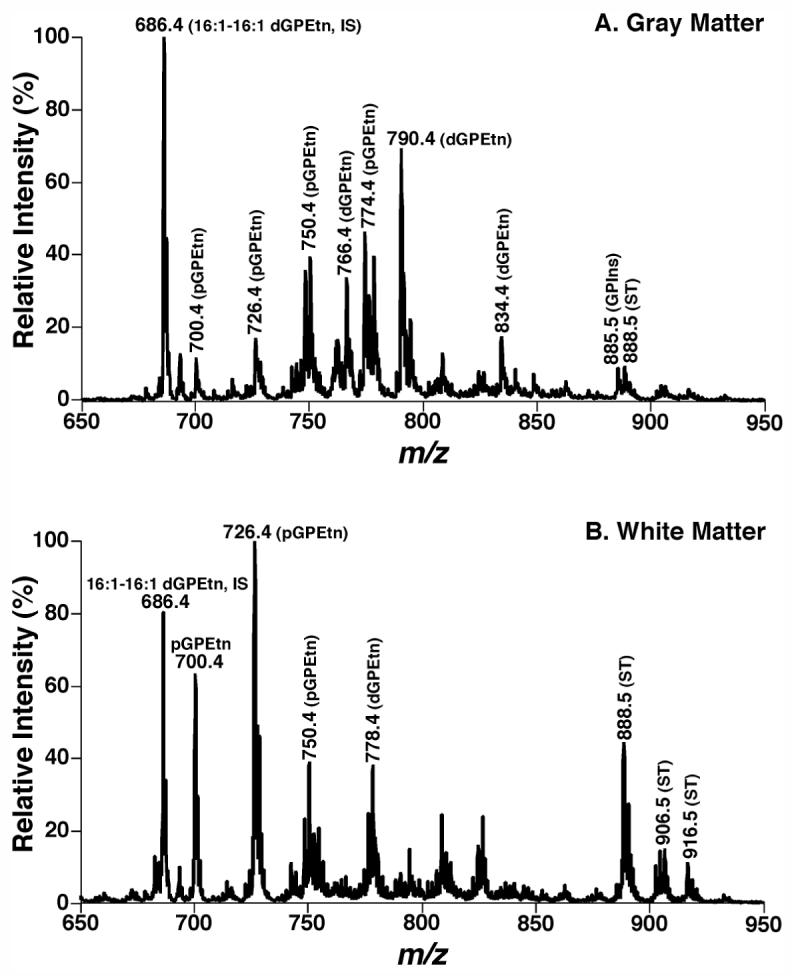
Distinct lipid profiles of ethanolamine glycerophospholipids in lipid extracts of cognitively normal human occipital gray and white matter. Brain lipids were extracted by a modified procedure of Bligh-Dye. Negative-ion ESI mass spectra of lipid extracts of occipital gray matter (Spectrum A of Panel A) and white matter (Spectrum B of Panel B) of cognitively normal human brain were acquired in the presence of LiOH. Individual molecular species were identified using multi-dimensional MS. Plasmenylethanolamine and phosphatidylethanolamine are abbreviated as “pGPEtn” and “dGPEtn”, respectively. GPSer represents phosphatidylserine; GPIns indicates phosphatidylinositol; and ST is sulfatide. “IS” denotes internal standard. (Han, Unpublished data).
The distinct molecular species profiles of GPEtn in brain gray matter and white matter most likely represent the distinct structural and functional attributes of these fundamental brain tissues in these basic brain tissue compartments. Myelin-dominated white matter requires plasmalogen to provide a sufficiently compact sheath for axons, since plasmalogen possesses a compact membrane conformation in comparison to its diacyl counterpart (29). Thus, not surprisingly, pGPEtn molecular species in white matter contain less unsaturated acyl constituents at the sn-2 position. In contrast, pGPEtn molecular species in gray matter consist of abundant polyunsaturated acyl chains (e.g., arachidonate and docosahexaenoate) which are essential components for signal transduction as a source of lipid messengers and facilitate neurotransmitter release which relies on membrane fusion between synaptic vesicles and the neuronal plasma membrane. Accordingly, the distinct molecular species profiles of GPEtn in brain gray matter and white matter are an important criterion which can be used to determine whether a cross contamination between gray matter and white matter during sampling is present. Sample purity should be very critical for determination of alterations in neurolipidomes as well as other measurements including gene and protein mass levels induced by diseases.
5.2. Neurolipidomics reveals the presence of abundant triacylglycerols in the ganglia of the peripheral nervous system
One of the challenges in neurolipidomics is the amount of materials available for analysis of neurolipidome from a suitable animal model. For example, some of the dissected nervous tissues (e.g., hippocampus, thalamus, and ganglia) are only at the mass levels of a few milligrams from individual mouse. Lipid profiling from this amount of material using any classical methodology is not feasible. However, by using multi-dimensional MS-based shotgun lipidomics, this task can be readily fulfilled. Very recently, we have determined whether TG molecular species are present in PNS ganglia and what their compositions are if they are present in ganglia along with the analysis of other parts of the lipidome from one to two milligram of materials by shotgun lipidomics (24). We have demonstrated that TG molecular species are present in unanticipated abundance in all examined ganglia (e.g., cervical dorsal root ganglia (DRG), thoracic DRG, prevertebral superior mesenteric ganglia, and paravertebral superior cervical ganglia) from multiple examined species (e.g., mouse, rat, and rabbit). We found that ganglial TG mass content is location dependent and species specific. Moreover, TG mass levels in DRG are greatest in young mice and decrease measurably with age.
Intriguingly, shotgun lipidomics also reveals that polyunsaturated fatty acyl moieties (e.g., linoleate, arachidonate, and docosahexaenoate (i.e., the essential fatty acids) are abundantly present in the ganglial TG pool. It is well known that polyunsaturated fatty acids serve many essential neuronal functions, such as synaptic plasticity, memory, and as mediators of signal transduction cascades and also greatly contribute to many neuropathological conditions such as stroke, epilepsy, and AD (15, 23). Thus, the storage of a large amount of essential fatty acids in ganglial TG pool could facilitate a depot to supply these components for normal neuronal functions. Another finding of particular interest from the study is the presence of a large amount of fatty acyl moieties containing odd-numbered carbons, accounting for up to 6 mol% of total ganglial TG acyl chains. Such a high percentage of acyl chains with odd-numbered carbons in TG pool is quite unusual in other organs (59, 67). Although the presence of the abundant acyl chains containing odd-numbered carbons in the peripheral nerves apparently indicates the active involvement of α-oxidation for the production of heat through a peroxisomal process in fat metabolism (68), the precise role(s) of such a process in the PNS remain unknown.
To explore the potential role of the abundant ganglial TG in peripheral nerve functions, we have rendered mice diabetic by streptozotocin (STZ) treatment and determined the alterations in the DRG TG mass and molecular species composition in diabetic mice (24). Shotgun lipidomics analyses have demonstrated that DRG TG mass levels in STZ-induced diabetic mice are dramatically depleted relative to those found in the untreated control mice and that the depletion of TG pool is specific since the mass levels of other examined lipid classes in the lipidome are not altered after STZ treatment (24). Another finding of particular interest from the STZ treatment is that the reservoir of essential fatty acids which is enriched in the DRG TG pool is preserved in comparison to other fatty acyl chains. Accordingly, these results indicate that TG pool, as a major component in ganglia, may fundamentally contribute to peripheral neuronal function in health and disease states and depletion of TG mass at the diabetic states may be related to diabetic neuropathy.
5.3. Lipidomics of neuronal diseases
5.3.1. Specific alterations in sulfatide in very mild Alzheimer patients
By using multi-dimensional MS-based shotgun lipidomics, we have demonstrated specific alterations in sulfatide mass levels in both gray matter and white matter in very mild AD subjects relative to controls (41). This substantial depletion in mass level of sulfatide is specific since no significant changes in other major lipid classes in both gray matter and white matter are present in all examined regions in very mild AD subjects relative to controls. To determine the specificity of altered sulfatide mass levels in AD among other neurodegenerative diseases, we have examined the alteration in sulfatide content in postmortem brain samples from subjects with non-AD related Parkinson’s disease (PD) and dementia with Lewy bodies (DLB) (69). In contrast to AD cases, the sulfatide content of all examined brain regions in both gray and white matter from PD subjects are dramatically elevated relative to controls. Examination of lipid alterations in DLB samples demonstrated that mass levels of sulfatide in both gray and white matter from DLB subjects are similar to those observed in controls. These studies suggest that sulfatide deficiency in very mild AD subjects is specific among examined neurodegenerative diseases.
During our studies in elucidating the mechanism(s) underlying the sulfatide deficiency in very early AD, we uncovered a novel role of apoE in the CNS, i.e., modulation of sulfatide mass content (35). This role was supported with three experimental conclusions as follows. First, sulfatides are specifically associated with apoE-containing lipoprotein particles, thus sulfatide can be transported by apoE particles to brain interstitial fluid and cerebrospinal fluid (CSF). Second, apoE modulates sulfatide mass levels in the CNS through the metabolism of apoE-containing particles, i.e., transport of sulfatide to CSF and endocytotic recycling of apoE particles through LDL receptor or LDL receptor family members such as LDL receptor-related proteins. Third, the modulation of sulfatide content in the CNS is apoE-isoform dependent. This conclusion was supported by the substantially lower sulfatide mass content in human apoE4 transgenic mice than that in human apoE3 transgenic mice. This was further validated by the significantly higher sulfatide mass content in CSF from cognitively normal subjects with one or two alleles of apoE4 in comparison to that from counterparts with homozygous alleles of apoE3. Collectively, these findings not only support the role of apoE in the regulation of sulfatide metabolism in the CNS, but also suggest that apoE may be involved in the sulfatide loss in very mild AD patients.
To date, the biochemical mechanism(s) underlying the marked sulfatide deficiency in the CNS of very mild AD patients is still not clear, although it may reflect axonal damage (or degeneration) or abnormal metabolism of apoE-associated lipoproteins or both. However, the significance of our findings is three-fold. First, sulfatide deficiency in early AD may be a useful biomarker for AD. Second, sulfatide deficiency is a very early event in AD pathology. Most importantly, our findings suggest that subjects with mild cognitive impairment due to AD already have dramatic biochemical and/or pathological changes, which ultimately will be critical to target as early as possible in the disease course in order to have a major therapeutic impact. Third, sulfatide metabolism is associated with apoE, providing new insights into the connection of apoE with AD. These results also indicate that although lipidomics, as a field, is still in its early stages of development, the power of lipidomics has already been demonstrated.
5.3.2. Alterations in neurolipidome of progressive epilepsy with mental retardation brain
Progressive epilepsy with mental retardation belongs to a group of inherited neurodegenerative disorders (70). Recently, lipidomics by using HPLC-MS has been performed to analyze molecular species of major phospholipids and simple sphingolipid classes in lipid extracts of cerebral tissues from two patients relative to controls (71). The study shows that the mass levels of ceramide, cerebroside, lactosylceramide and sulfatide are substantially reduced in the progressive state of the disease. Moreover, dramatic alterations in molecular species composition of these lipid classes present in the progressive disease state are also demonstrated. For example, C18:0 molecular species in ceramide and sphingomyelin is dramatically increased accompanied with a substantial depletion of C24:1 molecular species in the classes in the progressive disease state relative to controls; the mass content of C20:0 sulfatide is specifically elevated for four-fold in the progressive disease state relative to controls along with a 50 mol% reduction of C24:1 sulfatide mass content; C18:0 lactosylceramide molecular species becomes undetectable at the progressive state vs. a mass level of approximately 30 mol% of the class in control. The authors believe that the observed changes in molecular profiles of the examined lipid classes may result in altered membrane stability, lipid peroxidation, vesicular trafficking or neurotransmission and may contribute to the progression of the disease (71).
6. SUMMARIES AND PERSPECTIVE
Neurolipidomes are very complicated and thus, neurolipidomics is quite challenging but exciting. With the recent development of MS-based lipidomics, particularly the speedy improvement of multi-dimensional MS-based shotgun lipidomics, the analyses of over twenty lipid classes, hundreds to over a thousand lipid molecular species, and > 95% of the mass content of a cellular lipidome can be readily achieved. Although neurolipidomics is still in its early stages of development, the power of lipidomics has already been demonstrated by identification of alterations in lipid molecular species in specific disease states. It can be anticipated that many biochemical mechanisms underlying lipid metabolism critical to the neuronal diseases and/or disorders will be increasingly uncovered as neurolipidomics penetrance into lower and lower abundance region of mass contents of individual lipid molecular species. Through application of a systems biology approach, the markers for these neuronal diseases which identify pathological alterations and are diagnostic of disease onset, progression or severity may potentially be discovered. Through exploiting the information content inherent in the complexity of cellular lipid composition and kinetic turnover, substantial insights into neuronal plasticity and gene function can be gathered. It is my hope that the new discovery and knowledge will help us modify the deleterious consequences of lipid-associated neuronal diseases.
7. ACKNOWLEDGEMENT
This work was supported by National Institute on Aging Grant R01 AG23168 and the Neurosciences Education and Research Foundation. The author is grateful to Drs. Christopher M. Jenkins and David A. Ford for their comments and to Dr. Kui Yang and Ms Hua Cheng for their technical help.
Abbreviations
- AD
Alzheimer’s disease
- apoE
apolipoprotein E
- CNS
central nervous system
- CSF
cerebrospinal fluid
- ESI
electrospray ionization
- DLB
dementia with Lewy bodies
- DRG
dorsal root ganglia
- GPCho
choline glycerophospholipid
- GPEtn
ethanolamine glycerophospholipid
- LDL
low-density lipoprotein
- LC
liquid chromatography
- MS
mass spectrometry
- PD
Parkinson’s disease
- TG
triacylglycerol
- TIC
total ion current
8. REFERENCES
- 1.Han X, Gross RW. Global analyses of cellular lipidomes directly from crude extracts of biological samples by ESI mass spectrometry: a bridge to lipidomics. J Lipid Res. 2003;44:1071–1079. doi: 10.1194/jlr.R300004-JLR200. [DOI] [PubMed] [Google Scholar]
- 2.Lagarde M, Geloen A, Record M, Vance D, Spener F. Lipidomics is emerging. Biochim Biophys Acta. 2003;1634:61. doi: 10.1016/j.bbalip.2003.11.002. [DOI] [PubMed] [Google Scholar]
- 3.Wenk MR. The emerging field of lipidomics. Nat Rev Drug Discov. 2005;4:594–610. doi: 10.1038/nrd1776. [DOI] [PubMed] [Google Scholar]
- 4.Kitano H. Systems biology: a brief overview. Science. 2002;295:1662–1664. doi: 10.1126/science.1069492. [DOI] [PubMed] [Google Scholar]
- 5.Kenchaiah S, Evans JC, Levy D, Wilson PW, Benjamin EJ, Larson MG, Kannel WB, Vasan RS. Obesity and the risk of heart failure. N Engl J Med. 2002;347:305–313. doi: 10.1056/NEJMoa020245. [DOI] [PubMed] [Google Scholar]
- 6.Han X. Lipid alterations in the earliest clinical stage of Alzheimer’s disease: Implication of the role of lipids in the pathogenesis of Alzheimer’s disease. Curr Alz Res. 2005;2:65–77. doi: 10.2174/1567205052772786. [DOI] [PubMed] [Google Scholar]
- 7.Han X, Gross RW. Shotgun lipidomics: Electrospray ionization mass spectrometric analysis and quantitation of the cellular lipidomes directly from crude extracts of biological samples. Mass Spectrom Rev. 2005;24:367–412. doi: 10.1002/mas.20023. [DOI] [PubMed] [Google Scholar]
- 8.Pulfer M, Murphy RC. Electrospray mass spectrometry of phospholipids. Mass Spectrom Rev. 2003;22:332–364. doi: 10.1002/mas.10061. [DOI] [PubMed] [Google Scholar]
- 9.Griffiths WJ. Tandem mass spectrometry in the study of fatty acids, bile acids, and steroids. Mass Spectrom Rev. 2003;22:81–152. doi: 10.1002/mas.10046. [DOI] [PubMed] [Google Scholar]
- 10.Welti R, Wang X. Lipid species profiling: a high-throughput approach to identify lipid compositional changes and determine the function of genes involved in lipid metabolism and signaling. Curr Opin Plant Biol. 2004;7:337–344. doi: 10.1016/j.pbi.2004.03.011. [DOI] [PubMed] [Google Scholar]
- 11.Ivanova PT, Milne SB, Forrester JS, Brown HA. LIPID arrays: New tools in the understanding of membrane dynamics and lipid signaling. Mol Interv. 2004;4:86–96. doi: 10.1124/mi.4.2.6. [DOI] [PubMed] [Google Scholar]
- 12.Han X, Gross RW. Shotgun lipidomics: multi-dimensional mass spectrometric analysis of cellular lipidomes. Expert Rev Proteomics. 2005;2:253–264. doi: 10.1586/14789450.2.2.253. [DOI] [PubMed] [Google Scholar]
- 13.Power C, Patel KD. Neurolipidomics: an inflammatory perspective on fat in the brain. Neurology. 2004;63:608–609. doi: 10.1212/01.wnl.0000138673.70347.c0. [DOI] [PubMed] [Google Scholar]
- 14.Piomelli D. The challenge of brain lipidomics. Prostaglandins Other Lipid Mediat. 2005;77:23–34. doi: 10.1016/j.prostaglandins.2004.09.006. [DOI] [PubMed] [Google Scholar]
- 15.Bazan NG. Synaptic lipid signaling: significance of polyunsaturated fatty acids and platelet-activating factor. J Lipid Res. 2003;44:2221–2233. doi: 10.1194/jlr.R300013-JLR200. [DOI] [PubMed] [Google Scholar]
- 16.Yu RK, Bieberich E, Xia T, Zeng G. Regulation of ganglioside biosynthesis in the nervous system. J Lipid Res. 2004;45:783–793. doi: 10.1194/jlr.R300020-JLR200. [DOI] [PubMed] [Google Scholar]
- 17.Dietschy JM, Turley SD. Thematic review series: brain Lipids. Cholesterol metabolism in the central nervous system during early development and in the mature animal. J Lipid Res. 2004;45:1375–1397. doi: 10.1194/jlr.R400004-JLR200. [DOI] [PubMed] [Google Scholar]
- 18.Van Meer G. Cellular lipidomics. EMBO J. 2005;24:3159–3165. doi: 10.1038/sj.emboj.7600798. [DOI] [PMC free article] [PubMed] [Google Scholar]
- 19.Woolsey TA, Hanaway J, Gado MH. The brain atlas: a visual guide to the human central nervous system. John Wiley & Sons, Inc.; Hoboken, New Jersey: 2003. [Google Scholar]
- 20.Merrill AH, Jr., Sullards MC, Allegood JC, Kelly S, Wang E. Sphingolipidomics: high-throughput, structure-specific, and quantitative analysis of sphingolipids by liquid chromatography tandem mass spectrometry. Methods. 2005;36:207–224. doi: 10.1016/j.ymeth.2005.01.009. [DOI] [PubMed] [Google Scholar]
- 21.Liu S, Sjovall J, Griffiths WJ. Neurosteroids in rat brain: extraction, isolation, and analysis by nanoscale liquid chromatography-electrospray mass spectrometry. Anal Chem. 2003;75:5835–5846. doi: 10.1021/ac0346297. [DOI] [PubMed] [Google Scholar]
- 22.Horrocks LA, Sharma M. Plasmalogens and O-alkyl glycerophospholipids. In: Hawthorne JN, Ansell GB, editors. Phospholipids. Elsevier Biomedical Press; Amsterdam, The Netherlands: 1982. pp. 51–93. [Google Scholar]
- 23.Han X, Holtzman DM, Mckeel DW., Jr. Plasmalogen deficiency in early Alzheimer’s disease subjects and in animal models: molecular characterization using electrospray ionization mass spectrometry. J Neurochem. 2001;77:1168–1180. doi: 10.1046/j.1471-4159.2001.00332.x. [DOI] [PubMed] [Google Scholar]
- 24.Cheng H, Guan S, Han X. Abundance of triacylglycerols in ganglia and their depletion in diabetic mice: Implications for the role of altered triacylglycerols in diabetic neuropathy. J Neurochem. 2006;97:1288–1300. doi: 10.1111/j.1471-4159.2006.03794.x. [DOI] [PMC free article] [PubMed] [Google Scholar]
- 25.Bosio A, Bussow H, Adam J, Stoffel W. Galactosphingolipids and axono-glial interaction in myelin of the central nervous system. Cell Tissue Res. 1998;292:199–210. doi: 10.1007/s004410051051. [DOI] [PubMed] [Google Scholar]
- 26.Coetzee T, Dupree JL, Popko B. Demyelination and altered expression of myelin-associated glycoprotein isoforms in the central nervous system of galactolipid-deficient mice. J Neurosci Res. 1998;54:613–622. doi: 10.1002/(SICI)1097-4547(19981201)54:5<613::AID-JNR6>3.0.CO;2-V. [DOI] [PubMed] [Google Scholar]
- 27.Marcus J, Honigbaum S, Shroff S, Honke K, Rosenbluth J, Dupree JL. Sulfatide is essential for the maintenance of CNS myelin and axon structure. Glia. 2006;53:372–381. doi: 10.1002/glia.20292. [DOI] [PubMed] [Google Scholar]
- 28.Rapport MM. Reflections on the great plasmalogen puzzle: effector mediated signal transduction coupled to glyceride structures. Neurochem Res. 1998;23:273–275. doi: 10.1023/a:1022441029834. [DOI] [PubMed] [Google Scholar]
- 29.Han X, Gross RW. Plasmenylcholine and phosphatidylcholine membrane bilayers possess distinct conformational motifs. Biochemistry. 1990;29:4992–4996. doi: 10.1021/bi00472a032. [DOI] [PubMed] [Google Scholar]
- 30.Glaser PE, Gross RW. Plasmenylethanolamine facilitates rapid membrane fusion: a stopped-flow kinetic investigation correlating the propensity of a major plasma membrane constituent to adopt an HII phase with its ability to promote membrane fusion. Biochemistry. 1994;33:5805–5812. doi: 10.1021/bi00185a019. [DOI] [PubMed] [Google Scholar]
- 31.Han X, Ramanadham S, Turk J, Gross RW. Reconstitution of membrane fusion between pancreatic islet secretory granules and plasma membranes: catalysis by a protein constituent recognized by monoclonal antibodies directed against glyceraldehyde-3-phosphate dehydrogenase. Biochim Biophys Acta. 1998;1414:95–107. doi: 10.1016/s0005-2736(98)00154-0. [DOI] [PubMed] [Google Scholar]
- 32.Mahley RW. Apolipoprotein E: cholesterol transport protein with expanding role in cell biology. Science. 1988;240:622–630. doi: 10.1126/science.3283935. [DOI] [PubMed] [Google Scholar]
- 33.Weisgraber KH. Apolipoprotein E: structure-function relationships. Adv Protein Chem. 1994;45:249–302. doi: 10.1016/s0065-3233(08)60642-7. [DOI] [PubMed] [Google Scholar]
- 34.Han X. The role of apolipoprotein E in lipid metabolism in the central nervous system. Cell Mol Life Sci. 2004;61:1896–1906. doi: 10.1007/s00018-004-4009-z. [DOI] [PMC free article] [PubMed] [Google Scholar]
- 35.Han X, Cheng H, Fryer JD, Fagan AM, Holtzman DM. Novel role for apolipoprotein E in the central nervous system: Modulation of sulfatide content. J Biol Chem. 2003;278:8043–8051. doi: 10.1074/jbc.M212340200. [DOI] [PubMed] [Google Scholar]
- 36.Lazarow PB, Moser HW. Disorders of peroxisome biogenesis. In: Scriver CR, Beaudet AL, Sly WS, Valle D, editors. The metabolic and molecular bases of inherited disease. McGraw-Hill; New York: 1995. pp. 2287–2324. [Google Scholar]
- 37.Switzer JA, Hess DC. Statins in stroke: prevention, protection and recovery. Expert Rev Neurotherap. 2006;6:195–202. doi: 10.1586/14737175.6.2.195. [DOI] [PubMed] [Google Scholar]
- 38.Shobab LA, Hsiung G-YR, Feldman HH. Cholesterol in Alzheimer’s disease. Lancet Neurol. 2005;4:841–852. doi: 10.1016/S1474-4422(05)70248-9. [DOI] [PubMed] [Google Scholar]
- 39.Costantini C, Kolasani RMK, Puglielli L. Ceramide and cholesterol: possible connections between normal aging of the brain and Alzheimer’s disease. Just hypotheses or molecular pathways to be identified? Alz Dement. 2005;1:43–50. doi: 10.1016/j.jalz.2005.06.004. [DOI] [PubMed] [Google Scholar]
- 40.Von Figura K, Gieselmann V, Jaeken J. Metachromatic leukodystrophy: Lysosomal disorders. In: Sachdev HS, Beaudet AL, Sly WS, Valle D, editors. The metabolic and molecular bases of inherited diseases. McGraw-Hill; New York: 2001. pp. 3695–3724. [Google Scholar]
- 41.Han X, Holtzman DM, Mckeel DW, Jr., Kelley J, Morris JC. Substantial sulfatide deficiency and ceramide elevation in very early Alzheimer’s disease: potential role in disease pathogenesis. J Neurochem. 2002;82:809–818. doi: 10.1046/j.1471-4159.2002.00997.x. [DOI] [PubMed] [Google Scholar]
- 42.Suzuki K, Suzuki Y, Suzuki K. Galactosylceramide lipidosis: Globoid-cell leukodystrophy (Krabbe disease) In: The metabolic and molecular bases of inherited diseases. In: Scriver CR, Beaudet AL, Sly WS, Valle D, editors. McGraw-Hill; New York: 1995. pp. 2671–2692. [Google Scholar]
- 43.Moser HW, Scriver CR, Beaudet AL, Sly WS, Valle D. The metabolic and molecular bases of inherited diseases. McGraw-Hill; New York: 1995. Farber lipogranulomatosis; pp. 2589–2599. [Google Scholar]
- 44.Mahuran DJ. Biochemical consequences of mutations causing the GM2 gangliosidoses. Biochim Biophys Acta. 1999;1455:105–138. doi: 10.1016/s0925-4439(99)00074-5. [DOI] [PubMed] [Google Scholar]
- 45.Horinouchi K, Erlich S, Perl DP, Ferlinz K, Bisgaier CL, Sandhoff K, Desnick RJ, Stewart CL, Schuchman EH. Acid sphingomyelinase deficient mice: a model of types A and B Niemann-Pick disease. Nat Genet. 1995;10:288–293. doi: 10.1038/ng0795-288. [DOI] [PubMed] [Google Scholar]
- 46.Sturley SL, Patterson MC, Balch W, Liscum L. The pathophysiology and mechanisms of NP-C disease. Biochim Biophys Acta. 2004;1685:83–87. doi: 10.1016/j.bbalip.2004.08.014. [DOI] [PubMed] [Google Scholar]
- 47.Han X, Gubitosi-Klug RA, Collins BJ, Gross RW. Alterations in individual molecular species of human platelet phospholipids during thrombin stimulation: electrospray ionization mass spectrometry-facilitated identification of the boundary conditions for the magnitude and selectivity of thrombin-induced platelet phospholipid hydrolysis. Biochemistry. 1996;35:5822–5832. doi: 10.1021/bi952927v. [DOI] [PubMed] [Google Scholar]
- 48.Han X, Yang K, Cheng H, Fikes KN, Gross RW. Shotgun lipidomics of phosphoethanolamine-containing lipids in biological samples after one-step in situ derivatization. J Lipid Res. 2005;46:1548–1560. doi: 10.1194/jlr.D500007-JLR200. [DOI] [PMC free article] [PubMed] [Google Scholar]
- 49.Han X, Yang K, Yang J, Cheng H, Gross RW. Shotgun lipidomics of cardiolipin molecular species in lipid extracts of biological samples. J Lipid Res. 2006;47:864–879. doi: 10.1194/jlr.D500044-JLR200. [DOI] [PMC free article] [PubMed] [Google Scholar]
- 50.Han X. Characterization and direct quantitation of ceramide molecular species from lipid extracts of biological samples by electrospray ionization tandem mass spectrometry. Anal Biochem. 2002;302:199–212. doi: 10.1006/abio.2001.5536. [DOI] [PubMed] [Google Scholar]
- 51.Guan XL, He X, Ong WY, Yeo WK, Shui G, Wenk MR. Non-targeted profiling of lipids during kainate-induced neuronal injury. FASEB J. 2006;20:1152–1161. doi: 10.1096/fj.05-5362com. [DOI] [PubMed] [Google Scholar]
- 52.Guan XL, Wenk MR. Mass spectrometry-based profiling of phospholipids and sphingolipids in extracts from Saccharomyces cerevisiae. Yeast. 2006;23:465–477. doi: 10.1002/yea.1362. [DOI] [PubMed] [Google Scholar]
- 53.Han X, Gross RW. Electrospray ionization mass spectroscopic analysis of human erythrocyte plasma membrane phospholipids. Proc Natl Acad Sci U S A. 1994;91:10635–10639. doi: 10.1073/pnas.91.22.10635. [DOI] [PMC free article] [PubMed] [Google Scholar]
- 54.Han X, Gross RW. Quantitative analysis and molecular species fingerprinting of triacylglyceride molecular species directly from lipid extracts of biological samples by electrospray ionization tandem mass spectrometry. Anal Biochem. 2001;295:88–100. doi: 10.1006/abio.2001.5178. [DOI] [PubMed] [Google Scholar]
- 55.Han X, Yang J, Cheng H, Ye H, Gross RW. Towards fingerprinting cellular lipidomes directly from biological samples by two-dimensional electrospray ionization mass spectrometry. Anal Biochem. 2004;330:317–331. doi: 10.1016/j.ab.2004.04.004. [DOI] [PubMed] [Google Scholar]
- 56.Ikonomou MG, Blades AT, Kebarle P. Electrospray-ion spray: a comparison of mechanisms and performance. Anal Chem. 1991;63:1989–1998. [Google Scholar]
- 57.Gaskell SJ. Electrospray: principles and practice. J Mass Spectrom. 1997;32:677–688. [Google Scholar]
- 58.Han X, Yang K, Yang J, Fikes KN, Cheng H, Gross RW. Factors influencing the electrospray intrasource separation and selective ionization of glycerophospholipids. J Am Soc Mass Spectrom. 2006;17:264–274. doi: 10.1016/j.jasms.2005.11.003. [DOI] [PubMed] [Google Scholar]
- 59.Han X, Cheng H, Mancuso DJ, Gross RW. Caloric restriction results in phospholipid depletion, membrane remodeling and triacylglycerol accumulation in murine myocardium. Biochemistry. 2004;43:15584–15594. doi: 10.1021/bi048307o. [DOI] [PubMed] [Google Scholar]
- 60.Schwudke D, Oegema J, Burton L, Entchev E, Hannich JT, Ejsing CS, Kurzchalia T, Shevchenko A. Lipid profiling by multiple precursor and neutral loss scanning driven by the data-dependent acquisition. Anal Chem. 2006;78:585–595. doi: 10.1021/ac051605m. [DOI] [PubMed] [Google Scholar]
- 61.Hermansson M, Uphoff A, Kakela R, Somerharju P. Automated quantitative analysis of complex lipidomes by liquid chromatography/mass spectrometry. Anal Chem. 2005;77:2166–2175. doi: 10.1021/ac048489s. [DOI] [PubMed] [Google Scholar]
- 62.Liebisch G, Drobnik W, Reil M, Trumbach B, Arnecke R, Olgemoller B, Roscher A, Schmitz G. Quantitative measurement of different ceramide species from crude cellular extracts by electrospray ionization tandem mass spectrometry (ESI-MS/MS) J Lipid Res. 1999;40:1539–1546. [PubMed] [Google Scholar]
- 63.Brugger B, Erben G, Sandhoff R, Wieland FT, Lehmann WD. Quantitative analysis of biological membrane lipids at the low picomole level by nano-electrospray ionization tandem mass spectrometry. Proc Natl Acad Sci U S A. 1997;94:2339–2344. doi: 10.1073/pnas.94.6.2339. [DOI] [PMC free article] [PubMed] [Google Scholar]
- 64.Ekroos K, Shevchenko A. Simple two-point calibration of hybrid quadrupole time-of-flight instruments using a synthetic lipid standard. Rapid Commun Mass Spectrom. 2002;16:1254–1255. doi: 10.1002/rcm.705. [DOI] [PubMed] [Google Scholar]
- 65.Koivusalo M, Haimi P, Heikinheimo L, Kostiainen R, Somerharju P. Quantitative determination of phospholipid compositions by ESI-MS: effects of acyl chain length, unsaturation, and lipid concentration on instrument response. J Lipid Res. 2001;42:663–672. [PubMed] [Google Scholar]
- 66.Sparagna GC, Johnson CA, Mccune SA, Moore RL, Murphy RC. Quantitation of cardiolipin molecular species in spontaneously hypertensive heart failure rats using electrospray ionization mass spectrometry. J Lipid Res. 2005;46:1196–1204. doi: 10.1194/jlr.M500031-JLR200. [DOI] [PubMed] [Google Scholar]
- 67.Newberry EP, Xie Y, Kennedy S, Han X, Buhman KK, Luo J, Gross RW, Davidson NO. Decreased hepatic triglyceride accumulation and altered fatty acid uptake in mice with deletion of the liver fatty acid-binding protein gene. J Biol Chem. 2003;278:51664–51672. doi: 10.1074/jbc.M309377200. [DOI] [PubMed] [Google Scholar]
- 68.Su X, Han X, Yang J, Mancuso DJ, Chen J, Bickel PE, Gross RW. Sequential ordered fatty acid α oxidation and Δ9 desaturation are major determinants of lipid storage and utilization in differentiating adipocytes. Biochemistry. 2004;43:5033–5044. doi: 10.1021/bi035867z. [DOI] [PubMed] [Google Scholar]
- 69.Cheng H, Xu J, Mckeel DW, Jr., Han X. Specificity and potential mechanism of sulfatide deficiency in Alzheimer’s disease: An electrospray ionization mass spectrometric study. Cell Mol Biol. 2003;49:809–818. [PubMed] [Google Scholar]
- 70.Haltia M. The neuronal ceroid-lipofuscinoses. J Neuropathol Exp Neurol. 2003;62:1–13. doi: 10.1093/jnen/62.1.1. [DOI] [PubMed] [Google Scholar]
- 71.Hermansson M, Kakela R, Berghall M, Lehesjoki AE, Somerharju P, Lahtinen U. Mass spectrometric analysis reveals changes in phospholipid, neutral sphingolipid and sulfatide molecular species in progressive epilepsy with mental retardation, EPMR, brain: a case study. J Neurochem. 2005;95:609–617. doi: 10.1111/j.1471-4159.2005.03376.x. [DOI] [PubMed] [Google Scholar]