Abstract
Mutual synchronization by exchange of chemicals is a mechanism for the emergence of collective dynamics in cellular populations. General theories exist on the transition to coherence, but no quantitative, experimental demonstration has been given. Here, we present a modeling and experimental analysis of cell-density-dependent glycolytic oscillations in yeast. We study the disappearance of oscillations at low cell density and show that this phenomenon occurs synchronously in all cells and not by desynchronization, as previously expected. This study identifies a general scenario for the emergence of collective cellular oscillations and suggests a quorum-sensing mechanism by which the cell density information is encoded in the intracellular dynamical state.
Keywords: collective dynamics, glycolysis, cell synchronization, oscillations, cell density
Oscillatory behavior characterizes many cellular processes (1–4). When cellular oscillators interact, the mutual entrainment of their rhythms produces an emergent dynamics at the population level (5, 6). In cases for which this interaction takes the form of an exchange of signaling molecules through a homogeneous extracellular medium (2, 6–9), the coupling is global and its strength depends on the cell density (10, 11). In this way, cell density is expected to modulate the emergent dynamics. Collective glycolytic oscillations in yeast cells are a well established example of such a system (5, 10). These oscillations are detected by recording the time trace of the NAD(P)H autofluorescence in starved, anaerobic yeast cell suspensions (see Materials and Methods) (12–15). As expected, the collective oscillations disappear at cell densities below a threshold value (16), but the nature of this transition at the cellular level has remained an open question for 30 years (2, 5, 10, 16, 17).
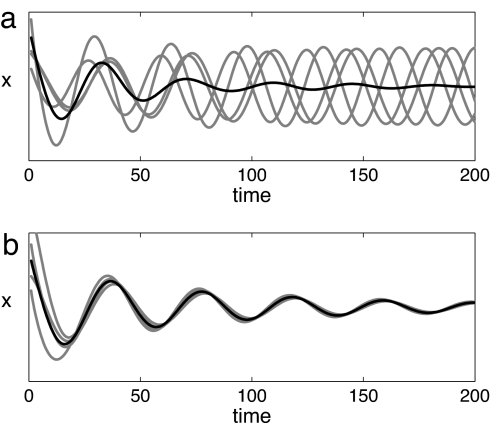
Synchronization theory provides one possible answer in the form of the so-called Kuramoto transition to incoherence (6, 18), where collective oscillations are lost via desynchronization of the individual oscillators (Fig. 1a). Another possibility is that the intracellular dynamics depends on population density in such a way that oscillations are lost within each cell (Fig. 1b). At low cell densities, these alternatives are equivalent with respect to population-level observations but have very different biological implications. Density variations have marginal effects on the intracellular oscillations in the Kuramoto transition to incoherence, whereas in the second case they cause a qualitative change in the cellular dynamics. We test the validity of the two different scenarios by combining theoretical results from synchronization theory with experiments in an open-flow reactor, with which a steady regime can be kept indefinitely (15). Cell density is our control parameter. The collective oscillations are characterized by the amplitude and frequency of the asymptotic dynamics. At low cell densities, when no spontaneous oscillation is detected, we analyze the transient dynamics after resonant forcing rather than instantaneous pulse responses, so as to limit spurious effects due to the excitation of fast modes (19).
Fig. 1.
Two possible explanations for the lack of collective oscillations at low cell density: simulations of populations with random initial conditions. The gray lines represent the evolution in time of four oscillators within a population (n = 100), and the black line represents the macroscopic observable, the average over the population. (a) Incoherence. Cells progressively loose their mutual entrainment, and their average is asymptotically stationary up to finite-size fluctuations. (b) Dynamic quorum sensing. Cells have a coherent motion and stop oscillating in synchrony with the medium.
Results
Density-Dependent Dynamics.
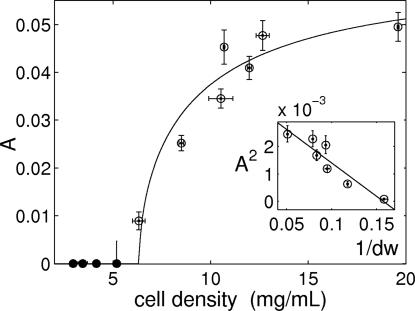
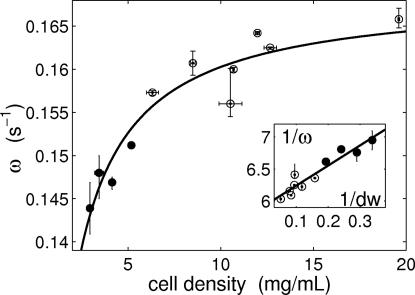
We observe that the collective dynamics is progressively damped and slowed down as cell density is reduced. The amplitude of sustained collective oscillations decreases and vanishes at the critical cell density of 6.3 mg of dry weight per milliliter, ∼7 × 10⁸ cells per milliliter (Fig. 2). For densities below this value, the damping takes the form of an increased attractiveness of the steady state, as quantified by the amplitude decay exponent [see SI Fig. 12 in supporting information (SI) Appendix 1]. The slowing of the dynamics with decreasing cell density is shown in Fig. 3. The damping is in accordance with ref. 16, but the slowing was an unexpected finding.
Fig. 2.
Amplitude A of the collective glycolytic oscillations as a function of cell density. The open and filled circles correspond to sustained and damped oscillations, respectively, of the NAD(P)H fluorescence relative to the mean fluorescence signal. Cell density is reported as dry weight (dw). The continuous line is a fit with the reduced model (Eq. 5 in Mathematical Model). (Inset) The predicted linear relation between A2 and 1/dw. The vertical error bars indicate the maximum and minimum values observed, and the horizontal error bars indicate two independent determinations of cell density. See SI Appendix 1 for data analysis.
Fig. 3.
Angular frequency ω of the self-sustained (open circles) or damped (filled circles) collective glycolytic oscillations as a function of cell density measured as dry weight (dw). The continuous line is a fit with the reduced model (Eq. 3 in Mathematical Model). (Inset) The predicted linear relation between 1/ω and 1/dw. The error bars are as in Fig. 2. See SI Appendix 1 for data analysis.
Scenarios for Loss of Oscillations.
Yeast cell suspensions are modeled as a population of oscillators coupled by the exchange of metabolites with a homogeneous extracellular medium (Eq. 1 in Mathematical Model). Theoretical studies reveal that the two aforementioned alternative scenarios have distinct hallmarks, which can be compared with the experimental data.
The desynchronization scenario (Fig. 1a) involves the transition to an incoherent regime, where the cellular oscillations have no fixed phase relation with each other (18). Averaged over a large number of cells (≈109 in our reactor), this results in a macroscopic stationary state. The incoherent regime is characterized by nonexponential relaxation modes at the macroscopic level (20). If a population is initially in phase, desynchronization is reached by a progressive phase drift (due to noise or frequency differences) of the cells, giving rise to an algebraic (i.e., nonexponential) decay of the oscillation amplitude. At low cell densities, we have used external forcing to set the same initial phase in all cells. When the forcing is stopped, we see no indication of a nonexponential decay trend (see SI Fig. 11 in SI Appendix 1). Theory also predicts that collective oscillations are separated from incoherence by a region of complex (quasiperiodic and chaotic) collective dynamics (21). In our experiments, no significant deviation from the purely sinusoidal oscillations has been detected while approaching the critical cell density (in particular, no subharmonics were observed in the Fourier spectrum).
The second scenario is a synchronous transition to a steady state (Fig. 1b); i.e., the steady state is attained both microscopically and at the population level. This happens when the coupling is sufficiently strong to keep the cells entrained to the medium at all cell densities so that the dynamics is affected by the balance between the intracellular and the extracellular component. The effect of density changes on the synchronous regime can be assessed by simplifying the population model of Eq. 1 through the following assumptions: (i) the intracellular oscillators are identical and confined to a plane in concentration space, and (ii) the time scale of the diffusive coupling through the cell membrane is very fast compared with those of the intracellular oscillatory dynamics. We can thus obtain a reduced equation for the overall dynamics (Eq. 2 in Mathematical Model) and scaling laws for the experimentally observed variables (Eqs. 3–5 in Mathematical Model). As discussed in Mathematical Model, numerical simulations show that these laws also remain valid if the aforementioned assumptions are relaxed.
The observed intracellular oscillations are attributed to the nonlinearities of the glycolytic module and have the properties of planar Hopf oscillators (1, 15, 22). The coupling is mediated by the exchange of acetaldehyde (Aca), a small molecule that diffuses passively through the cell membrane (19, 23, 24). Aca is weakly connected to the core metabolic oscillator by affecting the NAD+/NADH balance (25, 26). It is not a merely slaved variable, but it has a small component in the oscillation plane. As a consequence, changes in the extracellular Aca concentration can affect the intracellular biochemical dynamics. The diffusion rate of Aca is much faster than the time scale of the intracellular dynamics (see SI Appendix 1) so that its concentration inside the cell and in the extracellular medium will equilibrate almost instantaneously. We thus expect the experimental data to scale as predicted by the reduced equation (see Mathematical Model). The measured amplitudes and frequencies of the oscillations satisfy the scaling laws (Figs. 2 Inset and 3 Inset) and confirm that the synchronous transition scenario explains the experimental observations. In such a scenario, cell density affects the intracellular dynamics even if the average chemical concentrations are unchanged. This conclusion is also supported by a recent experiment (24), which indicates that a single, noninteracting yeast cell (corresponding to our limiting case of infinite dilution) does not show spontaneous glycolytic oscillations under conditions in which dense populations do.
Quantitative Description of Density-Dependent Dynamics.
By fitting the scaling laws of Eqs. 3–5 to the data, we perform a quantitative parameterization of the model (see SI Appendix 1 for details). The parameters quantify the dynamical features of the glycolytic module and of the reactor. We have estimated the natural frequency of the intracellular oscillator ω0 = 0.17 s−1 (corresponding to a period T0 = 37 s). This quantity is not directly measurable, because ω0 is the frequency limit for an infinitely dense suspension. This frequency is rapidly attained as the cell density is increased from zero. This fact, surprising at first, is explained by the dependence of the collective dynamics on an effective cell density (see Mathematical Model) rather than on the real one. The sensitivity to density changes is controlled by the rescaling factor c ≈ 800. This value of c indicates that the coupling direction is almost orthogonal to the oscillation plane, in line with the previous finding that the synchronizing metabolite, Aca, is only weakly coupled to the core oscillator (25, 26). If all substances were allowed to diffuse instantaneously (or, equivalently, if there were no cell membranes), c would be equal to one and the frequency increase with cell density would be less steep. According to Eq. 3, the oscillation frequency of suspensions of intact cells (c = 800) is ≈40× that of extracts (c = 1) for intermediate cell densities (α = 0.025). The coupling via a metabolite weakly linked to the core oscillator can thus explain the observation that intact yeast cells oscillate at higher frequencies than extracts of comparable dilutions (10). A further consequence of rescaling, potentially interesting in an evolutionary perspective, is that cell-density sensitivity can be modulated by changing the identity of substances that cross the membrane, rather than by a change in the biochemical core of the cellular oscillator. The other parameters of the reduced model, the relaxation time constant τ = 9.9 min−1 and the linear stability of the steady state λ0 = 0.015 s−1, are in good agreement with independent biochemical estimates (see SI Appendix 1).
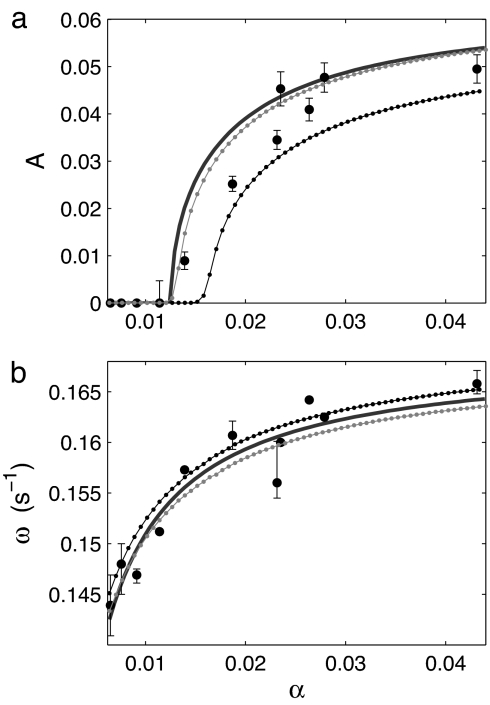
Simulations of a population of oscillators (Eq. 1) with the experimentally determined parameters reproduce the experimental measurements of the transient and asymptotic collective dynamics (see Fig. 5 and Mathematical Model). They also show that the synchronous scenario is robust to the presence of a distribution of natural frequencies, representing the natural variability among the individual oscillators.
Fig. 5.
Numerical simulations of Eq. 1 for a population of n = 100 limit-cycle oscillators. The parameters are derived from the experimental data or chosen according to the hypothesis of time-scale separation and fast diffusion. Amplitude A (a) and frequency ω (b) are plotted against cell density. The experimental data of Figs. 2 and 3 (black circles) and the reduced system (solid line) are compared with simulations of a population of identical oscillators (gray dots) and of a population with a mismatch in the frequencies of the individual oscillators (Gaussian distribution with a relative standard deviation of 15%; black dots). The parameter values are ω0 = 0.17 s−1, λ0 = 0.015 s−1, τ = 0.16 s−1, g = −3.8 s−1, θ = 87°, λfast = −500 s−1, and daca = 300 s−1. See also Fig. 4 and Mathematical Model.
Conclusions
The experimental results are consistent with the scenario where the intracellular metabolism does not oscillate below a threshold cell density. The intracellular dynamics are damped by the extracellular medium, and the oscillations are progressively lost as the extracellular volume increases (Eq. 2). The cell-density information is coded into the collective behavior and conveyed to the cell by fast exchange of the diffusing metabolite Aca. This mechanism can be seen as a dynamic analog to bacterial quorum sensing (27), where population density is reflected by the dynamical state of the cell, rather than by the concentration of a signaling molecule.
Besides the prediction and quantification of density-dependent dynamics in yeast, our general model shows that such density dependence can occur in any population of oscillators coupled to an extracellular medium by diffusion, provided that this diffusion is fast compared with the oscillators' amplitude and phase dynamics. This family potentially includes quorum-sensing bacteria with oscillating genetic circuits (11, 28), cAMP-secreting amoebae (29), as well as chemical systems that mimic cellular populations (30, 31).
An important practical implication of our findings is that, whenever substances are exchanged with an extracellular medium, intrinsic oscillatory dynamics are at risk of being damped to a stable steady state if the experiments are carried out at low cell densities. Current experimental designs, in particular microscope-assisted single-cell studies, might thus be inadequate for the observation of dynamical processes involving cell–cell and cell–environment interactions.
Mathematical Model
We consider a population of cellular oscillators coupled by diffusion to a homogeneous extracellular medium. The homogeneity of the suspension in a stirred reactor introduces a global coupling among the cells. The time evolution of the system is described by a set of ordinary differential equations for the vectors xj (indexed by j = 1 … N, with N being the total population size) and X, representing the chemical concentrations in the intracellular and extracellular compartments, respectively (22):
 |
The rate equation for the jth cell is composed of the term F(xj,pj) defining the intracellular dynamics and of a second term accounting for the diffusion across the membrane. This exchange of metabolites is assumed diffusive and linear. The corresponding first-order rate constants appear as elements of the diagonal matrix D. We will focus on the case where D has only one positive element (for the case of yeast, Aca), chosen large compared with the typical time scales of the intracellular oscillations (see SI Appendix 1). The equations for the concentrations X in the medium are composed of a transport term (α/N)Σj D(xj − X), balancing the fluxes to and from the cells, and of a relaxation term −JX. The latter accounts for the inflow and outflow of the reactor and can incorporate chemical reactions taking place in the extracellular medium. The cell density parameter α = Vcyt/Vx is the ratio between the total cytosolic and the extracellular volume.
Reduced Equation and Scaling Laws.
If cells are identical and synchronized, the equations for the population reduce to one oscillator coupled to an external medium. If, in addition, diffusion is infinitely fast, the concentration of the diffusing species is the same inside the cell and in the medium. The synchronous regime of Eq. 1 then follows the reduced equation (see SI Appendix 1):
where z is a variable in the oscillation plane, the functional form of f(z) describes the intracellular dynamics in the plane of oscillations, and the parameter τ measures the half-life of an external perturbation to the steady state. The parameter c introduces a rescaling of the density. The value of c depends on the nature of the diffusing metabolite and on its interaction with the core oscillator. A high value of c indicates weak interactions. The reduced system Eq. 2 provides an approximate description of the dynamics of Eq. 1. Its validity also holds in cases when the simplifying assumptions of separated time scales and identical oscillators are relaxed, as checked by numerical simulations. The overall dynamics, described by Eq. 2, results from the competition between the intracellular oscillatory dynamics and the extracellular relaxation dynamics, the relative weights of which are controlled by the rescaled volume ratio αc. By choosing the functional form of a Hopf limit-cycle oscillator (1, 15, 22) for the intracellular dynamics, we obtain three simple scaling laws for the density dependence of the dynamic observables. The frequency ω of the self-sustained or damped oscillations obeys
The exponent λ of the amplitude damping is
The amplitude A of the collective oscillations scales as
These scaling laws are compared with the experimental measures (Figs. 2 and 3; see SI Fig. 12 in SI Appendix 1), and their fit provides a quantitative parameterization of the model (see SI Appendix 1).
Numerical Simulations.
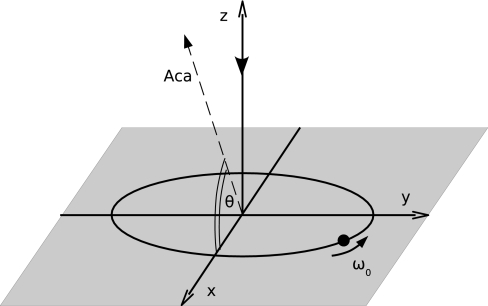
We use the experimentally determined parameters along with estimates of the time scale of fast intracellular relaxation dynamics and Aca transport kinetics to simulate Eq. 1 for a population of n = 100 cells. We describe the intracellular dynamics with the Hopf normal form (Eq. S4 in SI Appendix 1) in a plane and with a fast, stable mode perpendicular to this plane (see Fig. 4). We test the validity of Eq. 2 when the limiting assumptions used to derive it are relaxed. That is, we introduce a mismatch in the frequencies of the intracellular oscillators and an incomplete time scale separation between slow and fast modes, and we consider large but finite diffusion rules. Specifically, we have used the simulations to check (i) the reproducibility of the experimental measurements by a population of identical individuals, in particular the fact that the synchronous solution is stable; (ii) the fact that the reduced system Eq. 2 describes the macroscopic bifurcation scenario of the population; and (iii) the robustness of these results with respect to frequency dispersal among the oscillators.
Fig. 4.
Model of the intracellular oscillator used to simulate the individual cells of Eq. 1. The plane of oscillations (shaded gray) is spanned by the complex eigenvectors of the origin, associated with the eigenvalues λ0 ± iω0. The stable perpendicular mode is associated with a third, stable eigenvalue ∣λfast∣ ≫ ∣λ0∣, quantifying the rate of relaxation toward the plane of oscillations. The coupling to the external medium takes place along the direction of the diffusing species (Aca). This direction forms an angle θ with the plane of intracellular oscillations.
Fig. 5 shows the comparison of the experimental data with the bifurcation diagram for the population of identical oscillators, for the reduced system, and for the population of oscillators with frequency distribution. In the simulations of both populations, the transitions to stationarity at low cell densities correspond to synchronous Hopf bifurcations. In other words, the oscillatory behavior is suppressed simultaneously at the population level and for each individual oscillator. With narrow frequency distributions, the reduced system captures the behavior of the full system both qualitatively and quantitatively. When the frequency distribution is wider, a larger critical cell density is observed, whereas the cell density dependence of the frequency is almost unchanged.
Another experimentally observed phenomenon, which is reproduced by the population simulations, is the small modulations of the amplitude of the collective oscillations (visible in SI Fig. 8 in SI Appendix 1), corresponding to a weak deviation from perfectly sinusoidal shape of the time trace.
Materials and Methods
Measurements of Cellular Dynamics.
The yeast cells (Saccharomyces cerevisiae X2180) were harvested at the diauxic shift, washed, starved, and kept cold (2–4°C) in a phosphate buffer at pH 6.8 as previously described (32). The glycolytic dynamics was studied by means of NAD(P)H autofluorescence in a continuous-flow stirred tank reactor at 25°C as previously described (15). The specific flow rate (k0 = 0.062 min−1) and the mixed flow concentrations of glucose ([Glc]0 = 60 mM) and cyanide ([CN−]0 = 5.9 mM) were kept constant throughout the experiments. This maintained glucose concentration sufficiently high for the glucose transporter to be saturated (15, 33). Hence, the cellular dynamics was unaffected by the changes in extracellular glucose concentrations. An additional flow of Aca was used for resonant forcing at low cell densities (mixed flow forcing amplitude of 8 μM), where the cell suspensions do not display autonomous oscillations. The average mixed flow Aca concentration ([Aca]0 = 0.75 mM) is constant throughout all experiments. To obtain a smooth oscillatory signal with defined amplitude and phase, the NAD(P)H fluorescence time series are processed as described in SI Appendix 1.
Additional Methods.
Information about cell density determination, data processing, and the estimation of model parameters can be found in SI Appendix 1.
Supplementary Material
Acknowledgments
We thank V. Hakim, M. F. Madsen, and H. V. Westerhoff for discussions. This work was supported by the European Union BioSim Network of Excellence Grant LSHB-CT-2004-005137. S.D.M. was supported by the Marie Curie Grant EIF-010169. F.d.O. was supported by the Marie Curie Grant EIF-024717.
Abbreviation
- Aca
acetaldehyde.
Footnotes
The authors declare no conflict of interest.
This article is a PNAS Direct Submission.
This article contains supporting information online at www.pnas.org/cgi/content/full/0706089104/DC1.
References
- 1.Goldbeter A. Biochemical Oscillations and Cellular Rhythms: The Molecular Bases of Periodic and Chaotic Behaviour. Cambridge, UK: Cambridge Univ Press; 1996. [Google Scholar]
- 2.Winfree A. The Geometry of Biological Time. 2nd Ed. New York: Springer; 2001. [Google Scholar]
- 3.Kruse K, Jülicher F. Curr Op Cell Biol. 2005;17:20–26. doi: 10.1016/j.ceb.2004.12.007. [DOI] [PubMed] [Google Scholar]
- 4.Tu B, McKnight S. Nat Rev Mol Cell Biol. 2006;7:696–701. doi: 10.1038/nrm1980. [DOI] [PubMed] [Google Scholar]
- 5.Winfree A. Science. 2002;298:2336–2337. doi: 10.1126/science.1072560. [DOI] [PubMed] [Google Scholar]
- 6.Pikovsky A, Rosenblum M, Kurths J. Synchronization: A Universal Concept in Nonlinear Sciences. Cambridge, UK: Cambridge Univ. Press; 2001. [Google Scholar]
- 7.Ghosh AK, Chance B, Pye EK. Arch Biochem Biophys. 1971;145:319–331. doi: 10.1016/0003-9861(71)90042-7. [DOI] [PubMed] [Google Scholar]
- 8.Klevecz R, Bolden J, Forrest G, Murray D. Proc Natl Acad Sci USA. 2004;101:1200–1205. doi: 10.1073/pnas.0306490101. [DOI] [PMC free article] [PubMed] [Google Scholar]
- 9.Chen Z, Odstrcil EA, Tu B, McKnight S. Science. 2007;316:1916–1919. doi: 10.1126/science.1140958. [DOI] [PubMed] [Google Scholar]
- 10.Richard P. FEMS Microbiol Rev. 2003;27:547–557. doi: 10.1016/S0168-6445(03)00065-2. [DOI] [PubMed] [Google Scholar]
- 11.Garcia-Ojalvo J, Elowitz M, Strogatz S. Proc Natl Acad Sci USA. 2004;101:10955–10960. doi: 10.1073/pnas.0307095101. [DOI] [PMC free article] [PubMed] [Google Scholar]
- 12.Duysens LNM, Amesz J. Biochim Biophys Acta. 1957;24:19–26. doi: 10.1016/0006-3002(57)90141-5. [DOI] [PubMed] [Google Scholar]
- 13.Betz A, Chance B. Arch Biochem Biophys. 1965;109:585–594. doi: 10.1016/0003-9861(65)90404-2. [DOI] [PubMed] [Google Scholar]
- 14.Richard P, Teusink B, Hemker MB, van Dam K, Westerhoff HV. Yeast. 1996;12:731–740. doi: 10.1002/(SICI)1097-0061(19960630)12:8%3C731::AID-YEA961%3E3.0.CO;2-Z. [DOI] [PubMed] [Google Scholar]
- 15.Danø S, Sørensen PG, Hynne F. Nature. 1999;402:320–322. doi: 10.1038/46329. [DOI] [PubMed] [Google Scholar]
- 16.Aldridge J, Pye EK. Nature. 1976;259:670–671. doi: 10.1038/259670a0. [DOI] [PubMed] [Google Scholar]
- 17.Othmer H, Aldridge J. J Math Biol. 1978;5:169–200. doi: 10.1007/BF00275897. [DOI] [PubMed] [Google Scholar]
- 18.Kuramoto Y. Lecture Notes in Physics. Vol. 39. New York: Springer; 1975. pp. 420–422. [Google Scholar]
- 19.Danø S, Madsen M, Sørensen P. Proc Natl Acad Sci USA. 2007;104:12732–12736. doi: 10.1073/pnas.0702560104. [DOI] [PMC free article] [PubMed] [Google Scholar]
- 20.Strogatz S. Phys D. 2000;143:1–20. [Google Scholar]
- 21.Matthews PC, Strogatz SH. Phys Rev Lett. 1990;65:1701–1704. doi: 10.1103/PhysRevLett.65.1701. [DOI] [PubMed] [Google Scholar]
- 22.Danø S, Hynne F, De Monte S, d'Ovidio F, Sørensen PG, Westerhoff H. Faraday Discuss. 2001;120:261–276. doi: 10.1039/b103238k. [DOI] [PubMed] [Google Scholar]
- 23.Richard P, Bakker BM, Teusink B, van Dam K, Westerhoff HV. Eur J Biochem. 1996;235:238–241. doi: 10.1111/j.1432-1033.1996.00238.x. [DOI] [PubMed] [Google Scholar]
- 24.Poulsen AK, Petersen MØ, Olsen LF. Biophys Chem. 2007;125:275–280. doi: 10.1016/j.bpc.2006.08.009. [DOI] [PubMed] [Google Scholar]
- 25.Wolf J, Passarge J, Somsen OJG, Snoep JL, Heinrich R, Westerhoff HV. Biophys J. 2000;78:1145–1153. doi: 10.1016/S0006-3495(00)76672-0. [DOI] [PMC free article] [PubMed] [Google Scholar]
- 26.Madsen M, Danø S, Sørensen P. FEBS J. 2005;272:2648–2660. doi: 10.1111/j.1742-4658.2005.04639.x. [DOI] [PubMed] [Google Scholar]
- 27.Waters C, Bassler B. Annu Rev Cell Dev Biol. 2005;21:319–346. doi: 10.1146/annurev.cellbio.21.012704.131001. [DOI] [PubMed] [Google Scholar]
- 28.Tang L, Gao T, McCollum C, Jang W, Vicker M, Ammann R, Gomer R. Proc Natl Acad Sci USA. 2002;99:1371–1376. doi: 10.1073/pnas.022516099. [DOI] [PMC free article] [PubMed] [Google Scholar]
- 29.Fung E, Wong W, Suen J, Bulter T, Lee S, Liao J. Nature. 2005;435:118–122. doi: 10.1038/nature03508. [DOI] [PubMed] [Google Scholar]
- 30.Kiss I, Zhai Y, Hudson J. Science. 2002;296:1676–1678. doi: 10.1126/science.1070757. [DOI] [PubMed] [Google Scholar]
- 31.Toth R, Taylor A, Tinsley M. J Phys Chem B. 2006;110:10170–10176. doi: 10.1021/jp060732z. [DOI] [PubMed] [Google Scholar]
- 32.Richard P, Teusink B, Westerhoff HV, van Dam K. FEBS Lett. 1993;318:80–82. doi: 10.1016/0014-5793(93)81332-t. [DOI] [PubMed] [Google Scholar]
- 33.Reijenga KA, Snoep JL, Diderich JA, van Verseveld HW, Westerhoff HV, Teusink B. Biophys J. 2001;80:626–634. doi: 10.1016/S0006-3495(01)76043-2. [DOI] [PMC free article] [PubMed] [Google Scholar]
Associated Data
This section collects any data citations, data availability statements, or supplementary materials included in this article.


