

Abstract
Mrg receptors are orphan G protein-coupled receptors (GPCRs) located mainly at the specific set of sensory neurons in the dorsal root ganglia, suggesting a role in nociception. We report here the 3-D structure of rat MrgA (rMrgA) receptor [obtained from homology modeling to the recently validated predicted structures of mouse MrgA1 and MrgC11] and the structure of adenine (a known agonist, Ki=18nM) bound to rMrgA. This predicted binding site is located within transmembrane helical domains (TMs) 3, 4, 5 and 6, with Asn residues in TM3 and TM4 identified as the key residues for adenine binding. Here the side chain of Asn88 (TM3) forms two pairs of hydrogen bonds with N3 and N9 of adenine while Asn146 (TM4) makes two pairs of hydrogen bonds with N1 and N6 of adenine. These interactions lock adenine tightly in the binding pocket. We also predict the binding site of guanine (not an agonist) and seven other derivatives. Guanine cannot make the hydrogen bond to Asn146 (TM4), leading to binding too weak to be observed experimentally. The predicted binding affinity for other adenine derivatives correlates with the availability of the hydrogen bonds to these two Asn residues. These results validate the predicted structure for rat MrgA and suggest mutation experiments that could further validate the structure. Moreover the predicted structure and binding site should be useful for seeking other small molecule agonists and antagonists.
Keywords: G protein-coupled receptors, Mrg receptors, adenine, docking, HierDock
Introduction
The superfamily of G protein-coupled receptors (GPCRs) is one of the most important classes of membrane proteins, being involved with both cell-to-cell communication and sensory response neurons. Binding of an agonist in the extracellular region activates the GPCR, which in turn activates the heterotrimeric G protein present in the cytosolic domain. This is coupled to the intracellular region of the receptor, regulating downstream signaling pathways in the cell. Important GPCRs include receptors for dopamine, serotonin, and acetylcholine neurotransmitters and for bradykinin and endothelin neuropeptides. GPCRs are also found in various sensory neurons related to smell, taste, pain, and vision. Despite their important roles in biological functionality ~1/3 of the 500 human nonsensory GPCRs remain orphans [1]. Thus it is important to identify the endogenous ligands for these orphan GPCRs.
Recently several groups[2–4] have identified from mouse, rat and human genes a family of new orphan receptors in the specific subset of dorsal root ganglia, suggesting a role in nociception. These receptors have been denoted as sensory neuron-specific receptors (SNSRs) or MAS-related gene (Mrg) receptors. Several studies have been carried out to identify the cognate ligands [5–8]. Most agonists are neuropeptides, such as FMRFa, or peptides similar to fragments of endogenous opioid peptides. However, rat MrgA has been shown to be activated by adenine (and not guanine). Indeed adenine activates rMrgA with a Ki value of 18 nM, potentially identifying it as the endogenous ligand [4]. Another example is mouse MrgD that is activated by beta-alanine (EC50 = 44 μM) [6].
The characterization of the ligand binding site is an important first step in identifying the endogenous ligand for orphan receptors, and it is particularly important for designing new ligands that could aid in determining the function of these receptors and possibly remedying any disease associated with them.
In this paper we predict the 3-D structure of the rMrgA receptor, and we report the ligand binding site for adenine and related ligands. This work builds upon our recent studies in which we first predicted the 3-D structures of mouse MrgC11 (mMrgC11) and MrgA1 (mMrgA1) receptors using the MembStruk computational method [9, 10]. These structures were validated by predicting the binding sites and energies for several tetrapeptides, identifying key residues, and then experimentally confirming the expected changes in binding resulting from mutations of these residues.
For this study on rMrgA, we use these validated mMrgC11 and mMrgA1 structures as templates to predict with homology modeling the 3-D structure of rMrgA receptor, which has 49 % and 77 % sequence identity with mMrgC11 and mMrgA1 respectively. Then we used this structure of rMrgA in conjunction with the HierDock computational procedure to predict the binding site of all nine ligands to the rMrgA receptor for which experimental data is available. We also compare the putative binding site of rMrgA receptor with those of other known adenine-related GPCRs like adenosine receptors and purinergic receptors.
Computational methods
Molecular modeling of receptor structure
Starting with the 3-D structures for mMrgC11 and mMrgA1[11] as templates, we used MODELLER6v2 (University of California San Francisco, San Francisco, CA) to build a homology model for the 3-D structure of rMrgA receptor. The sequence of rMrgA receptor (TrEMBL accession number: Q7TN49) was aligned with mMrgC11 (TrEMBL accession number: Q8CIP3) and mMrgA1 (TrEMBL accession number: Q91WW5) using Clustal-W (version 1.82) [12] as shown in Fig. 1. The sequence identity of rMrgA with mMrgC11 is 49 %, while that for mMrgA1 is 77 %, for the entire sequences. The TM regions have 44 to 76 % identity (totaling 56 %) between rMrgA and mMrgC11 and 77 ~ 88 % identity between rMrgA and mMrgA1 (totaling 83 %). The mMrgC11 and mMrgA1 structures were predicted [11] using the MembStruk computational protocol, and validated by
Figure 1.

The sequence alignment provided as an input for the homology modeling of rMrgA. The transmembrane regions were obtained from the mMrgC11 and mMrgA1 structures. The N-terminus (11 residues) and C-terminus (38 residues) were omitted because for class A GPCRs (rhodopsin-like) they generally do not play a role in the binding of small ligands [45].
using the HierDock computational protocol to predict the binding site for a series of tetrapeptides established experimentally to bind (~100 nM),
identifying the critical residues for binding these ligands,
experimentally building 6 mutations in the binding site (3 of which were predicted to bind ~100 times worse and 3 of which were predicted to bind similarly),
experimentally verifying the predictions.
The MembStruk and HierDock protocols have also been applied to other GPCRs including bovine rhodopsin receptor [10], human dopamine D2 receptor [13], human β2 adrenergic receptor [14] and several olfactory receptors [15–17]. In each case the key interactions observed in the experiments are identified from our prediction, validating that these methods can predict the 3D structures of the proteins and the binding sites of strongly bound ligands to these sites.
After predicting the overall 3-D structure of rMrgA by homology-modelling, the side chain conformations were re-assigned using the SCWRL3.0 side chain replacement program (~1.4 Å diversity),[18] and hydrogen atoms were added using the POLYGRAF software. The all-atom structure was optimized with the conjugate gradient minimization technique to an RMS in force of 0.5 kcal/mol/Å. Subsequently, this minimized receptor structure was used as the starting point for gas phase NVT molecular dynamics (MD) simulations (using an internal dielectric constant of 2.5) at 300 K for 10 ps to account for changes in the backbone conformation. The conformation with the lowest total energy in the trajectory was selected and minimized to an RMS force of 0.5 (kcal/mol)/Å. All simulations used the DREIDING force field (FF) [19] with charges from CHARMM22 [20] in the MPSim code [21]. The cell multipole method [22] was used for calculation of non bond interaction.
QM calculation of ligand tautomers
We docked to rMrgA the 9 molecules shown in Fig. 2 (including adenosine phosphates), for all of which there are measured binding constants. The structures for these molecules were constructed using the Cerius2 build module (Accelrys Inc., San Diego, CA). The ligand conformations were minimized using conjugate gradients with the DREIDING FF and GASTEIGER charges [23]. For ligands with a significant number of torsions, such as 6-benzylaminopurine (6BAP), adenosine and adenosine phosphates, the x-ray crystal structures were obtained from the Cambridge Structural Database and used as the starting conformation for docking without further optimization.
Figure 2.

The ligand compounds used in docking studies for the rMrgA receptor. They are placed in order of experimental binding affinity from top-left to bottom-right (except for adenosine phosphates). No binding was detected experimentally for the ligands of the third row. For 1-methyladenine (1MA) and 6-benzylaminopurine (6BAP), the most stable tautomeric forms are shown together.
For 1-methyladenine (1MA) and 6BAP, several tautomeric forms are possible in addition to the direct substitution at N1 or N6 of adenine. For these systems we built all such tautomeric forms (see Fig. 2) and calculated their relative stabilities using quantum mechanics (QM) to determine the dominant tautomeric form.
The QM calculations used the B3LYP version of density functional theory which includes both the Becke generalized gradient approximation of exact Hartree-Fock exchange [24] and the LYP correlation functional [25], as implemented in the Jaguar v5.5 software (Schrodinger, Portland, OR). The geometries were first optimized in the gas phase using the 6-31G** basis set. The vibrational frequencies for thermodynamic quantities were calculated at the same level. The calculated frequencies were scaled by the factor 0.9614 appropriate for B3LYP/6-31G*. All thermodynamic quantities were computed at 298.15K, based on standard ideal-gas statistical mechanics and the rigid-rotor harmonic oscillator approximations. We calculated the solvation energy in water using the Poisson-Boltzmann methodology with standard parameters [dielectric constant εH2O = 80.37, solvent probe radius RH2O = 1.40 Å, and Dreiding van der Waals radii of atoms] for the final optimized QM structure. These results are in Table S1 of the supplementary information.
Scanning the receptor to determine the putative binding region
To select the putative binding region, we used adenine (the best binder) to scan the entire receptor structure of rMrgA. To do this we first calculated the molecular surface using autoMS utility in DOCK4.0 [26] with the default values for surface density (= 3.0 dots/Å2) and probe radius (= 1.4 Å). Then we used SPHGEN in DOCK4.0 to generate spheres from each surface point to fill up the void space in the receptor. The receptor was partitioned into 41 cubic boxes with each side of 10 Å such that all void spheres were included. The spheres inside each box were taken as an input for DOCK4.0 to define the docking region. The scoring energy grids of the protein were calculated using GRID in DOCK4.0, with a grid spacing of 0.3 Å and a nonbond cutoff distance of 10 Å. For each of the 41 regions, we performed rigid docking with the anchor search option in DOCK4.0. For each region, we sampled orientations until 100 passed the bump test and then we selected the ten top scoring orientations. For each of these 10 from each of the 41 boxes, we used MPSim to minimize the ligand conformation with the receptor coordinates fixed to obtain the final energy scores. Here we used the Dreiding FF. After scoring with MPSim, we calculated the percentage of buried surface for each of these 410 orientations using the Connolly MS program from Quantum Chemistry Program Exchange (QCPE). Of these, 103 had over 90 % of buried surface. From these we selected the best orientation for each box. Out of the 41 boxes, this led to seven possible binding regions with good energy and > 90 % buried surface. We then clustered the spheres near these seven regions, to obtain the two distinct putative binding sites shown in Fig. S1.
Docking adenine and guanine into the predicted putative binding sites
The HierDock protocol was used to predict the binding site and energy of adenine to both binding regions. This protocol has been used for several GPCRs [9, 10, 13, 14, 16, 27, 28], outer membrane protein A [29], and globular proteins [15, 30–34]. In this paper we used the modified HierDock protocol (MSCdock) described in Cho et al. 2005 [35]. Briefly, this uses a modified DOCK4.0 to generate a complete set of families of ligand configurations differing by a diversity of 0.60 Å. Here we used a rejection ratio of 2.2 to define completeness (leading to 2,453 families that passed the bump tests). We then enriched the top 75 families until there was an average of six members in each family (passing the bump tests). Then we scored these using MPSim (Dreiding FF) and selected the 30 best scoring family heads. These were minimized (conjugate gradients) using MPSim (50 steps or 0.1 kcal/mol/Å) with ligand movable and the receptor atoms fixed. Then the 5 best scoring ligands (total energy) were selected and the side chain conformations of the residues of the receptor within 5 Å of the bound ligand were reassigned using the SCREAM side chain replacement program [Kam, Vaidehi and Goddard in preparation] (This uses a side chain rotamer library of 1 478 rotamers with 1.0 Å resolution, with all atom DREIDING energy function to evaluate the energy for the ligand-receptor complex). The binding energies were then calculated for these 5 optimized ligand-receptor complex structures as the difference between the energy of the ligand in the fixed receptor and the energy of the ligand in solution. The energy of the free ligand was calculated for the docked conformation and its solvation energy was calculated using Analytical Volume Generalized Born (AVGB) continuum solvation method [36]. The dielectric constants for the continuum solvation method were set to 78.2 for the external region and to 1.3 for the internal region.
Guanine shows no binding in the experiments (worse than ~ 100 μM). We docked it to the two putative binding regions determined from scanning the receptor (shown in Fig. S1).
Refinement of the binding mode of adenine
To account for changes in the backbone structure of the receptor due to ligand binding, we started with the docked structure and carried out annealing MD simulations allowing the ligand and residues within 10 Å in the binding pocket to move (with other residues fixed). The procedure was to heat the system from 50 K to 600 K and then to cool it back down to 50 K in steps of 50 K. At each temperature the velocities were first scaled to obtain the correct initial kinetic energy and the system was then equilibrated for 1ps using the Nose thermostat (NVT). Thus the total MD time was 23 ps. At the end of the annealing cycle, the system was minimized to an RMS force of 0.3 (kcal/mol)/Å and the side chains of the residues within 5 Å from the ligand were reassigned again with SCREAM.
Docking of other adenine derivatives
After optimizing the structure for adenine in the receptor, we re-clustered the spheres to define the binding site. Spheres within 1.0 Å from any atom in the docked adenine were selected out of the entire spheres generated for the final receptor structure that was previously optimized with adenine. We then used the HierDock procedure described above to dock the adenine derivatives.
Results and Discussion
Characteristics of receptor structure
The sequence identity of rMrgA receptor with bovine rhodopsin is ~18 % for TM regions (the averaged value obtained with the independent alignments for each TM). The RMSD of the coordinates of the Cα atoms between our model of rMrgA and the X-ray structure of rhodopsin is 3.72Å in TM regions [37].
The RMSD of rMrgA with mMrgA1 (83 % sequence identity for TM regions) is 0.41 Å in the TM regions and the RMSD with mMrgC11 (56 % sequence identity for TM regions) is 2.59 Å in the TM regions (the sequence alignment is shown in Fig. 1). The predicted 3-D structure of rMrgA is shown in Fig. 3b where it is superimposed with the predicted structures of mMrgA1 and mMrgC11. The MODELLER program uses restraints based on weighted Gaussian distribution functions, where the weighing factor depends on the local sequence similarity. Thus the rMrgA loops involved some weighting of the loops from of mMrgA1 and from mMrgC11.
Figure 3.
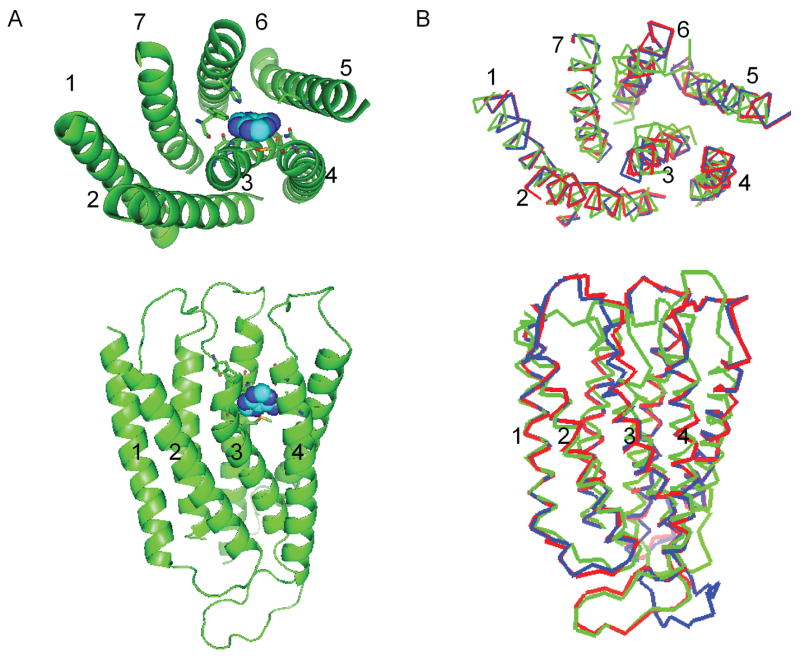
The predicted 3-D structure of the rMrgA receptor. The top part shows the view from the extracellular side, while the bottom part shows the side view (with the extracellular part on top).
A) Adenine (in spheres) is docked in the rMrgA receptor. The residues within 5 Å of adenine are shown as sticks.
B) The rMrgA receptor (red) is overlapped with mMrgA1 (blue) and mMrgC11 (green).
Fig. 4 shows the interhelical hydrogen bond network in TM regions formed in the rMrgA receptor;
Figure 4.

Interhelical hydrogen bonds (dashed lines) in rMrgA receptor, as identified using HBPLUS [46] (maximum D-A distance = 3.9 Å, minimum D-H-A angle = 90.0 °).
The Asn31 (TM1) makes hydrogen bonds with the side chain of Asp58 (TM2) and the backbone carbonyl of Cys256 (TM7) at the same time and contributes to the interhelical stability among TM1, TM2 and TM7. This Asp-Asn pair is highly conserved across the family A of GPCRs, corresponding to Asp83 and Asn55 in bovine rhodopsin. There is a similar pattern in rhodopsin structure [38] where a carbonyl group of A299 in the backbone of TM7 is the common hydrogen bond acceptor for Asn55. In mMrgA1, these homologous residues form the same pattern of hydrogen bonds.
The Tyr95 (TM3) is conserved throughout the Mrg receptor family (although 5 of 36 have a Phe conservative replacement at this position). Here the hydroxyl group of Tyr forms an interhelical hydrogen bond with a backbone carbonyl group of C218 in TM6. The mMrgA1 has the same interaction with these homologous residues, but in the apo mMrgC11 receptor this conserved Tyr residue participates in aromatic interactions in TM regions [11].
The highly conserved Asn53 (TM2) and Trp136 (TM4) form a hydrogen bond as observed in rhodopsin (Asn78 and Trp161), which we also find in both mMrgA1 and mMrgC11.
One more hydrogen bond pair exists between Ala46 (TM2) and Thr129 (TM4) near the intracellular region. This interaction is unique for rMrgA, although the Thr is conserved in mMrgA1.
In addition, the positively charged residue Arg147 (TM4) is oriented slightly towards the lipids and might make contact with the negatively charged head group of the lipid molecule. We find that it forms hydrogen bonds with Cys86 and Thr89 in TM3 that are one helical turn apart. Arg147 is replaced by Ser and Trp in mMrgA1 and mMrgC11 respectively, which do not participate in interhelical hydrogen bond interactions.
The highly conserved proline residues in TM6 and TM7 across the family A of GPCRs correspond to Pro221 (TM6) and Pro258 (TM7) in rMrgA receptor. They lead to bends of 15° and 18° in the α-helix structure.
The Pro94 (TM3) in rMrgA receptor corresponds to the double Gly in the middle of rhodopin. In both cases this leads to bending (19° for rMrgA and 13° for rhodopsin), making the overall backbone conformation of TM3 in these two receptors similar.
QM results of ligand tautomers
The QM results of the free energies for the different tautomeric forms (Fig. 2) of 1MA and 6BAP are shown in Table S1. We find that in solution the free energy of 1MA1 is 1.87 kcal/mol lower than that of 1MA2. The relative abundance with respect to the tautomer with the lowest free energy was calculated from the free energy using the equation;
where R is the gas constant (= 1.986 cal/mol K) and T is the temperature (= 298.15 K). Thus we predict that the relative abundance of 1MA2 is only ~4 % of 1MA1 [In contrast 1MA1 is less stable than 1MA2 by 3.5 kcal/mol in the gas phase.].
There are three tautomers for 6BAP, but 6BAP1 is the most stable both in gas phase and in aqueous solution. Here the others forms have negligible abundance.
These calculations suggest that the majority species for 1MA or 6BAP have direct substitution at the N1 or N6 of adenine. All tautomeric forms were chosen for the docking studies and it turned out that these directly-substituted forms showed the best binding energy.
Location of the Binding site
MSCdock predicts that the adenine binding site lies among TM3, TM4, TM5 and TM6 as shown in Fig. 3. This TM3-4-5-6 pocket (corresponding to region 2 in Fig. S1) is predicted to provide the binding site for the agonists to a number of other GPCRs (including dopamine, adrenergic, histamine). In addition the adenine is in a region similar to the β-ionone ring of 11-cis retinal in bovine rhodopsin (but the adenine leans more towards TM4 instead of TM6).
The scanning step also found a second binding site, denoted as region 1 in Fig. S1. This other site is located in the interhelical hydrogen bond network among TM1, TM2 and TM7. In this site both adenine and guanine make a hydrogen bond with the highly conserved Asp58 in TM2, but the binding pocket is mostly hydrophobic except for this Asp residue. We found that the calculated binding energy of adenine in region 1 is only 66 % of that in region 2. The binding energies of guanine in region 1 and 2 were 73 % and 78 % respectively, of that for adenine in region 2. Thus we conclude that this site is not the site for agonist binding (it could play a role for antagonists).
As discussed previously, Asp58 (TM2) plays a key role in stabilizing the TM1, 2, 7 triad, and it may be the site at which Na+ binds for the allosteric regulation observed in human adenosine A1 receptor and α2A adrenergic receptor [39, 40], making it unlikely to serve as the agonist binding site.
Based on these results we ruled out region 1 as a possible binding site.
Predicted Binding site of Adenine
Adenine is reported as the potential endogenous ligand for rMrgA receptor by Bender et al. [4] The binding mode is detailed in Fig. 5a. The most critical residues for binding are Asn88 (TM3) and Asn146 (TM4). They each form bidentate hydrogen bonds with adenine, locking it tightly inside the pocket. The hydrogen bond partners of Asn146 are the same nitrogen atoms of adenine that participate in the DNA base pair. In addition Phe83 in TM3 and His225 in TM6 have good π stacking interactions with the purine ring. These features characterizing adenine binding site agree well with the empirical observations by Nobeli et al. to explain the molecular discrimination of adenine and guanine ligand moiety in complexes with proteins [41]. They observed that the protein aromatic residues stabilize an environment in which the ligand would have π stacking interaction with the side chain of these residues and that His is much more favorable for adenine. They found that amino acids with side chains like Asn that can form simultaneously a donor hydrogen bond and an acceptor hydrogen bond are favored for binding adenine.
Figure 5.

The predicted binding pockets of adenine (top) and guanine (bottom) in the rMrgA receptor. All residues within 5 Å from the bound ligand are shown. The residue labels are colored according to the binding energy contributions from non bond interaction with the ligand:
red: more favorable than -10 kcal/mol contribution (best),
green: between -10 and -4 kcal/mol,
blue: less favorable than -4 kcal/mol (worst).
The hydrogen bonds are indicated by dotted lines with the distance between the donor and acceptor atoms. The number in parenthesis indicates the TM segment containing the residue.
For mMrgC11 the di- and tetra-peptide agonists were both predicted to bind to in the TM3-4-5-6 pocket [11]. Asn146 (TM4) is homologous to Asp161 in mMrgC11, which was identified as a key residue in ligand binding. However, Asn88 is replaced by Gly in mMrgC11 so that adenine is not expected to bind to mMrgC11. The hydrophobic interaction of Leu174 (TM5) was also found in the predicted binding site of mMrgC11.
The residues within the binding pocket in Fig. 5 are grouped by color according to the intermolecular interaction energy with the ligand (red is strongest, blue is weakest). Here the intermolecular interaction energy includes Coulomb, van der Waals, and hydrogen bond terms. The most important are Asn88 and Asn146, which show strong hydrogen bond interactions. Met92 has moderate van der Waals interaction with adenine.
Predicted Binding site of Guanine
Changing the docked adenine structure to guanine, we find that the hydrogen bond donor and acceptor in the side chain of Asn146 do not match with the counterparts in guanine, resulting in a decrease in the predicted binding energy (by 17 % compared to that for adenine) for guanine in this configuration. However N2 of guanine forms a new weak hydrogen bond with sulfur of Cys150.
Independently docking guanine, leads to a structure in which the guanine has the different orientation shown in Fig. 5b. Here its hydrogen bond interactions with Asn146 are not optimal. The carbonyl group of the Asn146 side chain loses a hydrogen bond partner and the Asn146 amine group does not make a good hydrogen bond. However the guanine retains similar interaction with the other residues.
Thus the predicted structure of rMrgA, explains the dramatic difference in bonding between adenine and guanine. Adenine can bind to both Asn in the active site leading to good hydrogen bonds for N1, N3, N6, and N9. In contrast guanine in the same configuration could make only half of these. As a result guanine binds in an alternate site where the sidechain of Asn88 forms hydrogen bonds with the N1 and O6 atoms of guanine and Asn146 forms a weak hydrogen bond with N7, but having 78 % less binding energy than adenine. However if Tyr95 that is found nearby N2 and N3 of guanine is mutated to Gln, formation of two more hydrogen bonds would be expected and might enhance the binding affinity in spite of the loss in van der Waals interactions. Indeed the predicted binding energy of guanine in the Tyr95Gln mutant is comparable to that of adenine in the wild type (99.9 % of adenine binding).
The total intermolecular interaction energy and its each component in the binding pocket composed of residues within 5 Å from the bound ligand are tabulated in Table 1.
Table 1.
Decomposition of total intermolecular interaction energies (kcal/mol) between ligand and rMrgA receptor, calculated for the residues within 5 Å of the ligand.
| Ligand | Coulomb | VDW | Hbonds | TOTAL |
|---|---|---|---|---|
| Adenine | −2.37 (100) | −11.63 (100) | −28.17 (100) | −42.17 (100) |
| 1MA | −1.20 (50) | −16.16 (138) | −23.87 (84) | −41.23 (97) |
| 6BAP | −0.35 (14) | −29.90 (257) | −12.58 (44) | −42.82 (101) |
| HPX | −3.06 (129) | −12.64 (108) | −13.95 (49) | −29.65 (70) |
| Guanine | −3.27 (137) | −14.26 (122) | −16.59 (58) | −34.12 (80) |
| Adenosine | −1.23 (51) | −22.84 (196) | −12.95 (45) | −37.02 (87) |
The numbers in parentheses are percentages of interaction energies relative to that for adenine.
Predicted Binding Site of Medium Binders
For 1MA (Ki=4.4 μM) we also calculated two binding modes, one by perturbing adenine to 1MA, the other with independent docking. The binding modes of 1MA are described in Fig. 6. The perturbed structure built by direct substitution at N1 in the docked adenine leads to a big clash between the bulky methyl group and Asn146. The independently docked 1MA is locked between Asn88 and Asn146 through hydrogen bonds with these two residues. However, this leads to slightly weakened bonding with Asn146 due to the loss of one of the hydrogen bonds. This leads to a predicted binding energy of 83 % relative to that to adenine. The methyl substituent of 1MA resides in the good hydrophobic environment.
Figure 6.

The 5 Å binding pockets for various ligands in the rMrgA receptor. The same color scheme is used as for Fig. 5. A) 1-Methyladenine, B) 6-benzylaminopurine, C) Hypoxanthine, D) Adenosine.
For 6BAP, another mild binder (Ki=58 μM), we find a docking orientation similar to that of 1MA. Here the large benzyl substituent has a close contact with Tyr95 with good π stacking interactions making the van der Waals term the dominant non bond interaction. 6BAP also forms hydrogen bonds with Asn88 and Asn146, but the interaction with Asn146 is weaker than for adenine or 1MA. The loss of this interaction is partly compensated by the increased van der Waals interactions as shown in Table 1. The result is a binding energy of 92 % relative to that of adenine.
Predicted Binding site of Poor Binders
Hypoxanthine, one of the bad binders, makes nice contacts with Asn146 but has weak interactions with Asn88. Its hydrogen bond energy is comparable to 6BAP in Table 1, but the van der Waals interaction energy is insufficient to overcome the decreased hydrogen bond energy. The result is a binding energy of 71 % relative to that of adenine.
For adenosine, we find that only Asn88 makes good hydrogen bond contacts with the ligand, with no other residues having good specific interactions. The result is a binding energy of 71 % relative to that of adenine.
Predicted Binding site of adenosine phosphates
Adenosine mono- and tri-phosphates (AMP and ATP) are observed to have binding constants to rMrgA in the range of 20–60 μM concentration. Our predicted structures are in Fig. 7. We find that the adenine moiety forms two good hydrogen bonds with Asn88, but they have different glycosyl torsion angles. In both cases the sugar ring has a contact with Asn146. We find that the phosphate group points toward extracellular region and is stabilized by Arg147 in TM4 (on the boundary between the inside-bundle region and the membrane). This is the only positively charged residue located on the upper half of TM regions (excluding a Lys233 at the end of TM6). This further validates our prediction of binding site.
Figure 7.

The 5 Å binding pockets of adenosine phosphates in the rMrgA receptor. A) AMP, B) AMP, C) ADP, D) ATP.
For neutral ligands such as adenine, the side chain of Arg147 leans more toward the membrane regions which might allow it to contact the head group of lipid as seen in the apo protein in Fig. 4. However when the phosphate comes into the binding pocket, the Arg147 would move toward the pocket.
For adenosine diphosphate (ADP), the sugar ring interacts with Asn146 in the similar way to AMP but the adenine base does not interact strongly with Asn88 (see Fig. 7c). The phosphate group shows strong interaction with Arg147 and Thr89.
Comparison of calculated binding energy to ln Ki
The predicted binding energies for the various ligands are compared in Fig. 8 with the experimental competition binding constant (inhibition constant) reported by Bender et al. [4] Of the nine compounds whose binding constants have been measured, we examined only the six neutral ligands with the fewest torsional degrees of freedom (since the adenosine phosphates are highly negative-charged, the entropic effect in binding is no longer negligible and the uncertainty in calculated solvation energy increases). Fig. 8 shows the good correlation between our calculated binding energy and the experimental inhibition constant, ln Ki. The calculated binding energy distinguishes the poor ligands and shows qualitative agreement with the experimental affinity among the good or medium binders. The calculating binding energy is for the minimized structure at 0 K, which ignores entropic effects. Except for adenosine and 6BAP all ligands are rigid with similar shapes so that the entropic contributions should be similar. Thus, the predicted reverse ordering for 1MA and 6BAP in the predicted binding energy might arise from differential entropic effects (due to loss of translational and rotational entropy and the loss of internal degrees of freedom within the ligand and in the amino acid side chains) in comparing the binding between the more diverse ligands. These factors become larger for a bulkier ligand. Nevertheless, this overall good correlation provides additional validation of our predicted structures and binding configurations.
Figure 8.

Comparison of calculated binding energies (left legend) with the experimental inhibition constants (right legend) for rMrgA ligands as described in the Methods section, the calculated energies are for the minimized structure (0K) without entropic contributions.
Effect of Computational Alanine-scanning mutations (CASM) in the binding pocket
For the best binder, adenine, we carried out alanine scanning to assess the importance of various residues to binding. The residues within 5 Å of the ligand were each independently mutated to Ala and the energy for the ligand-protein complex was reoptimized (conjugate gradient minimization). Prior to the minimization we used SCREAM to reselect the side chain conformations of the other residues within 5 Å of the ligand. The results are summarized in Table 2.
Table 2.
Computational alanine-scanning results for adenine/rMrgA (energies in kcal/mol).
| I.E.(WT)a | ΔI.E.(Ala)a | ||
|---|---|---|---|
| Asn88 | −17.787 | 17.161 | 41% |
| Asn146 | −12.819 | 12.275 | 29% |
| Met92 | −4.741 | 2.844 | 7% |
| Phe83 | −1.545 | 1.433 | 3% |
| His225 | −1.505 | 1.349 | 3% |
| Leu174 | −0.665 | 0.432 | 1% |
| Tyr95 | −0.422 | 0.344 | 0.8% |
| Ile96 | −0.450 | 0.333 | 0.8% |
| Phe178 | −0.298 | 0.265 | 0.6% |
| Cys150 | −0.494 | 0.207 | 0.5% |
| Thr170 | −0.273 | 0.168 | 0.4% |
| Met91 | −0.321 | 0.161 | 0.4% |
| Arg147 | −0.360 | 0.091 | 0.2% |
| Pro85 | −0.393 | 0.086 | 0.2% |
| Leu177 | −0.102 | 0.066 | 0.2% |
The intermolecular interaction energy (IE) for the wild type (WT, no mutation) is shown for all residues within 5 Å of the ligand. After mutating the residue to Ala and minimizing, we recalculated the IE of the ligand to this Ala, IE(Ala).
The percentage change in binding of the mutant relative to the calculated total binding of WT is shown in the last column.
As expected, the Asn88Ala and Asn146Ala mutations significantly reduce the binding affinity due to the loss of the hydrogen bonds. Mutation of either Phe83 or His225 abolishes the favorable van der Waals contacts.
The close correspondence between the contributions predicted for the wild type and the change in bonding calculated with the mutation to Ala, indicates that good estimates can be made without optimization of the coordinates.
Comparison of the adenine binding site in rMrgA to the nucleotide binding sites in adenosine receptors and purinergic receptors
We can compare the binding site of adenine to rat MrgA with the binding site of human A1 and A2A adenosine (hA1A and hA2AA) receptors and human P2Y1 purinergic (hP2Y1) receptor. These receptors all bind adenosine or ATP, with the adenine moiety in common, and all have been studied both experimentally and with modeling. The sequences of the adenosine receptors and the purinergic receptor were aligned separately with that of rMrgA receptor. The whole sequences were aligned first with Clustal-W while ensuring that specific highly conserved residues are matched to each other in the alignment: Asn at position 20 in TM1, Asp at position 13 in TM2, Arg in DRY sequence of TM3, Trp at position 12 in TM4, Pro at position 19 in TM6, Pro in NPXXY of TM7 (the number is counted from the starting residue of each TM in Fig. 9). Using the TM prediction of rMrgA receptor, the sequences for each TM were aligned independently. The averaged sequence identity of rMrgA receptor is ~22 % for hA1A receptor and ~20 % for hA2AA receptor (considering only TM regions). For hP2Y1 receptor, the TM sequence identity to rMrgA is ~24 %. The resulting TM sequence alignment is shown in Fig. 9 where the key residues in adenosine receptors and P2Y1 receptor identified from the binding or functional assay experiments are bolded and underlined [42, 43].
Figure 9.

The sequence alignment of rat MrgA receptor with other receptors known to bind adenine components of ligands: human A1 and A2A adenosine receptors and human P2Y1 purinergic receptor. The residues predicted to play an important role in ligand binding are in bold face and underlined.
Recall that for rMrgA the adenine binding site is located in the pocket of TM3, TM4, TM5 and TM6, contacting Asn88 (TM3), Asn146 (TM4), Leu174 (TM5) and His225 (TM6).
In the putative A2A binding site, the adenine moiety is recognized by TM3, TM5 and TM6 [42]. The binding regions in TM3 overlap significantly throughout four receptors but we could not find any residue from adenosine or purinergic receptor that directly matches with Asn88 in rMrgA receptor. However, Gln92 in TM3 of hA1AR has the same functional group as Asn (shorter by one methylene) which was found to interact with the adenosine adenine moiety [44]. Asn146 in TM4 is a key residue in the adenine binding in rMrgA, but no similar residue is identified as a key residue in TM4 of adenosine or purinergic receptor. Arg157 in TM4 interacts with phosphate group of adenosine phosphates in rMrgA while Lys (TM6) and Arg (TM7) are involved in P2Y1 receptor.
In conclusion, although similar residues recognize adenine, there is very little similarity in the location of the binding site of adenine in rMrgA receptor compared to adenosine and purinergic receptors. This suggests that rMrgA belongs to non-adenosine or non-purinergic receptor families even though adenine binds well and activates the receptor.
Comparison to other MrgA orthologs
We examined the sequences of the 8 mouse orthologs of rMrgA receptor to determine whether some might be good candidates for possible adenine binding receptors. These are collected together and compared to rMrgA in Fig. S2. Among the eight mouse MrgA (mMrgA) receptors, we find that the mMrgA2 receptor has Asn residues at the same two positions in TM3 and TM4 as in rMrgA receptor. However, Bender et al. tested activation of the mMrgA2 receptor with adenine and found no activation [4]. Perhaps this is because the mMrgA2 receptor does not have a proline in the middle of TM3 analogous to the Pro94 of the rMrgA receptor that we found to induce the bend in TM3. The change in the conformation of TM3 might put the Asn in TM3 of mMrgA2 receptor in the wrong orientation to bind sufficiently tight with adenine, explaining the lack of binding or activation by adenine in mMrgA2, even though it has the same pair of Asn as rMrgA. This could be tested by mutating the Pro94 of rMrgA to Val as in mMrgA2 to see if this causes a loss in activity or by mutating the Val94 of mMrgA2 to Pro to see if this leads to activity for adenine.
On the other hand, mMrgA5 receptor contains Pro in TM3 at the same position as in rMrgA and the Asn146 of rMrgA is also conserved. However, the Asn88 in TM3 of rMrgA is replaced with Tyr in mMrgA5 receptor. Here we suggest that mutation of Tyr87 to Asn in mMrgA5 might lead to adenine binding.
Summary and Conclusion
We predicted the 3-D structure of rMrgA receptor using homology to our MembStruk predicted mMrgA1 and MrgC11 structures and we predicted the binding sites for adenine and its derivatives using HierDock. The putative binding site is within TM3, 4, 5 and 6 with Asn88 in TM3 and Asn146 in TM4 serving as key residues in binding adenine. This Asn146 is homologous to Asp161 in mMrgC11 receptor that we previously identified as a key residue which was then validated experimentally. The side chain of Asn146 plays the role of the thymine in the same way as in the Watson-Crick hydrogen bond geometry of the A-T DNA base pair. It forms a bidentate hydrogen bond with both the N1 and N6 atom of adenine. The availability of the hydrogen bonds with these two Asn residues correlates with the binding affinity of the ligand.
These studies of the rMrgA receptor provide targets for mutagenesis experiments to further identify or validate important features in the binding site. This predicted binding site could be used to identify other small molecule ligands. Experimental tests of such ligands might help identify the endogenous ligand.
Electronic supplementary material
The supplementary material contains Table S1, the QM calculation of Gibbs free energies for various tautomeric forms of 1MA and 6BAP and Figure S1, the putative binding sites predicted from the HierDock scanning procedure. It also contains Figure S2, the Clustal-W multiple sequence alignment of rat MrgA with mouse MrgAs.
Supplementary Material
Acknowledgments
We thank Prof. Mel Simon for suggesting this project. This research was supported partially by NIH (MH073910, CA112293, AI040567), and the computational facilities were provided by DURIP grants from ARO and ONR. The facilities of the Materials and Process Simulation Center are also supported by DOE (ASC), NSF (NIRT and IRT), MURI-ARO, MURI-ONR, ChevronTexaco, Dow Corning, Intel, Nissan Corp, Aventis Pharma, Berlex Biopharma, Boehringer-Ingelheim, Pfizer and Allozyne.
Footnotes
Publisher's Disclaimer: This is a PDF file of an unedited manuscript that has been accepted for publication. As a service to our customers we are providing this early version of the manuscript. The manuscript will undergo copyediting, typesetting, and review of the resulting proof before it is published in its final citable form. Please note that during the production process errors may be discovered which could affect the content, and all legal disclaimers that apply to the journal pertain.
References
- 1.Moro S, Deflorian F, Spalluto G, Pastorin G, Cacciari B, Kim SK, Jacobson KA. Demystifying the three dimensional structure of G protein-coupled receptors (GPCRs) with the aid of molecular modeling. Chem Commun. 2003:2949–2956. doi: 10.1039/b303439a. [DOI] [PMC free article] [PubMed] [Google Scholar]
- 2.Dong XZ, Han SK, Zylka MJ, Simon MI, Anderson DJ. A diverse family of GPCRs expressed in specific subsets of nociceptive sensory neurons. Cell. 2001;106:619–632. doi: 10.1016/s0092-8674(01)00483-4. [DOI] [PubMed] [Google Scholar]
- 3.Lembo PMC, Grazzini E, Groblewski T, O'Donnell D, Roy MO, Zhang J, Hoffert C, Cao J, Schmidt R, Pelletier M, Labarre M, Gosselin M, Fortin Y, Banville D, Shen SH, Strom P, Payza K, Dray A, Walker P, Ahmad S. Proenkephalin A gene products activate a new family of sensory neuron-specific GPCRs. Nat Neurosci. 2002;5:201–209. doi: 10.1038/nn815. [DOI] [PubMed] [Google Scholar]
- 4.Bender E, Buist A, Jurzak M, Langlois X, Baggerman G, Verhasselt P, Ercken M, Guo HQ, Wintmolders C, Van den Wyngaert I, Van Oers I, Schoofs L, Luyten W. Characterization of an orphan G protein-coupled receptor localized in the dorsal root ganglia reveals adenine as a signaling molecule. P Natl Acad Sci USA. 2002;99:8573–8578. doi: 10.1073/pnas.122016499. [DOI] [PMC free article] [PubMed] [Google Scholar]
- 5.Han SK, Dong XZ, Hwang JI, Zylka MJ, Anderson DJ, Simon MI. Orphan G protein-coupled receptors MrgA1 and MrgC11 are distinctively activated by RF-amide-related peptides through the G alpha(q/11) pathway. P Natl Acad Sci USA. 2002;99:14740–14745. doi: 10.1073/pnas.192565799. [DOI] [PMC free article] [PubMed] [Google Scholar]
- 6.Shinohara T, Harada M, Ogi K, Maruyama M, Fujii R, Tanaka H, Fukusumi S, Komatsu H, Hosoya M, Noguchi Y, Watanabe T, Moriya T, Itoh Y, Hinuma S. Identification of a G protein-coupled receptor specifically responsive to beta-alanine. J Biol Chem. 2004;279:23559–23564. doi: 10.1074/jbc.M314240200. [DOI] [PubMed] [Google Scholar]
- 7.Grazzini E, Puma C, Roy MO, Yu XH, O'Donnell D, Schmidt R, Dautrey S, Ducharme J, Perkins M, Panetta R, Laird JMA, Ahmad S, Lembo PMC. Sensory central neuron-specific receptor activation elicits and peripheral nociceptive effects in rats. P Natl Acad Sci USA. 2004;101:7175–7180. doi: 10.1073/pnas.0307185101. [DOI] [PMC free article] [PubMed] [Google Scholar]
- 8.Robas N, Mead E, Fidock M. MrgX2 is a high potency cortistatin receptor expressed in dorsal root ganglion. J Biol Chem. 2003;278:44400–44404. doi: 10.1074/jbc.M302456200. [DOI] [PubMed] [Google Scholar]
- 9.Vaidehi N, Floriano WB, Trabanino R, Hall SE, Freddolino P, Choi EJ, Zamanakos G, Goddard WA. Prediction of structure and function of G protein-coupled receptors. P Natl Acad Sci USA. 2002;99:12622–12627. doi: 10.1073/pnas.122357199. [DOI] [PMC free article] [PubMed] [Google Scholar]
- 10.Trabanino RJ, Hall SE, Vaidehi N, Floriano WB, Kam VWT, Goddard WA. First principles predictions of the structure and function of G-protein-coupled receptors: Validation for bovine rhodopsin. Biophys J. 2004;86:1904–1921. doi: 10.1016/S0006-3495(04)74256-3. [DOI] [PMC free article] [PubMed] [Google Scholar]
- 11.Heo J, Han SK, Vaidehi N, Wendel J, Kekenes-Huskey PM, Goddard WA., III Prediction of the 3D structure for FMRF-amide Neuropeptides Bound to Mouse MrgC11 GPCR and Experimental Validation. Chembiochem. 2007;8:1527–1539. doi: 10.1002/cbic.200700188. [DOI] [PubMed] [Google Scholar]
- 12.Thompson JD, Higgins DG, Gibson TJ. Clustal-W - Improving the Sensitivity of Progressive Multiple Sequence Alignment through Sequence Weighting, Position-Specific Gap Penalties and Weight Matrix Choice. Nucleic Acids Res. 1994;22:4673–4680. doi: 10.1093/nar/22.22.4673. [DOI] [PMC free article] [PubMed] [Google Scholar]
- 13.Kalani MYS, Vaidehi N, Hall SE, Trabanino RJ, Freddolino PL, Kalani MA, Floriano WB, Kam VWT, Goddard WA. The predicted 3D structure of the human D2 dopamine receptor and the binding site and binding affinities for agonists and antagonists. P Natl Acad Sci USA. 2004;101:3815–3820. doi: 10.1073/pnas.0400100101. [DOI] [PMC free article] [PubMed] [Google Scholar]
- 14.Freddolino PL, Kalani MYS, Vaidehi N, Floriano WB, Hall SE, Trabanino RJ, Kam VWT, Goddard WA. Predicted 3D structure for the human beta 2 adrenergic receptor and its binding site for agonists and antagonists. P Natl Acad Sci USA. 2004;101:2736–2741. doi: 10.1073/pnas.0308751101. [DOI] [PMC free article] [PubMed] [Google Scholar]
- 15.Floriano WB, Vaidehi N, Zamanakos G, Goddard WA. HierVLS hierarchical docking protocol for virtual ligand screening of large-molecule databases. J Med Chem. 2004;47:56–71. doi: 10.1021/jm030271v. [DOI] [PubMed] [Google Scholar]
- 16.Hall SE, Floriano WB, Vaidehi N, Goddard WA. Predicted 3-D structures for mouse 17 and rat 17 olfactory receptors and comparison of predicted odor recognition profiles with experiment. Chem Senses. 2004;29:595–616. doi: 10.1093/chemse/bjh063. [DOI] [PubMed] [Google Scholar]
- 17.Hummel P, Vaidehi N, Floriano WB, Hall SE, Goddard WA. Test of the Binding Threshold Hypothesis for olfactory receptors: Explanation of the differential binding of ketones to the mouse and human orthologs of olfactory receptor 912-93. Protein Sci. 2005;14:703–710. doi: 10.1110/ps.041119705. [DOI] [PMC free article] [PubMed] [Google Scholar]
- 18.Canutescu AA, Shelenkov AA, Dunbrack RL. A graph-theory algorithm for rapid protein side-chain prediction. Protein Sci. 2003;12:2001–2014. doi: 10.1110/ps.03154503. [DOI] [PMC free article] [PubMed] [Google Scholar]
- 19.Mayo SL, Olafson BD, Goddard WA. Dreiding - a Generic Force-Field for Molecular Simulations. J Phys Chem. 1990;94:8897–8909. [Google Scholar]
- 20.MacKerell AD, Bashford D, Bellott M, Dunbrack RL, Evanseck JD, Field MJ, Fischer S, Gao J, Guo H, Ha S, Joseph-McCarthy D, Kuchnir L, Kuczera K, Lau FTK, Mattos C, Michnick S, Ngo T, Nguyen DT, Prodhom B, Reiher WE, Roux B, Schlenkrich M, Smith JC, Stote R, Straub J, Watanabe M, Wiorkiewicz-Kuczera J, Yin D, Karplus M. All-atom empirical potential for molecular modeling and dynamics studies of proteins. J Phys Chem B. 1998;102:3586–3616. doi: 10.1021/jp973084f. [DOI] [PubMed] [Google Scholar]
- 21.Lim KT, Brunett S, Iotov M, McClurg RB, Vaidehi N, Dasgupta S, Taylor S, Goddard WA. Molecular dynamics for very large systems on massively parallel computers: The MPSim program. J Comput Chem. 1997;18:501–521. [Google Scholar]
- 22.Ding HQ, Karasawa N, Goddard WA. Atomic Level Simulations on a Million Particles - the Cell Multipole Method for Coulomb and London Nonbond Interactions. J Chem Phys. 1992;97:4309–4315. [Google Scholar]
- 23.Gasteiger J, Marsili M. Iterative Partial Equalization of Orbital Electronegativity - a Rapid Access to Atomic Charges. Tetrahedron. 1980;36:3219–3228. [Google Scholar]
- 24.Becke AD. Density-Functional Exchange-Energy Approximation with Correct Asymptotic-Behavior. Phys Rev A. 1988;38:3098–3100. doi: 10.1103/physreva.38.3098. [DOI] [PubMed] [Google Scholar]
- 25.Lee CT, Yang WT, Parr RG. Development of the Colle-Salvetti Correlation-Energy Formula into a Functional of the Electron-Density. Phys Rev B. 1988;37:785–789. doi: 10.1103/physrevb.37.785. [DOI] [PubMed] [Google Scholar]
- 26.Ewing TJA, Kuntz ID. Critical evaluation of search algorithms for automated molecular docking and database screening. J Comput Chem. 1997;18:1175–1189. [Google Scholar]
- 27.Floriano WB, Vaidehi N, Goddard WA, Singer MS, Shepherd GM. Molecular mechanisms underlying differential odor responses of a mouse olfactory receptor. P Natl Acad Sci USA. 2000;97:10712–10716. doi: 10.1073/pnas.97.20.10712. [DOI] [PMC free article] [PubMed] [Google Scholar]
- 28.Floriano WB, Vaidehi N, Goddard WA. Making sense of olfaction through predictions of the 3-D structure and function of olfactory receptors. Chem Senses. 2004;29:269–290. doi: 10.1093/chemse/bjh030. [DOI] [PubMed] [Google Scholar]
- 29.Datta D, Vaidehi N, Floriano WB, Kim KS, Prasadarao NV, Goddard WA. Interaction of E-coli outer-membrane protein A with sugars on the receptors of the brain microvascular endothelial cells. Proteins. 2003;50:213–221. doi: 10.1002/prot.10257. [DOI] [PubMed] [Google Scholar]
- 30.Zhang DQ, Vaidehi N, Goddard WA, Danzer JF, Debe D. Structure-based design of mutant Methanococcus jannaschii tyrosyl-tRNA synthetase for incorporation of O-methyl-L-tyrosine. P Natl Acad Sci USA. 2002;99:6579–6584. doi: 10.1073/pnas.052150499. [DOI] [PMC free article] [PubMed] [Google Scholar]
- 31.Wang P, Vaidehi N, Tirrell DA, Goddard WA. Virtual screening for binding of phenylalanine analogues to phenylalanyl-tRNA synthetase. J Am Chem Soc. 2002;124:14442–14449. doi: 10.1021/ja0175441. [DOI] [PubMed] [Google Scholar]
- 32.Kekenes-Huskey PM, Vaidehi N, Floriano WB, Goddard WA. Fidelity of phenylalanyl-tRNA synthetase in binding the natural amino acids. J Phys Chem B. 2003;107:11549–11557. [Google Scholar]
- 33.Datta D, Vaidehi N, Zhang DQ, Goddard WA. Selectivity and specificity of substrate binding in methionyl-tRNA synthetase. Protein Sci. 2004;13:2693–2705. doi: 10.1110/ps.04792204. [DOI] [PMC free article] [PubMed] [Google Scholar]
- 34.Datta D, Vaidehi N, Xu X, Goddard WA. Mechanism for antibody catalysis of the oxidation of water by singlet dioxygen. P Natl Acad Sci USA. 2002;99:2636–2641. doi: 10.1073/pnas.052709399. [DOI] [PMC free article] [PubMed] [Google Scholar]
- 35.Cho AE, Wendel JA, Vaidehi N, Kekenes-Huskey PM, Floriano WB, Maiti PK, Goddard WA. The MPSim-Dock hierarchical docking algorithm: Application to the eight trypsin inhibitor cocrystals. J Comput Chem. 2005;26:48–71. doi: 10.1002/jcc.20118. [DOI] [PubMed] [Google Scholar]
- 36.Zamanakos G. A fast and accurate analytical method for the computation of solvent effects in molecular simulations [Google Scholar]
- 37.Okada T, Sugihara M, Bondar AN, Elstner M, Entel P, Buss V. The retinal conformation and its environment in rhodopsin in light of a new 2.2 angstrom crystal structure. J Mol Biol. 2004;342:571–583. doi: 10.1016/j.jmb.2004.07.044. [DOI] [PubMed] [Google Scholar]
- 38.Palczewski K, Kumasaka T, Hori T, Behnke CA, Motoshima H, Fox BA, Le Trong I, Teller DC, Okada T, Stenkamp RE, Yamamoto M, Miyano M. Crystal structure of rhodopsin: A G protein-coupled receptor. Science. 2000;289:739–745. doi: 10.1126/science.289.5480.739. [DOI] [PubMed] [Google Scholar]
- 39.Barbhaiya H, McClain R, Ijzerman A, Rivkees SA. Site-directed mutagenesis of the human A(1) adenosine receptor: Influences of acidic and hydroxy residues in the first four transmembrane domains on ligand binding. Mol Pharmacol. 1996;50:1635–1642. [PubMed] [Google Scholar]
- 40.Ceresa BP, Limbird LE. Mutation of an Aspartate Residue Highly Conserved among G-Protein-Coupled Receptors Results in Nonreciprocal Disruption of Alpha(2)-Adrenergic Receptor G-Protein Interactions - a Negative Charge at Amino-Acid Residue-79 Forecasts Alpha(2a)-Adrenergic Receptor Sensitivity to Allosteric Modulation by Monovalent Cations and Fully Effective Receptor G-Protein Coupling. J Biol Chem. 1994;269:29557–29564. [PubMed] [Google Scholar]
- 41.Nobeli I, Laskowski RA, Valdar WSJ, Thornton JM. On the molecular discrimination between adenine and guanine by proteins. Nucleic Acids Res. 2001;29:4294–4309. doi: 10.1093/nar/29.21.4294. [DOI] [PMC free article] [PubMed] [Google Scholar]
- 42.Kim SK, Gao ZG, Van Rompaey P, Gross AS, Chen A, Van Calenbergh S, Jacobson KA. Modeling the adenosine receptors: Comparison of the binding domains of A(2A) agonists and antagonists. J Med Chem. 2003;46:4847–4859. doi: 10.1021/jm0300431. [DOI] [PubMed] [Google Scholar]
- 43.Jiang QL, Guo DP, Lee BX, VanRhee AM, Kim YC, Nicholas RA, Schachter JB, Harden TK, Jacobson KA. A mutational analysis of residues essential for ligand recognition at the human P2Y(1) receptor. Mol Pharmacol. 1997;52:499–507. doi: 10.1124/mol.52.3.499. [DOI] [PMC free article] [PubMed] [Google Scholar]
- 44.Rivkees SA, Barbhaiya H, Ijzerman AP. Identification of the adenine binding site of the human A(1) adenosine receptor. J Biol Chem. 1999;274:3617–3621. doi: 10.1074/jbc.274.6.3617. [DOI] [PubMed] [Google Scholar]
- 45.Bockaert J, Pin JP. Molecular tinkering of G protein-coupled receptors: an evolutionary success. Embo J. 1999;18:1723–1729. doi: 10.1093/emboj/18.7.1723. [DOI] [PMC free article] [PubMed] [Google Scholar]
- 46.McDonald IK, Thornton JM. Satisfying Hydrogen-Bonding Potential in Proteins. J Mol Biol. 1994;238:777–793. doi: 10.1006/jmbi.1994.1334. [DOI] [PubMed] [Google Scholar]
Associated Data
This section collects any data citations, data availability statements, or supplementary materials included in this article.