

Summary
It is generally believed that DNA replication in most eukaryotes proceeds according to a precise program, in which there is a defined temporal order by which each chromosomal region is duplicated. However, the regularity of this program at the level of individual chromosomes, in terms of both the relative timing and the size of the DNA domain, has not been addressed. Here, the replication of chromosome VI from synchronized budding yeast was studied at ~1kb resolution with DNA combing and fluorescence microscopy. Contrary to what would be expected from cells following a rigorous temporal program, no two molecules exhibited the same replication pattern. Moreover, a direct evaluation of the extent to which the replication of distant chromosomal segments was coordinated indicates that the overwhelming majority of these segments were replicated independently. Importantly, averaging the patterns of all the fibers examined recapitulates the ensemble-averaged patterns obtained from population studies of the replication of chromosome VI. Thus, rather than an absolutely defined temporal order of replication, replication timing appears to be essentially probabilistic within individual cells, exhibiting only temporal tendencies within extended domains.
Keywords: molecular combing, temporal replication program
It is well known that the replication of eukaryotic chromosomes is confined to a specific period of time during the cell cycle (the DNA synthetic or S-phase). It is also believed that, in most eukaryotes, replication within the S-phase proceeds according to a highly regulated program, according to which each particular location along the chromosome is replicated at a specific relative time.1–3 The budding yeast, Saccharomyces cerevisiae, has been a particularly useful model organism in studies of eukaryotic replication, owing in part to the high degree of conservation of the replication machinery.4,5 A number of studies employing ensemble-averaged techniques have suggested that yeast chromosomes, like those of higher eukaryotes,6–9 contain early- and late-replicating domains and exhibit replication timing profiles that are consistent with a highly regulated temporal program.10–13
However, owing to their population-averaged nature, these techniques cannot determine whether the temporal evolution of replication along individual chromosomes is rigorously programmed. Even so, it has been suggested that replication timing could be tightly controlled, with the arrival of a replication fork from an earlier replicating region perhaps triggering duplication of an adjacent later-replicating region.13 Furthermore, others have proposed coordinated replication between distant regions along the chromosome as a means of ensuring their identical replication times.10 However, in these studies, there is a probabilistic quality to the replication profiles,10–13 suggesting that there may be variability among the replication programs of different cells.
Knowledge of the extent to which the replication process is temporally ordered along individual chromosomes is an important step in delineating the intimate relationship between replication and other aspects of chromatin biology.1,14,15 Toward this end, we have used DNA combing16,17 and fluorescence microscopy to analyze the regularity in the replication patterns of single chromosome VI molecules from an isogenic population of S. cerevisiae. We find that the replication pattern of each chromosome is unique to each cell. Replication in one chromosomal region apparently is not triggered by the proximity of a fork from a previously replicated region, nor is there rigorous coordination between the replication timing of any pairs of ~1kb segments across this chromosome. Rather than a specifically regulated program, replication timing appears to be essentially probabilistic within individual cells, exhibiting only temporal tendencies over extended domains.
Replication patterns in individual budding yeast chromosome VI molecules
To evaluate the regularity of the replication program for a single eukaryotic chromosome, we analyzed individual chromosome VI molecules from synchronized budding yeast cells using a combination of DNA combing, pulsed BrdU labeling to identify replicated DNA, and fluorescence microscopic detection, which has previously demonstrated a spatial resolution of ~1kb.18 Chromosome VI from budding yeast is one of the most extensively studied eukaryotic chromosomes in terms of its replication characteristics.11,13,19 Based on 2-D gel replicon mapping11,13 and microarray hybridization,12 three roughly similar-sized replication timing domains have been identified in this chromosome: a centromere-proximal region, including 50kb of each arm, which replicates early during S-phase, and the remainders of each arm, which replicate late. Based on other 2-D gel observations, replication of this chromosome has been described in terms of an orderly procession of replication from its early- to late-replicating regions11,13,20,21.
We used the yeast strain, K5409, in which seven copies of the HSV thymidine kinase gene under the control of the yeast GPD promoter were introduced into the genome, allowing the incorporation of BrdU into replicating DNA.22 Cells were first arrested in G1 phase with α-factor for 2.5 hr. Ten minutes prior to release from α-factor, BrdU was added to the medium to allow sufficient conversion of the halogenated nucleoside before replication initiation. The cells were released from the block by the addition of pronase to degrade α-factor; five minutes later, the BrdU was removed and replaced with fresh medium, and 30 min later, nocodazole was added. Incubation for an additional 2.25hr allowed completion of S-phase and arrest at the G2/M boundary. The efficacy of the synchronization protocol was assessed by flow cytometry (Supplementary Fig. S1) and by optical microscopy (data not shown). Note that, owing to the membrane impermeable nature of BrdUTP, the duration of the actual pulse period was slightly longer than five minutes, since some time is required for BrdU to be exhausted in the cell.
Fully-replicated chromosomes were isolated from the G2/M population by pulse-field gel electrophoresis (PFGE). After depositing the isolated DNA onto silanated glass by molecular combing,16,17 chromosome VI molecules were identified and oriented on the slide by hybridization with one of two different biotinylated probes and detection with Alexa Fluor 340-conjugated avidin (white). Alexa Fluor-conjugated secondary antibodies were then used to detect primary antibodies specific for BrdU (red) and DNA (green) (see the legend to Fig. 1 for further details). Since the anti-BrdU antibody recognizes BrdU only within denatured DNA, the use of probes to two different regions in different samples enables identification of the replication within the specific region that is not bound by the hybridized probes in that sample. The ability to visualize the unlabeled DNA molecules with anti-DNA antibodies, and not just the regions replicated during a pulse helped to unambiguously identify individual chromosomal fibers, since at high density, labeled regions from different, closely apposed, DNA molecules can be easily misidentified as originating from the same chromosome.
Figure 1.
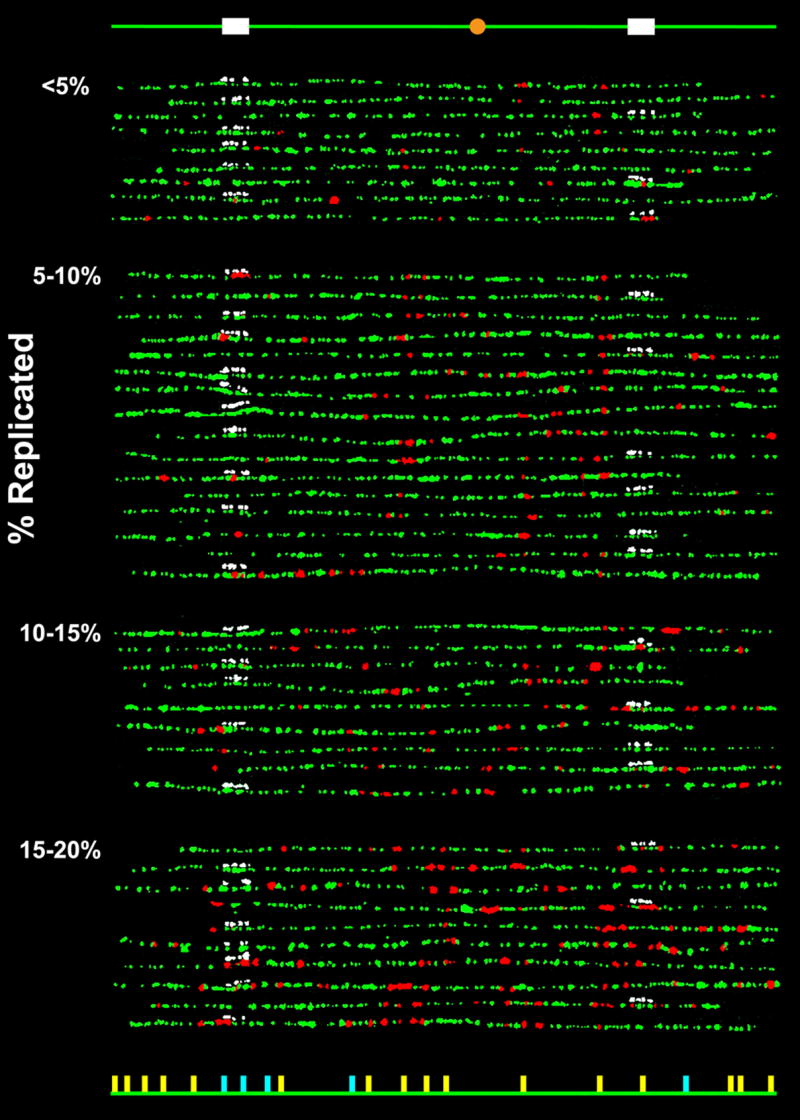
Replication patterns of individual chromosome VI molecules from α-factor synchronized budding yeast cells pulse-labeled during early S-phase with BrdU. Combed molecules were labeled by fluorophore-conjugated antibodies for BrdU (red) and DNA (green) as well as fluorophore-conjugated avidin (white) for the biotinylated hybridization probes to one of the two 10kb regions. The molecules were grouped according to their replication extent (indicated on the left). The schematic diagram at the top indicates the locations along the chromosome of the probes (white) and the centromere (orange), and the diagram at the bottom indicates the locations of the “confirmed” (yellow) and “potential” (light blue) origins. An origin is designated as “confirmed” if it has been identified in more than one of the previous mapping studies10; 11–13; 34–37 and “potential” if it has been identified only in a single study. It should be noted that there appears to be evidence in these patterns for previously unidentified origins, but most of these correlate with the locations of motifs found to be associated with origins36,37. A detailed analysis of this aspect of the data will be provided in a subsequent publication. The complete dataset is shown in Supplementary Fig. S2.
The strain used here (provided by K. Nasmyth) is K5409 (MATa ho ade2-1 trp1-1 can1-100 leu2-3, 112 his 3-11,15 ssd1 clb1-4ts ura3::URA3/GPD-TK).22 Cells were grown at 25°C in YPD to an OD600 of 0.5 and then incubated with α-factor (8μg/ml, GenScript) for 2.5hr. BrdU (Sigma) was added to a final concentration of 0.4mg/ml and 10 min later, the cells were released from the α-factor block with the addition of pronase (50μg/ml, Sigma). The cells were then washed with YPD 5 min after α-factor release to remove BrdU and then 30 min later, nocodazole (10μg/ml, Sigma) was added to arrest the cells, with fully replicated chromosomes, at the G2/M phase 2.25hr later. Nocodazole-arrested cells were recovered by centrifugation, resuspended in 10mM EDTA (pH 8.0), pelleted, and then resuspended in sorbitol buffer (1.0M sorbitol, 0.1M EDTA, 50mM DTT, pH 7.5) containing 0.7mg/ml lyticase at 37°C for 1hr. The cells were then pelleted, resuspended in sorbitol buffer, and mixed with an equal volume of 1.5% low-melting agarose (Bio-Rad) and cooled until the agarose had solidified, after which the plugs were incubated overnight at 37°C in 1mg/ml proteinase K (Bioline), 1% N-lauroylsarcosine, 0.5M EDTA, pH 9. Each plug contained roughly 108 cells. Pulse-field gel electrophoresis was performed in a 1% low-melting agarose gel. The band containing chromosome VI was excised, digested with β-agarase (New England Biolabs), and the DNA solution was then dialyzed overnight at 4°C in 5mM Tris, 1mM EDTA, pH8.0, using 100,000-molecular-weight-cutoff dialysis membrane (Spectrum). The solution was then adjusted to 0.2M MES, 5mM EDTA, pH 5.5 for DNA combing. To avoid DNA breakage, the purified DNA solution was handled with care to minimize shear. The glass slides onto which DNA molecules were combed were coated with octadecyltrichlorosilane (Sigma).38 The combed DNA molecules were denatured in 1M NaOH for 30min at room temperature, and hybridization was performed in 50% formamide, 1xSSC, 0.005% Tween 20, for 2hrs in the presence of 1μg/ml sheared salmonsperm DNA, 4μg/ml poly-uridine, 3μg/ml biotinylated probes at 37°C. The probe templates, prepared with PCR, covered one of two 10kb regions (only one of the regions, but not both, is used on each slide, except for distance calibration), in three blocks of ~2kb, 3kb, and 5kb: 45013–47023, 47051–52012, 52016–55231 and 210748–212827, 212915–217877, 217897–220277. The biotinylated probes were generated by random priming using BioPrime (Invitrogen). After incubation with Roche Blocking solution (Roche Biochemicals) for 30min, an alternating series of 45min incubations with (1/50 dilution) Alexa Fluor 350-neutrAvidin (Invitrogen) and (1/100 dilution) biotinylated anti-avidin antibodies (Vector Labs) labeled the probes. In total, there were 4 incubations with neutrAvidin and 3 incubations with biotinylated anti-avidin antibodies. The final set of incubations was: (1/50 dilution) anti-BrdU IgG (BU1/75 rat monoclonal, Abcam) for 1.5hrs, (1/70 dilution) Alexa Fluor 594-anti-rat IgG (rabbit, Invitrogen) for 1hr, (1/12 dilution) anti-ssDNA IgG (mouse, Argene) for 3hrs and then (1/30 dilution) Alexa Fluor 488-anti-mouse IgG (chicken, Invitrogen) for 1hr. All were carried out at room temperature. After all incubations, the sample was thoroughly washed with PBS. The sample was then fixed with 2% glutaraldehyde for 10min, and imaged in an anti fade solution (5.5% DABCO/45% glycerol (PBS)). Images were acquired using a Zeiss Axiovert S100 microscope equipped with a QImaging Retiga 1350EX CCD camera (25°C below ambient) and a 100× (NA=1.3) objective. The images were processed with Photoshop (Adobe), applying the same contrast/brightness adjustments (to the whole image) for all same-colored images. DNA lengths were calibrated using lambda phage DNA and chromosome VI molecules in which probes to both 10kb regions were used (data not shown).
Owing to the intrinsic variability in the release of different cells from α-factor arrest after pronase treatment,23 the extent of BrdU labeling in each molecule was also expected to vary within a range. Assuming that the extent of replication along the chromosome is a measure of the cell’s “intrinsic” time in S-phase during the pulse period,24,25 we first compared the patterns of molecules from cells at approximately the same stage in S-phase to determine whether a similar replication program had been followed by each cell. A selection of molecules, grouped according to their extent of replication, is presented in Fig. 1, and the complete set of 105 molecules analyzed here is shown in Supplementary Fig. S2.
Within each group of molecules from cells at the same stage of replication progression, some molecules do exhibit similar spatial trends in their replication. However, none are identical across the whole chromosome, a characteristic feature visually apparent in these molecules. A clustering analysis based on the degree of similarity in the replication patterns verified that none of the patterns of the molecules in the complete set were identical (see Supplementary Fig. S2). Therefore, these images directly demonstrate that no two cells that progressed to a similar stage in S-phase during the pulse period followed precisely the same program in the duplication of this chromosome.
However, it is theoretically possible that cells that progressed for different lengths of time in S-phase during the pulse period could have followed the same exact program. A necessary condition for this to be true would be that all of the replicated regions in the chromosomes from cells that progressed for a shorter duration of S-phase must be present in those from cells that progressed for a longer duration. Pairs of molecules that are associated in this way can be identified by subtracting the digitized molecules from each other: if a replicated region is designated as a “1”, and an unreplicated region as a “0”, then after subtraction, those regions that are scored either as 1 or −1 represent locations that are replicated in one or the other but not both molecules. In fact, when the replication patterns among 105 individual fibers were compared (resulting in 5,460 unique pair-wise combinations), the only pairs of molecules that satisfied this criterion involved three molecules that exhibited a single replicated region less than 3kb in length that fell within a longer stretch of replicated DNA in the more fully-replicated member of the pair. Therefore, the timing programs followed in the duplication of the overwhelming majority of less-replicated molecules must have differed from those followed by the more fully-replicated molecules. Hence, regardless of its stage in S-phase during the pulse period, each cell usually seems to follow a unique temporal replication program, at least for chromosome VI.
Comparison between averaged individual patterns and previous ensemble-averaged profiles
To determine whether there is intrinsic discordance between our results and previous ensemble-averaged data on the temporal order of replication, we compared the population-based profiles for chromosome VI with the average of the patterns of the collection of 105 single molecules examined in the present study (Fig. 2). Note that this average is actually a direct indicator of the probabilities that each segment is replicated within the entire population of cells, and so corresponds to a probability map of replication during the pulse period.
Figure 2.
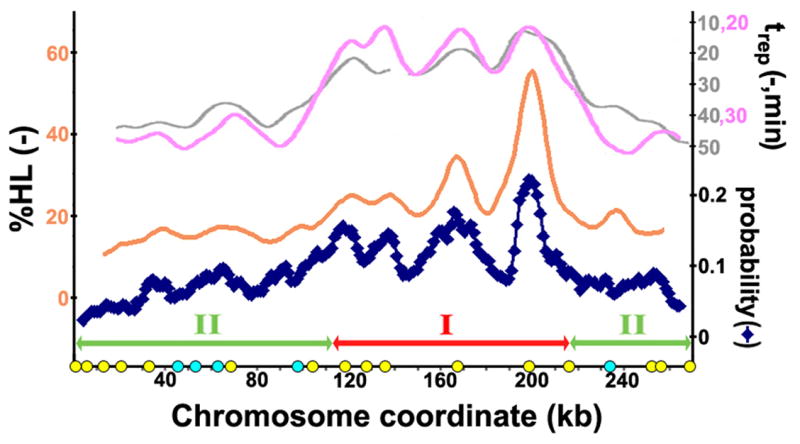
Comparison of the averaged replication pattern of the individual chromosomes with the previously determined population-averaged replication profiles.10, 12,15 Shown in gray is the replication profile from a density-transfer study,10 while the profile in pink is a copy-number study12 and that in orange is a recently determined replication profile15 (also using the density-transfer method) obtained after 12.5min in S phase, which is the time at which there was a similar amount of replication as the average extent of replication in the collection of molecules studied here (10%). Note that the scales for the different plots are shifted along the y-axis. The segmentation at the bottom is for the analysis described in Figure 4, and the circles along the x-axis are the locations of the confirmed (yellow) and potential (light blue) origins along this chromosome, as described in Fig. 1. To obtain this average of the single molecule patterns (dark blue), the molecules first were digitized by segmenting them into 1.25kb intervals and assigning a numerical value to each segment according to whether each interval was replicated, not replicated, or whether there was a gap. The average of each segment was then obtained, and then a 10kb moving average was calculated to enable a better comparison with the previous replication profiles, which were averaged over a similar size. Overall, the average of these molecules is consistent with the replication profiles from the previous studies employing ensemble-averaging techniques.
Overall, there is surprisingly good agreement between the ensemble-averaged data and the average of individual measurements for this chromosome: the frequency with which a region was observed to be replicated during the pulse period corresponded well with the replication times obtained by ensemble-averaged methods. It is important to note that, even with some of the previously determined replication profiles,10,12 the indicated value, “trep”, reflects the time at which 50% of the cells have replicated a particular region, and should therefore be related to the probability of replication at each location, since a region with a high likelihood of being replicated would correspond to an earlier “trep”. Similarly, the value obtained in a recent density transfer study15, %HL, is believed to be related to the percentage replicated (as discussed in the supplementary material in ref. 10), and so should also be related to the probability of replication. Thus, the collection of patterns obtained here are fully consistent with what could be expected from the previously determined, ensemble-averaged, profiles. This concordance further suggests that the stochastic nature of replication shown in Fig. 1 is a true reflection of chromosomal replication in each cell, and is not due to some peculiarities of the methodology.
Evaluation of replication coordination between distant chromosomal segments
The data presented so far do not exclude the possibility that certain distant segments of a chromosome are coordinately replicated in all cells, with the replication of the rest of the segments being stochastic, as might occur with the formation of replication foci26 consisting of defined sequences. Visualizing replication in complete or nearly complete individual chromosomes provides a unique opportunity to directly evaluate whether the replication of distant segments on the same chromosome is correlated, which provides information on the mechanism by which replication is temporally and spatially organized.
If any two segments on a chromosome are coordinately replicated, then on any given molecule, the two regions are either both replicated or both unreplicated. We therefore determined whether every pair-wise combination of segments (each ~1kb in length) was replicated on the same molecule any more frequently than would be expected if replication timing were completely independent. An important caveat, however, is that the cells were labeled for a fixed length of time and not at a single time point: thus, those segments identified here as more frequently replicated on the same molecule than what would be expected if their timing were random will include segments replicated at exactly the same time as well as those replicated at slightly different times within the same pulse period. Therefore, these regions can only be considered as potential locations of replication coordination. However, regions that are not replicated on the same molecule any more frequently than if their timing were random are definitively not strictly coordinated.
Figure 3 shows that the overwhelming majority of off-diagonal segment pairs are not coordinated in their replication patterns (light and dark blue). In particular, the telomeric regions within 10kb of the chromosomal ends are not coordinated, in contrast to a previous suggestion based on ensemble-averaged profiling,10 and neither are any of the regions with similar replication times in the replication profile. It should be noted that this absence of strict replication coordination between the telomeric domains of this budding yeast chromosome is similar to the lack of replication coordination in the telomeres of mammalian chromosomes based on single molecule visualizations.27 The increased number of possibly coordinated segments near the diagonal is expected in this analysis, since these regions are nearest neighbors and their calculated greater-than-random co-replication is probably a consequence of replication by a common fork.
Figure 3.
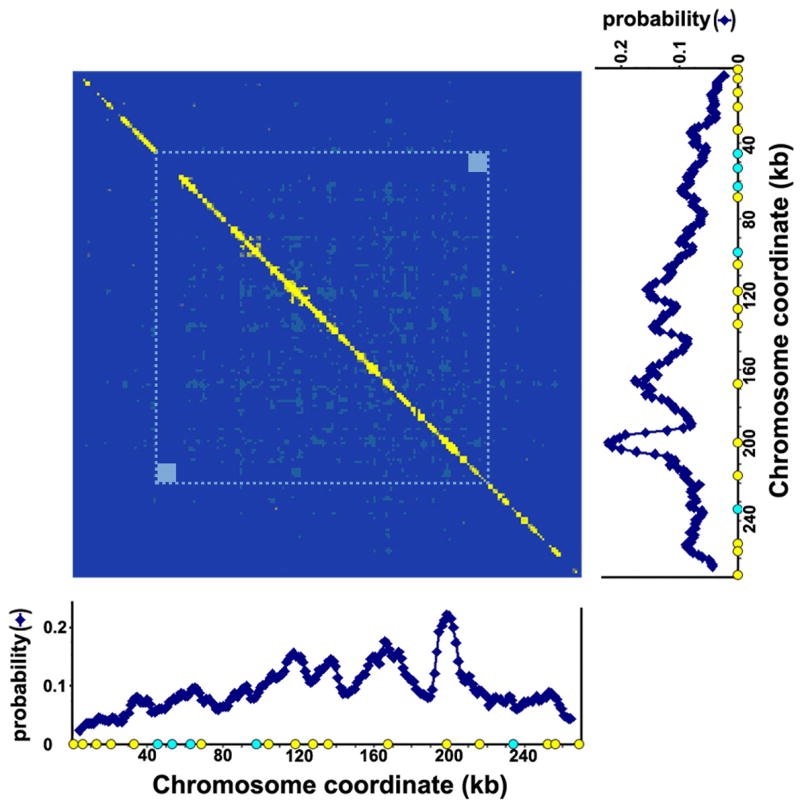
Chromosome-wide evaluation of replication coordination between every pair of ~1kb segments along the chromosome. The number of molecules in which a given pair of segments were both replicated during the pulse period was directly counted, as was the total number of molecules in which there was data for the given regions (that is, the number of molecules in which there was data indicating that the regions were replicated or not replicated), and then this frequency was compared with what might be expected if the replication of the two regions is independent. The latter was determined with a binomial test, which gives a measure of the likelihood of obtaining the actual number of observations, given a certain total number of observations and the probability of their occurrence. In the present case, the probability of observing two regions replicated in the same molecule if their replication is independent is simply given by the product of their individual probabilities, as determined in Fig. 2 (before applying the moving average). It should be noted that only those segments for which there was data are included in this analysis, and so the absence of data, whether owing to gaps or missing regions at the chromosome ends, only affect this analysis in reducing the total number of pairs analyzed for a given region. In this figure, the intersection of a given pair of segments was colored according to (1) whether or not the number of molecules in which both segments were replicated was greater than that of the mean expected value (the product of the total number of molecules and the probability) and (2) whether or not the likelihood of observing this number of molecules is extremely low if their replication is independent (by convention, P<0.05). For those pairs of segments observed to be replicated on the same molecule more (less) frequently than the mean expected value and whose likelihood of observing this number of molecules is extremely low, the intersection is colored yellow (red). For those pairs replicated on the same molecule more (less) frequently than the mean expected value, but not more (less) than what might be expected from a typical measurement with this total number of molecules, the intersection of the two regions is colored dark (light) blue. The dotted blue line indicates the region within which there is data from all of the molecules included here. Owing to the missing segments at the end of a chromosome in some of the molecules, the statistical significance is slightly lower outside of this boundary, but the conclusion is the same. The small squares at the corners within this demarcated region are locations for which there is no data concerning replication coordination in the present dataset: in every molecule, one of the two corresponding regions was bound by hybridized probes, and so there are no molecules in this set for which the binding of the anti-BrdU antibody to both regions was not obscured. Clearly, the overwhelming majority of pairs of segments are replicated independently, with only the nearest neighbors in a few regions exhibiting some coordination, which is likely owing to their replication by a common fork.
Thus, except for nearest neighbors, replication of one region of this chromosome appears to occur independently of the replication status elsewhere along this chromosome. Hence, the similar replication times in the population-averaged measurements between any two segments of a chromosome cannot be used as evidence for strict replication timing control.
Analysis of individual chromosomes for strict timing control of domains
We conclude that, at the high level of resolution afforded by the combing approach, there appears to be no predetermined program that each budding yeast cell follows in the replication of its chromosomes when pairs of ~1kb segments are compared.
To examine whether there is regional control that governs replication timing of large domains in these molecules (as observed in mammalian cells1), we segmented the chromosome into three different regions based on the frequency with which the regions were replicated among the molecules during the pulse period (labeled I and II in Fig. 2, which is similar to the domains suggested previously12). We then determined whether the replication extent in the more frequently replicated domain always exceeded that of the less frequently replicated domains. Figure 4a shows that ~73% of the molecules followed the trend, I > II. Likewise, the correlation coefficient obtained when comparing each of the pair-wise combinations of domains is low (Fig. 4b), indicating that there is essentially no correlation among these regions. This indicates that the more frequently replicated domains are indeed more often replicated earlier, but, importantly, this is not an absolute feature of the replication process of this chromosome.
Figure 4.
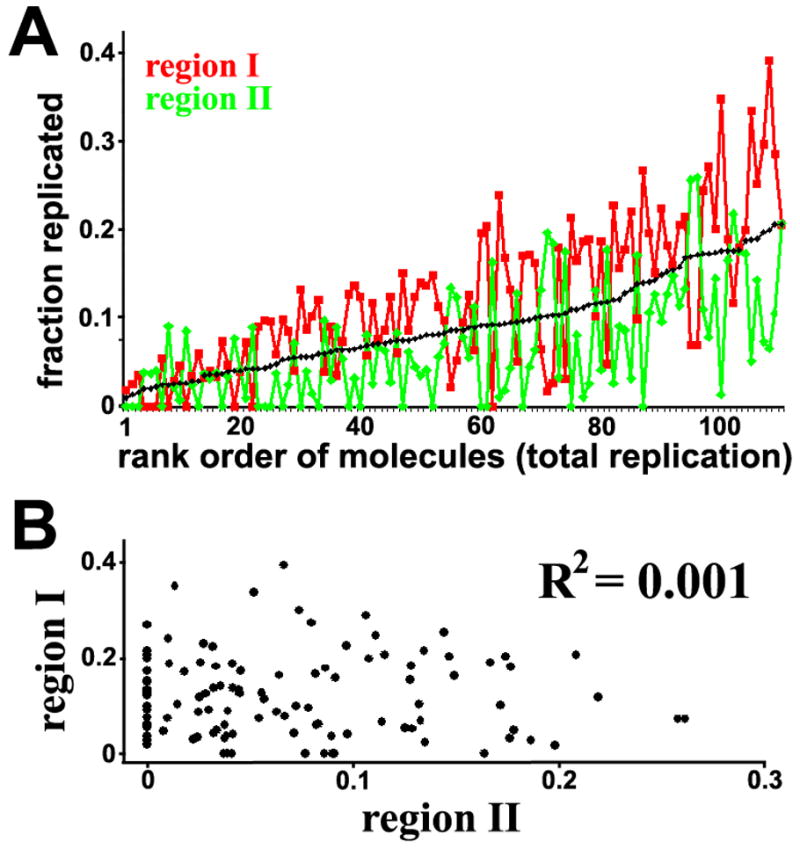
Evaluation of the temporal order of replication in the single molecules in terms of chromosomal domains. The chromosomes were segmented into two types of regions depending on their frequency of replication as indicated in Fig. 2, and the replication extent in each region was individually calculated. These values for each molecule are plotted along the vertical axis in Figure 4A, with the molecules arranged along the horizontal axis in rank order of their total replication extent (the value of which is also plotted in the figure in black). A. Overall, most of the molecules do exhibit the expected tendency, I > II. Nonetheless, ~27% do not, indicating that this is not a strict feature of the replication process. The plot in black is the total replication extent for each molecule. B. The correlation coefficient associated with the extent of replication in region I compared with that in region II is exceedingly small, indicating that the replication of each region is essentially not correlated. This coefficient was calculated using Excel.
Taken together, the data presented here indicate that there is no strictly deterministic temporal program of replication in the budding yeast. Apparently, replication initiation and progression is highly individualized for each cell. There are only well-defined statistical tendencies at the population level that are similar to those recently suggested for Schizosaccharomyces pombe.28,29 Furthermore, our data indicate that the time at which one chromosomal region is replicated is not dependent on the replicational status elsewhere along the chromosome, in contrast to conclusions based on replication in cell-free extracts from Xenopus eggs.30 Nonetheless, our data do not exclude a more global mechanism within the cell based on the overall extent of DNA replication, which could impose a modulatory effect on the local replication initiation probability during the course of S-phase. Indeed, there are budding yeast homologues of Xenopus proteins that are involved in the temporal control of replication in the latter system.31,32 Whether there are only timing tendencies within mammalian cells, where mega-base sized replication timing domains have been observed in single metaphase chromosomes,33 will require a similarly detailed analysis as we demonstrate here for the budding yeast.
Supplementary Material
Acknowledgments
We thank K. Nasmyth for providing the yeast strain used in this work, and Yan Gao for her technical expertise. This work was supported by the National Institutes of Health to J.H. (GM026108) and Z.S. (HG003702, GM068729).
Footnotes
Publisher's Disclaimer: This is a PDF file of an unedited manuscript that has been accepted for publication. As a service to our customers we are providing this early version of the manuscript. The manuscript will undergo copyediting, typesetting, and review of the resulting proof before it is published in its final citable form. Please note that during the production process errors may be discovered which could affect the content, and all legal disclaimers that apply to the journal pertain.
References
- 1.Goren A, Cedar H. Replicating by the clock. Nat Rev Mol Cell Biol. 2003;4:25–32. doi: 10.1038/nrm1008. [DOI] [PubMed] [Google Scholar]
- 2.Balazs I, Brown EH, Schildkraut CL. The temporal order of replication of some DNA cistrons. Cold Spring Harb Symp Quant Biol. 1974;38:239–45. doi: 10.1101/sqb.1974.038.01.027. [DOI] [PubMed] [Google Scholar]
- 3.Braunstein JD, Schulze D, DelGiudice T, Furst A, Schildkraut CL. The temporal order of replication of murine immunoglobulin heavy chain constant region sequences corresponds to their linear order in the genome. Nucleic Acids Res. 1982;10:6887–902. doi: 10.1093/nar/10.21.6887. [DOI] [PMC free article] [PubMed] [Google Scholar]
- 4.Bell SP, Dutta A. DNA replication in eukaryotic cells. Annu Rev Biochem. 2002;71:333–74. doi: 10.1146/annurev.biochem.71.110601.135425. [DOI] [PubMed] [Google Scholar]
- 5.Mendez J, Stillman B. Perpetuating the double helix: molecular machines at eukaryotic DNA replication origins. Bioessays. 2003;25:1158–67. doi: 10.1002/bies.10370. [DOI] [PubMed] [Google Scholar]
- 6.Hiratani I, Leskovar A, Gilbert DM. Differentiation-induced replication-timing changes are restricted to AT-rich/long interspersed nuclear element (LINE)-rich isochores. Proc Natl Acad Sci U S A. 2004;101:16861–6. doi: 10.1073/pnas.0406687101. [DOI] [PMC free article] [PubMed] [Google Scholar]
- 7.Jeon Y, Bekiranov S, Karnani N, Kapranov P, Ghosh S, MacAlpine D, Lee C, Hwang DS, Gingeras TR, Dutta A. Temporal profile of replication of human chromosomes. Proc Natl Acad Sci U S A. 2005;102:6419–24. doi: 10.1073/pnas.0405088102. [DOI] [PMC free article] [PubMed] [Google Scholar]
- 8.MacAlpine DM, Rodriguez HK, Bell SP. Coordination of replication and transcription along a Drosophila chromosome. Genes Dev. 2004;18:3094–105. doi: 10.1101/gad.1246404. [DOI] [PMC free article] [PubMed] [Google Scholar]
- 9.Woodfine K, Fiegler H, Beare DM, Collins JE, McCann OT, Young BD, Debernardi S, Mott R, Dunham I, Carter NP. Replication timing of the human genome. Hum Mol Genet. 2004;13:191–202. doi: 10.1093/hmg/ddh016. [DOI] [PubMed] [Google Scholar]
- 10.Raghuraman MK, Winzeler EA, Collingwood D, Hunt S, Wodicka L, Conway A, Lockhart DJ, Davis RW, Brewer BJ, Fangman WL. Replication dynamics of the yeast genome. Science. 2001;294:115–21. doi: 10.1126/science.294.5540.115. [DOI] [PubMed] [Google Scholar]
- 11.Friedman KL, Brewer BJ, Fangman WL. Replication profile of Saccharomyces cerevisiae chromosome VI. Genes Cells. 1997;2:667–78. doi: 10.1046/j.1365-2443.1997.1520350.x. [DOI] [PubMed] [Google Scholar]
- 12.Yabuki N, Terashima H, Kitada K. Mapping of early firing origins on a replication profile of budding yeast. Genes Cells. 2002;7:781–9. doi: 10.1046/j.1365-2443.2002.00559.x. [DOI] [PubMed] [Google Scholar]
- 13.Yamashita M, Hori Y, Shinomiya T, Obuse C, Tsurimoto T, Yoshikawa H, Shirahige K. The efficiency and timing of initiation of replication of multiple replicons of Saccharomyces cerevisiae chromosome VI. Genes Cells. 1997;2:655–65. doi: 10.1046/j.1365-2443.1997.1530351.x. [DOI] [PubMed] [Google Scholar]
- 14.Donaldson AD. Shaping time: chromatin structure and the DNA replication programme. Trends Genet. 2005;21:444–9. doi: 10.1016/j.tig.2005.05.012. [DOI] [PubMed] [Google Scholar]
- 15.Alvino GM, Collingwood D, Murphy JM, Delrow J, Brewer BJ, Raghuraman MK. Replication in Hydroxyurea: It’s a Matter of Time. Mol Cell Biol. 2007;27:6396–406. doi: 10.1128/MCB.00719-07. [DOI] [PMC free article] [PubMed] [Google Scholar]
- 16.Lengronne A, Pasero P, Bensimon A, Schwob E. Monitoring S phase progression globally and locally using BrdU incorporation in TK(+) yeast strains. Nucleic Acids Res. 2001;29:1433–42. doi: 10.1093/nar/29.7.1433. [DOI] [PMC free article] [PubMed] [Google Scholar]
- 17.Michalet X, Ekong R, Fougerousse F, Rousseaux S, Schurra C, Hornigold N, van Slegtenhorst M, Wolfe J, Povey S, Beckmann JS, Bensimon A. Dynamic molecular combing: stretching the whole human genome for high-resolution studies. Science. 1997;277:1518–23. doi: 10.1126/science.277.5331.1518. [DOI] [PubMed] [Google Scholar]
- 18.Herrick J, Stanislawski P, Hyrien O, Bensimon A. Replication fork density increases during DNA synthesis in X. laevis egg extracts. J Mol Biol. 2000;300:1133–42. doi: 10.1006/jmbi.2000.3930. [DOI] [PubMed] [Google Scholar]
- 19.Shirahige K, Iwasaki T, Rashid MB, Ogasawara N, Yoshikawa H. Location and characterization of autonomously replicating sequences from chromosome VI of Saccharomyces cerevisiae. Mol Cell Biol. 1993;13:5043–56. doi: 10.1128/mcb.13.8.5043. [DOI] [PMC free article] [PubMed] [Google Scholar]
- 20.Donaldson AD, Raghuraman MK, Friedman KL, Cross FR, Brewer BJ, Fangman WL. CLB5-dependent activation of late replication origins in S. cerevisiae. Mol Cell. 1998;2:173–82. doi: 10.1016/s1097-2765(00)80127-6. [DOI] [PubMed] [Google Scholar]
- 21.Tercero JA, Diffley JF. Regulation of DNA replication fork progression through damaged DNA by the Mec1/Rad53 checkpoint. Nature. 2001;412:553–7. doi: 10.1038/35087607. [DOI] [PubMed] [Google Scholar]
- 22.Dahmann C, Diffley JF, Nasmyth KA. S-phase-promoting cyclin-dependent kinases prevent re-replication by inhibiting the transition of replication origins to a pre-replicative state. Curr Biol. 1995;5:1257–69. doi: 10.1016/s0960-9822(95)00252-1. [DOI] [PubMed] [Google Scholar]
- 23.Breeden LL. Alpha-factor synchronization of budding yeast. Methods Enzymol. 1997;283:332–41. doi: 10.1016/s0076-6879(97)83027-3. [DOI] [PubMed] [Google Scholar]
- 24.Herrick J, Jun S, Bechhoefer J, Bensimon A. Kinetic model of DNA replication in eukaryotic organisms. J Mol Biol. 2002;320:741–50. doi: 10.1016/s0022-2836(02)00522-3. [DOI] [PubMed] [Google Scholar]
- 25.van Brabant AJ, Buchanan CD, Charboneau E, Fangman WL, Brewer BJ. An origin-deficient yeast artificial chromosome triggers a cell cycle checkpoint. Mol Cell. 2001;7:705–13. doi: 10.1016/s1097-2765(01)00216-7. [DOI] [PubMed] [Google Scholar]
- 26.Kitamura E, Blow JJ, Tanaka TU. Live-cell imaging reveals replication of individual replicons in eukaryotic replication factories. Cell. 2006;125:1297–308. doi: 10.1016/j.cell.2006.04.041. [DOI] [PMC free article] [PubMed] [Google Scholar]
- 27.Zou Y, Gryaznov SM, Shay JW, Wright WE, Cornforth MN. Asynchronous replication timing of telomeres at opposite arms of mammalian chromosomes. Proc Natl Acad Sci U S A. 2004;101:12928–33. doi: 10.1073/pnas.0404106101. [DOI] [PMC free article] [PubMed] [Google Scholar]
- 28.Patel PK, Arcangioli B, Baker SP, Bensimon A, Rhind N. DNA replication origins fire stochastically in fission yeast. Mol Biol Cell. 2006;17:308–16. doi: 10.1091/mbc.E05-07-0657. [DOI] [PMC free article] [PubMed] [Google Scholar]
- 29.Heichinger C, Penkett CJ, Bahler J, Nurse P. Genome-wide characterization of fission yeast DNA replication origins. Embo J. 2006;25:5171–9. doi: 10.1038/sj.emboj.7601390. [DOI] [PMC free article] [PubMed] [Google Scholar]
- 30.Shechter D, Gautier J. ATM and ATR check in on origins: a dynamic model for origin selection and activation. Cell Cycle. 2005;4:235–8. [PubMed] [Google Scholar]
- 31.Marheineke K, Hyrien O. Control of replication origin density and firing time in Xenopus egg extracts: role of a caffeine-sensitive, ATR-dependent checkpoint. J Biol Chem. 2004;279:28071–81. doi: 10.1074/jbc.M401574200. [DOI] [PubMed] [Google Scholar]
- 32.Shechter D, Costanzo V, Gautier J. ATR and ATM regulate the timing of DNA replication origin firing. Nat Cell Biol. 2004;6:648–55. doi: 10.1038/ncb1145. [DOI] [PubMed] [Google Scholar]
- 33.Drouin R, Lemieux N, Richer CL. Analysis of DNA replication during S-phase by means of dynamic chromosome banding at high resolution. Chromosoma. 1990;99:273–80. doi: 10.1007/BF01731703. [DOI] [PubMed] [Google Scholar]
- 34.Wyrick JJ, Aparicio JG, Chen T, Barnett JD, Jennings EG, Young RA, Bell SP, Aparicio OM. Genome-wide distribution of ORC and MCM proteins in S. cerevisiae: high-resolution mapping of replication origins. Science. 2001;294:2357–60. doi: 10.1126/science.1066101. [DOI] [PubMed] [Google Scholar]
- 35.Feng W, Collingwood D, Boeck ME, Fox LA, Alvino GM, Fangman WL, Raghuraman MK, Brewer BJ. Genomic mapping of single-stranded DNA in hydroxyurea-challenged yeasts identifies origins of replication. Nat Cell Biol. 2006;8:148–55. doi: 10.1038/ncb1358. [DOI] [PMC free article] [PubMed] [Google Scholar]
- 36.Xu W, Aparicio JG, Aparicio OM, Tavare S. Genome-wide mapping of ORC and Mcm2p binding sites on tiling arrays and identification of essential ARS consensus sequences in S. cerevisiae. BMC Genomics. 2006;7:276. doi: 10.1186/1471-2164-7-276. [DOI] [PMC free article] [PubMed] [Google Scholar]
- 37.Nieduszynski CA, Knox Y, Donaldson AD. Genome-wide identification of replication origins in yeast by comparative genomics. Genes Dev. 2006;20:1874–9. doi: 10.1101/gad.385306. [DOI] [PMC free article] [PubMed] [Google Scholar]
- 38.Allemand JF, Bensimon D, Jullien L, Bensimon A, Croquette V. pH-dependent specific binding and combing of DNA. Biophys J. 1997;73:2064–70. doi: 10.1016/S0006-3495(97)78236-5. [DOI] [PMC free article] [PubMed] [Google Scholar]
Associated Data
This section collects any data citations, data availability statements, or supplementary materials included in this article.