

Abstract
Conventional kinesin, kinesin-I, is a heterotetramer of two kinesin heavy chain (KHC) subunits (KIF5A, KIF5B, or KIF5C) and two kinesin light chain (KLC) subunits. While KHC contains the motor activity, the role of KLC remains unknown. It has been suggested that KLC is involved in either modulation of KHC activity or in cargo binding. Previously, we characterized KLC genes in mouse (Rahman, A., D.S. Friedman, and L.S. Goldstein. 1998. J. Biol. Chem. 273:15395–15403). Of the two characterized gene products, KLC1 was predominant in neuronal tissues, whereas KLC2 showed a more ubiquitous pattern of expression. To define the in vivo role of KLC, we generated KLC1 gene-targeted mice. Removal of functional KLC1 resulted in significantly smaller mutant mice that also exhibited pronounced motor disabilities. Biochemical analyses demonstrated that KLC1 mutant mice have a pool of KIF5A not associated with any known KLC subunit. Immunofluorescence studies of sensory and motor neuron cell bodies in KLC1 mutants revealed that KIF5A colocalized aberrantly with the peripheral cis-Golgi marker giantin in mutant cells. Striking changes and aberrant colocalization were also observed in the intracellular distribution of KIF5B and β′-COP, a component of COP1 coatomer. Taken together, these data best support models that suggest that KLC1 is essential for proper KHC activation or targeting.
Keywords: kinesin, kinesin light chain, Golgi apparatus, intracellular trafficking, gene targeting
Axonal transport is essential for various cargoes to move from the neuronal cell body to the synaptic terminus. Since its discovery in squid axoplasm (Vale et al. 1985), kinesin has been implicated as one of many molecular motors likely to be essential for anterograde axonal transport. Conventional kinesin, kinesin-I, is a tetramer of two kinesin heavy chains (KHCs)1 and two kinesin light chains (KLCs) associated in a 1:1 stoichiometric ratio (Johnson et al. 1990). Although much is now known about the likely functions of KHC (reviewed by Bloom and Endow 1994; Moore and Endow 1996; Goldstein and Philp 1999), little is known about the roles of KLC. Previous studies suggest that KLCs are required for either cargo binding (Brady and Pfister 1991; Stenoien and Brady 1997; Khodjakov et al. 1998) or negative regulation of KHC (Hackney et al. 1991; Verhey et al. 1998), but further information is clearly needed.
In mammals, the polypeptide components of kinesin-I are encoded by three KHC genes, KIF5A, KIF5B, and KIF5C (Gudkov et al. 1994; Niclas et al. 1994; Nakagawa et al. 1997; Xia et al. 1998), and three KLC genes, KLC1, KLC2, and KLC3 (Lamerdin et al. 1996; Rahman et al. 1998). The KIF5A, KIF5C, and KLC1 polypeptides are enriched in neuronal tissues, whereas the KIF5B and KLC2 polypeptides are more ubiquitously distributed; KLC3 has not yet been detected. Recent data suggest that while KHC and KLC only form homodimers amongst themselves, there is no specificity in the interaction of KLCs with KHCs (Rahman et al. 1998). The diversity in the forms and interactions of KHC with KLC may explain the variability seen in previous kinesin immunolocalization, biochemical, and functional studies (Bloom and Endow 1994; Rahman et al. 1998; Goldstein and Philp 1999).
Previous studies with mutants lacking KHC in invertebrate organisms have all given neuronal phenotypes (Saxton et al. 1991; Gho et al. 1992; Patel et al. 1993; Hurd and Saxton 1996), suggesting that kinesin-I plays a primary role in neuronal transport. Mutants lacking KLC in Drosophila melanogaster (Gindhart et al. 1998) exhibit neuronal phenotypes similar to that seen when KHC is removed. In particular, mutants lacking either KHC or KLC in Drosophila (Saxton et al. 1991; Gindhart et al. 1998) die at the third larval instar stage with a distinctive paralysis, and show accumulations of an array of molecular motors and vesicular cargoes in the axons of the segmental nerves (Gho et al. 1992; Hurd and Saxton 1996; Gindhart et al. 1998). Mutations in the unc-116 gene, which encodes the Caenorhabditis elegans homologue of kinesin-I, resulted in axon mispositioning (Patel et al. 1993). Gene targeting of the ubiquitous KIF5B in mice, however, resulted in embryonic lethality (Tanaka et al. 1998). To probe further the functions of KLC in neurons, we generated and analyzed mutant mice lacking normal KLC1.
Materials and Methods
KLC1 Gene Targeting and Chimeric Mouse Production
A 129 isogenic genomic library (obtained from Dr. A. Nagy, Samuel Lunenfeld Research Institute, Toronto, Canada) was screened with the full-length KLC1 cDNA (Rahman et al. 1998). Various genomic clones were characterized by restriction digestion followed by Southern analysis. One clone, g5.1, was determined to contain the translational start site. This clone was further characterized by extensive restriction digests and partial sequencing. A 2.5-kb HindIII/PstI genomic fragment was subcloned into pBS II KS (−; Stratagene) as the 3′ flanking arm (pBS-3′). A 1.4-kb BglII/NotI subcloned fragment was digested with EcoRV and Eco0109, and the smaller 1.2-kB fragment was blunted with Klenow and subsequently subcloned into the XhoI site of pBS-3′. The resulting targeting construct (pBS-5′+3′) had both the 5′ and 3′ flanking arms and unique SalI and NotI sites. The exon that was removed encoded a 72-amino acid sequence starting at QHSDSSA and ending at NILALVY. This region contained genomic sequences encoding the 10 amino acids before the beginning of the first TPR (tetratrico peptide repeat) domain, the entire first TPR domain, and 20 amino acids of the second TPR domain (Rahman et al. 1998). Removal of this segment of genomic DNA should result in out of frame translation of the remainder of the KLC1 gene (Fig. 1 A). The 6-kB SalI fragment of pGT-IRES β-geo (Mountford et al. 1994), containing the IRES β-geo cassette, was subcloned into pBS-5′+3′ to complete the targeting construct (Fig. 1 A). The targeting vector was linearized using the unique NotI site, and 20 μg of the linearized DNA was electroporated into R1 embryonic stem (ES) cells as described by Wurst and Joyner 1993. The ES cells were grown (Wurst and Joyner 1993) for 2 d before selection with 125 μg/ml of G418 (active weight; GIBCO BRL) for an additional 10 d. 94 ES cell colonies were isolated and the fastest growing 67 colonies were checked by PCR for a homologous recombination event. The 5′ PCR primer (CTAATTTTGGACTTCCAGCAAAGAC) encoded KLC1 genomic DNA sequences residing outside the targeting vector. The 3′ primer (TACACCTGGCCAGTGAGGCTTCTA), used for PCR, encoded sequences within the en-2 region of the IRES β-geo cassette. The resulting PCR product is ∼1.4 kb. Of the initial 67 clones checked, 6 gave PCR products of the expected size. These clones (A1, A2, E2, F1, F11, and H4) were verified as homologous recombinants by Southern analysis of SacI digested genomic DNA. The probe used was a 240-bp SacI/BglII fragment adjacent to the targeted sequences. Clones that tested positive for recombination events were trypsinized to single cell state and microinjected into 3.5-d C57BL/6 embryos to produce chimeric mice.
Figure 1.

Generation of KLC1 gene-targeted mice. A, Restriction enzyme map of the genomic DNA of KLC1 and the resulting targeting vector. Arrowheads indicate location of PCR primers for detecting homologous recombination events. Restriction enzyme sites are as follows: H, HindIII; S, SacI; X, XbaI; B, BglII; EV, EcoRV; E, EcoR0109; P, PstI; and N, NotI. The thicker black boxes represent exons. B, Southern analysis of clones that tested positive by PCR for recombination events. The recombination event produces a larger SacI fragment when probed with a 240-bp SacI/BglII fragment residing outside the targeting vector. The clones A1, A2, E2, F1, F11, and H4 all tested positive for a recombination event. A4 is another G418 resistant colony that was not positive for homologous recombination at the correct locus. Germline transmission was obtained from lines E2 and F11. C, Offspring from matings of KLC1 heterozygous mice were genotyped by PCR. PCR was performed on genomic DNA isolated from mouse tail clippings. Primers were designed to amplify 800- and 210-bp fragments for the recombinant and wild-type KLC1 genes, respectively.
DNA Preparation from Tails for Genotyping Mice
Tips of tails were isolated from mice between 2–3 wk old. The tail tips were digested overnight at 55°C in tail lysis buffer (50 mM Tris-HCl, pH 8.0, 50 mM EDTA, pH 8.0, 0.5% SDS, and 0.25 mg/ml proteinase K). DNA was purified by a single phenol/chloroform extraction, ethanol precipitated, and resuspended in 100 μl of 10 mM Tris, pH 8.0, 1 mM EDTA. Genotyping was done by PCR using two sets of primers within one reaction. The first set of PCR primers amplified an 800-bp fragment from the LacZ region of the targeted gene. The sequences for these primers are as follows: 5′-GCATCGAGCTGGGTAATAAGCGTTGGCAAT, 3′-GACACCAGACCAACTGGTAATGGTAGCGAC. The second set of primers amplified a region (210 bp) across the deleted exon of the KLC1 gene. The 5′ primer (CGGGCTGTTTCTCTTGGCTTGCTC) encoded sequences within the 5′ short flanking arm of the targeting vector. The 3′ primer (GGAGCGTGCGCAGCCTTGCAGGGA) encoded sequences in the deleted exon of the KLC1 gene. PCR conditions were as follows: denaturation at 94°C for 10 min, 35 cycles of denaturation at 94°C for 1 min, annealing and elongation at 72°C for 4 min, and a 10-min final elongation at 72°C.
Characterization of Visible Phenotype of Mice
All 98 offspring from the first 12 litters of heterozygous × heterozygous matings were weighed at 10, 14, 18, and 21 d after birth. The pups were ear punched at day 10 to distinguish them from each other. Genotyping was done as described. 25 sets of adult mice that were caged together were also weighed after ∼1 yr of age as a final data point.
15 sets of mice (wild-type, heterozygous, and homozygous) were also tested for sensorimotor defects. Essentially, mice were allowed to hang upside down from chicken wire (1-cm gauge) attached to a bell jar ∼1.5–2 ft above a surface. They were subsequently timed until they fell off. Timing was cut off at 2 min of hanging upside down.
Biochemical Analyses
Western analysis was done as described by Rahman et al. 1998. Essentially, a whole brain from either a 6-wk-old wild-type, heterozygous, or homozygous mouse was homogenized in PBS (140 mM NaCl, 2.5 mM KCl, 10 mM Na-phosphate dibasic, 2 mM K-phosphate monobasic, pH 7.4) with protease inhibitors. The crude lysate was centrifuged at 3,000 g and the supernatant quantitated for total amount of protein by Bradford analysis (BioRad). Equivalent amounts of total protein were loaded per lane on 10% polyacrylamide gels. Western analysis was done with mAb 63-90 (1:1,000 dilution of ascites fluid; Stenoien and Brady 1997), polyclonal antisera directed against KLC1 and KLC2 (Rahman et al. 1998), polyclonal antisera directed against KIF5A (1:100 dilution), polyclonal sera directed against KIF5B (1:1,000 dilution; Niclas et al. 1994), or an mAb to actin (1:5,000 dilution; Boehringer Mannheim Catalog #1 378 996). Bands were visualized by incubating with either HRP-conjugated goat anti–rabbit IgG (Zymed Labs, Inc.) or goat anti–mouse IgG (Jackson ImmunoResearch Laboratories, Inc.) secondary antibodies, and subsequent processing with ECL (Nycomed Amersham Inc.).
For quantitative Western blot analysis of protein amounts, the antibodies were first calibrated to give linear detection of signals over a linear dilution range (10–50 μg of the brain supernatant/lane). Equal amounts (40 μg) of brain supernatant were loaded for the wild-type, heterozygous, and mutant KLC1 samples and probed with the above antibodies. Band intensities were quantitated using NIH Image and relative ratios of the intensities were calculated.
For sucrose gradient analysis of kinesin-I, brain from either a 6-wk-old wild-type, heterozygous, or homozygous mouse was homogenized in buffer A (10 mM Hepes, pH 7.3, 0.5 mM EGTA, 0.5 mM MgCl2, 50 μM ATP) in the presence of protease inhibitors. The crude lysate was centrifuged at 3,000 g to remove unbroken cells and nuclei, and the postnuclear supernatant subsequently centrifuged in a Sorval T-1270 rotor at 35,000 rpm for 30 min at 4°C. The resulting high-speed supernatant (0.4 ml) was then top-loaded onto a 5–20% linear sucrose gradient (10.4 ml in buffer A), and centrifuged in a Beckman SW41 rotor at 39,000 rpm for 14 h. 16 fractions (∼0.6 ml each) were collected from the top of the gradient using a fraction collector. Equal volumes of each fraction were loaded onto 10% SDS polyacrylamide gels, and quantitative Western analysis done as described. Control protein markers, alcohol dehydrogenase (7.4 S), catalase (11.3 S), and β-galactosidase (16 S) were solubilized and centrifuged in parallel sucrose gradients, and the enzymatic activities measured in each fraction (Martin and Ames 1961) to determine the peak of each marker.
Immunoprecipitation Reactions
Immunoprecipitation reactions were carried out as described by Rahman et al. 1998. Whole brains from 6-wk-old wild-type, heterozygous, and homozygous mice were homogenized in 1 ml of RIPA buffer (150 mM NaCl, 50 mM Tris, pH 8.0, 1% NP-40, 0.5% deoxycholate, 0.1% SDS) with protease inhibitors. The homogenates from brain from each type of mouse were spun at 100,000 g for 30 min to yield lysate. 100 μl of lysate was precleared with preblocked protein A–Sepharose beads (Zymed Labs, Inc.) and subsequently used for immunoprecipitation reactions. Sufficient quantities of either anti-KLC1 and anti-KLC2 (Rahman et al. 1998), or anti-KIF5A and anti-KIF5B antibodies (Niclas et al. 1994) were added to the precleared lysate so as to completely immunoprecipitate the antigens in the lysate. The antibody–protein complex was precipitated with protein A–Sepharose beads (Zymed Labs, Inc.). The beads were washed several times with RIPA buffer, once with 50 mM Tris, pH 6.8, and resuspended in 2× SDS loading buffer. Equivalent volumes of lysates and immunoprecipitates, and supernatants from immunoprecipitates were loaded in each lane and subsequently analyzed by Western blotting as described.
Immunofluorescence Studies
Immunofluorescence was done as described by Rahman et al. 1998. 6-wk and older wild-type, heterozygous, and homozygous sets of mice were perfused with 4% paraformaldehyde and the spinal cord and dorsal root ganglion (DRG) were surgically removed. All tissues processed for immunofluorescence were postfixed for 2 h and then transferred to 30% sucrose in PBS overnight for cryoprotection. 10–14-μm cryosections were prepared for immunostaining. Primary antibodies were added to a buffer containing 1× PBS, detergent (either 0.6% Triton X, 1% Triton X, or 0.15% saponin), and 5% BSA for overnight incubations. Antibodies against KLC1 and KLC2 were used at a final concentration of 100 μg/ml. KIF5A and KIF5B antibodies (Niclas et al. 1994) were used at 1:50 and 1:20 dilutions, respectively. 63-90 (Stenoien and Brady 1997) was used at a 1:250 dilution of the ascites fluid. Giantin (Linstedt and Hauri 1993) was used at a 1:50 dilution of supernatant. Monoclonal β′-COP antibody (CMIA10) was used at a dilution of 1:2,000 (Orci et al. 1993; Lowe and Kreis 1996). Fluorescein-conjugated sheep anti–rabbit IgG (2 μg/ml) and Texas red-labeled goat anti–mouse IgG (2.5 μg/ml), or fluorescein-conjugated sheep anti–mouse IgG (2 μg/ml) and Cy5-conjugated goat anti–rabbit (2 μg/ml) secondary antibodies were used for visualizing staining. A BioRad MRC-1024 confocal laser scanning microscope was used to collect images.
Sciatic Ligations
The sciatic nerves of anesthetized mice were ligated as described in Smith 1980, Hirokawa et al. 1990, and Hanlon et al. 1997. After a 6-h ligation, the mice were transcardially perfused with 4% paraformaldehyde and both the ligated and unligated sciatic nerves were removed from the mouse. The tissue was subsequently processed for immunofluorescence as described above. All mice used for these ligation experiments were ∼6-wk-old.
Results
Generation of KLC1 Mutant Mice
To analyze KLC1 function, we generated mice with a gene-targeted mutation in the KLC1 gene. The construction of a true null mutation in this gene was complicated by instability of the 5′ region of the KLC1 gene in plasmid vectors. Thus, a KLC1 targeting construct that removed the entire gene could not be made. Instead, we made a construct (Fig. 1) that removed the majority of the gene, including the region encoding the highly conserved TPR domain (Gindhart and Goldstein 1996), and left only a small piece encoding the alpha-helical coiled coil needed for interaction with KHC (Gauger and Goldstein 1993; Diefenbach et al. 1998). Although a small amount of the encoded KLC1 fragment could be detected under some conditions, several lines of evidence discussed here suggest that this mutant is functionally null.
The promoterless IRES-β-geo targeting vector was used to enrich for homologous recombination at the correct locus. The targeting frequency observed with KLC1 was ∼10%. Six clones were obtained that tested positive for recombination by PCR and Southern analysis (Fig. 1 B). Of these six clones, E2 and F11 produced mice that were highly chimeric (>50% coat color contribution from ES cell lineage). All highly chimeric male mice obtained from the E2 and F11 lines were able to transmit through the germline, as observed by agouti coat color of the offspring from C57BL/6 matings. However, two of these male chimeric mice consistently transmitted to offspring at >90% efficiency. Since homologous recombination only affects one copy of the targeted gene, agouti coat color by itself is not an indication of a heterozygous mouse. Therefore, all agouti offspring from chimera and C57BL/6 or 129 SvEv matings were genotyped by PCR (Fig. 1 C). The first 100 genotypings were also done in tandem with dot blots using a β-galactosidase probe to verify reproducibility of the PCR reactions (data not shown). Heterozygous mice did not display any discernible abnormalities and were indistinguishable from their wild-type littermates. Heterozygous mutant mice were interbred to produce homozygous mice. All offspring from matings of heterozygous mice were genotyped by PCR (Fig. 1 C).
General Observations of Mutant Mice
PCR genotyping of mouse tails from offspring of matings of heterozygous mice showed that homozygous KLC1 mutant mice are viable (Fig. 1 C). These mice are, however, significantly smaller than their wild-type or heterozygous littermates (Fig. 2A and Fig. C). All offspring from the first 12 litters (98 mice total) were sexed, genotyped, and weighed periodically until weaning at 21 d after birth. In a mixed 129/BL6 background, the predicted Mendelian ratio of 1:2:1 was observed of wild-type (KLC1 +/+; n = 25/98), heterozygous mutant (KLC1 +/−; n = 54/98), and homozygous mutant (KLC1 −/−; n = 19/98) animals. A 1:1 ratio of male (n = 51/98) to female (n = 47/98) mice was also observed. Although mice were first weighed, genotyped, and ear punched for tracking purposes at day 10 after birth, mice of noticeably small size were evident at birth and presumed to be homozygous mutant, although they were too young to be genotyped. The size difference between wild-type or heterozygous and homozygous mice was also noticeable in adults (Fig. 2 A). Besides the size difference, KLC1 mutant mice also exhibited visible motor defects. One such deficit was quantitated by testing the ability of the mice to hang upside down from chicken wire (Fig. 2 B). Heterozygous mutant mice were normal for every metric we tested, indicating that the KLC1 mutation is recessive.
Figure 2.

Analysis of basic phenotypes of KLC1 mutant mice. A, All 98 offspring from the first 12 litters of F1 heterozygous × F1 heterozygous matings were weighed at days 10, 14, 18, and 21 after birth. 25 adult mice of each genotype (caged together) were also weighed at ∼1 year of age as a final data point. The average weights in each category are represented in this graph. Homozygous mice were consistently smaller than their heterozygous or wild-type littermates. B, 15 wild-type, heterozygous, and homozygous mice were tested for sensorimotor defects. Mice were allowed to hang upside down from chicken wire (1-cm gauge) attached to a bell jar ∼1.5–2 ft above a surface. They were subsequently timed until they could no longer maintain grip and fell. Timing was cut off at 2 min for wild-type and mutant heterozygotes. C, Picture of wild-type and homozygous mice from the same litter at ∼3-wk old. The wild-type mouse (agouti coat color) is noticeably larger than the KLC1 homozygous mouse (black coat color). D, Equal amounts of total protein (40 μg) from brain extracts were loaded for Western analysis. KIF5A and KIF5B antibodies were used to detect the two KHC components, and 63-90 was used to detect both KLC2 (upper band) and KLC1 (lower band). Actin was used as an internal loading control for the blots. The intensity of the bands was quantitated using NIH Image and the ratios calculated as shown in Table .
Abundance of KLC and KHC in KLC1 Mutants
To verify the absence of normal KLC1 in gene-targeted mice, and to assess the effects of removing normal KLC1 on the behavior of KLC2, KIF5A, and KIF5B, Western analysis of brain and sciatic nerve tissue homogenates was done. The abundance of each of these proteins was compared between littermates that were wild-type, heterozygous mutant, and homozygous mutant. Careful quantitation using actin as an internal control standard revealed no discernible difference in the levels of either KIF5A or KIF5B in crude cytoplasmic lysates of brain from each of the three genotypes (Fig. 2 D and Table ). KLC1 and KLC2 levels in brain were assessed with mAb 63-90 (Stenoien and Brady 1997), which is an mAb that recognizes a shared epitope in the coiled-coil region of both KLC1 and KLC2. Hence, it should recognize both full-length and truncated KLC1 with comparable affinity. The levels of KLC1, but not KLC2, were dramatically reduced in crude cytoplasmic brain extracts from KLC1 −/− mice (Fig. 2 D and Table ). A very small amount of the truncated KLC1 protein product could also be detected. The lack of any measurable change in the amounts of KIF5A and KLC2 in KLC1 mutants suggests that there is a pool of KIF5A that is not associated with any KLC in KLC1 mutants; this supposition is confirmed by the sucrose gradient analysis described below. In sciatic nerve extracts, no obvious changes were observed in the levels of KIF5A, KIF5B, or KLC2 (data not shown). Similar to what was observed with brain extracts, only a small amount of the KLC1 fragment could be detected in sciatic nerve extracts from mutant animals. Interestingly, immunofluorescence with both anti-KLC2 and mAb 63-90 suggest that KLC2 levels are reduced in the sensory neuron cell bodies of the DRG from mutant animals. However, levels of KLC2 did not seem to be affected much in the cell bodies of the motor neurons in the ventral horn of the spinal cord (data not shown). As described previously, KLC3 could not be reliably detected (Rahman et al. 1998).
Table 1.
Relative Ratios of Kinesin-I Subunits in Wild-type and KLC1 Mutants
| +/+ | +/− | −/− | |
|---|---|---|---|
| KLC1:Actin | 0.60 | 0.35 | 0.00 |
| KLC2:Actin | 0.74 | 0.78 | 0.74 |
| KIF5A:Actin | 0.74 | 0.80 | 0.74 |
| KIF5B:Actin | 0.88 | 0.93 | 0.91 |
| KLC1:KLC2 | 0.80 | 0.44 | 0.00 |
| KIF5A:KLC2 | 1.00 | 1.02 | 1.00 |
| KIF5B:KLC2 | 1.19 | 1.18 | 1.23 |
Interactions of KIF5A and KIF5B with KLC in Wild-type and KLC1 Mutants
To assess interactions of wild-type and mutant KLC1 with KIF5A and KIF5B, to test directly for a pool of KIF5A free of KLC, and to determine if there was obvious compensation of KLC1 function by KLC2, immunoprecipitation studies combined with Western analyses and sucrose gradient analyses of brain extracts were conducted. Immunoprecipitations with anti-KIF5A and KIF5B antibodies from brain lysates indicate that KLC2 is still capable of forming complexes with either KIF5A or KIF5B in KLC1 mutant mice (Fig. 3 A). There was no obvious difference in the amount of KLC2 that coprecipitated with KIF5A or KIF5B between wild-type, heterozygous, and homozygous KLC1 mutant mice; normal KLC1 and the KLC1 fragment were not detected in homozygous mutant immunoprecipitations. Although the level of truncated KLC1 is greatly reduced in mutant brain, this observation suggests that only a small amount of KIF5A or KIF5B, if any, is associated with the KLC1 fragment.
Figure 3.
Biochemical analysis of KLC1 mutant mice. A, KIF5A or KIF5B antibodies were used in immunoprecipitation experiments and then probed with KIF5A, KIF5B, or 63-90 antibodies to assess the association of KHC and KLC forms in wild-type, heterozygous, and homozygous mutant genotypes. B, Sucrose gradient analysis of high-speed supernatant of brain extracts from wild-type (open circles) and mutant KLC1 (closed circles) was done using 5–20% linear sucrose gradients. 16 fractions were collected (fraction 1 is top of gradient), and equal volumes were loaded for Western analysis. The relative intensity of the bands in each fraction was calculated as described in Fig. 2 D and plotted. Control protein markers were run in parallel gradients; the enzyme activity of alcohol dehydrogenase (7 S) was at fraction 6, catalase (11.3 S) was at fraction 9-10, and β-galactosidase (16 S) was at fraction 13-14 (data not shown).


Sucrose gradient analysis (Fig. 3 B) was used to test directly the supposition that KLC1 mutants have a pool of KIF5A lacking KLC that is not ordinarily found in wild-type. Quantitative Western blotting of sucrose gradient fractions of mutant and wild-type brain extracts revealed that in wild-type, all KIF5A sedimented in fractions containing KLC1 and KLC2. The KLC1 mutant, however, showed a consistent shift in sedimentation of KIF5A to lighter fractions with significantly less KLC present. Similar, though not as extreme, behavior of KIF5B was also seen. This difference presumably arises because KIF5B is expressed in nonneural cells where KLC1 is ordinarily less abundant, whereas KIF5A is expressed primarily in neural cells in which KLC1 expression is enhanced. Finally, we observed some KIF5A and KIF5B that sedimented at much higher S values in KLC1 mutants. The origin of this species is unknown at present, although it could represent an aggregated component.
Alterations in Distribution of KIF5A, KIF5B, and COPI in Cell Bodies of the Motor and Sensory Neurons
To examine the distribution of KLC and KHC in neuronal cell bodies, and to evaluate whether loss of normal KLC1 led to changes in the behavior of the KIF5A and KIF5B subunits of kinesin-I, immunofluorescence studies were carried out. Motor neuron cell bodies in the ventral horn of the spinal cord and sensory neuron cell bodies in the DRG were examined. In KLC1 mutant homozygotes, KIF5A was seen to accumulate abnormally in tubular structures in both the motor neuron cell bodies (Fig. 4 A) and the sensory neuron cell bodies in the DRG (Fig. 4 B). To determine if the aberrant localizations of KIF5A corresponded to known membrane compartments, motor neuron cell bodies were double labeled with KIF5A antibodies and a variety of other antibody markers for the ER, Golgi apparatus, lysosomes, and mitochondria. Interestingly, the aberrant KIF5A staining in the motor neuron cell bodies of the ventral horn was seen to colocalize only with the cis-Golgi marker giantin in KLC1 homozygous mice and not with other markers tested (Fig. 4 A). Similar colocalization of KIF5A and giantin was seen in sensory neuron cell bodies of the DRG (Fig. 4 B). To confirm that giantin probes were labeling cis-Golgi compartment as expected, double labeling with antibodies directed against the well characterized Golgi marker mannosidase II (MannII) were done; precise colocalization of MannII and giantin was observed (Fig. 5 A). Finally, KLC1 mutant neuronal cells did not exhibit any obvious changes in either mitochondrial or steady-state lysosome distribution visualized by immunofluorescence (data not shown).
Figure 4.

Abnormal accumulation of KIF5A on Golgi structures in KLC1 mutants. A, Abnormal localization of KIF5A in the motor neuron cell bodies on structures that costain with the peripheral cis-Golgi marker, giantin. KIF5A staining is diffuse in wild-type cells, but accumulates on structures staining for a Golgi marker in KLC1 mutants. B, KIF5A localization in or near structures staining for giantin in KLC1 mutants is also observed in the cell bodies of sensory neuron in the DRG. C, There are no detectable differences in the staining pattern of KIF5A between wild-type and heterozygous DRG sensory and motor neurons. Bars, 10 μm.
Figure 5.
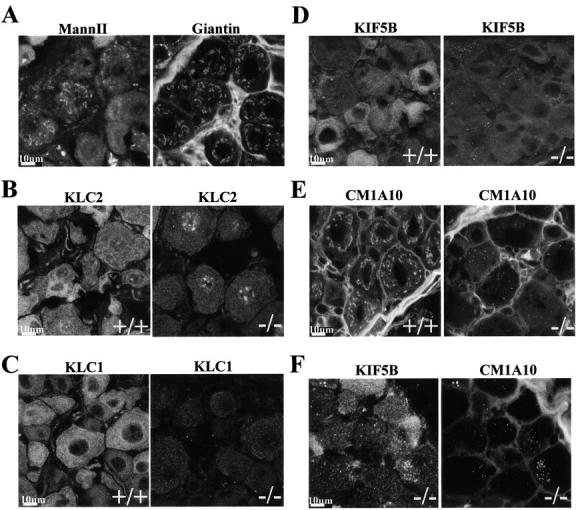
Immunofluores-cence studies of sensory neuron cell bodies of the DRG. A, Giantin recognizes similar structures as MannII in DRG sensory neuron cell bodies. B, There is a marked depletion of KLC2 in cell bodies of sensory neurons of the DRG in KLC1 mutant mice. The punctate perinuclear staining observed in KLC1 −/− cells is also detected in wild-type cells, although not as clearly because of the enhanced cytoplasmic staining. C, KLC1 staining in wild-type, heterozygous, and homozygous KLC1 mutants. D, KIF5B staining changes from an overall diffuse pattern in wild-type cells to a punctate form in KLC1 −/− cells. E, β′-COP (COP1) staining as visualized by CM1A10 is disrupted in KLC1 mutant mice. The staining pattern with CM1A10 resembles Golgi apparatus-like structures in wild-type cells, however, this pattern becomes punctate in KLC1 mutant cells. F, Colocalization of KIF5B and β′-COP (CM1A10) in aberrant accumulations in KLC1 mutants. Bars, 10 μm.
Mice that were heterozygous for the KLC1 mutation showed a primarily diffuse staining pattern of KIF5A in both motor and sensory neuron cell bodies (Fig. 4 C), suggesting that the small amount of KLC1 fragment does not actively induce abnormal behavior of KIF5A. Similar to wild-type animals, only faint staining by KIF5A antibodies in or near the Golgi apparatus was seen in the motor and sensory neurons of heterozygous mutant animals.
KLC2 staining (Fig. 5 B) levels were consistently reduced in the sensory neuron cell bodies of KLC1 mutant mice. In addition, the strong and diffuse KLC1 staining ordinarily seen in wild-type was not observed in the cell bodies of homozygous mutant sensory (Fig. 5 C) and motor neurons (data not shown), confirming that normal KLC1 was gone and that the KLC1 fragment was virtually absent from the cell bodies. The combined Western and staining data thus suggest that the truncated KLC1 protein levels are dramatically reduced in the cell bodies, compared with wild-type levels of KLC1. Neither mAb 63-90 or polyclonal KLC1 antibodies showed any costaining of the KLC1 fragment and giantin or KIF5A in homozygous KLC1 mutant cells. KIF5B staining was also altered in homozygous KLC1 mutant sensory, but not in motor neuron cell bodies; the normal diffuse pattern was altered to a more punctate distribution (Fig. 5 D) that did not colocalize with known ER, mitochondrial, or Golgi markers (data not shown). Intriguingly, COPI distribution detected by mAb CM1A10 staining of β′-COP (Lowe and Kreis 1996) in sensory neuron cell bodies was also altered by the lack of functional KLC1. The staining pattern changed from one that resembled Golgi apparatus staining in wild-type sensory cells to a more punctate staining pattern in KLC1 mutant cells (Fig. 5 E). The altered CM1A10 staining largely colocalized with the aberrant KIF5B staining (Fig. 5 F).
Accumulation of KIF5A and KIF5B in Sciatic Nerve Ligations
To gain a qualitative assessment of KIF5A and KIF5B behavior in axonal transport, we used sciatic nerve ligation experiments. Sciatic nerve ligation is a unique way of visualizing directional movement along microtubules. Microtubules within the axons of the sciatic nerve are arranged such that their minus end is toward the cell body and the plus end is towards the synaptic terminal. Hence, accumulations of motor proteins proximal to the site of ligature indicate plus end directed movement, whereas accumulations on both sides of the ligature usually indicate minus end directed movement (Hirokawa et al. 1990, Hirokawa et al. 1991; Hanlon et al. 1997). Ligation experiments indicate that KIF5A and KIF5B are able to move in a plus end directed fashion in KLC1 mutant mice (Fig. 6). There were no discernible differences between accumulations in wild-type, heterozygous, and homozygous mutant KLC1 mice.
Figure 6.

Sciatic nerve ligations detect plus end directed movement of both KIF5A and KIF5B in KLC1 mutant mice. Accumulations on the proximal side of the ligations were comparable between wild-type, heterozygous, and mutant mice. Bar, 100 μm.
Discussion
Mice lacking wild-type KLC1 are abnormal. These mice exhibit overt movement defects, small size, and in particular, their sensory and motor neurons have obvious alterations in the intracellular localization of kinesin-I and COP-I components. Together, these data demonstrate that KLC1 has crucial functions, even in the presence of the potentially redundant KLC2 and KLC3. To understand fully the phenotype of the KLC1 mutant that we generated, and its implications for the intracellular function of KLC1, it is necessary to evaluate the nature of the KLC1 mutation that we made.
There are several lines of evidence that support the view that the KLC1 mutation we made is functionally null with respect to the phenotypes observed, in spite of the presence of a KLC1 fragment of low abundance. First, Western blots of brain tissue from mutant animals suggest that only a very small amount of the KLC1 fragment relative to wild-type KLC1 is present. Second, immunofluorescence of sensory and motor neuron cell bodies in DRG and spinal cord reveals only faintly detectable staining of the KLC1 fragment relative to the robust staining ordinarily seen in wild-type. Third, immunoprecipitation experiments from whole brain provide no evidence for the association of the KLC1 fragment with KIF5A or KIF5B. Fourth, the sites of aberrant accumulation of KIF5A or KIF5B in DRG or spinal cord do not exhibit costaining with KLC antibodies in mutants, suggesting that the aberrantly behaving KHC chains do so as a result of the absence of KLC, rather than an active influence of the KLC1 fragment. Fifth, the overall abundance of KIF5A and KLC2 are unchanged, even though KLC1 has been removed. Thus, there appears to be a larger than normal pool of KIF5A lacking associated KLC, a suggestion that was confirmed by sucrose gradient analysis. Sixth, heterozygotes are normal with respect to all phenotypes we observed, suggesting that the fragment does not actively exert cellular effects. It remains formally possible that the low abundance KLC1 fragment does have some residual function, but if so, we have failed to detect it.
Together, the data on the KLC1 mutant mice provide new insight into the potential functions of KLC. In particular, they provide new information about organismal requirements for KLC function, and provide new insights into the role of KLC in kinesin-I function.
KLC1 Function Is Required for Proper Development
Kinesin-I isolated from most species has a 1:1 stoichiometric ratio of KHC and KLC. However, studies in Neurospora crassa (Steinberg and Schliwa 1995) show that KLC proteins do not copurify with KHC in biochemical preparations. Studies in sea urchin also suggest that stoichiometric amounts of KLC do not always copurify with KHC (Skoufias et al. 1994). These results raise the possibility that KLC function may be most important in a subset of kinesin-I processes in larger organisms or large cells. This view seems plausible, given that flies (Gauger and Goldstein 1993), worms (Fan and Amos 1994), sea urchin (Wedaman et al. 1993), and squid (Beushausen et al. 1993) have a single gene encoding KLC, whereas mammals (Lamerdin et al. 1996; Rahman et al. 1998) have at least three genes encoding KLC. Nonetheless, KLC1 mutants have a constellation of visible phenotypes, even though KLC2 is clearly present. The KLC gene products in mammals may have different roles, which partially overlap, in intracellular transport in neuronal cells.
Given the strong neuronal phenotype and ultimate lethality of mutants lacking KHC or KLC in Drosophila and mutants lacking KHC in C. elegans, one might expect severe neuronal abnormalities in animals bearing mutant KLC1. Although KLC1 mutant mice were significantly smaller than their heterozygous or wild-type siblings and showed some neuronal deficits, they did not exhibit neuronal problems as severe as those seen in Drosophila.
One explanation for this apparent discrepancy is that although KLC1 is predominantly expressed in tissues of neuronal origin, these tissues also express KLC2, and possibly KLC3. Thus, loss of KLC1 may reduce the overall pool of functional KLC below some necessary threshold, but otherwise KLC2, or perhaps KLC3, can carry out the specific functions that KLC1 ordinarily has. A second explanation is that Drosophila axons are of much smaller caliber than the mouse axons, and hence, a defect leading to diminished cargo transport in a smaller axon might actually cause significant blockage of any type of fast transport within that axon. In fact, both KLC and KHC mutants in Drosophila exhibit membranous clogs in the segmental nerves (Hurd and Saxton 1996; Gindhart et al. 1998). A variety of fast transport motors and cargoes are seen to colocalize in the clogs, suggesting that they may impair multiple pathways of axonal transport. A mouse axon may be able to overcome this blockage problem by having more volume to accommodate membranous accumulations. Hence, lethality due to null mutations of KHC and KLC in Drosophila may be a secondary phenotype due to the physiology of the organism, rather than because of a crucial requirement for certain cargoes to be transported by kinesin-I. A third explanation is that KLC1 may be required for a subset of kinesin-I molecules in the cell to transport unique cargoes, but the transport of these cargoes is not essential for neuronal viability. Further work is needed to distinguish among these possibilities.
Cellular Effects of Loss of KLC
The most plausible explanation for the cellular phenotype observed in KLC1 mutant mice is that a subset of kinesin-I holoenzyme function is disturbed in KLC1 mutant mice. The abnormal accumulations of KIF5A and KIF5B may reflect either blocks in some nonessential transport processes that require KLC1, kinetic accumulations resulting from reduced rates of some events, or accumulations at abnormal sites. Although KIF5C was not analyzed owing to a lack of appropriate reagents at the time these experiments were conducted, we presume that future work will find that its behavior is altered as well. It is unclear why the cellular distribution of KIF5A is perturbed in both sensory and motor neurons whereas the cellular distribution of KIF5B is only detectably perturbed in sensory neurons. Whether these cell-type specific differences reflect divergent roles of KIF5B in motor and sensory neurons or a different balance between active and inactive states is unknown at present.
Previous studies have indicated that kinesin-I may play roles in a variety of different cellular processes, e.g., trafficking between the Golgi apparatus and the ER (Lippincott-Schwartz and Cole 1995), mitochondrial placement (Khodjakov et al. 1998; Tanaka et al. 1998), lysosomal movement (Hollenbeck and Swanson 1990; Tanaka et al. 1998), and perhaps late events in the secretory pathway. Double labeling experiments indicated that accumulations of KIF5A in sensory and motor neuron cell bodies colocalized with the cis Golgi marker giantin. This observation is consistent with the hypothesis that kinesin-I plays some role in transport events involving, or initiating, at the Golgi apparatus. Interestingly, β′-COP staining was also radically redistributed in sensory neuron cell bodies in KLC1 mutant animals. Therefore, the redistribution of β′-COP in the mutant DRG cells may be caused by some disturbance in the rate or character of transport between Golgi apparatus and ER, or perhaps interference by the aberrant accumulations of KIF5A or KIF5B. It is unlikely, however, that there is an absolute block in these events, since the mice are viable and the Golgi apparatus has a grossly normal organization and distribution in these cells. KLC1 mutant neuronal cells also did not exhibit any obvious changes in either mitochondria or steady state lysosome distribution by immunofluorescence studies (data not shown), although KIF5B localization was abnormal. These differing observations suggest that neuronal and ubiquitous forms of kinesin-I may have distinct pathways of activity that do not fully overlap, and may diverge in different cell types, depending on the cargo or other burden in each particular cell.
Models of KLC1 Function In Vivo
Formally, there are four possible models for KLC function. The first, the KLC inhibition model, is that KLC negatively regulates KHC function. This model is supported by indirect work suggesting that the enzymatic ATPase activity of KHC is enhanced upon removal of its tail or KLC (Kuznetsov et al. 1989; Hackney et al. 1991; Hackney 1994; Jiang and Sheetz 1995). This model is also supported by recent studies indicating that KLC inhibits KHC from binding microtubules at physiologic pH, however, shift of pH to 6.8 releases this inhibition (Verhey et al. 1998). Interestingly, in a transient transfection system in COS cells, the coiled-coil domain of KLC by itself was capable of binding KHC and causing this inhibitory effect. These studies also suggested that excess KHC by itself, in the absence of coexpressed KLC, would translocate along microtubules to the periphery of the cell. Our observations are not entirely consistent with this study and do not readily support the KLC inhibition model. We do not observe accumulation of the KIF5A or KIF5B KHC chains at the cellular periphery or on filamentous elements in the cytoplasm of KLC1 mutant neurons. Instead, we see accumulations in or near the Golgi apparatus of KIF5A and punctate accumulations of KIF5B associated with COPI. It is possible that these observational differences can be explained by the fact that COS cells are not neurons; further work is needed to uncover the source of this discrepancy. The KLC inhibition model is also inconsistent with previous data suggesting that kinesin-I in Neurospora (Steinberg and Schliwa 1995) and sea urchin (Skoufias et al. 1994) may not require stoichiometric amounts of KLC.
The second model of KLC function, the KLC attachment model, suggests that KLC is required for general attachment to cargo. This model is supported by recent work (Stenoien and Brady 1997) showing that perfusion of squid axoplasm with an mAb directed against the TPR domain of KLC significantly inhibits transport of vesicles and organelles. Therefore, one would expect that removal of the TPR domain in KLC1 would prevent KHC from interacting properly with all potential cargoes. In this view, KLC1 mutant mice would be expected to exhibit cellular defects suggestive of the absence of cargo binding. In fact, KLC1 mutant mice show accumulations of KIF5A (and possibly KIF5B) on putative cargoes in the cell bodies of the motor and sensory neurons.
The third model, the KLC specific targeting model, suggests that KLC is required for targeting of KHC to some, but not all cargoes. This model is supported by recent work indicating that a particular splice form of KLC is preferentially localized on mitochondria, but not on other potential kinesin-I cargoes (Khodjakov et al. 1998). In this view, our observation of abnormal accumulations of KIF5A on or near the Golgi apparatus in KLC1 mutants would result from absence of proper targeting, leading to improper targeting to the Golgi apparatus. However, the observation that faint but detectable KIF5A is seen in or near the Golgi apparatus in wild-type neurons, coupled to many previous observations of kinesin-I in association with Golgi elements in a variety of cell types (Marks et al. 1994; Lippincott-Schwartz et al. 1995; Johnson et al. 1996), suggests that the Golgi region is a normal site of KIF5A binding.
The fourth and final model, which is the model we favor at present, is the KLC activation model. This model suggests that KLC is required to activate KHC after proper cargo binding. This model is consistent with data in Drosophila demonstrating that KLC is essential for kinesin-I function (Gindhart et al. 1998), and is also supported by our observation that in the absence of functional KLC1, KIF5A accumulates at a site of presumed transport initiation in or near the Golgi apparatus. In fact, several previous experiments suggest that there is a normal association of some kinesin-I with elements of the Golgi apparatus, perhaps because kinesin-I plays some role in transport initiating at the Golgi apparatus (Marks et al. 1994; Lippincott-Schwartz et al. 1995; Johnson et al. 1996). Under this view, KIF5B is also accumulating at a presently unidentified site of transport initiation in KLC1 mutants. This model can also accommodate the suggestion (Verhey et al. 1998) that cargo binding is required for activation of the kinesin-I holoenzyme by either causing pH shift or small conformation changes. Further work on cells cultured from these mutant animals and permeabilized cell systems may help to test this model, and to understand the details of the proposed activation that is revealed by the KLC1 mutant.
Acknowledgments
We would like to thank M. Farquhar for many hours of helpful discussions and for providing antibodies against MannII (6A). We also thank D. Stenoien and S. Brady, D. Friedman and R. Vale, and A. Lindstedt, T. Sollner, and J. Rothman for providing 63-90, KIF5A and KIF5B, giantin and CM1A10 antibodies, respectively. We would also like to thank members of the Goldstein, Cleveland, and Williams lab for many discussions that helped shape this project.
L.S.B. Goldstein is an Investigator of the Howard Hughes Medical Institute.
Footnotes
1.used in this paper: DRG, dorsal root ganglion; ES, embryonic stem; KHC, kinesin heavy chain; KLC, kinesin light chain; MannII, mannosidase II; TPR, tetratrico peptide repeat
Amena Rahman's current address is Canji Inc., 3525 John Hopkins Court, San Diego, CA 92121.
References
- Beushausen S., Kladakis A., Jaffe H. Kinesin light chainsidentification and characterization of a family of proteins from the optic lobe of the squid Loligo pealii . DNA Cell Biol. 1993;12:901–909. doi: 10.1089/dna.1993.12.901. [DOI] [PubMed] [Google Scholar]
- Bloom G.S., Endow S.A. Motor proteins. 1kinesins. Protein Profile. 1994;1:1059–1116. [PubMed] [Google Scholar]
- Brady S.T., Pfister K.K. Kinesin interactions with membrane bounded organelles in vivo and in vitro. J. Cell Sci. Suppl. 1991;14:103–108. doi: 10.1242/jcs.1991.supplement_14.21. [DOI] [PubMed] [Google Scholar]
- Diefenbach R.J., Mackay J.P., Armati P.J., Cunningham A.L. The C-terminal region of the stalk domain of ubiquitous human kinesin heavy chain contains the binding site for kinesin light chain. Biochemistry. 1998;37:16663–16670. doi: 10.1021/bi981163r. [DOI] [PubMed] [Google Scholar]
- Fan J., Amos L.A. Kinesin light chain isoforms in Caenorhabditis elegans . J. Mol. Biol. 1994;240:507–512. doi: 10.1006/jmbi.1994.1465. [DOI] [PubMed] [Google Scholar]
- Gauger A.K., Goldstein L.S. The Drosophila kinesin light chain. Primary structure and interaction with kinesin heavy chain. J. Biol. Chem. 1993;268:13657–13666. [PubMed] [Google Scholar]
- Gho M., McDonald K., Ganetzky B., Saxton W.M. Effects of kinesin mutations on neuronal functions. Science. 1992;258:313–316. doi: 10.1126/science.1384131. [DOI] [PMC free article] [PubMed] [Google Scholar]
- Gindhart J.G., Jr., Goldstein L.S. Tetratrico peptide repeats are present in the kinesin light chain. Trends Biochem. Sci. 1996;21:52–53. [PubMed] [Google Scholar]
- Gindhart J.G., Jr., Desai C.J., Beushausen S., Zinn K., Goldstein L.S. Kinesin light chains are essential for axonal transport in Drosophila . J. Cell Biol. 1998;141:443–454. doi: 10.1083/jcb.141.2.443. [DOI] [PMC free article] [PubMed] [Google Scholar]
- Goldstein L.S.B., Philp A.J.V. The road less traveledemerging principles of kinesin motor utilization. Ann. Rev. Cell Dev. Biol. 1999;In press doi: 10.1146/annurev.cellbio.15.1.141. [DOI] [PubMed] [Google Scholar]
- Gudkov A.V., Kazarov A.R., Thimmapaya R., Axenovich S.A., Mazo I.A., Roninson I.B. Cloning mammalian genes by expression selection of genetic suppressor elementsassociation of kinesin with drug resistance and cell immortalization. Proc. Natl. Acad. Sci. USA. 1994;91:3744–3748. doi: 10.1073/pnas.91.9.3744. [DOI] [PMC free article] [PubMed] [Google Scholar]
- Hackney D.D. Evidence for alternating head catalysis by kinesin during microtubule-stimulated ATP hydrolysis. Proc. Natl. Acad. Sci. USA. 1994;91:6865–6869. doi: 10.1073/pnas.91.15.6865. [DOI] [PMC free article] [PubMed] [Google Scholar]
- Hackney D.D., Levitt J.D., Wagner D.D. Characterization of alpha 2 beta 2 and alpha 2 forms of kinesin. Biochem. Biophys. Res. Commun. 1991;174:810–815. doi: 10.1016/0006-291x(91)91490-4. [DOI] [PubMed] [Google Scholar]
- Hanlon D.W., Yang Z., Goldstein L.S. Characterization of KIFC2, a neuronal kinesin superfamily member in mouse. Neuron. 1997;18:439–451. doi: 10.1016/s0896-6273(00)81244-1. [DOI] [PubMed] [Google Scholar]
- Hirokawa N., Sato-Yoshitake R., Yoshida T., Kawashima T. Brain dynein (MAP1C) localizes on both anterogradely and retrogradely transported membranous organelles in vivo. J. Cell Biol. 1990;111:1027–1037. doi: 10.1083/jcb.111.3.1027. [DOI] [PMC free article] [PubMed] [Google Scholar]
- Hirokawa N., Sato-Yoshitake R., Kobayashi N., Pfister K.K., Bloom G.S., Brady S.T. Kinesin associates with anterogradely transported membranous organelles in vivo. J. Cell Biol. 1991;114:295–302. doi: 10.1083/jcb.114.2.295. [DOI] [PMC free article] [PubMed] [Google Scholar]
- Hollenbeck P.J., Swanson J.A. Radial extension of macrophage tubular lysosomes supported by kinesin. Nature. 1990;346:864–866. doi: 10.1038/346864a0. [DOI] [PubMed] [Google Scholar]
- Hurd D.D., Saxton W.M. Kinesin mutations cause motor neuron disease phenotypes by disrupting fast axonal transport in Drosophila . Genetics. 1996;144:1075–1085. doi: 10.1093/genetics/144.3.1075. [DOI] [PMC free article] [PubMed] [Google Scholar]
- Jiang M.Y., Sheetz M.P. Cargo-activated ATPase activity of kinesin. Biophys. J. 1995;68:283S–285S. [PMC free article] [PubMed] [Google Scholar]
- Johnson C.S., Buster D., Scholey J.M. Light chains of sea urchin kinesin identified by immunoadsorption. Cell Motil. Cytoskel. 1990;16:204–213. doi: 10.1002/cm.970160307. [DOI] [PubMed] [Google Scholar]
- Johnson K.J., Hall E.S., Boekelheide K. Kinesin localizes to the trans-Golgi network regardless of microtubule organization. Eur. J. Cell Biol. 1996;69:276–287. [PubMed] [Google Scholar]
- Khodjakov A., Lizunova E.M., Minin A.A., Koonce M.P., Gyoeva F.K. A specific light chain of kinesin associates with mitochondria in cultured cells. Mol. Biol. Cell. 1998;9:333–343. doi: 10.1091/mbc.9.2.333. [DOI] [PMC free article] [PubMed] [Google Scholar]
- Kuznetsov S.A., Vaisberg Y.A., Rothwell S.W., Murphy D.B., Gelfand V.I. Isolation of a 45-kDa fragment from the kinesin heavy chain with enhanced ATPase and microtubule-binding activities. J. Biol. Chem. 1989;264:589–595. [PubMed] [Google Scholar]
- Lamerdin J.E., Stilwagen S.A., Ramirez M.H., Stubbs L., Carrano A.V. Sequence analysis of the ERCC2 gene regions in human, mouse, and hamster reveals three linked genes. Genomics. 1996;34:399–409. doi: 10.1006/geno.1996.0303. [DOI] [PubMed] [Google Scholar]
- Linstedt A.D., Hauri H.P. Giantin, a novel conserved Golgi membrane protein containing a cytoplasmic domain of at least 350 kDa. Mol. Biol. Cell. 1993;4:679–693. doi: 10.1091/mbc.4.7.679. [DOI] [PMC free article] [PubMed] [Google Scholar]
- Lippincott-Schwartz J., Cole N.B. Roles for microtubules and kinesin in membrane traffic between the endoplasmic reticulum and the Golgi complex. Biochem. Soc. Trans. 1995;23:544–548. doi: 10.1042/bst0230544. [DOI] [PubMed] [Google Scholar]
- Lippincott-Schwartz J., Cole N.B., Marotta A., Conrad P.A., Bloom G.S. Kinesin is the motor for microtubule-mediated Golgi-to-ER membrane traffic. J. Cell Biol. 1995;128:293–306. doi: 10.1083/jcb.128.3.293. [DOI] [PMC free article] [PubMed] [Google Scholar]
- Lowe M., Kreis T.E. In vivo assembly of coatomer, the COP-I coat precursor. J. Biol. Chem. 1996;271:30725–30730. doi: 10.1074/jbc.271.48.30725. [DOI] [PubMed] [Google Scholar]
- Marks D.L., Larkin J.M., McNiven M.A. Association of kinesin with the Golgi apparatus in rat hepatocytes. J. Cell Sci. 1994;107:2417–2426. doi: 10.1242/jcs.107.9.2417. [DOI] [PubMed] [Google Scholar]
- Martin R.G., Ames B.N. A method for determining the sedimentation behaviour of enzymesapplication to protein mixtures. J. Biol. Chem. 1961;236:1372–1379. [PubMed] [Google Scholar]
- Moore J.D., Endow S.A. Kinesin proteinsa phylum of motors for microtubule-based motility. Bioessays. 1996;18:207–219. doi: 10.1002/bies.950180308. [DOI] [PubMed] [Google Scholar]
- Mountford P., Zevnik B., Duwel A., Nichols J., Li M., Dani C., Robertson M., Chambers I., Smith A. Dicistronic targeting constructsreporters and modifiers of mammalian gene expression. Proc. Natl. Acad. Sci. USA. 1994;91:4303–4307. doi: 10.1073/pnas.91.10.4303. [DOI] [PMC free article] [PubMed] [Google Scholar]
- Nakagawa T., Tanaka Y., Matsuoka E., Kondo S., Okada Y., Noda Y., Kanai Y., Hirokawa N. Identification and classification of 16 new kinesin superfamily (KIF) proteins in mouse genome. Proc. Natl. Acad. Sci. USA. 1997;94:9654–9659. doi: 10.1073/pnas.94.18.9654. [DOI] [PMC free article] [PubMed] [Google Scholar]
- Niclas J., Navone F., Hom-Booher N., Vale R.D. Cloning and localization of a conventional kinesin motor expressed exclusively in neurons. Neuron. 1994;12:1059–1072. doi: 10.1016/0896-6273(94)90314-x. [DOI] [PubMed] [Google Scholar]
- Orci L., Palmer D.J., Ravazzola M., Perrelet A., Amherdt M., Rothman J.E. Budding from Golgi membranes requires the coatomer complex of non-clathrin coat proteins. Nature. 1993;362:648–652. doi: 10.1038/362648a0. [DOI] [PubMed] [Google Scholar]
- Patel N., Thierry-Mieg D., Mancillas J.R. Cloning by insertional mutagenesis of a cDNA encoding Caenorhabditis elegans kinesin heavy chain. Proc. Natl. Acad. Sci. USA. 1993;90:9181–9185. doi: 10.1073/pnas.90.19.9181. [DOI] [PMC free article] [PubMed] [Google Scholar]
- Rahman A., Friedman D.S., Goldstein L.S. Two kinesin light chain genes in mice. Identification and characterization of the encoded proteins. J. Biol. Chem. 1998;273:15395–15403. doi: 10.1074/jbc.273.25.15395. [DOI] [PubMed] [Google Scholar]
- Saxton W.M., Hicks J., Goldstein L.S., Raff E.C. Kinesin heavy chain is essential for viability and neuromuscular functions in Drosophila, but mutants show no defects in mitosis. Cell. 1991;64:1093–1102. doi: 10.1016/0092-8674(91)90264-y. [DOI] [PubMed] [Google Scholar]
- Skoufias D.A., Cole D.G., Wedaman K.P., Scholey J.M. The carboxyl-terminal domain of kinesin heavy chain is important for membrane binding. J. Biol. Chem. 1994;269:1477–1485. [PubMed] [Google Scholar]
- Smith R.S. The short term accumulation of axonally transported organelles in the region of localized lesions of single myelinated axons. J. Neurocytol. 1980;9:39–65. doi: 10.1007/BF01205226. [DOI] [PubMed] [Google Scholar]
- Steinberg G., Schliwa M. The Neurospora organelle motora distant relative of conventional kinesin with unconventional properties. Mol. Biol. Cell. 1995;6:1605–1618. doi: 10.1091/mbc.6.11.1605. [DOI] [PMC free article] [PubMed] [Google Scholar]
- Stenoien D.L., Brady S.T. Immunochemical analysis of kinesin light chain function. Mol. Biol. Cell. 1997;8:675–689. doi: 10.1091/mbc.8.4.675. [DOI] [PMC free article] [PubMed] [Google Scholar]
- Tanaka Y., Kanai Y., Okada Y., Nonaka S., Takeda S., Harada A., Hirokawa N. Targeted disruption of mouse conventional kinesin heavy chain, kif5B, results in abnormal perinuclear clustering of mitochondria. Cell. 1998;93:1147–1158. doi: 10.1016/s0092-8674(00)81459-2. [DOI] [PubMed] [Google Scholar]
- Vale R.D., Reese T.S., Sheetz M.P. Identification of a novel force-generating protein, kinesin, involved in microtubule-based motility. Cell. 1985;42:39–50. doi: 10.1016/s0092-8674(85)80099-4. [DOI] [PMC free article] [PubMed] [Google Scholar]
- Verhey K.J., Lizotte D.L., Abramson T., Barenboim L., Schnapp B.J., Rapoport T.A. Light chain-dependent regulation of kinesin's interaction with microtubules. J. Cell Biol. 1998;143:1053–1066. doi: 10.1083/jcb.143.4.1053. [DOI] [PMC free article] [PubMed] [Google Scholar]
- Wedaman K.P., Knight A.E., Kendrick-Jones J., Scholey J.M. Sequences of sea urchin kinesin light chain isoforms. J. Mol. Biol. 1993;231:155–158. doi: 10.1006/jmbi.1993.1267. [DOI] [PubMed] [Google Scholar]
- Wurst W., Joyner A.L. Production of targeted embryonic stem cell clones. In: Joyner A.L., editor. Gene TargetingA Practical Approach. Oxford University Press; New York: 1993. pp. 32–61. [Google Scholar]
- Xia C., Rahman A., Yang Z., Goldstein L.S. Chromosomal localization reveals three kinesin heavy chain genes in mouse. Genomics. 1998;52:209–213. doi: 10.1006/geno.1998.5427. [DOI] [PubMed] [Google Scholar]