Abstract
The amount of the 64-kDa subunit of polyadenylation/cleavage stimulatory factor (CstF-64) increases 5-fold during the G0 to S phase transition and concomitant proliferation induced by serum in 3T6 fibroblasts. Higher levels of CstF-64 result in an increase in CstF trimer. The rise in CstF-64 occurs at a time when the amount of poly(A)-containing RNA rose at least 5–8 fold in the cytoplasm. Primary human splenic B cells, resting in G0, show a similar 5-fold increase in CstF-64 when cultured under conditions inducing proliferation (CD40 ligand exposure). Therefore, the increase in CstF-64 is associated with the G0 to S phase transition. As B cell development progresses, RNA processing changes occur at the Ig heavy chain locus resulting in a switch from the membrane- to the upstream secretory-specific poly(A) site. Treating resting B cells with agents triggering this switch in Ig mRNA production along with proliferation (CD40 ligand plus lymphokines or Stapylococcus aureus protein A) induces no further increase in CstF-64 above that seen for proliferation alone. The rise in CstF-64 is therefore insufficient to induce secretion. After stimulation of a continuously growing B cell line with lymphokines, a switch to Ig μ secretory mRNA and protein occurs but without a change in the CstF-64 level. Therefore, an increase in CstF-64 levels is not necessary to mediate the differentiation-induced switch to secreted forms of Ig-μ heavy chain. Because augmentation of CstF-64 levels is neither necessary nor sufficient for Ig secretory mRNA production, we conclude that other lymphokine-induced factors play a role.
Treatment of resting cells with agents that caused them to proceed from G0 to S phase resulted in increased polyadenylation enzyme activity (1–3). An increased rate of polyadenylation of mRNA and accumulation of that newly polyadenylated RNA in the cytoplasm was shown to be a rapid response to entry into S phase, occurring even before large increases in new RNA synthesis (4–6). Many genes have been described whose primary RNA transcripts show a complex pattern of multiple polyadenylation site use in different tissues or growth states (reviewed in ref. 7). The formation of the correct 3′-end in some of these RNAs may be regulated as a consequence of changes in polyadenylation factors during proliferation. The recent observation of changes in poly(A) polymerase activity by phosphorylation during the cell cycle (8) reveals one part of this linkage between polyadenylation and cell growth. To determine if the expression of components of the polyadenylation machinery other than poly(A) polymerase may be linked to cell growth, we examined cells that can be induced by the appropriate stimuli to leave G0 and transition synchronously to S phase, namely serum-starved fibroblasts and resting splenic B cells.
Cleavage and polyadenylation of precursor RNAs in vitro requires a number of basal protein factors: cleavage/polyadenylation specificity factor (CPSF), CstF, cleavage factors Im and IIm and poly(A) polymerase. Synthesis of long poly(A) tails depends on poly(A) binding protein II. The factors and their modes of action have been recently reviewed (9). CPSF recognizes the AAUAAA sequence in the 3′ untranslated region of pre-mRNA and is composed of four subunits of 160, 100, 73, and 30 kDa (10, 11). The CstF fraction, composed of three subunits of 77, 64, and 50 kDa (12), recognizes and binds to the G+U- or U-rich region downstream of the site of cleavage on the precursor RNA through the RNA-binding domain of CstF-64 (13–15). Cleavage factor Im is composed of four subunits of 72, 68, 59, and 25 kDa (16, 17). In yeast, in addition to basal factors, several essential genes that regulate and or modulate polyadenylation have been found (18, 19). Mammalian U1-A protein has been shown to modulate the activity of the cleavage/polyadenylation reaction in a positive (20) and negative direction (21).
Using cultured resting fibroblasts and primary splenic B cells, we found that the amount of mRNA and protein for CstF-64, a factor important for binding to the nascent RNA, increased dramatically on the induction of the G0 to S phase transition. The increase in CstF-64 was accompanied by an increase in the amount of CstF trimer, the form of the complex that is presumed to be active. The specific induction of CstF-64 suggests a crucial role for this protein in facilitating poly(A) site choice on proliferation.
In both cultured cells (22–29) and a transgeneic mouse model (30), B cell differentiation has been shown to involve changes in Ig secretory poly(A) site efficiency. We found that the increase in CstF-64 occurred in proliferating B cells independently of the differentiation-induced switch to secretory-specific Ig heavy chain mRNA, demonstrating that the rise in CstF-64 is not sufficient to drive the RNA processing change in normal B cell development.
MATERIALS AND METHODS
3T6 Cell Culture and Analysis.
Mouse 3T6 fibroblasts, generously supplied by Lee Johnson (Ohio State University), were grown in continuous culture and then starved for 7 days in medium containing 0.5% serum as described (31) to produce resting cells. A fluorescence-activated cell sorter analysis of the DNA after propidium iodide staining indicated that n = 2 in the resting cells (data not shown). The cells were then stimulated with medium containing 10% serum for up to 28 hr during which time fluorescence-activated cell sorter analyses showed that DNA content doubled (data not shown). DNA synthesis was monitored by [3H]TdR incorporation after a 30-min pulse by trichloracetic acid precipitation of the labeled DNA from 106 cells as described (31). The stimulated cells demonstrated an induction of DNA synthesis by 11 hr that was increased at 15–20 hr postserum additions and fell off at 24 hr (data not shown).
Western Analyses and Antibodies.
Lysates were prepared by incubating 1.5 × 10⁶ cells on ice for 40 min in 60 ml of a solution containing 1% Triton X-100, 0.1% SDS, 50 mM Tris (pH 8.0), 150 mM NaCl, plus phenylmethyl sulfonyl fluoride, leupeptin, aprotinin, and pepstatin A at the recommended concentrations (32). The proteins (20 μg) from the cleared lysate were separated on SDS/PAGE, blotted to polyvinylidene difluoride membranes and probed, in the linear response range, with the indicated antibodies. We prepared rabbit anti-peptide antisera to CstF-50 and CstF-77 by coupling peptides to keyhole limpet hemocyanin as described (32). For CstF-50, amino acids 1–25 of the predicted sequence were chosen as the hapten whereas for CstF-77 we used amino acids 570–595 (33, 34). Clint MacDonald (Texas Tech University) generously provided anti-CstF-64 (mouse monoclonal 3A7). Anti-CPSF-100 (rabbit polyclonal), anti-CPSF-30 (rabbit polyclonal), and anti-CF-Im-25 kDa subunit (rabbit polyclonal) were generously provided by Silvia Barabino, Ursula Ruegsegger, and Walter Keller (University of Basel). We purchased mouse monoclonal anti-glyceraldehyde-3-phosphate dehydrogenase (GAPDH) from Chemicon. Bax antibody was purchased from Santa Cruz Biotechnology. The peroxidase-coupled secondary antibodies were detected by chemiluminescence and quantified by densitometry.
CstF Complex Analyses.
3T6 cells were lysed and the CstF complexes were precipitated with mouse monoclonal anti-CstF-50 (2C1, generously provided by Clint MacDonald) or anti-human CD8 antibody as described (36). The immunoprecipitated proteins were separated by SDS/PAGE, blotted to a membrane and probed sequentially with anti-CstF-64 and CstF-77 antibodies. The proteins were visualized by chemiluminescence by using a peroxidase-coupled secondary antibody.
Normal Human Splenic B Cells.
Normal human splenic B cells were obtained from the tissue repository at the University of Pittsburgh Medical Center. Lymphocytes were isolated by banding in Histopaque (Ficoll). Cells were cultured for 2–3 days with the indicated reagents: lymphokine interleukin 10 (IL-10; 100 ng/ml); Staphylococcus aureus Cowan strain protein A (SAC) at 0.01%; and/or a mouse L cell monolayer transformed with an expression vector carrying the ligand for CD40 (CD154) as described (37–39). Fluorescence-activated cell sorter (Amersham) analyses, using antibodies to CD20 and CD3, were used to ascertain the fraction of B and T cells, respectively, in the total population after 2 days in culture. The fraction of T cells before B cell enrichment was <6% in each group, except in the IL-10 alone culture where there were 22% T cells. B cells were purified either by a T cell depletion with mouse anti-human CD4 and anti-human CD8 antibodies followed by goat anti-mouse antibodies coupled to magnetic beads, or selection by using pan-B cell antibody anti-CD19 to select pure B cells; similar results were obtained with both positive and negative selection. After 48 hr of culture in the indicated stimulants, B cells were assayed for proliferation by [3H]TdR incorporation into DNA for 16 hr as described (37). IgM secretion was measured by a capture ELISA, as previously described (40), using goat F(ab′)2 anti-human IgM antibody (Cappel no. 5055) coated microtiter plates, the B cell culture supernatant, and peroxidase-conjugated anti-human IgM (Cappel no. 55247). Plates were developed with TM102 blue reagent (Intergen, Purchase, NY), stopped with H2SO4 and read on a Dynatech Automatic plate reader at 450 nm. Results presented are representative of three separate stimulations.
SKW 6.4 B Cell Line.
The B cell line SKW 6.4 (surface IgM+) was treated with IL-6 (15 ng/ml, Genzyme no. 1542–00) to induce secretory IgM production as described (41, 42). Cells were cultured for up to six days with constant feeding to assess growth. Samples were taken at 2 days post-IL-6 for RNA PCR analyses, 2 or 3 days for protein analyses; culture supernatants were taken at 3 days for ELISA determinations of secreted IgM. The ELISA was performed as described for splenic B cells. Doubling time was determined by counting viable cells per ml by trypan blue exclusion.
Reverse Transcription (RT)–PCR Analysis.
The ratio of secretory- to membrane-encoding forms of μ mRNA was determined from an RT-PCR reaction. Cytoplasmic mRNA (5 μg), dT primer, and Superscript II enzyme (BRL) were incubated in a 20 μl reaction at 48°C for 50 min and then heated to 70°C. RNaseH was added (3 units/20 μl reaction) and the reaction incubated at 37°C for 20 min. The cDNA (from 2–6 μl), buffer, and salts, 10 μCi α-[32P]dCTP (1 Ci = 37 GBq), unlabeled dNTPs, Taq polymerase (Boehringer Mannheim), and three PCR primers (≈50 pmol each) were added simultaneously in a 20-μl reaction volume. The cycle was: denature 95°C for 1 min; anneal 55°C for 1 min; and extend 72°C for 1 min. The primers were: HIgμForward, 5′-CAGCTGAACCTGCGGGAGT; HIgμsecReverse, 5′-GACACGGTTAGTTTGCAT; HIgμmbReverse 5′-GGTGACGGTGGTACTGTAGAA. The secretory (412 nucleotides) vs. membrane-specific (386 nucleotides) Ig μ mRNA products from the same reaction tube were separated on a 5% acrylamide/8 M urea gel, exposed to film and ratio of the two products quantified by using the PhosphorImager. The reactions were done over a range of 19–25 cycles with similar results.
RESULTS
To examine the expression patterns of factors involved in poly(A) addition and precursor RNA cleavage during the cell cycle, we examined synchronous 3T6 cells. Mouse 3T6 fibroblasts rest at low density in the G0 state of the cell cycle when kept in medium containing 0.5% serum; they can be stimulated to leave G0 and enter S phase by the addition of serum. This treatment has been shown to produce a synchronous cell population in which DNA synthesis begins ≈12 hr after serum addition, and mitotic activity is initially observed at 20–24 hr (31). Cells that were serum starved (G0) or starved and then stimulated with serum were isolated, and we monitored the incorporation of [3H]thymidine. The stimulated cells demonstrated a 20-fold induction of DNA synthesis by 11 hr that was increased at 15 to 18 hr postserum addition (data not shown). DNA synthesis subsequently decreased at 24 hr when cells began to enter G2/M. The amount of newly synthesized total poly(A)-plus mRNA in the cytoplasm rose 5–8-fold after serum stimulation (ref. 5 and data not shown). On Northern blots, we saw a 4-fold increase in the amount of mRNA for CstF-64 and GAPDH after 18 hr of serum stimulation normalized to total RNA loaded (data not shown).
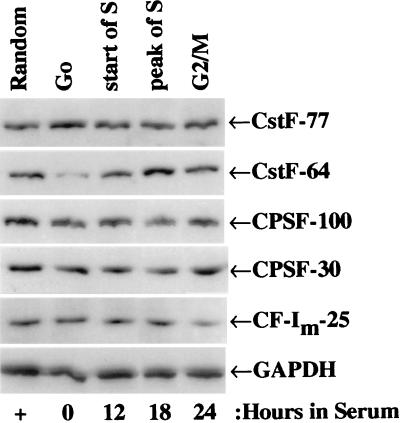
The level of protein for several polyadenylation/cleavage factors in 3T6 cells under a variety of growth conditions was assessed by probing Western blots of denatured cellular proteins with antibodies, as shown in a representative experiment, Fig. 1. The amount of CstF-64 protein increased after serum addition and peaked at ≈18 hr, a point at which the DNA synthesis rate was high. The levels of the other polyadenylation factors assayed (CstF-77, CPSF-100, CPSF-30, and CF-Im-25) did not differ significantly among the randomly growing, G0, or serum stimulated 3T6 cells (Fig. 1 and data not shown). Therefore, of all the factors we examined, only CstF-64 levels increased on entry into the cell cycle from G0.
Figure 1.
Western blot analysis of serum stimulated of 3T6 fibroblasts show increased levels of CstF-64 with proliferation. 3T6 cells were starved in 0.5% serum-containing medium for 7 days (G0) and then stimulated with 10% serum for the indicated number of hr. Proteins samples (20 μg) were separated on SDS/PAGE, blotted to polyvinylidene difluoride membranes and probed, in the linear response range, with the indicated antibodies (see Materials and Methods). GAPDH protein loading control is shown.
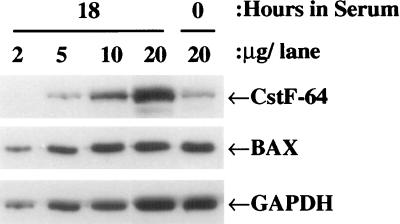
Using a dilution series with antigen and antibody concentrations in the linear response range as shown in Fig. 2, followed by densitometry for quantification, the average increase in CstF-64 protein at 18 hr postserum was estimated as 5-fold relative to the G0 signal. The result was consistently observed in multiple experiments. As previously observed, the protein signals for BAX, a gene involved in apoptosis, remained constant on serum stimulation (35), compare the 20 μg signals plus and minus serum in Fig. 2. The protein signal for GAPDH was also constant after serum stimulation, in contrast to the mRNA data. This observation points to a potential regulation of GAPDH protein expression at the level of translation or alternatively at the level of protein stability.
Figure 2.
CstF-64 protein levels increase specifically after serum stimulation. 3T6 fibroblasts were starved and then stimulated with serum for 18 hr as described in the legend to Fig. 1. Protein samples from the 18-hr serum-treated cells were diluted and run on SDS/PAGE along-side the starved cell sample. The blot was probed with antibodies to CstF-64, BAX, or GAPDH.
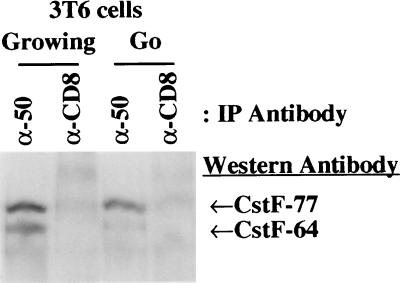
We wanted to determine if an increased amount of CstF-64 protein in cells correlated with an increase in the amount of CstF trimer (composed of 64, 77, and 50 kDa subunits). The three subunits of CstF associate as a trimer to enter the nucleus and affect the cleavage reaction before polyadenylation; only CstF-77 has a nuclear localization signal (34). Overexpression studies of CstF-64 have suggested that it is the rate-limiting component for active trimer formation (36). We prepared extracts from G0 and randomly growing cells and used a monoclonal anti-CstF-50 antibody to immunoprecipitate CstF trimer, as previously described (36); any free CstF-50 will also be precipitated but not visualized by the subsequent steps shown here. The precipitated proteins were run on SDS/polyacrylamide gels, blotted and then probed with anti-CstF-64 and -77 antibodies. There was a dramatic increase in the amount of CstF-64 protein associated with CstF-50 in growing cells relative to the cells in G0 (Fig. 3). The amount of CstF-77 coprecipitated by the anti-CstF-50 antibody in the growing cells was only slightly increased relative to the G0 cells. This result indicates that the higher level of CstF-64 in growing cells is reflected in increased amounts of CstF trimer. Interestingly, CstF-50 and -77 subunits are still associated with each other in G0 when CstF-64 is decreased.
Figure 3.
CstF complex shows increased CstF-64 subunit association in growing cells. 3T6 cells were lysed and incubated with mouse monoclonal anti-CstF-50 or anti-human CD8 antibody as described in Materials and Methods. The immunoprecipitated proteins in the CstF complexes were separated by SDS/PAGE, blotted to a membrane and probed sequentially with anti-CstF-64 and CstF-77 antibodies. The proteins were visualized as described in Materials and Methods.
Splenic B Cells Show Increased CstF-64 with Proliferation.
Splenic B cells are another type of G0, resting cells that can be stimulated to synchronously enter S phase, but antigen (in vivo) and/or T cell contact (in vivo and in vitro), not serum, are the stimuli. Once they begin to grow, the activated B cells with their membrane-bound Ig can differentiate into plasma cells producing large amounts of secretory-specific Ig message and secreted Ig protein; this differentiation is aided by lymphokines from helper T cells. Both Ig secretory- (sec) and membrane-specific (mb) mRNAs can arise from a single primary heavy chain gene transcript; the Ig mb poly(A) addition site is stronger in vitro than the sec site and its use predominates in resting and memory B cells (reviewed in ref. 7). In plasma cells, Ig heavy chain sec messages and proteins predominate because of differential polyadenylation and cleavage at the promoter-proximal secretory-specific poly(A) site. B cell stimulation to growth and differentiation therefore presents an interesting system within which to study polyadenylation/cleavage factor expression. An increase in the amount of CstF-64 protein, but not CstF-77, was observed when resting, nonsecreting mouse splenic B cells (mature B cells) were stimulated by lipopolysaccharide that causes cells both to grow and simultaneously secrete Ig (36).
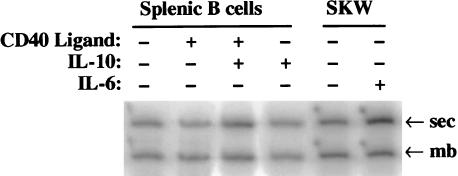
We wished to determine whether growth or differentiation caused the changes in the amount of CstF-64. To answer this question, normal human splenic B cells were cultured with agents causing only growth or growth plus differentiation to secretory Ig production. Culturing primary, human, splenic B cells over a layer of fibroblasts expressing CD40 ligand (CD154) induces the B cells to undergo a G0 to S phase transition but not differentiation. Exposure of B cells to CD40 ligand plus the lymphokine IL-10 induced both growth and Ig secretion (37–39). SAC crosslinks IgM on the surface of resting B cells and stimulates them to proliferate and secrete Ig independent of CD40 and lymphokines (39). After 48 hr the CD40 ligand, CD40 ligand plus IL-10, and SAC-treated splenic B cells were shown to be proliferating by [3H]TdR incorporation into DNA (Table 1). The CD40 ligand plus IL-10 and SAC-treated splenic B cells were shown (Table 1) to produce a larger amount IgM secretory protein than the cells treated with CD40 ligand alone by a capture ELISA on the culture supernatant (40). The ratio of the membrane and the secreted forms of Ig μ mRNA was determined for the first four conditions by using three PCR probes that would simultaneously amplify both species (Fig. 4). The only treatment that showed an increase in the relative amount of secretory-specific RNA was CD40 ligand plus IL-10 (summarized in Table 1); with that treatment the sec:mb mRNA ratio increased ≈3-fold. The increase in the ratio of Ig secretory: membrane specific mRNA was not as large as that seen with the protein because RT-PCR was done on steady-state RNA that includes nonstimulated cells with an excess of pre-existing membrane-specific Ig μ heavy chains.
Table 1.
Stimulation of primary splenic human B-cells induces proliferation and CstF-64 protein
| Treatment | Amounts of polyadenylation/cleavage factors*
|
Proliferation [3H]TdR cpm per 106 cells | Secreted IgM protein (μg/ml) per 106 cells | Ratio Ig μ sec:mb mRNA by PCR | |
|---|---|---|---|---|---|
| CstF-64 | CstF-77, CPSF-30, and CPSF-100 | ||||
| None | 1 | 1 | 2,000 | 0 | 0.8:1 |
| CD40 ligand | 5 | 1 | 75,000 | 3 | 0.8:1 |
| CD40L + IL-10 | 5 | 1 | 90,000 | 60 | 2.4:1 |
| IL-10 | 1 | 1 | 10,000 | 0 | 0.8:1 |
| SAC | 2–3 | 1 | 37,000 | 60 | — |
Data is representative of three separate stimulations.
Normalized to GAPDH loading control.
Figure 4.
PCR analyses of Human Splenic B cells and SKW 6.4 cell line after stimulations. A RT-PCR reaction was performed on cytoplasmic RNA isolated from the cells treated with the indicated stimulants. Three PCR primers, one forward and two reverse, were used to amplify the 3′ ends of the secretory and membrane Ig μ heavy chain mRNAs in the same reaction with [α-32P]dCTP. The sec (412 nucleotides) and mb (386 nucleotides) Ig μ mRNA products were separated on a 5% acrylamide/8 M urea gel. The gel was dried and exposed to a PhosphorImager screen. The ratios of the sec:mb products were quantified, averaged with other similar determinations, and reported in Tables 1 and 2.
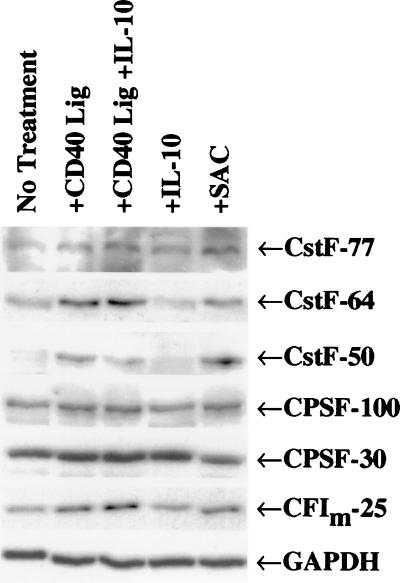
When protein samples from the cells were analyzed by Western blotting using the indicated antibodies (representative experiment shown in Fig. 5) and a dilution series (data not shown), we observed a 5-fold increase in the amount of CstF-64, relative to GAPDH, after treatments that induce the G0 to S phase transition (summarized in Table 1). We observed this increase in three independent experiments by using either positive or negative selection for B cells. CstF-50 and CF-Im-25 also increased slightly with treatments inducing growth (≈2-fold), whereas little significant increase was seen in CstF-77 or any of the CPSF subunits assayed (Fig. 5 and Table 1). It is evident that the increase in CstF-64 occurred when B cells were induced to proliferate but was independent of whether the B cells were induced to secrete IgM (compare CD40 ligand plus or minus IL-10).
Figure 5.
Western blots of stimulated human splenic B cells show increased levels of CstF-64 with proliferation. Normal human splenic B cells were isolated and treated as described in Materials and Methods. Protein samples from purified B cells were isolated after 48 hr of culture under the indicated conditions. Western blot analysis was performed with the indicated antibodies as described in Materials and Methods.
CstF-64 Does Not Increase with Stimulation to Secretion of Ig.
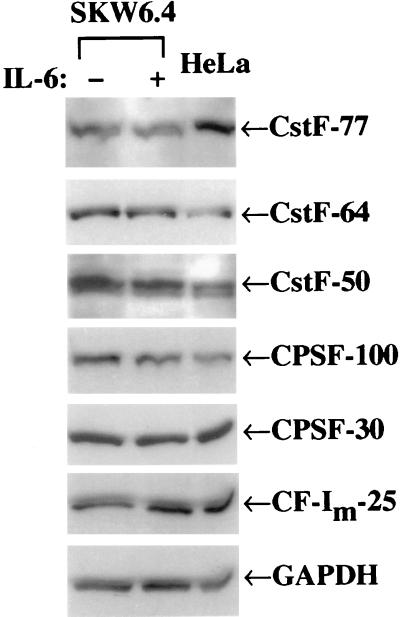
To separate further the effect of proliferation on increasing the expression of some polyadenylation factors from the effect of differentiation to secretory Ig production, we looked at a continuously growing human B cell line, producing primarily membrane-bound Ig, that can be induced to secrete Ig by stimulation with lymphokines. At least 90% of the B cells of the SKW 6.4 line have been shown to switch to secretory Ig production after IL-6 treatment (41, 42). The doubling time of SKW 6.4 is unaffected by IL-6 (Table 2). The SKW 6.4 cells treated with IL-6 differentiated to production of a 5 to 7-fold increase of secretory Ig mRNA over membrane bound forms (sec ≫ mb) in two days as shown by RT-PCR analysis of mRNA (Fig. 4 and Table 2). The treated cells increased production of secreted IgM protein at 3 days post-IL-6, as measured by an ELISA assay (Table 2). Western blots of the proteins from untreated SKW6.4 cells and those treated with IL-6 for 2 days were probed with antibodies to the polyadenylation/cleavage factors CPSF-100, -30; CstF-50, -64, and -77, and CF-Im-25 (a representative blot from several independent determinations is shown in Fig. 6). The amount of the polyadenylation/cleavage factor proteins showed no significant change relative to the loading control GAPDH after stimulation with IL-6, even in a dilution series (data not shown). In addition, analysis of the 2.2-kb CstF-64 mRNA by quantitative Northern blots showed a <25% increase after IL-6 stimulation (data not shown). We conclude that an increase in CstF-64 is not necessary to undergo the switch to the production of excess sec mRNA and protein.
Table 2.
Stimulation of continuously growing human B-cell line, SKW 6.4, with IL-6 induces sec IgM but not CstF-64 protein
| Treatment | CstF-64 Protein levels* | Cell doubling time, hr | Secreted IgM, ng per 106 cells | Ratio Ig μ sec:mb mRNA by PCR |
|---|---|---|---|---|
| None | 1 | 18 | 490 | 0.8:1 |
| IL-6 for 3 days | 1 | 18 | 3,700 | 5.2:1 |
Data is representative of several independent stimulations.
Normalized to GAPDH loading control.
Figure 6.
Western blots of continuously growing B cells stimulated with IL-6 show no change in CstF-64 levels. The B cell line SKW 6.4 was cultured in the presence of IL-6 for 2 days and protein samples were determined by Western blot analysis as described. Data shown are representative of several IL-6 stimulations. Samples from HeLa cells (human) were included as a size control.
DISCUSSION
The results presented here show that an ≈5-fold increase in the amount of CstF-64 accompanied the G0 to S phase transition of 3T6 murine fibroblasts and primary human B cells. The factors CstF-50 and CF-Im-25 showed a small (≈2-fold) increase with proliferation of B cells but not fibroblasts. CstF-64 increased at least 2–3-fold by 12 hr in serum stimulated 3T6 cells, a time at which only a small amount of DNA synthesis has occurred. This increase could account for the previously reported rise in poly(A)-plus mRNA accumulation in the cytoplasm when cells leave G0 and enter S (4–6), because more CstF trimer would be available to recognize the G+U- or U-rich regions downstream of a poly(A) site. More efficient conversion of nuclear RNA to processed and adenylated cytoplasmic mRNA could occur even before overall rates of RNA synthesis increase. Finding that CstF-64 levels increased with cell proliferation in 3T6 cells, we asked if the rise in CstF-64 was a general phenomenon. After treatments that induced the G0 to S phase transition and proliferation of resting primary B cells from human spleen, CstF-64 levels increased, regardless of whether or not the cells were induced to switch to secretory Ig mRNA and protein production. We conclude that entry of G0, resting cells into the growth cycle induces CstF-64 mRNA and protein. Expression of the other cleavage and polyadenylation factors did not vary as much as CstF-64, leading us to propose that CstF-64 levels are most likely rate-limiting for cleavage in G0 cells.
Lipopolysaccharide treatment induces both growth and Ig secretion in mouse B cells and can stimulate production of inducible NO synthase in other cells. A previous study concluded that CstF-64 levels rose in mouse B cells after lipopolysaccharide treatment solely as a result of the induction to Ig sec mRNA production, not proliferation (36). The growth enhancement properties of lipopolysaccharide at influencing CstF-64 levels were not considered a cause of CstF-64 stimulation in that study because mouse liver showed no increase in CstF-64 after 48 hr of treatment with CCl4 (36). However, DNA synthesis in liver regeneration occurs in several waves and is less synchronous than that achieved in cell culture. In addition, hepatotoxins like CCl4 induce tissue injury, inflammation, and replacement of liver cells by fibroblasts (43), so the 5-fold increase in CstF-64 levels that we saw in our studies employing more synchronous growth conditions could have been missed in their studies.
The proliferation-associated increase in the level of CstF-64 in CD40 Ligand-stimulated normal splenic B cells that we saw was insufficient to cause the switch to Ig sec mRNA production. In cultured SKW B cells it was not necessary for the cells to increase the amount of CstF-64 to achieve the switch to Ig sec mRNA after IL-6 treatment. We therefore conclude that CstF-64 increases are neither necessary nor sufficient for Ig heavy chain poly(A) site switching. Our data do not support a model in which increased CstF-64 was postulated to be the underlying mechanism for the switch in Ig poly(A) site use in B cell development (36). This model was based on transfection of a 10-fold excess of CstF-64 cDNA into growing chicken B cells that resulted in a shift to Ig sec poly(A) site usage. Normal proliferation in CD40 ligand treated human B cells increases CstF-64 5-fold but probably also induces other changes to balance or offset it, so no shift to Ig sec poly(A) sites occurs. In contrast, the addition of IL-10 along with CD40 ligand in primary B cells or IL-6 in a B cell line exert shifts in poly(A) site choice in the absence of an increase in CstF-64. Our results therefore lead to the conclusion that differentiation-induced changes, mediated by lymphokines, are responsible for the switch in Ig heavy chain poly(A) site use. Such changes leading to secretory Ig mRNA production could include subtle alterations of the balance of basal polyadenylation/cleavage and splicing factors or the induction of new proteins. Plasma B cell differentiation was accompanied by an increase in the number of proteins cross-linked to RNA (44), increased polyadenylation complex stability (45) and increased binding activity of CstF-64 and CPSF-100 with no change in their amounts (46, 47). B cells have a complement of transcription factors acting on the heavy chain enhancer and TFIID (reviewed in ref. 48). The recent observations linking polyadenylation factors and transcription, especially the interactions of TFIID and CPSF (49), suggest that the control of poly(A) site choice in the Ig gene also might involve changes in the transcription complex as well as the cleavage/polyadenylation reaction itself. Understanding what changes or factors that lymphokines induce and how those might interact with the basal polyadenylation/cleavage machinery will be important for deciphering the later stages of B cell differentiation.
Acknowledgments
We thank Drs. Steven L. Phillips, Justus Cohen, and K. Veraldi for useful comments on the manuscript. This work was supported by U.S. Public Health Service Grants GM50145 and P60-AR44811 to C.M. and CA74329 to M.T.L.
ABBREVIATIONS
- CstF-64
64 kDa subunit of the cleavage stimulatory factor CstF
- IL
interleukin
- SAC
Staphylococcus aureus Cowan strain protein A
- CPSF
cleavage/polyadenylation specificity factor
- GAPDH
glyceraldehyde-3-phosphate dehydrogenase
- RT
reverse transcriptase
- sec
secretory-specific
- mb
membrane-specific
References
- 1.Coleman M S, Hutton J J, Bollum F J. Nature (London) 1974;248:407–409. doi: 10.1038/248407a0. [DOI] [PubMed] [Google Scholar]
- 2.Edmonds M. Enzymes. 1982;15:217–244. [Google Scholar]
- 3.Hauser H, Knippers R, Schafer K P. Exp Cell Res. 1978;111:175–184. doi: 10.1016/0014-4827(78)90247-1. [DOI] [PubMed] [Google Scholar]
- 4.Johnson L F, Abelson H T, Green H, Penman S. Cell. 1974;1:95–100. [Google Scholar]
- 5.Benz E W, Getz M J, Wells D J, Moses H L. Exp Cell Res. 1977;108:157–165. [PubMed] [Google Scholar]
- 6.Getz M J, Elder P K, Benz E W, Stephenson E, Moses H L. Cell. 1976;7:255. doi: 10.1016/0092-8674(76)90025-8. [DOI] [PubMed] [Google Scholar]
- 7.Edwalds-Gilbert G, Veraldi K L, Milcarek C. Nucleic Acids Res. 1997;25:2547–2561. doi: 10.1093/nar/25.13.2547. [DOI] [PMC free article] [PubMed] [Google Scholar]
- 8.Colgan D F, Murthy K G K, Prives C, Manley J L. Nature (London) 1996;384:282–285. doi: 10.1038/384282a0. [DOI] [PubMed] [Google Scholar]
- 9.Colgan D F, Manley J L. Genes Dev. 1997;11:2755–2766. doi: 10.1101/gad.11.21.2755. [DOI] [PubMed] [Google Scholar]
- 10.Bienroth S, Wahle E, Suter-Crazzolara C, Keller W. J Biol Chem. 1991;266:19768–19776. [PubMed] [Google Scholar]
- 11.Murthy K, Manley J. J Biol Chem. 1992;267:14804–14811. [PubMed] [Google Scholar]
- 12.Takagaki Y, Manley J L, MacDonald C C, Wilusz J, Shenk T. Genes Dev. 1990;4:2112–2120. doi: 10.1101/gad.4.12a.2112. [DOI] [PubMed] [Google Scholar]
- 13.Beyer K, Dandekar T, Keller W. J Biol Chem. 1997;272:26769–26779. doi: 10.1074/jbc.272.42.26769. [DOI] [PubMed] [Google Scholar]
- 14.Takagaki Y, Manley J L. Mol Cell Biol. 1997;17:3907–3914. doi: 10.1128/mcb.17.7.3907. [DOI] [PMC free article] [PubMed] [Google Scholar]
- 15.Wilusz J, Shenk T. Cell. 1988;52:221–228. doi: 10.1016/0092-8674(88)90510-7. [DOI] [PubMed] [Google Scholar]
- 16.Ruegsegger U, Beyer K, Keller W. J Biol Chem. 1996;271:6107–6113. doi: 10.1074/jbc.271.11.6107. [DOI] [PubMed] [Google Scholar]
- 17.Ruegsegger U, Blank D, Keller W. Mol Cell. 1998;1:243–253. doi: 10.1016/s1097-2765(00)80025-8. [DOI] [PubMed] [Google Scholar]
- 18.Kessler M M, Henry M F, Shen E, Zhao J, Gross S, Silver P A, Moore C L. Genes Dev. 1997;11:2545–2556. doi: 10.1101/gad.11.19.2545. [DOI] [PMC free article] [PubMed] [Google Scholar]
- 19.Preker P J, Lingner J, Minvielle-Sebastia L, Keller W. Cell. 1995;81:379–389. doi: 10.1016/0092-8674(95)90391-7. [DOI] [PubMed] [Google Scholar]
- 20.Lutz C, Murthy K, Schek N, O’Conner J, Manley J, Alwine J. Genes Dev. 1996;10:325–337. doi: 10.1101/gad.10.3.325. [DOI] [PubMed] [Google Scholar]
- 21.Gunderson S, Beyer K, Martin G, Keller W, Boelens W, Mattaj I. Cell. 1994;76:531–541. doi: 10.1016/0092-8674(94)90116-3. [DOI] [PubMed] [Google Scholar]
- 22.Galli G, Guise J W, McDevitt M A, Tucker P W, Nevins J R. Genes Dev. 1987;1:471–481. doi: 10.1101/gad.1.5.471. [DOI] [PubMed] [Google Scholar]
- 23.Lassman C R, Milcarek C. J Immunol. 1992;148:2578–2585. [PubMed] [Google Scholar]
- 24.Lassman C R, Matis S, Hall B L, Toppmeyer D L, Milcarek C. J Immunol. 1992;148:1251–1260. [PubMed] [Google Scholar]
- 25.Matis S A, Martincic K, Milcarek C. Nucleic Acids Res. 1996;24:4684–4692. doi: 10.1093/nar/24.23.4684. [DOI] [PMC free article] [PubMed] [Google Scholar]
- 26.Milcarek C, Hall B. Mol Cell Biol. 1985;5(10):2514–2520. doi: 10.1128/mcb.5.10.2514. [DOI] [PMC free article] [PubMed] [Google Scholar]
- 27.Peterson M L, Perry R P. Proc Natl Acad Sci USA. 1986;83:8883–8887. doi: 10.1073/pnas.83.23.8883. [DOI] [PMC free article] [PubMed] [Google Scholar]
- 28.Peterson M. Mol Cell Biol. 1994;14:7891–7898. doi: 10.1128/mcb.14.12.7891. [DOI] [PMC free article] [PubMed] [Google Scholar]
- 29.Tsurushita N, Avdalovic N M, Korn L J. Nucleic Acids Res. 1987;15:4603–4615. doi: 10.1093/nar/15.11.4603. [DOI] [PMC free article] [PubMed] [Google Scholar]
- 30.Seipelt R L, Spear B T, Snow E C, Peterson M L. Mol Cell Biol. 1998;18:1042–1048. doi: 10.1128/mcb.18.2.1042. [DOI] [PMC free article] [PubMed] [Google Scholar]
- 31.Jenh C-H, Geyer P K, Johnson L F. Mol Cell Biol. 1985;5:2527–2532. doi: 10.1128/mcb.5.10.2527. [DOI] [PMC free article] [PubMed] [Google Scholar]
- 32.Harlow E, Lane D. Antibodies: A Laboratory Manual. Plainview, NY: Cold Spring Harbor Lab. Press; 1988. [Google Scholar]
- 33.Takagaki Y, Manley J L. J Biol Chem. 1992;267:23471–23474. [PubMed] [Google Scholar]
- 34.Takagaki Y, Manley J. Nature(London) 1994;372:471–474. doi: 10.1038/372471a0. [DOI] [PubMed] [Google Scholar]
- 35.He H, Hershberger P A, McCarthy S A. J Immunol. 1998;161:1169–1175. [PubMed] [Google Scholar]
- 36.Takagaki Y, Seipelt R L, Peterson M L, Manley J L. Cell. 1996;87:941–952. doi: 10.1016/s0092-8674(00)82000-0. [DOI] [PubMed] [Google Scholar]
- 37.Aagaard-Tillery K M, Jelinek D F. J Immunol. 1996;156:4543–4554. [PubMed] [Google Scholar]
- 38.Banchereau J, Rousset F. Adv Immunol. 1992;52:125–262. doi: 10.1016/s0065-2776(08)60876-7. [DOI] [PubMed] [Google Scholar]
- 39.Jelinek D F, Braten J K. J Immunol. 1995;154:1606–1613. [PubMed] [Google Scholar]
- 40.Hirohata S, Yamada A, Inoue T. J Neurosci. 1985;67:115–118. doi: 10.1016/0022-510x(85)90027-9. [DOI] [PubMed] [Google Scholar]
- 41.Kikutani H, Taga T, Akira S, Kishi H, Miki Y, Saiki O, Yamamura Y, Kishimoto T. J Immunol. 1985;134:990–995. [PubMed] [Google Scholar]
- 42.Saiki O, Ralph P. Eur J Immunol. 1983;13:31–34. doi: 10.1002/eji.1830130108. [DOI] [PubMed] [Google Scholar]
- 43.Michalopoulos G K, DeFrances M C. Science. 1997;276:60–66. doi: 10.1126/science.276.5309.60. [DOI] [PubMed] [Google Scholar]
- 44.Phillips C, Schimpl A, Dietrich-Goetz W, Clements J B, Virtanen A. Eur J Immunol. 1996;26:3144–3152. doi: 10.1002/eji.1830261247. [DOI] [PubMed] [Google Scholar]
- 45.Yan D-H, Weiss E, Nevins J. Mol Cell Biol. 1995;15:1901–1906. doi: 10.1128/mcb.15.4.1901. [DOI] [PMC free article] [PubMed] [Google Scholar]
- 46.Edwalds-Gilbert G, Milcarek C. Mol Cell Biol. 1995;15:6420–6429. doi: 10.1128/mcb.15.11.6420. [DOI] [PMC free article] [PubMed] [Google Scholar]
- 47.Edwalds-Gilbert G, Milcarek C. Nucleic Acids Symposium Series. 1995;33:229–233. [PubMed] [Google Scholar]
- 48.Henderson A, Calame K. Annu Rev Immunol. 1998;16:163–200. doi: 10.1146/annurev.immunol.16.1.163. [DOI] [PubMed] [Google Scholar]
- 49.Dantonel J-C, Murthy K G K, Manley J L, Tora L. Nature (London) 1997;389:399–402. doi: 10.1038/38763. [DOI] [PubMed] [Google Scholar]


