

Abstract
This study investigates methods of manipulating the brain extracellular matrix (ECM) to enhance the penetration of nanoparticle drug carriers in convection-enhanced delivery (CED). A probe was fabricated with two independent microfluidic channels to infuse, either simultaneously or sequentially, nanoparticles and ECM-modifying agents. Infusions were performed in the striatum of the normal rat brain. Monodisperse polystyrene particles with a diameter of 54 nm were used as a model nanoparticle system. Because the size of these particles is comparable to the effective pore size of the ECM, their transport may be significantly hindered compared with the transport of low molecular weight molecules. To enhance the transport of the infused nanoparticles, we attempted to increase the effective pore size of the ECM by two methods: dilating the extracellular space and degrading selected constituents of the ECM. Two methods of dilating the extracellular space were investigated: co-infusion of nanoparticles and a hyperosmolar solution of mannitol, and pre-infusion of an isotonic buffer solution followed by infusion of nanoparticles. These treatments resulted in an increase in the nanoparticle distribution volume of 50% and 123%, respectively. To degrade hyaluronan, a primary structural component of the brain ECM, a pre-infusion of hyaluronidase (20,000 U/mL) was followed after 30 min by infusion of nanoparticles. This treatment resulted in an increase in the nanoparticle distribution of 64%. Our results suggest that both dilation and enzymatic digestion can be incorporated into CED protocols to enhance nanoparticle penetration.
Keywords: microfluidics, nanoparticle, mannitol, hyaluronidase, dilation, convection-enhanced delivery
1. Introduction
Many promising treatments for brain diseases involve nanoparticles as drug or gene carriers. However, the blood-brain barrier prevents most particles from crossing from the vasculature into the brain. Therefore, alternative strategies have been developed for delivering nanoparticles to affected brain tissue. Intracranial infusion, or convection-enhanced delivery (CED), has been used to deliver low molecular weight molecules [2, 25, 1], proteins [24, 23, 26], and several kinds of particles, including liposomes [28, 42, 43, 19, 44, 36] and polymeric nanoparticles [6]. Although small molecules and some proteins can be distributed throughout the brain with CED, it has proven difficult to distribute nanoparticles over comparable distances. As a result, the volume distribution of nanoparticles is usually smaller than the volume distribution of molecules infused under identical conditions. Therefore, strategies that enhance nanoparticle transport in CED could help fulfill the therapeutic potential of nanoparticle drug carriers.
Previous studies have shown that the distribution of nanoparticles such as liposomes and polymeric particles in CED depends on the particle size and surface charge [6,27]. Nanoparticles used in CED often are comparable in size to the effective pore size of the extracellular matrix (ECM), which has been estimated as about 50 nm [48]. As a result, it is likely that ECM components physically restrict the motion of nanoparticles in convection through the extracellular space. For example, a study involving two sizes of liposomes showed that 40 nm liposomes were transported through the striatum of rats [28], but 90 nm liposomes were confined to regions near the infusion point. Studies also show that the transport of nanoparticles bearing cationic surface charge is limited, presumably because the nanoparticles bind to ECM constituents and to cell membranes. Modifying the surface charge can mitigate adverse electrostatic effects and enhance particle transport. For example, shielding the surfaces of liposomes with a steric coating or negative charge [27] reduces liposome binding and enhances liposome transport. Similarly, coating polystyrene nanoparticles with bovine serum albumin (BSA) enhances their penetration [6]. However, even when particles have had their surfaces modified, their transport through brain parenchyma can still be limited by size. Surface-modified liposomes larger than 200 nm do not significantly penetrate tissue, and the distribution volume of 200 nm polystyrene particles is about half that of 40 nm particles, even when they are coated to shield their surface charge [27].
CED has also been used to infuse drug-carrying nanoparticles directly into tumors [42, 36]. However, tumors can overexpress ECM proteins such as hyaluronan [10, 9], which can reduce the effective pore size and restrict nanoparticle transport in the tumor extracellular space.
Since the distribution of liposomes and polystyrene particles depends on particle size compared with the ECM pore size, it may be possible to enhance particle transport by increasing the effective pore size of the ECM. One method of increasing the effective pore size is to degrade enzymatically ECM constituents that determine the effective pore size. This has been done to enhance the transport of macromolecules in tumors. For example, Netti and colleagues reported a 100% increase in the diffusivity of IgG following collagenase treatment of xenografted tumors [32]. Similarly, collagenase treatments enhanced penetration of IgG by convection into ovarian carcinomas, although hyaluronidase treatments had no effect in that case [8]. However, we are unaware of any reports showing enhancement of nanoparticle transport by CED with enzymatic degradation of the ECM.
A second method of increasing the effective pore size is to exploit the poroelasticity of healthy brain tissue [33] and tumors [55] by dilating the extracellular space. Infusing a hyperosmolar solution into the extracellular space produces a water flux out of surrounding blood vessels [40] and brain cells [22], which increases the porosity of the ECM. For example, administering 500 mosmol/kg buffer increased the porosity of rat brain slices from 0.24 to 0.42 by driving water from the intracellular space to the extracellular space [22]. In CED infusions of 40 nm liposomes into normal rat striatum, the liposomes penetrated about 50% farther into tissue when they were suspended in 25% mannitol compared with when they were suspended in an isotonic solution [28]. Furthermore, osmotically-induced dilation has been used to enhance the distribution and gene expression in bolus injections of AAV vectors in animal models for Alzheimer's disease [35] and Sandhoff disease [3]. Even in the absence of an osmotic driving force, the elevated hydraulic pressure in the ECM associated with CED infusion may dilate tissue in the vicinity of the infusion, which may, in turn, enhance the distribution of infused nanoparticles.
The purpose of this study is to evaluate and compare osmotic and hydraulic dilation and enzymatic degradation of the brain ECM as means of enhancing the penetration of polystyrene nanoparticles in the normal rat brain. A two-channel microfluidic probe was fabricated to deliver two separate solutions at the same infusion site in the brain. Two pretreatment methods were considered: 1) enzymatic degradation of the ECM using hyaluronidase, and 2) hydraulic dilation by pre-infusion of an isotonic buffer. In these studies, one channel of the probe delivered the pretreatment solution and the other channel delivered the nanoparticles. These pretreatment methods were compared with osmotically-induced dilation which was achieved by co-infusion of nanoparticles with a hyperosmolar solution of mannitol. In these studies, both the nanoparticles and mannitol solution were delivered through a single channel of the probe. We observed an increase in nanoparticle penetration for all three treatments, with hydraulic dilation yielding the greatest effect over the time of the experiment.
2. Results
2.1 Dual channel microfluidic probe and infusion protocols
The probe used in this study has three main parts: 1) a 6 mm long shank with a cross-sectional area of 100 × 100 μm and a tapered tip for inserting the shank into tissue; 2) a 5 × 5 mm base with a hole in the middle for fastening the device to a custom-built holder; and 3) two protrusions with cross-sectional areas of 70 × 100 μm for connecting the probe to polyimide tubing. Figure 1a shows an electron micrograph of the probe shank. Two adjacent parylene channels, each with a cross-sectional area of 10 × 25 μm, can be seen on the top of the shank. Figure 1b shows the probe mounted on its holder and the external tubing that supplies fluids to the channel inlets.
Figure 1.
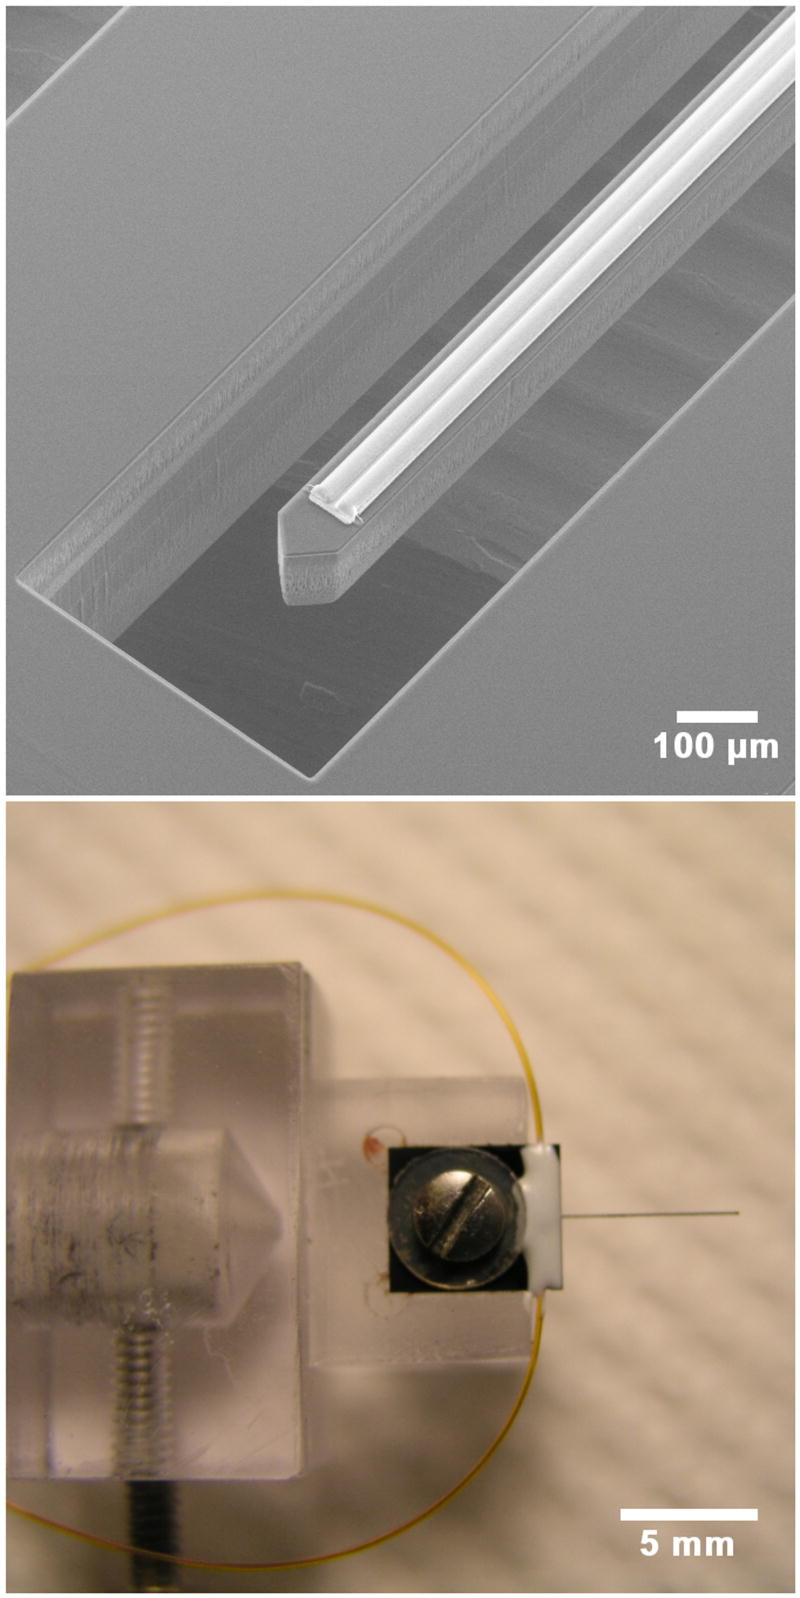
Upper: An electron micrograph of the probe showing the silicon shank and two parallel channels on top of the shank. The outlets of the channels are 0.5 mm from the shank tip. Lower: The probe is shown fixed to a custom holder by a screw and washer. Two small-bore polyimide tubes can be seen outside the holder. Each tube delivers fluid to a channel on the probe.
Table 1 lists the infusions that were performed in this study to compare nanoparticle transport in normal and treated ECM of the rat striatum. Preliminary studies described in section 2.5 showed that significant enzymatic degradation took about 30 min for the hyaluronidase concentrations used in this study. Therefore, after infusing hyaluronidase, we waited 30 min before infusing the nanoparticle suspensions. The same procedure was followed for the hydraulic dilation, except PBS was substituted for the enzyme. The hyperosmolar mannitol solution is thought to dilate the ECM by driving water from the vasculature and cells into to the ECM. Previous investigators who used mannitol to dilate the ECM co-infused the mannitol with particles; to compare our results with previous studies, we followed the same procedure.
Table 1.
The infusion sequences for the four animal groups. Phosphate buffered saline (PBS), polystyrene nanoparticle (PSNP), bovine serum albumin (BSA).
| Animal group | Sequence of infusions |
|---|---|
| Control | PSNP in 1% BSA (total volume = 5 μl) infused at 0.75 μl/min through channel 1 of the probe |
| Osmotic dilation | PSNP in 25% mannitol (total volume = 5 μl) infused at 0.75 μl/min through channel 1 of the probe |
| Hydraulic dilation | 5 μl of PBS infused at 0.75 μl/min through channel 1 of the probe;
30 min wait; PSNP in 1% BSA (total volume = 5 μl) infused at 0.75 μl/min through channel 2 of the probe |
| Enzymatic degradation | 5 μl of hyaluronidase infused at 0.75 μl/min through channel 1 of the probe;
30 min wait; PSNP in 1% BSA (total volume = 5 μl) infused at 0.75 μl/min through channel 2 of the probe |
Nanoparticle size, charge, and osmolarity
The measured diameter of the nanoparticles as received was 36.0±0.4 nm and the measured zeta potential was -33.4±2.2 mV. It is unknown whether the discrepancy between the supplier's quoted size (24 nm) and the measured size was due to aggregation or manufacturer error. To reduce aggregation, particle suspensions were sonicated in a water bath for 10 min and vortexed prior to sizing or infusion into animals. Incubation with BSA increased the diameter to 53.6±0.4 nm and decreased the zeta potential to -5.6±1.5 mV. The 18 nm increase in diameter agrees well with the reported hydrodynamic diameter of BSA (7.2 nm) [17]. Table 2 shows the osmolarity for all four infused solutions. The osmolarity of the hyaluronidase solution (20,000 U/ml) was slightly greater than that of PBS. The osmolarity of the 25% mannitol was over five times greater than that of PBS.
Table 2.
The osmolarity of the four solutions infused into the striatum as determined in a vapor pressure osmometer. Each value is reported as an average and standard deviation from three measurements. Phosphate buffered saline (PBS), polystyrene nanoparticle (PSNP), bovine serum albumin (BSA)
| Infusion Solution | Osmolarity (mosmol/kg) |
|---|---|
| PBS | 303±17 |
| 20 nm PSNP in 1% BSA | 320±2 |
| 20,000 U/ml hyaluronidase | 374±2 |
| 25% mannitol | 1568 ±12 |
2.3 Nanoparticle distribution volume
Following infusion of fluorescently labeled nanoparticles, the brain was harvested, flash frozen, sliced and imaged. The fluorescent image of each slice was converted into a binary image (Figure 2) which was then used to calculate the distribution area and volume of the nanoparticles
Figure 2.

Left: Nanoparticle distribution was determined by capturing a fluorescent image of the right hemisphere of the brain. Right: The fluorescent images were converted into binary images with a threshold operation. Pixels exhibiting at least 10% the maximum fluorescence were included in calculating the nanoparticle distribution. The distribution volume in gray matter was calculated separately (area within the box) and compared to the total distribution volume. Infusions where the volume of nanoparticles exceeded 10% in the white matter were rejected from analysis so that the total distribution volume would not be biased by poor insertions of the microfluidic probe.
Figure 3 shows typical distributions of fluorescent particles for the different treatments described in the Experimental Procedure section: nanoparticle infusion without mannitol or any pre-treatment, i.e., the control; nanoparticle and 25% mannitol co-infusion; nanoparticle infusion after enzymatic pre-treatment; and nanoparticle infusion after pre-infusion of PBS. The images for all infusion conditions have a spongiform appearance with small ovoid regions that appear to partially exclude nanoparticles (Figure 3). Although it is difficult to see from the image, the fluorescence intensity within the holes is non-zero and, indeed, exceeds 10% the minimum fluorescent signal, which was our criterion for including the area in our calculation of the nanoparticle distributions. Similar exclusionary spots were seen in fluorescent images of lipsomes infused by CED [27]. The excluded regions may reflect local tissue heterogeneities or small tissue structures whose permeability to nanoparticles differs from that of the surrounding extracellular space. An example of such structures could be striosomes, which are a neurochemically distinct compartment in the striatum [11,15]. Striosomes have different electrophysiology [54] and metabolic activity [4] than the surrounding matrix. However, the authors are unaware of permeability measurements within striosomes.
Figure 3.

Representative distributions of fluorescently-labeled polystyrene nanoparticles in the striatum of the normal rat. A suspension of nanoparticles was infused at a flow rate 0.75 μL/min for a total volume 5 μL. Control: Infusion into normal tissue without any pretreatment or co-infusion. Mannitol: Co-infusion of nanoparticles in 25% mannitol into normal tissue. Enzyme: Infusion of nanoparticles into normal tissue 30 min after an infusion of hyaluronidase (20,000 U/ml). PBS: Infusion of nanoparticles into normal tissue 30 minutes after an infusion of 5 μL of PBS.
Figure 4 shows the average distribution volume of nanoparticles for each protocol. Significant differences (p=0.0035, Kruskal-Wallis ANOVA) in distribution volumes were found among the four groups: control (n=7), mannitol (n=3), enzyme (n=3), and PBS (n=4). All treatments resulted in a significant (p<0.05 for mannitol and enzyme treatments, p<0.01 for PBS treatment) increase in nanoparticle distribution volume compared with the control. Co-infusion with mannitol increased the distribution volume by 50%, while enzymatic and PBS pre-treatments increased the distribution volume by 64% and 123%, respectively.
Figure 4.

The distribution volume (Vd) of 5 μL of BSA coated polystyrene nanoparticles for each treatment represented as the mean, standard deviation, and p-values less than 0.05 (*) or 0.01 (**). Significant difference (p=0.0035, Kruskal-Wallis ANOVA) in distribution volume was found among the four groups; Control (n=7, 5 μL of nanoparticles in PBS), Mannitol (n=3, 5 μL of nanoparticles in 25% mannitol), Enzyme (n=3, 30 min digestion by 20,000 U/ml of hyaluronidase prior to nanoparticle infusion), PBS (n=4, 5 μL of PBS infused 30 min prior to nanoparticle infusion).
Data sets for two animals were omitted from the analysis, one in the enzyme group and one in the mannitol group, because the degree of backflow, as defined in the Experimental Procedure section, was greater than 10%. The degree of backflow was 26% in the animal from the enzyme group and 33% from the control group. The total volumes of distribution in the rejected animals were 3.24 mm3 and 3.77 mm3 for the enzyme and control animals, respectively. For both animals, the volume of distribution was greater than their respective group averages reported in Figure 4; including data for these animals would have shifted the analysis toward greater significance in the difference between groups.
Figure 5 represents the three-dimensional shape of the distribution volume. It shows the area of fluorescence in each slice as a function of the anterior-posterior (AP) distance, defined here as the distance between the slice and the slice containing the infusion point. Each point represents the area of the slice averaged over all animals in the treatment group. Not surprisingly, the maximum area of penetration occurs in slices near the infusion point, and the penetration area decreases as the distance from the infusion site increases in both directions.
Figure 5.

The area of fluorescence in each slice as a function of the AP distance in the region ±1.5 mm from the infusion site for each treatment; (+) untreated tissue, (▪) mannitol co-infusion into untreated tissue, (○) enzyme degraded tissue, and (▲) tissue dilated by pre-infusion PBS. Each symbol is the average area of fluorescence for each treatment at given position.
2.4 Control infusions and osmotic dilation of the extracellular matrix
Infusion of polystyrene nanoparticles in isotonic PBS (303 mOsm), which served as a control, yielded a distribution volume of 1.76 ± 0.50 mm3. The fluorescent signal shown in Figure 3A was intense, but it was concentrated within a few hundred micrometers of the infusion site. Infusion of the same concentration of polystyrene nanoparticles in hyperosmolar mannitol (1568 mOsm) yielded a distribution volume of 2.65 ± 0.33 mm3, which is a significant increase (p=0.017) compared with the control. Figure 5 shows that the penetration areas in slices near the infusion site were more than two times greater for the mannitol treatment compared with the control. The distribution was roughly symmetric about the infusion site for both the control and mannitol groups.
2.5 Enzymatic degradation and hydraulic dilation of the extracellular matrix
We attempted to optimize enzymatic degradation of hyaluronan with hyaluronidase by considering three concentrations (1000, 10,000, and 20,000 U/ml) and two digestion times (30 min and 60 min). Figure 6 is a representative example of the hyaluronan distribution in the untreated (panel A) and degraded striatum (panel B: 30 min, 20,000 U/mL hyaluronidase). We found that digestion time (p=0.022), but not enzyme concentration (p=0.23), affected the extent of degradation for the ranges of variables considered in this experiment. The difference between digestion times was modest; there was 59% degradation after 30 min, and 66% degradation after 60 min for 20,000 U/ml hyaluronidase. These results led us to choose the 30 min digestion time with 20,000 U/ml hyaluronidase. The nanoparticle volume distribution for enzymatic degradation under these conditions was 2.90 ± 0.19 mm3, which is a significant (p=0.017) increase compared with the control. The distribution of nanoparticles was symmetrical in the anterior-posterior (AP) direction (Figure 5) for the enzymatic treatment.
Figure 6.

In the enzyme treatment group, hyaluronidase is infused 30 min prior to nanoparticle infusion to allow for degradation of the ECM. The effect of the enzyme treatment was determined by comparing (A) the distribution of hyaluronan in the untreated striatum to (B) the distribution of hyaluronan following a 30 min digestion with 20,000 U/mL of hyaluronidase. The absence of fluorescence indicates regions where hyaluronan has been degraded.
Hydraulic dilation by pretreatment with 5 μL of PBS prior to nanoparticle infusion yielded a distribution volume of 3.93 ± 0.42 mm3, which was more than twice as large as the distribution volume for the control group (p=0.006). In all four animals there was an asymmetric distribution of particles in the AP direction. Figure 5 shows that nanoparticle transport was more favorable in the posterior direction after hydraulic dilation. The effect of the hydraulic dilation on the penetration area extended over greater distances from the infusion point compared with other treatments. For example, at a distance ± 1 mm from the infusion site, the nanoparticle penetration areas were 0.82 mm2 and 1.33 mm2 for the PBS treatment, whereas the penetration areas at ± 1 mm were 0.47 mm2 and 0.41 mm2 for the control.
To obtain additional information about the shape of the distribution volume for the various protocols, the data in Figure 5 were redrawn in Figure 7 as a function of the square of the AP distance, i.e. the distance between the slice and slice containing the infusion point. If the shape of the distribution volume were that of a body of revolution with its major axis in the AP direction and passing through the centers of the slices, then the data in Figure 7 should fall on a straight line. In this case the slope of the line would have magnitude π(b/a)2, where a and b are the lengths of the major and minor axes, respectively, of the body of revolution. The special case b/a = 1 corresponds to a spherical distribution volume, which would result if the infusion of nanoparticles were isotropic about the probe outlet. For reference, a line segment whose slope has a magnitude of π is drawn in Figure 7. The data for the control, mannitol and enzyme treatments approximate straight lines with slopes close to π, but only in the vicinity of the infusion point. This suggests that the distribution volume is spherical for these groups close to the probe, but that it deviates from sphericity away from the probe. The spherical part of the distribution persists farther from the infusion point for the enzyme group than it does for the mannitol group. The spherical part of the distribution is smallest for the control group, which has a spherical distribution only for the first five or six slices adjacent to the infusion point. For all of the data groups, the magnitude of the slope diminishes with increasing distance from the infusion point. This indicates preferential transport of the nanoparticles in the AP direction, i.e. orthogonal to the slices.
Figure 7.

The area of each slice plotted as a function of the square of the AP; (+) untreated tissue, (▪) mannitol co-infusion into untreated tissue, (○) enzyme degraded tissue, and (▲) tissue dilated by pre-infusion PBS. Each symbol is the average area for each treatment at the given position. A line segment with a slope magnitude of π is drawn for reference. Data that fall on a line with slope of π or -π indicate regions where the infusion of nanoparticles is locally isotropic. Deviations from the slope indicate an anisotropic volume distribution.
3. Discussion
Previous studies of CED of nanoparticles have examined the role of size and surface properties on penetration. In this study, we consider methods for altering the ECM to enhance nanoparticle transport using a novel two-channel microfluidic probe. We compared distribution volumes of BSA-coated polystyrene nanoparticles in the striatum of normal rats for three different treatments. Two of the treatments, mannitol co-infusion and pre-infusion with a PBS solution, presumably rely on dilating the extracellular space to increase the effective pore size of the ECM. The other treatment, enzymatic degradation, relies on selectively digesting an ECM constituent to provide a less tortuous path for nanoparticle transport. All three treatments enhanced the distribution of nanoparticles compared with the control, which suggests that each treatment may be of benefit when incorporated into a CED protocol.
The effect of osmotic dilation on the distribution of polystyrene nanoparticles is similar to results reported previously for liposomes. When 40 nm liposomes were infused by CED into the normal rat brain, the liposome distribution volume was increased by more than 50% by suspending the liposomes in a hyperosmolar solution [28]. We observed a 51% increase in the nanoparticle distribution volume for 54 nm polystyrene particles infused in hyperosmolar mannitol (1568 mOsm) under similar infusion conditions. In contrast, earlier studies showed that the distribution volumes of macromolecules that are much smaller than the particles considered here are not enhanced by hyperosmolar treatments. For example, the distribution volume of a 20 kDa dextran was unchanged when it was co-infused with 20% mannitol [45]. Similarly, the penetration of infused BSA was not affected by changing the infusion osmolarity over the range of 145-450 mOsm [6]. Chen et al. conclude that because the BSA penetration was unchanged over this range of osmolarity, the same holds for polystyrene nanoparticles. However, this assumes that the transport of the 69 kDa protein with a hydraulic radius of 7.2 nm is comparable to polymeric nanoparticles with much lager radii. Theories of hindered transport in porous media suggest that the mobility of a freely suspended particle decreases as the ratio of particle size to effective pore size increases [37, 16, 18]. The present results for nanoparticles and previous results for liposomes indicate that the ECM significantly hinders transport of these particles, and that particle transport can be enhanced by osmotic dilation of the ECM.
Pre-infusing the tissue with an isotonic solution such as PBS can also dilate the ECM and enhance nanoparticle transport, and this method led to the largest increase in the nanoparticle distribution volume in this study. However, comparing results for PBS pre-infusion and mannitol co-infusion is difficult because of differences between the two protocols. The mannitol co-infusion consisted of infusing a 5 μL suspension of nanoparticles in a hyperosmolar solution over 7 minutes. The PBS pretreatment involved infusing 5 μL of an isotonic solution, waiting 30 min, and then infusing a 5 μL suspension of nanoparticles in an isotonic solution. If the extent of ECM dilation is sensitive to the total volume infused or to the characteristic times of the infusions, or both, then the two protocols cannot be compared unambiguously.
Some CED experiments involve infusions of nanoparticles suspensions over much longer time scales than the infusion time in this experiment. For example, viral vectors [1] and liposomes [2] have been infused for 30 to 60 min. If particle transport is hindered at the start of the infusion, the percolation of fluid throughout the parenchyma may act to dilate the ECM, increase the effective pore size, and increase the mobility of the infused particles over time. This may reconcile experiments showing that the effective pore size for normal gray matter is between 38 and 64 nm [48] with experiments showing that viral vectors and liposomes comparable to or larger than the estimated pore size can penetrate several millimeters in animal tumor models [1, 2] for sufficiently long infusion times.
Degradation of hyaluronan by hyaluronidase resulted in a 58% increase in distribution volume of nanoparticles. Further enhancement may be possible with longer digestion times. However, complete digestion of hyaluronan was reported within three hours at a hyaluronidase concentration of 1 U/mL [49], which is much smaller than the concentration in this experiment.
An alternative approach to pretreating tissues with enzymes is to immobilize enzymes to the surfaces of nanoparticles. Superparamagnetic nanoparticles with collagenase on their surfaces migrated through collagen gels at speeds of up to 90 μm/hr under the influence of a magnetic field [21].
The treatments to enhance particle penetration had effects of comparable magnitudes on the distribution volumes of infused nanoparticles in this experiment. The optimal choice among the treatments may depend on the overall time of the infusion protocol. For example, clinical trials of CED of therapeutic proteins often involve infusion protocols that last several days [53]; in some cases multiple infusions are separated by more than a week [13]. For these longer protocols, enzymatic degradation of the ECM may be a preferable strategy to enhance particle distribution, because the regeneration of hyaluronan takes up to 12 days [49]. However, the clinical and biological consequences of degrading brain ECM in humans are unknown and would require extensive investigation. Possible complications of enzymatic degradation of the ECM of tumors include promoting tumor metastasis. Gliomas are known to migrate by expressing proteases that degrade native ECM components and infiltrate healthy tissue [50]. However, systemically administered hyaluronidase has improved the outcome of standard chemotherapy [3] and boron neutron capture therapy for glioblastomas [14].
Pre-infusion with isotonic buffer enhanced the nanoparticle distribution volume to a greater extent than did pre-infusion with the same volume of buffer containing hyaluronidase in this experiment. This result suggests that the presence of the enzyme in the pre-infusion fluid may have reduced nanoparticle transport compared with pre-infusion of buffer alone. It may be possible that degradation of hyaluronan led to a collapse of the space between some cells. Sykova and colleagues reported that knockout mice lacking tenascin-C, a key structural element of the brain ECM, exhibit a decrease in both the porosity and tortuosity [47]. It is possible that hyaluronan degradation reduced physical barriers to transport, but a simultaneous decrease in the porosity may have resulted in “lakes” at the interstices of some cells. These “lakes” resemble dead end pores or isolated fluid volumes that could trap or exclude nanoparticles upon changes in cell shape [22, 5].
Clinicians have emphasized a need for better delivery devices for CED protocols [51, 39]. Most delivery devices are modified catheters or small tubing with a single end-port. These devices can lead to reflux, or backflow, along the outside of the catheter and unpredictable drug distributions [39]. The amount of reflux decreases as the diameter of the device is made smaller [29, 7]. In a previous study we showed that a microfabricated device with cross-sectional area of 100 μm × 100 μm mitigates backflow at relatively high flow rates [31]. A step-down catheter consisting of a fused silica (OD=168 μm) inside a 27-gauge needle also demonstrated enhanced performance over standard needles at high flow rates [20, 46].
Another useful feature in a fluid delivery system would be the capability to infuse from multiple ports along the length of the device. Attempts to infuse through catheters with multiple ports usually results in flow from only the most proximal port [39]. Here, we have demonstrated the capability to infuse solutions through two separate channels that can be controlled independently. This microfluidic platform can be easily extended to include several independently controlled channels with outlets distributed along the length of the device. Such devices could enhance the efficacy of CED protocols by allowing clinicians to turn specific channels on or off in response to drug distribution as determined by real-time imaging techniques such as positron emission tomography [1, 52] or magnetic resonance imaging [30]. Combining independent channels, spatially distributed outlets, and pretreatment strategies may provide clinicians with more options to help control the spatial distribution of infused therapeutics.
Polymeric nanoparticles have great potential for treating many brain diseases, but their transport is impeded by their size and surface properties. In this study we have examined the possibility of increasing the effective pore size of the ECM by dilation and enzymatic degradation of the brain. A novel microfluidic probe was developed which offers the potential for treatment protocols that would be difficult to achieve with simple needles.
We demonstrated the use of this microfluidic probe for the independent infusion of nanoparticles and agents that potentially enhance nanoparticle transport through the brain parenchyma. Our results suggest that both enzymatic treatment and dilation of the extracellular space significantly enhance the transport of polymeric nanoparticles.
4 Experimental Procedure
4.1 Microfluidic probe fabrication and experimental set-up
A two-channel microfluidic probe was fabricated using standard micromachining methods as previously reported [31]. Briefly, two parallel microfluidic channels were formed on a silicon substrate using a Parylene C structural layer (Specialty Coating Systems, Indianapolis, IN) and a sacrificial layer of photoresist (Shipley 1075, Phoenix, AZ). The probe geometry was defined by front-side and back-side deep reactive ion etching of the silicon substrate.
Figure 1 shows an electron micrograph of the probe and a photograph of the probe attached to its holder. The custom holder consisted of a 10 × 10 × 10 mm block of polycarbonate attached to a 6.4 mm diameter polycarbonate rod. The block contained a 5 × 5 × 0.5 mm milled recess. The probe was secured to the holder with a 0-80 stainless steel screw and a polycarbonate washer. Polyimide tubing (Small Parts Inc., Miami Lakes, FL) was glued over the silicon protrusions using two-part epoxy (Epoxy 907 Adhesive System, Miller-Stephenson, Danbury, CT). The other end of the polyimide tubing was attached to graduated micropipettes (not shown in figure). Each microfluidic channel, tubing, and micropipette assembly was backfilled by applying a 10 psi vacuum at the micropipette and immersing the probe tip into a beaker containing the solution to be infused. Infusions were carried out using a pressure injector (World Precision Instruments PM8000, Sarasota, FL) which applied a constant pressure at the inlet of the channel. Compressed high purity nitrogen was used as a pressure source. Flow rates through the devices were determined by measuring the speeds of liquid fronts in the micropipettes.
4.2 Surface modification of nanoparticles and osmolarity of infused solutions
Carboxylate-modified monodisperse polystyrene nanoparticles (FluoSpheres, Invitrogen, Carlsbad, CA) were used as a model system. The carboxylate-modified surface provides a highly charged and relatively hydrophilic particle compared with bare polystyrene. Non-specific binding was reduced by incubating a 0.02% solids solution of nanoparticles in 1% bovine serum albumin (BSA) in phosphate buffered saline (PBS) for four hours at room temperature. Proteins readily absorb to the surface of the polystyrene particles via hydrophobic interactions. Particle size was determined by static light scattering and particle zeta potential by mobility between charged parallel plates (ZetaPlus, Brookhaven Instruments Corp., Holtsville, NY). The results for size and zeta potential are reported as an average and standard error of ten measurements. For sizing, stock solutions of particles and BSA-coated particles were diluted to 1011 particles/mL. For brain infusions, nanoparticle solid concentration was held constant at 0.02% or about 1013 particles/mL. The osmolarities of the nanoparticle and enzyme solutions were measured in a Wescor 5500 vapor pressure osmometer (Wescor, Utah, USA).
4.3 In vivo nanoparticle infusions
Nanoparticle infusions were performed in the striatum of normal male Sprague-Dawley rats (270-305 g). All procedures were done in accordance with regulations of the Yale University Institutional Animal Care and Use Committee. Rats were anesthetized with ketamine (100 mg/kg)/xylyzine (10 mg/kg) solution via intraperitoneal injection. The head was shaved and disinfected with butadiene/alcohol/butadiene wipes. An incision was made and a 1.5 mm diameter hole was drilled in the skull 3 mm laterally from bregma in the right hemisphere. The probe was inserted to a depth of 5 mm at a rate of 1 mm/sec with the micromanipulator on a stereotactic frame. The tissue was allowed to equilibrate mechanically for 2 min. An upstream pressure of 7.5-15 psi was applied to produce flow rates of approximately 0.75 μL/min. We chose a flow rate comparable with previous studies of CED of liposomes [28, 2, 36] and viral vectors [34] into the rat brain. The infused volume was 5 μL. Higher pressures, up to 30 psi, were needed to infuse the more viscous 25% mannitol solution. Following infusion, probes were left in place for 2 min to allow any excess pressure to dissipate and prevent reflux up the insertion cavity.
Three treatments to enhance nanoparticle penetration were considered – enzymatic degradation, hydraulically induced dilation and osmotically induced dilation. There were seven animals in the control group (no treatment) and four animals in each treatment group. Enzymatic degradation of the ECM was performed by infusing 5 μL of 20,000 U/mL hyaluronidase (from bovine testes, Sigma H3506, St. Louis, MO) at 0.75 μL/min through one channel of the probe. After 30 min, nanoparticles were infused through the second channel at a flow rate of 0.75 μL/min. Hydraulically induced dilation was performed by following the same procedure as enzymatic degradation, except PBS replaced the hyaluronidase. The time between the PBS infusion and the nanoparticle infusion was 30 min. Osmotically induced dilation was performed by mixing nanoparticles in a 25% mannitol solution and infusing 5 μL of the mixture at a flow rate of 0.75 μL/min through a single channel.
4.4 Determination of nanoparticle distribution
The animals were immediately sacrificed by decapitation following probe removal, and the brains were removed and frozen on dry ice. The brains were sectioned into 50 μm slices on a cryostat from 1.5 mm anterior to 1.5 mm posterior from the infusion site (3 mm total). The distribution of nanoparticles in the slices was captured on a fluorescent stereoscope (Zeiss Lumar V.12, Carl Zeiss, Thornwood, NY) using a CY3 filter. The exposure time was optimized to achieve maximum dynamic range at the infusion site of one of the control animals without saturation of any pixels on a 12-bit CCD camera (AxioCam Mrc, Carl Zeiss, Thornwood, NY). This exposure time (200 msec) was used for all subsequent animals. The distribution volume of the nanoparticles was calculated using a custom Matlab 7.2 (MathWorks, Natick, MA) script, which generated a binary image from the greyscale images and calculated the area of particle penetration. The threshold for the binary operation was 10% of the maximum fluorescent intensity; pixel values from 6500-65025 were included in calculating the penetration area of each slice. Figure 3 shows an example of a fluorescent image and the corresponding binary image after applying the threshold. We performed no further manipulation of the image files after the threshold operation. The penetration volume was calculated by multiplying the penetration area in each slice by the slice thickness (50 μm) and summing the results over all slices.
Backflow of nanoparticles along the shaft of the probe and into the corpus callosum was observed in some animals. Backflow was seen occasionally in our previous studies involving microfluidic probes [31], and it was correlated with a slight misalignment of the probe as it was inserted into the brain. To quantify the extent of backflow in this study, we measured the extent of penetration in gray matter and compared it with the total extent of penetration . To find the penetration area of nanoparticles was manually copied and pasted into a separate image file using ImageJ software [41]. The volume of distribution in gray matter was then calculated from these image files using the Matlab script described above. We defined the degree of backflow as 1- . Data for any animal with a degree of backflow greater than 0.1, or 10%, were omitted from data analysis.
4.5 Histochemical assessment of hyaluronan degradation
The ECM was degraded in this study with the enzyme hyaluronidase, which targets hyaluronan, a key constituent of the ECM. To investigate the effect of enzyme concentration on the extent of degradation, 5 μL containing 1000, 10,000, and 20,000 U/mL hyaluronidase was infused into the striatum using the surgical procedure described above (n=3 for each enzyme concentration). After a specified waiting time, brains were harvested and post-fixed in 4% paraformaldehyde in PBS at 4 °C for 4 days. Results for two waiting times, 30 min and 60 min, which were chosen based on preliminary tests, were compared here. The tissue was cryoprotected in 30% sucrose for 3 days, frozen at -70 °C, and sectioned into 50 μm slices. Degradation of hyaluronan was identified by staining brain slices with hyaluronic acid binding protein (HABP). Tissue slices were immersed in biotinylated HABP (0.5 μg/μL, Calbiochem 385911) in PBS and left overnight on an orbital shaker. Slides were then immersed Alexa 555-Streptavidin conjugate (2 ng/μL, Invitrogen S21381) for two hours. Following several washing steps in PBS, the stained slices were mounted with ProLong Gold Antifade media (Invitrogen P36930) and cover slipped. Fluorescent images were captured using the same set-up for nanoparticle imaging described previously. Controls were carried out in which HABP was omitted and PBS was infused (5 μL) in place of hyaluronidase.
To determine the extent of hyaluronan digestion the mean gray value of a region of interest was analyzed using ImageJ software [41]. For each treatment we measured the mean fluorescent intensity in a region of area 0.5 mm2 that was centered at the infusion site. We also measured fluorescence intensity in corresponding 0.5 mm2 regions located 0.5 mm anterior and 0.5 mm posterior to the infusion site. The background fluorescence from an unstained slice was subtracted from each measurement. The mean fluorescence intensity in the right hemisphere that contained the probe and the infused enzyme was compared with the mean fluorescence intensity in the same region in the left hemisphere. The ratio between these measurements (degraded fluorescence intensity/normal fluorescence intensity) was used to compare digestion for the different enzyme concentrations and digestion times.
4.6 Statistical Analysis
The volume of distribution is reported as the average and standard deviation for each group. Only data sets from animals which passed our degree of backflow criteria (Section 4.4) were included in the results. The nonparametric Kruskal-Wallis test was used to compare changes in the nanoparticle volume distribution between the four treatment groups. The Mann-Whitney U-test was used to determine significance (p<0.05) between each pair of treatments and the control. The two-way analysis of the variance (ANOVA) test was used to determine significant differences in enzyme degradation. ANOVA was followed by Tukey's honestly significant difference criterion to determine differences between enzyme concentration and digestion time. All statistical tests were performed with the Statistics Toolbox in Matlab.
Acknowledgments
This work was supported by the National Institutes of Health Grant NS-045236. This work was performed in part at the Cornell NanoScale Facility, a member of the National Nanotechnology Infrastructure Network, which is supported by the National Science Foundation Grant ECS 03-35765.
Abbreviations
- CED
convection enhanced delivery
- ECM
extracellular matrix
- AP
anterior-posterior
- BSA
bovine serum albumin
Footnotes
Publisher's Disclaimer: This is a PDF file of an unedited manuscript that has been accepted for publication. As a service to our customers we are providing this early version of the manuscript. The manuscript will undergo copyediting, typesetting, and review of the resulting proof before it is published in its final citable form. Please note that during the production process errors may be discovered which could affect the content, and all legal disclaimers that apply to the journal pertain.
References
- 1.Bankiewicz KS, Eberling JL, Kohutnicka M, Jagust W, Pivirotto P, Bringas J, Cunningham J, Budinger TF, Harvey-White J. Convection-enhanced delivery of AAV vector in parkinsonian monkeys; in vivo detection of gene expression and restoration of dopaminergic function using pro-drug approach. Exp Neurol. 2000;162:2–14. doi: 10.1006/exnr.2000.7408. [DOI] [PubMed] [Google Scholar]
- 2.Bobo RH, Laske DW, Akbasak A, Morrison PF, Dedrick RL, Oldfield EH. Convection-enhanced delivery of macromolecules in the brain. Proc Natl Acad Sci USA. 1994;91:2076–2080. doi: 10.1073/pnas.91.6.2076. [DOI] [PMC free article] [PubMed] [Google Scholar]
- 3.Bourgoin C, Emiliani C, Kremer EJ, Gelot A, Tancini B, Gravel RA, Drugan C, Orlaccio A, Poenaru L, Caillaud C. Widespread distribution of β-hexosaminidase activity in the brain of a Sandhoff mouse model after coinjection of adenoviral vector and mannitol. Gene Therapy. 2003;10:1841–1849. doi: 10.1038/sj.gt.3302081. [DOI] [PubMed] [Google Scholar]
- 4.Brown LL, Feldman SM, Smith DM, Cavanaugh JR, Ackermann RF, Graybiel AM. Differential metabolic activity in the striosome and matrix compartments of the rat striatum during natural behaviors. J Neurosci. 2002;22:305–314. doi: 10.1523/JNEUROSCI.22-01-00305.2002. [DOI] [PMC free article] [PubMed] [Google Scholar]
- 5.Chen KC, Nicholson C. Changes in brain cell shape create residual extracellular space volume and explain tortuosity behavior during osmotic challenge. Proc Natl Acad Sci USA. 2000;97:8306–8311. doi: 10.1073/pnas.150338197. [DOI] [PMC free article] [PubMed] [Google Scholar]
- 6.Chen MY, Hoffer A, Morrison PF, Hamilton JF, Hughes J, Schlageter KS, Lee J, Kelly BR, Oldfield EH. Surface properties, more than size, limiting convective distribution of virus-sized particles and viruses in the central nervous system. J Neurosurg. 2005;103:311–319. doi: 10.3171/jns.2005.103.2.0311. [DOI] [PubMed] [Google Scholar]
- 7.Chen MY, Lonser RR, Morrison PF, Governale LS, Oldfield EH. Variables affecting convection-enhanced delivery to the striatum: a systematic examination of rate of infusion, cannula size, infusate concentration, and tissue-cannula sealing time. J Neurosurg. 1999;90:315–320. doi: 10.3171/jns.1999.90.2.0315. [DOI] [PubMed] [Google Scholar]
- 8.Choi J, Credit K, Henderson K, Deverkadra R, He Z, Wiig H, Vanpelt H, Flessner MF. Intraperitoneal immunotherapy for metastatic ovarian carcinoma: resistance of intratumoral collagen in antibody penetration. Clin Cancer Res. 2006;12:1906–1912. doi: 10.1158/1078-0432.CCR-05-2141. [DOI] [PubMed] [Google Scholar]
- 9.DeClerck YA, Shimada H, Gonzales-Gomez I, Raffel C. Tumoral invasion in the central nervous system. J Neurooncol. 1994;18:111–121. doi: 10.1007/BF01050417. [DOI] [PubMed] [Google Scholar]
- 10.Delpech B, Maingonnat C, Girard N, Chauzy C, Maunoury R, Olivier A, Tayot J, Creissard P. Hyaluronan and hyaluronectin in the extracellular matrix of human brain tumour stroma. Eur J Cancer. 1993;29A:1012–1017. doi: 10.1016/s0959-8049(05)80214-x. [DOI] [PubMed] [Google Scholar]
- 11.Graybiel AM, Ragsdale CW., Jr Histochemicall distinct compartments in the striatum of human, monkey, and cat demonstrated by acetylthiocholinesterase staining. Proc Natl Acad Sci USA. 1978;75:5723–5726. doi: 10.1073/pnas.75.11.5723. [DOI] [PMC free article] [PubMed] [Google Scholar]
- 12.Groothuis DR, Ward S, Itskovich AC, Dobrescu C, Allen CV, Dills C, Levy RM. Comparison of C-14-sucrose delivery to the brain by intravenous, intraventricular, and convection-enhanced intracerebral infusion. J Neurosurg. 1999;90:321–331. doi: 10.3171/jns.1999.90.2.0321. [DOI] [PubMed] [Google Scholar]
- 13.Hall WA, Rustamzadeh E, Asher AL. Convection-enhanced delivery in clinical trials. Neurosurg Focus. 2003;14:1–4. doi: 10.3171/foc.2003.14.2.3. [DOI] [PubMed] [Google Scholar]
- 14.Heselsberger K, Radner H, Pendl G. Boron neutron capture therapy for glioblastoma: improvement of boron biodistribution by hyaluronidase. Cancer Lett. 131:109–111. doi: 10.1016/s0304-3835(98)00206-7. [DOI] [PubMed] [Google Scholar]
- 15.Holt DJ, Graybiel AM, Saper CB. Neurochemical architecture of the human striatum. J Comp Neurol. 1997;384:1–25. doi: 10.1002/(sici)1096-9861(19970721)384:1<1::aid-cne1>3.0.co;2-5. [DOI] [PubMed] [Google Scholar]
- 16.Johnson EM, Deen WM. Hydraulic permeability of agarose gels. AIChE J. 1996;42:1220–1227. [Google Scholar]
- 17.Johnston ST, Deen WM. Hindered convection of proteins in agarose gels. J Membrane Sci. 1999;153:271–279. [Google Scholar]
- 18.Kosto KB, Deen WM. Diffusivities of macromolecules in composite hydrogels. AIChE J. 2004;50:2648–2658. [Google Scholar]
- 19.Krauze MT, Saito R, Noble C, Bringas J, Forsayeth J, McKnight TR, Park J, Bankiewicz K. Effects of the perivascular space on convection-enhanced delivery of liposomes in primate putamen. Exp Neurol. 2005;196:104–111. doi: 10.1016/j.expneurol.2005.07.009. [DOI] [PubMed] [Google Scholar]
- 20.Krauze MT, Saito R, Noble C, Tamas M, Bringas J, Park JW, Berger MS, Bankiewicz K. Reflux-free cannula for convection-enhanced high-speed delivery for therapeutic agents. J Neurosurg. 2005;103:923–929. doi: 10.3171/jns.2005.103.5.0923. [DOI] [PMC free article] [PubMed] [Google Scholar]
- 21.Kuhn SJ, Finch SK, Hallahan DE, Giorgio TD. Proteolytic surface functionalization enhances in vitro magnetic nanoparticle mobility through extracellular matrix. Nano Lett. 2006;6:306–312. doi: 10.1021/nl052241g. [DOI] [PubMed] [Google Scholar]
- 22.Kume-Kick J, Mazel T, Vorisek I, Hrabetova S, Tao L, Nicholson C. Independence of extracellular tortuosity and volume fraction during osmotic challenge in rat neocortex. J Physiol. 2002;542:515–527. doi: 10.1113/jphysiol.2002.017541. [DOI] [PMC free article] [PubMed] [Google Scholar]
- 23.Laske DW, Morrison PF, Lieberman DM, Corthesy ME, Reynolds JC, Stewart-Henney PA, Cummins SSKA, Paik CH, Oldfield EH. Chronic interstitial infusion of protein to primate brain: determination of drug distribution and clearance with single-photon emission computerized tomography imaging. J Neurosurg. 1997;87:586–594. doi: 10.3171/jns.1997.87.4.0586. [DOI] [PubMed] [Google Scholar]
- 24.Lieberman DM, Laske DW, Morrison PF, Bankiewicz KS, Oldfield EH. Convection-enhanced distribution of large molecules in gray-matter during interstitial drug infusion. J Neurosurg. 1995;82:1021–1029. doi: 10.3171/jns.1995.82.6.1021. [DOI] [PubMed] [Google Scholar]
- 25.Lonser RR, Corthésy ME, Morrison PF, Gogate N, Oldfield EH. Convection-enhanced selective excitotoxic ablation of the neurons of the globus pallidus internus for treatment of parkinsonism in nonhuman primates. J Neurosurg. 1999;91:294–302. doi: 10.3171/jns.1999.91.2.0294. [DOI] [PubMed] [Google Scholar]
- 26.Lonser RR, Walbridge S, Garmestani K, Butman JA, Walters HA, Vortmeyer AO, Morrison PF, Brechiel MW, Oldfield EH. Successful and safe perfusion of the primate brainstem: in vivo magnetic resonance imaging of macromolecular distribution during infusion. J Neurosurg. 2002;97:905–913. doi: 10.3171/jns.2002.97.4.0905. [DOI] [PubMed] [Google Scholar]
- 27.MacKay JA, Deen DF, Szoka JFD. Distribution in brain of liposomes after convection enhanced delivery; modulation by particle charge, particle diameter, and presence of steric coatings. Brain Res. 2005;1035:139–153. doi: 10.1016/j.brainres.2004.12.007. [DOI] [PubMed] [Google Scholar]
- 28.Mamot C, Nguyen JB, Pourdehnad M, Hadaczek P, Saito R, Bringas JR, Drummond DC, Hong K, Kirpotin DB, McKnight T, Berger MS, Park JW, Bankiewicz KS. Extensive distribution of liposomes in rodent brains and brain tumors following convection-enhanced delivery. J Neurooncol. 2004;68:1–9. doi: 10.1023/b:neon.0000024743.56415.4b. [DOI] [PubMed] [Google Scholar]
- 29.Morrison PF, Chen MY, Chadwick RS, Lonser RR, Oldfield EH. Focal delivery during direct infusion to brain: role of flow rate, catheter diameter, and tissue mechanics. Am J Physiol Regul Integr Comp Physiol. 1999;277:R1218–R1229. doi: 10.1152/ajpregu.1999.277.4.R1218. [DOI] [PubMed] [Google Scholar]
- 30.Murad GJ, Walbridge S, Morrison PF, Szerlip N, Butman JA, Oldfield EH, Lonser RR. Image-guided convection-enhanced delivery of gemcitabine to the brainstem. J Neurosurg. 2007;106:351–356. doi: 10.3171/jns.2007.106.2.351. [DOI] [PubMed] [Google Scholar]
- 31.Neeves KB, Lo CT, Foley CP, Saltzman WM, Olbricht WL. Fabrication and characterization of microfluidic probes for convection enhanced drug delivery. J Control Release. 2006;11:252–262. doi: 10.1016/j.jconrel.2005.11.018. [DOI] [PubMed] [Google Scholar]
- 32.Netti PA, Berk DA, Swartz MA, Grodinsky AJ, Jain RK. Role of extracellular matrix assembly in interstitial transport in solid tumors. Cancer Res. 2000;60:2497–2503. [PubMed] [Google Scholar]
- 33.Netti PA, Travascio F, Jain RK. Coupled macromolecular transport and gel mechanics: poroviscoelastic approach. AIChE J. 2003;49:1580–1596. [Google Scholar]
- 34.Nguyen JB, Sanchez-Parnaute R, Cunningham J, Bankiewicz KS. Convection-enhanced delivery of AAV-2 combined with heparin increases TK gene transfer in the rat brain. Neuroreport. 2001;12:1961–1964. doi: 10.1097/00001756-200107030-00037. [DOI] [PubMed] [Google Scholar]
- 35.Nishimura I, Uetsuki T, Dani SU, Ohsawa Y, Saito I, Okamura H, Uchiyama Y, Yoshikawa K. Degeneration in vivo of rat hippocampas by wild-type Alzheimer amyloid precursor protein overexpressed by adenovirus-mediated gene transfer. J Neurosci. 1996;18:2387–2398. doi: 10.1523/JNEUROSCI.18-07-02387.1998. [DOI] [PMC free article] [PubMed] [Google Scholar]
- 36.Noble CO, Krauze MT, Drummond DC, Yamashita Y, Saito R, Berger MS, Kirpotin DB, Bankiewicz KS, Park JW. Novel nanoliposomal CPT-11 infused by convection-enhanced delivery in intracranial tumors: pharmacology and efficacy. Cancer Res. 2006;66:2801–2806. doi: 10.1158/0008-5472.CAN-05-3535. [DOI] [PubMed] [Google Scholar]
- 37.Phillips RJ, Deen WM, Brady JF. Hindered transport in fibrous membranes and gels. AIChE J. 1989;35:1761–1769. [Google Scholar]
- 38.Pillwein K, Fuiko R, Slavc I, Czech T, Hawliczek G, Bernhardt G, Nirnberger G, Koller U. Hyaluronidase additional to standard chemotherapy improves outcome for children with malignant brain tumors. Cancer Lett. 1998;131:101–108. doi: 10.1016/s0304-3835(98)00205-5. [DOI] [PubMed] [Google Scholar]
- 39.Raghavan R, Brady ML, Rodriguez-Ponce MI, Hartlep A, Pedain C, Sampson JH. Convection-enhanced delivery of therapeutics for brain disease, and its optimization. Neurosurg Focus. 2006;20:1–13. doi: 10.3171/foc.2006.20.4.7. [DOI] [PubMed] [Google Scholar]
- 40.Rapoport SI. Osmotic opening of the blood-brain barrier: principles, mechanisms, and therapeutic applications. Cell and Mol Neurobio. 2000;20:217–230. doi: 10.1023/A:1007049806660. [DOI] [PMC free article] [PubMed] [Google Scholar]
- 41.Rasband WS. ImageJ, U.S. National Institutes of Health; Bethesda, MD, USA: 19972007. http:/rsb.info.nih.gov/ij. [Google Scholar]
- 42.Saito R, Bringas JR, McKnight TR, Wendland MF, Mamot C, Drummond DC, Kirpotin DB, Park JW, Berger MS, Bankiewicz KS. Distribution of liposomes into brain and rat brain tumor models by convection-enhanced delivery monitored with magnetic resonance imaging. Cancer Res. 2004;64:2572–2579. doi: 10.1158/0008-5472.can-03-3631. [DOI] [PubMed] [Google Scholar]
- 43.Saito R, Krauze MT, Bringas JR, Noble C, McKnight TR, Jackson P, Wendland MF, Mamot C, Drummond DC, Kirpotin DB, Hong K, Berger MS, Park JW, Bankiewicz KS. Gadolinium-loaded liposomes allow for real-time magnetic resonance imaging of convection-enhanced delivery in the primate brain. Exp Neurology. 2005;196:381–389. doi: 10.1016/j.expneurol.2005.08.016. [DOI] [PubMed] [Google Scholar]
- 44.Saito R, Krauze MT, Noble CO, Tamas M, Drummond DC, Kirpotin DB, Berger MS, Park JW, Bankiewicz KS. Tissue affinity of the infusate affects the distribution volume during convection-enhanced delivery into rodent brain: Implications for local drug delivery. J Neurosci Meth. 2006;154:225–232. doi: 10.1016/j.jneumeth.2005.12.027. [DOI] [PubMed] [Google Scholar]
- 45.Sandberg DI, Edgar MA, Souweidane MM. Effect of hyperosmolar mannitol on convection-enhanced delivery into the rat brain stem. J Neurooncol. 2002;58:187–192. doi: 10.1023/a:1016213315548. [DOI] [PubMed] [Google Scholar]
- 46.Sanftner LM, Sommer JM, Suzuki BM, Smith PH, Vijay S, Vargas JA, Forsayeth JR, Cunningham J, Banciewicz KS, Kao H, Bernal J, Pierce GF, Johnson KW. AAV2-mediated gene delivery to monkey putamen: Evaluation of an infusion device and delivery parameters. Exp Neurol. 2005;194:476–483. doi: 10.1016/j.expneurol.2005.03.007. [DOI] [PMC free article] [PubMed] [Google Scholar]
- 47.Sykova E, Vorisek I, Mazel T, Antonova T, Schachner M. Reduced extracellular space in the brain of tenascin-R and HNK-1-suphotransferase deficient mice. Eur J Neurosci. 2005;22:1873–1880. doi: 10.1111/j.1460-9568.2005.04375.x. [DOI] [PubMed] [Google Scholar]
- 48.Thorne RG, Nicholson C. In vivo diffusion analysis with quantum dots and dextrans predicts the width of brain extracellular space. Proc Natl Acad Sci USA. 2006;103:5567–5572. doi: 10.1073/pnas.0509425103. [DOI] [PMC free article] [PubMed] [Google Scholar]
- 49.Tona A, Bignami A. Effect of hyaluronidase on brain extracellular matrix in vivo and optic nerve regeneration. J Neurosci Res. 1993;36:191–199. doi: 10.1002/jnr.490360209. [DOI] [PubMed] [Google Scholar]
- 50.Tysnes BB, Mahesparan R. Biological mechanisms of glioma invasion and potential therapeutic targets. J Neurooncol. 2001;53:129–147. doi: 10.1023/a:1012249216117. [DOI] [PubMed] [Google Scholar]
- 51.Vogelbaum MA. Convection enhanced delivery for the treatment of malignant gliomas: symposium review. J Neurooncol. 2005;73:57–69. doi: 10.1007/s11060-004-2243-8. [DOI] [PubMed] [Google Scholar]
- 52.Voges J, Reszka R, Gossmann A, Dittmar C, Richter R, Garlip G, Kracht L, Coenen HH, Sturm V, Wienhard K, Heiss WD, Jacobs AH. Image-guided convection-enhanced delivery and gene therapy of glioblastoma. Ann Neurol. 2003;54:479–487. doi: 10.1002/ana.10688. [DOI] [PubMed] [Google Scholar]
- 53.Weber F, Asher A, Bucholz R, Berger M, Prados M, Chang S, Bruce J, Hall W, Rainov NG, Westphal M, Warnick RE, Rand RW, Floeth F, Rommel F, Pan H, Hingorani VN, Puri RK. Safety, tolerability, and tumor response of IL4-Pseudomonas exotoxin (nbi-3001) in patients with recurrent malignant glioma. J Neurooncol. 2003;64:125–137. doi: 10.1007/BF02700027. [DOI] [PubMed] [Google Scholar]
- 54.White NM, Hiroi N. Preferential localization of self-stimlation sites in striosomes/patches in the rat striatum. Proc Nat Acad Sci USA. 1998;95:6486–6491. doi: 10.1073/pnas.95.11.6486. [DOI] [PMC free article] [PubMed] [Google Scholar]
- 55.Zhang X, Luck J, Dewhirst MW, Yuan F. Interstitial hydraulic conductivity in a fibrosarcoma. Am J Physiol Heart Circ Physiol. 2000;279:H2726–H2734. doi: 10.1152/ajpheart.2000.279.6.H2726. [DOI] [PubMed] [Google Scholar]