

Abstract
Heterogenous nucleation on small molecule crystals causes a monoclinic crystal form of bacteriorhodopsin (BR) in which trimers of this membrane protein pack differently than in native purple membranes. Analysis of single crystals by nano-electrospray ionization-mass spectrometry demonstrated a preservation of the purple membrane lipid composition in these BR crystals. The 2.9-Å x-ray structure shows a lipid-mediated stabilization of BR trimers where the glycolipid S-TGA-1 binds into the central compartment of BR trimers. The BR trimer/lipid complex provides an example of local membrane thinning as the lipid head-group boundary of the central lipid patch is shifted by 5 Å toward the membrane center. Nonbiased electron density maps reveal structural differences to previously reported BR structures, especially for the cytosolic EF loop and the proton exit pathway. The terminal proton release complex now comprises an E194-E204 dyad as a diffuse proton buffer.
Bacteriorhodopsin (BR) is the light-driven proton pump of Haloarchaea (1) that converts light energy into an electrochemical proton gradient. Unlike eukaryotic and eubacterial photosynthetic reaction centers, BR uses a retinal as the chromophore that is covalently linked to K216 as a protonated Schiff base. Light absorption by all-trans retinal triggers its isomerization to a 13-cis configuration. Thermal reisomerization and a sequence of structural changes and proton transfers inside the protein complete the catalytic cycle and promote the unidirectional translocation of one proton toward the extracellular side of the membrane (reviewed in refs. 2 and 3).
Besides its nature as a light-driven vectorial catalyst, BR is exceptional in terms of its supramolecular organization and stability. In Haloarchaea, BR is the main constituent of a two-dimensional (2D) hexagonal crystal lattice, the purple membrane (PM). PM films maintain structural and functional integrity under a wide range of pH, temperature, humidity, or chemical environment (4). The 2D crystalline state is important for the in vivo physiology of BR (5). Haloarchaeal lipids constitute one-fourth of the PM and affect significantly the kinetics of BR (6). Main components are archaeol derivatives uniquely found in Haloarchaea: phosphatidylglycerol (PG), phosphatidylglycerol sulfate (PGS), phosphatidylglycerol phosphate methylester (PGP-Me), and a sulfated triglycoside lipid (S-TGA-1, 3-HSO3-Galpβ1–6Manpα1–2Glcpα-1-archaeol). The latter is crucial for the stability of PM (7) and partitions exclusively to the extracellular leaflet of the cell membrane (8). The 2D crystallinity of BR promoted the development of electron crystallography, which revealed structural aspects of BR in its native membrane context (9–11). In PM, BR adopts a trimeric state where interspersed lipids mediate inter-trimer contacts (12). The trimers partition the lipid bilayer into two discontinuous compartments: a central one cylindrically enclosed by the BR trimer with space for six lipids and an outer continuous bulk phase with space for 24 lipids per trimer (12). Half of these lipids were observed by electron crystallography, but their precise chemical nature remained unknown because of the failure to identify individual head groups (11).
Here we report the 2.9-Å structure of monoclinic three-dimensional (3D) crystals of BR that were heterogenously nucleated on the 2D surface of an organic crystal (13). Despite a non-PM-like environment, six haloarchaeal lipids were found to stabilize the BR trimer by specific interactions via their lipid and head-group moieties. In addition, the complex nature of the terminal proton release group comprising an E194/E204 dyad was resolved.
EXPERIMENTAL PROCEDURES
Crystallization and Data Collection.
BR was crystallized according to ref. 13. Typical crystallization conditions were 10 μl of 18–23 mg/ml of BR (using ɛ552 = 50,000 M−1⋅cm−1) in 0.5% (wt/vol) β-octyl glucopyranoside, 4% (wt/vol) benzamidine, 500 mM sodium phosphate, pH 5.6 mixed with 10 μl of 3 M sodium phosphate, pH 5.4–5.6 above 1 ml of reservoir (1.8–2.3 M ammonium sulfate, pH 4.0–6.0) at 4°C. Benzamidine crystallizes within a few hours. BR crystals growing epitaxially from benzamidine crystals appear after 5–10 days and reach their final size after 6–9 weeks.
X-ray data were collected at 100 K from crystals frozen in 4 M sodium phosphate, pH 5.2. Spot shapes and mosaicity were strongly anisotropic along c*. BR crystals showed diffraction limits of 2.2 Å along a*, 2.5 Å along b*, and 3.4–3.6 Å along c* at ID13, European Synchrotron Radiation Facility, Grenoble, France. A 2.9-Å dataset was collected from a crystal (200 μm × 70 μm × 20 μm) at beamline X11, European Molecular Biology Laboratory, Hamburg, Germany. Data were indexed and integrated with denzo (HKL research) in space group C2. A previous misassignment as space group C222 originated from severely distorted spot shapes (13). Only data within an ellipsoidal volume spanned by a* and b* to 1/2.9 Å−1 and by c* to 1/3.45 Å−1 were retained for scaling and merging by scala (14).
Self-rotation functions were calculated by glrf (15) with data from 15 to 4 Å resolution. A local 3-fold was located at ψ = 90°, Φ = 54.4°. The anisotropic intensity distribution, i.e., the dramatic drop of mean intensities along c*, required data sharpening before molecular replacement (MR) with isotropic search models. Several fake models of BR monomers were constructed in the C2 cell with a global temperature factor of 25 Å2. Observed structure factors were scaled with an anisotropic B-factor correction against calculated structure factors. B-factor tensors derived from fake models with three BR monomers per asymmetric unit had on average a principal component b33 of −120 Å2. Self-rotation functions calculated with corrected data showed considerable sharpening of peaks (data not shown). For the calculation of Rfree, a test set of 530 reflections was selected in thin spherical shells to minimize bias by noncrystallographic symmetry.
Structure Determination and Refinement.
Structure solution by MR used x-plor 3.851 and an electron-crystallographic model (11) comprising residues 8–30, 41–66, 77–157, 170–223, and retinal. Rotation and translation functions used mass-centered BR monomers or trimers and data between 10 and 4 Å resolution. Patterson correlation refinement was carried out for BR trimers before calculation of the translation function. The BR trimer was localized at θ1 = 211.7°, θ2 = 51.8°, θ3 = 92.0°, x = 0.21, z = 0.15 (translation function coefficient 8 σ above mean, next peak 5 σ). The R factor after rigid-body refinement was 0.419 (Rfree 0.433, data 15–3.0 Å) and dropped to 0.387 (Rfree 0.401) by maximum likelihood refinement with refmac (14). The 2Fobs-Fcalc maps showed continuous density for the retinals, which were omitted during the previous refinement steps.
Further refinement in x-plor (R factor 0.363, Rfree 0.383) failed to resolve regions omitted from the search model. Subsequently, model phases calculated from data between 15 and 4 Å were refined and extended to 3.0 Å by molecular averaging between monomers B and C and solvent flattening in dm 1.8 (14), Rfree decreased during 400 cycles from 49.5% to 28.4%. Monomer A was excluded from averaging because of its increased thermal mobility. The resulting map allowed modeling of the N terminus, the C-terminal region to residue 227, and loops BC, CD, and EF. Structural models were checked by composite omit maps, which were calculated by cns (16) to minimize model bias. Lipids were introduced into the model after three macrocycles of refinement in x-plor using tight noncrystallographic symmetry restraints and manual remodeling. The refinement achieved an R factor of 0.257 (Rfree 0.298) for data between 10.0 and 2.9 Å. The model consists of 5,672 atoms and exhibits good stereochemistry as analyzed by procheck (14).
Mass-Spectrometric Lipid Analysis.
Mass spectrometry (MS) analyses were performed with a triple quadrupole instrument (Finnigan-MAT model TSQ 7000, San Jose, CA) equipped with a nanoESI source operating at a flow rate of 20–50 nl/min. The electrospray capillary was placed at a distance of 0.5–1 mm before the orifice of a transfer capillary heated to 150°C. Before analysis by single-stage MS, the lipid extracts were centrifuged for 5 min and a 5- to 10-μl aliquot was transferred into the electrospray capillary. The spray was started by applying −400 to −700 V to the capillary for the detection of negative ions. Twenty to 100 repetitive scans lasting 4 sec each were averaged for each spectrum.
RESULTS AND DISCUSSION
Heterogenous Nucleation, Crystallization, and Lipid Analysis.
Although BR forms easily well-ordered 2D crystals in vivo and in vitro (17, 18), the generation of 3D crystals useful for x-ray crystallography succeeded only recently. One approach used a cubic lipid phase as a 3D matrix in which staggered PM sheets grew out to hexagonal BR microcrystals (19). We used heterogenous nucleation on the 2D surfaces of freshly grown benzamidine sulfate crystals to obtain monoclinic, photoactive 3D crystals of BR (space group C2, a = 120.52 Å, b = 105.96 Å, c = 80.19 Å, β = 94.94°) (13). The nucleation strictly required the previous growth of the organic crystals to which BR crystals adhere via their ac face. BR crystals detached easily from the benzamidine crystals and continued growth in the bulk phase. The distinct arrangement of BR crystals on benzamidine crystals (space group P2, a = 12.2 Å, b = 10.0 Å, c = 8.0 Å, β = 91.2°) and the correlations between space groups and cell dimensions suggest an epitaxial nucleation mechanism for BR crystals. However, a precise determination of the relative alignment of both crystal lattices (20) was precluded because of the labile association between BR and benzamidine crystals.
Batch variations of crystal quality and the severe disorder along c* initially prohibited a structure determination of BR (13). Endogenous lipids were suspected to cause these problems and the need for low detergent concentrations during crystallization. Indeed, NMR studies showed a tight association between haloarchaeal lipids and BR in the solubilized monomeric state (21). Electron-microscopic analyses of BR stock solutions used for crystallization experiments indicated the presence of, or at least, the quick formation of 2D crystalline PM patches (R.S., unpublished results), a process known to depend crucially on haloarchaeal lipids (18). Therefore, microextractions were performed from single crystals (22). The lipid composition of several microextracts was analyzed by negative-ion nanoESI-MS and compared with reference spectra of PM. The spectra showed that all lipid species of PM, PG (m/z 805.6), PGS (m/z 885.7), PGP-Me (m/z 899.7), and S-TGA-1 (m/z 1218.2), were present in BR crystals (Fig. 1).
Figure 1.

(A) Negative-ion nanoESI-MS of lipid extracts from PM. The phospholipids PGS and PGP-Me show signals at m/z 442.5, 449.5 (z = 2), and 885.6. The signal at m/z 899.5 is absent because of the double-negative state of detected PGP-Me. PG, the major hydrolysis product of PGS and PGP-Me, was detected at m/z 805.6; phosphatidic acid (PA, m/z 731.5) is absent. The sulfated glycolipids S-TGA-1 and S-TeGA (sulfated tetraglycosyldiphytanylglycerol, a minor species in PM) show signals at m/z 1217.6 and 1379.8. The phospho- and glycolipids were identified by class-specific fragmentations in tandem MS (MS/MS) analyses at their optimized collision energies. (B) NanoESI-MS of the lipid extract of the BR crystal used for crystallographic data collection (shown in C). Pictograms summarize the experimental setup according to ref. 41.
Structure Determination.
A 2.9-Å dataset was collected from a single crystal; completeness and data quality are shown in Table 1. A noncrystallographic 3-fold was found by self-rotation functions and suggested that BR trimerizes in monoclinic crystals similar to that in PM. The structure was solved by MR using a BR trimer as a search model that was assembled from an electron-crystallographic structure (11). The severe model bias that was imposed by the MR solution required phase refinement and omit map procedures to avoid improper modeling (see Experimental Procedures). Continuous, nonbiased electron density defined the monomers A from Q3 to G231, B from A2 to G231, and C from Q1 to G231. Minor differences between monomers of the BR trimer are caused by crystal packing requirements, e.g., the N terminus of monomer A (residues Q3-G6) or the tip of the BC loop of monomer B (residues F71-Q75) are displaced by crystal contacts with a symmetry-related BR trimer.
Table 1.
Data collection and refinement statistics
| Data collection | |
| Cell dimensions (a, b, c) | 120.5 Å, 106.0 Å, 80.2 Å |
| β = 94.94°, space group C2 | |
| Resolution (Å) | 25 − 2.9 |
| Observations; unique reflections | 48,145; 18,504 |
| Mosaicity* | 1.3°–2.0° |
| I/σ(I)†, Rmerge‡ | 10.2 (5.7), 0.078 (0.215) |
| Completeness: 15-3.5 Å, 15-2.9 Å | 95.0%, 83.2% (43.6%) |
| Refinement statistics | |
| Resolution (Å) | 10-2.9 |
| Reflections (F > 0) | 18113 |
| Anisotropic B-factor tensor | 10.6, 24.1, 36.4, −101.3 |
| (b11, b13, b22, b33, Å2) | |
| R factor, Rfree§ | 0.257, 0.298 |
| Total no. of atoms; lipid atoms | 5,672; 316 |
| Mean B value (Å2) | 58.2 |
| rmsd bonds, angles | 0.009 Å, 1.252° |
Variable by elongated spot shape.
As calculated with the program truncate (14); values in parentheses correspond to highest resolution shell.
Rmerge = ΣhklΣi|Ii(hkl) − 〈I(hkl)〉|/ΣhklΣiIi(hkl).
R factor = Σ|Fobs − Fcalc|/Σ Fobs; Rfree calculated with 3% of the data.
All surface loops are well defined in omit maps and have temperature factors only slightly above the mean temperature factors of the monomers. A comparison with previous BR structures (10, 11, 23) shows structural differences for some of these loops, especially for the AB, BC, and EF loops (Fig. 2 A and B). The BC loop adopts a β-hairpin conformation as in the structure of Kimura et al. (10), but not found in the structure of Grigorieff et al. (11). The large differences in several loops of the x-ray structure of Pebay-Peyroula et al. (23) coincide with extremely high temperature factors for these loops in the latter structure. In the structures of Pebay-Peyroula et al. and Kimura et al., parts of the cytosolic EF loop are traced into a region where the C terminus emerges from helix G. The EF loop (residues S162-P165) is expected to undergo structural changes during the decay of the M intermediate (24) and forms in the BR trimer structure a short bridge between helices E and F (Fig. 2C). Its conformation is corroborated by recent EPR data on spin-labeled EF loops (25). Local differences also are found for the FG loop around residues 193–195, which place E194 close to E204.
Figure 2.
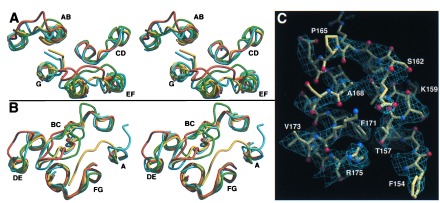
Comparison between monomer B of the BR trimer (yellow) and recent BR structures (green, ref. 11; cyan, ref. 10; orange, ref. 23). The stereodiagrams show the cytosolic (A) and extracellular (B) surface loops. (C) Conformation of the EF loop and the cytosolic ends of helices E and F. The sigmaa-weighted 2Fobs-Fcalc electron density (14) is contoured at 0.175 e/Å3. Figs. 2–4 were made with molscript (42) and raster3d (43).
Arrangement of BR Trimers.
In monoclinic BR crystals, BR adopts a packing different than in PM or the related hexagonal 3D crystals, but retains the trimeric state found in these crystal forms (Fig. 3 A and B). Because of the high ratio of hydrophobic vs. hydrophilic surfaces, BR trimers still arrange into layers, but with alternating orientations (Fig. 3B). The tilt of the layers by 53° from the c axis closely agrees with spectroscopic data on the monoclinic crystal form (13). The crystallographic 2-fold symmetry generates a contact between monomers B and C of neighboring BR trimers. Unlike the lipid-bridged inter-trimer contacts of PM, this contact is mediated by direct protein–protein interactions between helices F and G and occludes an area of 521 Å2 per monomer. An intervening lipid and octyl-β-d-glucopyranoside molecule additionally reinforce this hydrophobic contact. In contrast, monomer A is not involved in any intra-layer contact. A 19-Å gap to its next neighbor, the monomer A of a symmetry-related BR trimer, leads to the absence of crystal contacts along c*. This structural discontinuity presumably reflects detergent micelle fusion or interaction and coincides with the increased disorder along c*. During nucleation, this labile arrangement obviously requires preassembly on the 2D surfaces of benzamidine crystals. The inter-layer contacts are mainly mediated by the long β-hairpin BC loops of monomers B and C and the galactosyl-sulfate groups of S-TGA-1 (see below).
Figure 3.
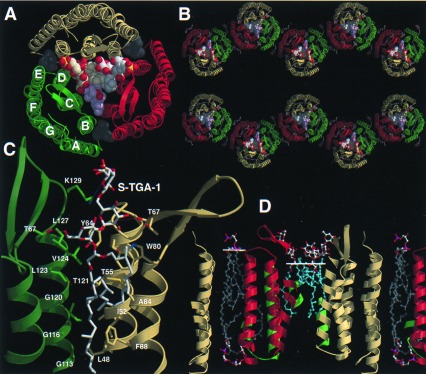
Lipid binding and layer packing of BR trimers in PM and monoclinic BR crystals. (A) Top view on the BR trimer/lipid complex from the extracellular side. Lipids are shown as space-filling models. Single phytanols (gray) are located on the cytosolic side of the BR trimer. (B) View along the a*-axis of the monoclinic BR crystal (monomer A, yellow; B, green; C, red). (C) Binding site of the glycolipid S-TGA-1 as viewed from the trimer axis. (D) Cross section of the PM model. Monomer B and an associated S-TGA-1 lipid replaced BR and the lipids 261, 266 of the previous PM model of Grigorieff et al. (11). The white lines show the head group/lipid boundaries.
Time-resolved microspectroscopic analyses of single crystals showed a profound influence of the crystal lattice on the photocycle kinetics (13). The steric restrictions exerted by the crystal contacts along helices F and G affect a 10-fold decreased rate of the M-intermediate decay (t1/2 ≈ 100 ms) as compared with intact PM. In contrast, no significant kinetic differences were found between PM and their 3D analogue, the hexagonal microcrystals of BR (26).
Lipid-Mediated Stabilization of the BR Trimer.
Difference Fourier syntheses showed electron density for six haloarchaeal lipids that are bound in the BR trimer. Three lipids are observed as single phytanols in a hydrophobic crevice between helices AB and DE of neighboring BR monomers (Fig. 3A). The crevice is located on the cytosolic half of the BR trimer; two-thirds of the phytanol surface (total 361 Å2) is occluded by interactions with the bulk phase. The remainder of these lipids apparently is disordered by exposure to the bulk phase.
The other three lipids face the extracellular side where they form a continuous patch in the central compartment of the BR trimer. All show interpretable electron density for the archaeol moiety that consists of an sn-glycerol ether-linked at the 2- and 3-hydroxyls with phytanols (Fig. 3C). The 3-phytanols have an elongated conformation along the interface of two BR monomers. Three consecutive glycines on helix D, G113, G116, and G120, form a groove that is lined by several hydrophobic residues (L48, I52, A53, T55, M56, Y64, I117, L123, V124, and L127) for accommodating the 3-phytanol. Modifications in the hydrophobic groove by replacing G113 or G116 with bulkier residues disrupt the PM organization (27). The symmetry of the BR trimer is preserved by the conformations of the 3-phytanol groups while no local 3-fold relationship is found for the 2-phytanols. The 2-phytanols are sharply bent where they contact the side chain of W80. The indole group of this residue, which resides at the stalk of the BC loop, is presented almost parallel to the trimer axis. Analogous to the hydrophobic groove, mutations of W80 to amino acids with smaller side chains destroy the native PM-like arrangement (H. Besir and D.O., unpublished data).
The triglycoside head groups of two lipids were identified as S-TGA-1 by electron density. The triglycoside intercalates the BC loops of two BR monomers (Fig. 3 A and C). Its presence is consistent with a 7-Å projection map that was obtained by neutron diffraction of PM labeled with deuterated glycolipids (28). The neutron diffraction data also indicated the presence of three S-TGA-1 molecules in the central compartment. In the x-ray structure, the missing density for the head group of the third lipid might be caused by crystal packing requirements or local disorder. Several hydrogen bonds provide specific contacts between the BC loops and the triglycoside. T67 is involved in H bonds to two S-TGA-1 molecules: one H bond to the 6-hydroxyl of the glucose group (2.9 Å) and the other to the 3-hydroxyl of the mannose (3.4 Å). The 2-hydroxyl of the mannose is suitably positioned to form H bonds to the carbonyl groups of Y64 (2.9 Å) and L66 (3.5 Å). A salt bridge is found between the sulfate of the terminal galactosyl-3-sulfate and K129 (3.5 Å). Additional interactions might be mediated by water molecules, which currently are not delineated because of the limited resolution.
Together with the non-PM-like environment, the presence of endogenous lipids in BR trimers underlines their unique role for intra-trimer stabilization. With the exception of a single salt bridge between D104 OD1 and K40 NZ (2.8 Å) protein–protein interactions are mostly hydrophobic between BR monomers and comprise a protein surface area of 659 Å2 per monomer. A similar contribution comes from protein-lipid interactions with S-TGA-1 (396 Å2) and the phytanol bound in the cytosolic crevice (311 Å2). The lipid positions in the BR trimer/lipid complex (Fig. 3D) are partly consistent with the previous electron-crystallographic PM model (11). The phytanols in the cleft between helices AB and DE correspond closely to lipid 269 of the original PM model (11). Lipid 261 occupies a similar position as S-TGA-1 in the x-ray structure, but is partially mistraced into the protein region and projects hydrophobic parts into the region of the triglycoside head group. The glucoses of the S-TGA-1 lipids form a hydrophilic cap above the lipophilic membrane portion. Interestingly, the 2D crystalline PM and the monoclinic BR crystals do not show ordered lipids on the cytosolic face of the central compartment. Therefore, it is likely that only the observed haloarchaeal lipids contribute significantly to the stable assembly of the BR trimer.
A novel aspect of our PM model is given for the boundaries between the hydrophilic head groups and the hydrophobic phytanols. For the central S-TGA-1 lipid patch, this boundary is shifted by more than 5 Å toward the membrane center as compared with the bulk lipid phase (Fig. 3D). This local “membrane thinning” arises from the unique interactions between the BR trimer and S-TGA-1. No shift of the head group/lipid boundary is required for the unobserved lipids of the central compartment that face the cytosolic side. These lipids could project the phytanols into the space that remains unoccupied because of the curved conformations of the 2-phytanols (Fig. 3D).
Proton Conductance Pathways.
Proton diffusion is extremely efficient along the PM surfaces and retards the release of protons from BR to the aqueous bulk phase (29). Electrostatic calculations show a primarily negative potential for the cytosolic surface (Fig. 4A) and support a role as a proton collector surface. Mutagenesis determined D38 on the AB loop to be not only crucial for proton entrance into a cytoplasmic channel (30), but also for electrostatically induced accessibility changes of the Schiff base (31). This residue is surrounded by several acidic residues: D36 (5.2 Å), whose side chain points toward D38, and the residues D102 (8.5 Å) and D104 on the CD loop (9.9 Å). The location of D104 on another BR monomer implies that protons might be delocalized over the cytosolic surface of the BR trimer before translocation through a cytosolic proton pathway. In contrast, the extracellular surface shows only a few distantly spaced residues, E9, E74, and the 3-sulfate group of S-TGA-1, which are capable of buffering protons before releasing them to the aqueous bulk phase (Fig. 4B).
Figure 4.
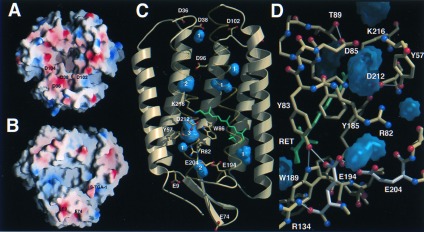
Proton conductance in the BR trimer. (A) Proton collection surface of the cytosolic side. (B) Proton exit surface of the extracellular side. Electrostatic surface potentials were calculated with grasp (44) and shown from −20 kcal/mol (red) to +20 kcal/mol (blue). The internal residues D96, D115, and E204 were assumed to be protonated. (C) Internal cavities of BR. Twelve cavities were found by voidoo (45) using a probe radius of 1 Å and a primary grid spacing of 0.25 Å for enhanced sensitivity. Eight cavities (blue) fulfilled the criteria to be discontinuous from the molecular surface and capable of accommodating at least one water. White numbers indicate the maximal number of waters per cavity. (D) Proton exit pathway with the E194/E204 dyad (white). Cavities are shown in blue, H bonds within a 3.5-Å cutoff in white.
Based on the structure, no plausible proton pathway for the 12-Å distance between D38 and D96 can be proposed; the intervening K41 is dispensable for proton conduction (J. Tittor and J. Heberle, personal communication) and the side chain of F42 shields D96 from access to the cytosolic surface. During the late photocycle, structural changes of F42 and D96 might be transmitted to the cytosolic end of helix C and the C terminus of BR as the side chains of L99 and I229 pack against F42. Interestingly previous electron crystallographic data on a trapped O-intermediate showed such changes in the vicinity of helices B, C, and G (32). Along the 12-Å pathway from D96 to the Schiff base no protein-derived proton donor/acceptor groups are found; the only group hydrogen-bonding to D96 is the side chain of T46 (2.5 Å). A cavity close to D96 and surrounded by mostly hydrophobic residues (F27, T46, V49, P50, L92, L93, D96, F219, and G220) can accommodate two waters for a water channel toward the Schiff base (Fig. 4C).
Unlike the cytosolic pathway, the proton exit pathway appears to be largely water filled, albeit discontinuous from the extracellular aqueous bulk phase. A large internal cavity for up to three water molecules forms a water channel between the Schiff base, D85, and R82 (Fig. 4 C and D). The guanidinium group of R82 might be completely immersed in water because two cavities for three additional waters surround it, but no clear-cut hydrogen bonds to protein groups are observed. R82 is known to affect the pK of the terminal proton release group and couples the release to the protonation state of D85 (33, 34). During the M-intermediate formation, this group releases a proton to the extracellular surface while D85 receives a proton from the Schiff base. Previous structures (11, 23) and Fourier transform infrared-spectroscopic data (35) suggested that only E204 represents the terminal release group. Rather, in the structure of the BR trimer, the terminal release group comprises an E194/E204 dyad (Fig. 4D). The carboxylate of E194 H bonds to the OE1 atom of E204 (3.5 Å, 3.8 Å) and the hydroxyl of Y83 (2.7 Å). Furthermore, no H bond was found between R134 and E194, which was reported in two previous structures (11, 23). The 6.8-Å distance between the polar groups of R134 and E194 shows that R134 acts only as a counter ion for the E194/E204 dyad. The H-bonding network along the dyad is consistent with a strong coupling of the pKs of E194 and E204. A disturbance of the dyad by mutating one of its residues abolished proton release and pK coupling to D85 (36, 37); replacement of E194 or E204 to glutamine even implied indistinguishable roles for proton release (J. Tittor, personal communication). Therefore, it is likely that the proton stored for release is diffusely distributed along the dyad, maybe in association with a bound water molecule (38).
CONCLUSION
The structure of the BR-trimer/lipid complex suggests at least two complementary ways how lipids stabilize oligomeric rings of membrane proteins and achieve an asymmetric distribution in biological membranes. First, individual lipids might be selectively bound by hydrophilic interactions between their head groups and the membrane protein. Second, volume and shape complementarity is exerted between the central volume of an oligomeric membrane protein ring and an ensemble of aggregated lipids. The functional aspects, if any, of the observed local membrane thinning currently are speculative, e.g., membrane thinning should cause a steeper electric field gradient across the membrane than in the bulk lipid phase that might affect the proton pathway in BR. Several other membrane proteins like light-harvesting complexes (LHC) or the F0 portions of F-type ATPases assemble to oligomeric rings like BR. At least the assembly of LHC II depends crucially on a phospho- and a glycolipid species (39). Consequently, internal membrane patches that are discontinuous from the lipid bulk phase and have unique compositions and physicochemical characteristics might be widespread features among oligomeric membrane proteins.
Finally, heterogenous nucleation of membrane protein crystals on organic crystals offers a nonconventional route to membrane protein crystallization. Hereby, lipid analysis of single crystals by nanoESI-MS is a powerful tool to explore the role of lipids in crystallization.
Acknowledgments
We thank K. Doehring and H. Egbringhoff for initial x-ray work, H. Bartunik, A. Tucker and C. Riekel for help at beamlines BW6, MPG-ASF and X11, European Molecular Biology Laboratory (Deutsches Elektronen Synchrotron, Hamburg, Germany) and ID13, European Synchrotron Radiation Facility (Grenoble, France), G. Erben for assistance in ESI-MS, and R. Henderson for discussion. This work was supported by Fonds der Chemischen Industrie and the European Community (EC Grant BIO4-CT96-0129).
ABBREVIATIONS
- BR
bacteriorhodopsin
- PM
purple membranes
- ESI
electrospray ionization
- 2D
two-dimensional
- PG
phosphatidylglycerol
- PGS
phosphatidylglycerol sulfate
- PGP-Me
phosphatidylglycerol phosphate methylester
- 3D
three-dimensional
- MR
molecular replacement
- MS
mass spectrometry
Note Added in Proof
Recently, hemihedral twinning was recognized to have severely compromised the initial structure determination of the hexagonal BR microcrystals (40).
Footnotes
Data deposition: The coordinates and structure factors reported in this paper have been deposited in the Protein Data Bank, Biology Department, Brookhaven National Laboratory, Upton, NY 11973 (PDB ID code 1BRR).
References
- 1. Oesterhelt D, Stoeckenius W. Proc Natl Acad Sci USA. 1973;70:2853–2857. doi: 10.1073/pnas.70.10.2853. [DOI] [PMC free article] [PubMed] [Google Scholar]
- 2.Oesterhelt D, Tittor J, Bamberg E. J Bioenerg Biomemb. 1992;24:181–191. doi: 10.1007/BF00762676. [DOI] [PubMed] [Google Scholar]
- 3.Lanyi J K. J Biol Chem. 1997;272:31209–31212. doi: 10.1074/jbc.272.50.31209. [DOI] [PubMed] [Google Scholar]
- 4.Oesterhelt D, Bräuchle C, Hampp N. Q Rev Biophys. 1991;24:425–478. doi: 10.1017/s0033583500003863. [DOI] [PubMed] [Google Scholar]
- 5.Hartmann R, Sickinger H-D, Oesterhelt D. FEBS Lett. 1977;82:1–6. doi: 10.1016/0014-5793(77)80873-9. [DOI] [PubMed] [Google Scholar]
- 6.Shrager R I, Hendler R W, Bose S. Eur J Biochem. 1995;229:589–595. doi: 10.1111/j.1432-1033.1995.tb20502.x. [DOI] [PubMed] [Google Scholar]
- 7.Barnett S M, Dracheva S, Hendler R W, Levin I W. Biochemistry. 1996;35:4558–4567. doi: 10.1021/bi952258l. [DOI] [PubMed] [Google Scholar]
- 8.Henderson R, Jubb J S, Whytock S. J Mol Biol. 1978;123:259–274. doi: 10.1016/0022-2836(78)90325-x. [DOI] [PubMed] [Google Scholar]
- 9.Henderson R, Baldwin J M, Ceska T A, Zemlin F, Beckmann E, Downing K H. J Mol Biol. 1990;213:899–929. doi: 10.1016/S0022-2836(05)80271-2. [DOI] [PubMed] [Google Scholar]
- 10.Kimura Y, Vassylyev D G, Miyazawa A, Kidera A, Matsushima M, Mitsuoka K, Murata K, Hirai T, Fujiyoshi Y. Nature (London) 1997;389:206–211. doi: 10.1038/38323. [DOI] [PubMed] [Google Scholar]
- 11.Grigorieff N, Ceska T A, Downing K H, Baldwin J M, Henderson R. J Mol Biol. 1996;259:393–421. doi: 10.1006/jmbi.1996.0328. [DOI] [PubMed] [Google Scholar]
- 12.Grigorieff N, Beckmann E, Zemlin F. J Mol Biol. 1995;254:404–415. doi: 10.1006/jmbi.1995.0627. [DOI] [PubMed] [Google Scholar]
- 13.Schertler G F, Bartunik H D, Michel H, Oesterhelt D. J Mol Biol. 1993;234:156–164. doi: 10.1006/jmbi.1993.1570. [DOI] [PubMed] [Google Scholar]
- 14.Computer Crystallographic Project No. 4. Acta Crystallogr D. 1994;50:760–763. [Google Scholar]
- 15.Tong L, Rossmann M G. Methods Enzymol. 1997;276:594–611. [PubMed] [Google Scholar]
- 16.Brunger A T, Adams P D, Rice L M. Structure. 1997;5:325–336. doi: 10.1016/s0969-2126(97)00190-1. [DOI] [PubMed] [Google Scholar]
- 17.Henderson R, Unwin P N T. Nature (London) 1975;257:28–32. doi: 10.1038/257028a0. [DOI] [PubMed] [Google Scholar]
- 18.Sternberg B, Watts A, Cejka Z. J Struct Biol. 1993;110:196–204. [Google Scholar]
- 19.Landau E, Rosenbusch J P. Proc Natl Acad Sci USA. 1996;93:14532–14535. doi: 10.1073/pnas.93.25.14532. [DOI] [PMC free article] [PubMed] [Google Scholar]
- 20.McPherson A, Shlichta P. Science. 1988;239:385–387. doi: 10.1126/science.239.4838.385. [DOI] [PubMed] [Google Scholar]
- 21.Patzelt H, Ulrich A S, Egbringhoff H, Düx P, Ashurst J, Simon B, Oschkinat H, Oesterhelt D. J Biomol NMR. 1997;10:95–106. [Google Scholar]
- 22.Bligh E G, Dyer W J. Can J Biochem Physiol. 1959;37:911–915. doi: 10.1139/o59-099. [DOI] [PubMed] [Google Scholar]
- 23.Pebay-Peyroula E, Rummel G, Rosenbusch J P, Landau E M. Science. 1997;277:1676–1681. doi: 10.1126/science.277.5332.1676. [DOI] [PubMed] [Google Scholar]
- 24.Subramaniam S, Gerstein M, Oesterhelt D, Henderson R. EMBO J. 1993;12:1–8. doi: 10.1002/j.1460-2075.1993.tb05625.x. [DOI] [PMC free article] [PubMed] [Google Scholar]
- 25.Pfeiffer, M., Rink, T., Gerwert, K., Oesterhelt, D. & Steinhoff, H.-J. (1998) J. Mol. Biol., in press. [DOI] [PubMed]
- 26.Heberle, J., Büldt, G., Koglin, E., Rosenbusch, J. P. & Landau, E. M. (1998) J. Mol. Biol., in press. [DOI] [PubMed]
- 27.Krebs M P, Li W, Halambeck T P. J Mol Biol. 1997;267:172–183. doi: 10.1006/jmbi.1996.0848. [DOI] [PubMed] [Google Scholar]
- 28.Weik M, Patzelt H, Zaccai G, Oesterhelt D. Mol Cell. 1998;1:411–419. doi: 10.1016/s1097-2765(00)80041-6. [DOI] [PubMed] [Google Scholar]
- 29.Heberle J, Riesle J, Thiedemann G, Oesterhelt D, Dencher N A. Nature (London) 1994;370:379–382. doi: 10.1038/370379a0. [DOI] [PubMed] [Google Scholar]
- 30.Riesle J, Oesterhelt D, Dencher N A, Heberle J. Biochemistry. 1996;35:6635–6643. doi: 10.1021/bi9600456. [DOI] [PubMed] [Google Scholar]
- 31.Sass H J, Gessenich R, Koch M H J, Oesterhelt D, Dencher N A, Büldt G, Rapp G. Biophys J. 1998;75:399–405. doi: 10.1016/S0006-3495(98)77524-1. [DOI] [PMC free article] [PubMed] [Google Scholar]
- 32.Subramaniam S, Faruqi A R, Oesterhelt D, Henderson R. Proc Natl Acad Sci USA. 1997;94:1767–1772. doi: 10.1073/pnas.94.5.1767. [DOI] [PMC free article] [PubMed] [Google Scholar]
- 33.Balashov S P, Imasheva E S, Govindjee R, Ebrey T G. Biophys J. 1996;70:473–481. doi: 10.1016/S0006-3495(96)79591-7. [DOI] [PMC free article] [PubMed] [Google Scholar]
- 34.Richter H T, Brown L S, Needleman R, Lanyi J K. Biochemistry. 1996;35:4054–4062. doi: 10.1021/bi952883q. [DOI] [PubMed] [Google Scholar]
- 35.Brown L S, Sasaki J, Kandori H, Maeda A, Needleman R, Lanyi J K. J Biol Chem. 1995;270:27122–27126. doi: 10.1074/jbc.270.45.27122. [DOI] [PubMed] [Google Scholar]
- 36.Balashov S P, Imasheva E S, Ebrey T G, Chen N, Menick D R, Crouch R K. Biochemistry. 1997;36:8671–8676. doi: 10.1021/bi970744y. [DOI] [PubMed] [Google Scholar]
- 37.Dioumaev A K, Richter H T, Brown L S, Tanio M, Tuzi S, Saito H, Kimura Y, Needleman R, Lanyi J K. Biochemistry. 1998;37:2496–2506. doi: 10.1021/bi971842m. [DOI] [PubMed] [Google Scholar]
- 38.Rammelsberg R, Huhn G, Lübben M, Gerwert K. Biochemistry. 1998;37:5001–5009. doi: 10.1021/bi971701k. [DOI] [PubMed] [Google Scholar]
- 39.Hobe S, Prytulla S, Kühlbrandt W, Paulsen H. EMBO J. 1994;13:3423–3429. doi: 10.1002/j.1460-2075.1994.tb06647.x. [DOI] [PMC free article] [PubMed] [Google Scholar]
- 40.Luecke H, Richter H-T, Lanyi J K. Science. 1998;280:1934–1937. doi: 10.1126/science.280.5371.1934. [DOI] [PubMed] [Google Scholar]
- 41.Lehmann W D. J Am Soc Mass Spectrom. 1997;8:756–759. [Google Scholar]
- 42.Kraulis P J. J Appl Crystallogr. 1991;24:946–950. [Google Scholar]
- 43.Merrit E A, Murphy M E P. Acta Crystallogr D. 1994;50:896–873. doi: 10.1107/S0907444994006396. [DOI] [PubMed] [Google Scholar]
- 44.Nicholls A. grasp: Graphical Representation and Analysis of Surface Properties. New York: Columbia University; 1992. [Google Scholar]
- 45.Kleywegt G J, Jones T A. Acta Crystallogr D. 1994;50:178–185. doi: 10.1107/S0907444993011333. [DOI] [PubMed] [Google Scholar]