

Abstract
In contrast to terminally differentiated cardiomyocytes, relatively little is known about the characteristics of mammalian cardiac cells before the initiation of spontaneous contractions (precursor cells). Functional studies on these cells have so far been impossible because murine embryos of the corresponding stage are very small, and cardiac precursor cells cannot be identified because of the lack of cross striation and spontaneous contractions.
In the present study, we have used the murine embryonic stem (ES, D3 cell line) cell system for the in vitro differentiation of cardiomyocytes. To identify the cardiac precursor cells, we have generated stably transfected ES cells with a vector containing the gene of the green fluorescent protein (GFP) under control of the cardiac α-actin promoter. First, fluorescent areas in ES cell–derived cell aggregates (embryoid bodies [EBs]) were detected 2 d before the initiation of contractions. Since Ca2+ homeostasis plays a key role in cardiac function, we investigated how Ca2+ channels and Ca2+ release sites were built up in these GFP-labeled cardiac precursor cells and early stage cardiomyocytes. Patch clamp and Ca2+ imaging experiments proved the functional expression of the L-type Ca2+ current (ICa) starting from day 7 of EB development. On day 7, using 10 mM Ca2+ as charge carrier, ICa was expressed at very low densities 4 pA/pF. The biophysical and pharmacological properties of ICa proved similar to terminally differentiated cardiomyocytes. In cardiac precursor cells, ICa was found to be already under control of cAMP-dependent phosphorylation since intracellular infusion of the catalytic subunit of protein kinase A resulted in a 1.7-fold stimulation. The adenylyl cyclase activator forskolin was without effect. IP3-sensitive intracellular Ca2+ stores and Ca2+-ATPases are present during all stages of differentiation in both GFP-positive and GFP-negative cells. Functional ryanodine-sensitive Ca2+ stores, detected by caffeine-induced Ca2+ release, appeared in most GFP-positive cells 1–2 d after ICa. Coexpression of both ICa and ryanodine-sensitive Ca2+ stores at day 10 of development coincided with the beginning of spontaneous contractions in most EBs.
Thus, the functional expression of voltage-dependent L-type Ca2+ channel (VDCC) is a hallmark of early cardiomyogenesis, whereas IP3 receptors and sarcoplasmic Ca2+-ATPases are expressed before the initiation of cardiomyogenesis. Interestingly, the functional expression of ryanodine receptors/sensitive stores is delayed as compared with VDCC.
Keywords: GFP, cardiac α-actin promoter, in vitro cardiomyogenesis, ion channels, Ca2+
The heart is the first organ to be formed during murine embryonic development. Between E7.5 and E8, the generation of a single heart tube is initiated, and from E8.5 to E9 the first contractions of this primitive structure are observed (Fishman and Chien, 1997). While the heart undergoes further changes during later stages of development, essential components responsible for the initiation of regular contractile activity are already established at this early stage. Indeed, the first transcripts of sarcomeric contractile proteins are already detectable on E7.5 (Sassoon et al., 1988; Sanchez et al., 1991). There is only sparse knowledge of the sequential expression of ion channels and Ca2+ release stores, both playing a fundamental role in cardiac function at these initial stages of development. For terminally differentiated cardiomyocytes, it is well established that voltage-dependent L-type Ca2+ channels (VDCC)1 are responsible for transmembrane Ca2+ influx which secondarily leads to Ca2+ induced Ca2+ release (CICR) (Fabiato, 1985; du Bell and Houser, 1987; Barcenas-Ruiz and Wier, 1987; Nabauer et al., 1989) from the sarcoplasmatic reticulum (SR) through ryanodine sensitive Ca2+ stores (Meissner, 1994). The calcium-induced calcium release (CICR)-mediated increase of the free cytosolic Ca2+ concentration ([Ca2+]i) is a prerequisite for cardiac contraction. Increased [Ca2+]i is lowered by reuptake via the thapsigargin (Tg)-sensitive sarcoplasmic Ca2+-ATPase and extrusion via the Na+-Ca2+ exchanger as well as the sarcolemmal Ca2+-ATPase (Bers, 1997). Even though changes in the regulation of VDCC during cardiac development have been reported for E11–13 murine cardiomyocytes (Davies et al., 1996), as well as for the perinatal stage (Tohse et al., 1992a ,b; Masuda et al., 1995) and ES cell–derived cardiomyocytes (Maltsev et al., 1994), when and how cardiomyocytes differentiating from the mesodermal lineage establish intracellular Ca2+ stores and the regulation of VDCC remains obscure. The latter mechanism plays a key role in the adult heart for the control by the autonomic nervous system (Osterrieder et al., 1982; Reuter, 1983; Hartzell and Fischmeister, 1986; Trautwein and Hescheler, 1990).
The aim of the present study was to investigate the expression and regulation of VDCC as well as of the establishment of Ca2+ release channels in single cardiomyocytes before the initiation of spontaneous contractions (cardiac precursor cells). Studies on these early stage cells from murine embryos have not been performed so far because the heart is very small at this stage, and isolation procedures have proved impossible before stage E11 (An et al., 1996; Davies et al., 1996).
In the past, we have used embryonic stem (ES) cells for the in vitro differentiation and isolation of cardiomyocytes to circumvent this problem (Wobus et al., 1991; Maltsev et al., 1994). However, at the very early stages of development, cardiomyocytes cannot be recognized even in vitro because of the lack of cross striation and beating (Davies et al., 1996; Hescheler et al., 1997). To identify these cardiac precursor cells, we have established ES cell clones stably transfected with the gene of the jellyfish Aequorea victoria green fluorescent protein (GFP) (Prasher et al., 1992; Chalfie et al., 1994) under control of a cardiac-specific promoter. Since transcripts of α-actin are among the earliest detectable in the developing heart (Sassoon et al., 1988; Lyons et al., 1991), and its expression was shown to be cardiac specific in the ES cell system before the initiation of spontaneous contractions (Metzger et al., 1996), we have chosen the cardiac α-actin promoter to drive the GFP expression. Based on a well-established protocol (Doetschman et al., 1985; Wobus et al., 1991; Metzger et al., 1995), ES cells were differentiated into cell aggregates (embryoid bodies [EBs]) containing cardiomyocytes. The first spontaneously beating areas are noticed in 9-d-old EBs. In 15– 18-d-old EBs, terminally differentiated cardiomyocytes are detected with almost identical morphological and electrophysiological features as murine perinatal cardiomyocytes (Hescheler et al., 1997).
Taking advantage of the tissue-specific GFP expression in ES cell–derived cardiomyocytes, we here describe the functional characterization of cardiac precursor cells with patch clamp and Ca2+ imaging techniques. We demonstrate that VDCC are already expressed at very low density in 7-d-old cardiac precursor cells and stimulated via cAMP-dependent protein kinase A (PKA)-dependent phosphorylation. However, the functional expression of ryanodine-sensitive Ca2+ receptors/stores was delayed in most cells compared with VDCC, and their coexpression coincided with the onset of spontaneous contractions.
Materials and Methods
Vectors
The pCX-EGFP expression vector containing the enhanced version of the GFP coding sequence EGFP (CLONTECH Laboratories, Palo Alto, CA) under the chicken β-actin promoter (Ikawa et al., 1995; Okabe et al., 1997) was provided by Dr. Okabe (University of Osaka, Japan) and modified as follows: The vector pPv/B-Act-lacZ containing the (−440 to +6) segment of the human cardiac α-actin promoter (Minty and Kedes, 1986; Pari et al., 1991) was provided by Dr. M.W. McBurney (University of Ottawa, Canada). The promoter was excised from pPv/B-Act-lacZ by SalI and HindIII restriction enzymes. The pCX-EGFP was digested with SnaBI and ApaI restrictases to excise the chicken β-actin promoter, which was replaced by the above mentioned SalI-HindIII fragment of the cardiac α-actin promoter by blunt-end ligation. Then, SalI-XbaI restriction fragment containing the Neomycin (G418) resistance gene from pTL2 NeoR (provided by Dr. Tarakhovsky, Institute for Genetics, Cologne, Germany) was inserted by blunt-end ligation in the SalI site of pCX-EGFP. The resulting vector pCX-(α-act)-EGFP-NeoR was used for electroporation of ES cells of the line D3. ES cells were cultured on fibroblast feeder layers in DME supplemented with 15% FCS (GIBCO BRL; Life Technologies, Gaithersburg, MD), 1× nonessential amino acids (GIBCO BRL) and 0.1 mM β-mercaptoethanol (Sigma Chemical Co., St. Louis, MO).
Electroporation and Selection Procedure
pCX-(α-act)-EGFP-NeoR was linearized by AatII restrictase to linearize the vector and destroy the CMV-enhancer. Electroporation and G418 selection was performed according to standard protocols. The pCX-(α-act)- EGFP-NeoR–transfected ES clones with GFP fluorescence comparable to wild-type ES cells were selected using FACS® and used for the differentiation protocol. EBs were generated using standard protocols as previously described (Wobus et al., 1991). In brief, hanging drops were established by plating a suspension of ES cells in final concentration of 0.020–0.025 × 10⁶ cells/ml in 20 μl (400–500 cells) of DME + 20% FCS on the lids of bacterial dishes. After incubation at 37°C, 5% CO2 for 2 d, the growing EBs were washed out with 10 ml DME + 20% FCS into bacterial dishes and incubated for an additional 4 d. Then, EBs were plated separately on gelatine-pretreated 24-well plates. During all stages of development, growing EBs were monitored under the fluorescent microscope using an FITC filter set (Zeiss, Jena, Germany).
Since the investigated clones were selected using G418, their characteristics may differ from wild-type ES cells. For this reason, several clones (A1, A10, A12, and A17) were tested. No difference between selected clones and parental cell line in regard to differentiation and initiation of spontaneous contractions was noticed.
FACS®
For FACS® analysis, 10–20 EBs of different stages of development were washed with PBS and then dissociated to a single cell suspension by trypsin treatment for 2–3 min (120 μl of trypsin/EDTA solution). Then, 1 ml of DME + 20% FCS was added to the single-cell suspension. After centrifugation (1,000 rpm) for 5 min, the cells were resuspended in 0.5–1.0 ml of PBS containing Ca2+ (1 mM) and Mg2+ (0.5 mM).
The GFP expression by ES cell–derived cells of different age was analyzed on a FACSCalibur™ flow cytometer (Becton Dickinson) equipped with a 488-nm argon-ion laser (15 mW). Cells were resuspended to a concentration of 5 × 10⁵ cells/ml in PBS (pH 7.0, 0.1% BSA) and then analyzed on the FACSCalibur™ with a minimum of 10,000 viable cells acquired for each sample. The emitted fluorescence of GFP was measured at 530 nm (FITC band pass filter). Live gating was done by addition of propidium iodide (2 μg/ml) to the samples immediately before measurement. Necrotic cells with a positive propidium iodide staining (585-nm band pass filter) showed higher side scattering signals compared with the viable PI-negative cells. Nonviable cells were excluded from the subsequent analysis by gating on cells with low SSC signals. Nontransfected ES cells of the cell line D3 were used for negative controls. Analyses were performed using CellQuest® software (Becton Dickinson).
Dissociation of EBs and Preparation of Single Cardiomyocytes
For the experiments using single cells, whole EBs, or for the later stages, beating areas of 20–30 EBs were dissected and isolated by enzymatic dispersion, using collagenase B (Boehringer, Ingelheim, Germany), as described in more detail by Maltsev et al. (1994). The solution used for the dissociation of the dissected areas was the following (in mmol/L): 120 NaCl, 5.4 KCl, 5 MgSO4, 0.03 CaCl2, 5 Na pyruvate, 20 glucose, 20 taurine, 10 Hepes, and 0.5–1 mg/ml collagenase B, pH 6.9 (NaOH). The dissociated material was plated onto gelatine-coated glass coverslips and put into the incubator in 20% FCS containing DME.
Immunocytochemistry
Single, enzymatically dissociated ES cell–derived cells (11–14 d) were plated on gelatin-covered glass coverslips overnight. Cells were subsequently fixed in a solution containing 4% paraformaldehyde in 0.1 M PBS buffer, pH 7.4, for 15 min. After fixation, single-cell preparations were washed several times in 0.1 M PBS and further treated with 0.1% Triton X-100 (Sigma, Deisenhofen, Germany) in PBS-A (PBS containing 0.2% acide, 0.01 glycine, and 0.002% Triton X-100). The following primary antibodies were used: mouse monoclonal anti–α-actinin (sarcomeric), mouse monoclonal anti–α-sarcomeric actin (Sigma), and rabbit polyclonal anti– atrial natriuretic peptide (ANP; Biotrend, Köln, Germany). The secondary antibodies used were biotinylated goat anti–mouse (Vector Laboratories, Inc., Burlingame, CA), Cy3-labeled extravidin (Sigma), Cy3-labeled purified goat anti–rabbit IgG (Rockland Immunochemicals, Gilbertville, PA), and streptavidin–horseradish peroxidase conjugate (Amersham International, Buckinghamshire, UK). After BSA block (5% BSA in PBS), cells were treated with murine primary antibodies to α-actin diluted 1:800 or to α-actinin diluted 1:600 in 0.8% BSA/PBS buffer at 4°C overnight. Thereafter, cells were treated with a biotinylated IgG goat anti–mouse antibody at the dilution indicated by the manufacturer. Fluorescence labeling was performed with extravidin Cy3 diluted 1:600. For ANP detection, single cells were treated with ANP antibody at 4°C overnight in a dilution of 1:500 followed by treatment with anti-rabbit antibody (1:800) for 1 h at room temperature. Single-cell preparations were observed through filter set 10 (Zeiss; excitation BP 45–490, emission BP 515–565), which allows recognition of GFP fluorescence, and filter set 15 (Zeiss; excitation BP 546/12, emission LP 590) for recognition of Cy3-labeled cells. Alternatively, for some experiments a streptavidin–horseradish peroxidase complex was used as detection system (1:200 incubation for 1 h at room temperature). The staining was developed for 15 min with 3,3-diaminobenzidine-tetrahydrochloride (DAB) in 5 mM Tris-HCl buffer, pH 7.4, supplemented with 0.1% H2O2. Analysis was performed using an Axiophot microscope (Zeiss).
Ca2+ Imaging Experiments
Monochromic excitation light (340, 380, and 488 nm) was generated by a computer-controlled monochromator (TIL Photonics, Planegg, Germany) and coupled to the epifluorescence attachment of an inverted microscope (model 135M; Zeiss) through a small quartz light guide. The excitation light was directed to the oil immersion objective (40×; Zeiss) via a fura-2 (TIL Photonics) or a FITC filter block (AHF, Tübingen, Germany). The emitted fluorescence was imaged through a 470/525-nm interference filter using an intensified charge coupled device camera (Thetha, München, Germany) connected to the TV port of the microscope. Fluorescence images (50–100-ms exposure time) were acquired at a rate of 0.33 Hz using the Fucal fluorescence software package (TIL Photonics). The analysis was done off-line using the Fucal software package. Paired 340/380 images within cursor defined areas of interest were background subtracted and displayed as ratio images. These were converted into [Ca2+]i using the equation of Grynkiewicz et al. (1985). In situ calibration factors, R max obtained in the presence of ionomycin and 10 mM Ca2+ and Rmin in the presence of excess EGTA, were determined in a series of experiments, and these average values were used to calculate [Ca2+]i. The values used for R max, R min, and F380max/F380min were 4.3, 0.44, and 3.94 for ES cells, 2.18, 0.33, and 3.57 for EBs, and the dissociation constant was assumed to be 224. For the estimation of the GFP fluorescence intensity, the whole area of the cell was integrated, and average fluorescence intensities were determined in counts. GFP fluorescence produced only minimal interference in fura-2AM–loaded cells. The composition of the recording solutions used was the following (in mM): 135 NaCl, 5 KCl, 2 CaCl2, 2 MgCl2, 5 Hepes, 10 glucose, pH 7.4 (NaOH). For the high K+ solution, the composition was 135 KCL, 5 NaCl, 2 MgCl2, 2 CaCl2, 5 Hepes, 10 glucose, pH 7.4 (KOH). For some experiments, the following solution was used: 70 KCL, 70 NaCl, 2 MgCl2, 2 CaCl2, 5 Hepes, 10 glucose, pH 7.4 (KOH). High K+ solution was perfused into the chamber, providing a complete exchange in less than 20 s. Tg was bath added, and caffeine was applied through a puffer pipette (General Valve, Fairfield, MA). All experiments were performed at 37°C.
Patch Clamp Recordings of ICa
Standard whole-cell recording techniques (Hamill et al., 1981) were used (model Axopatch 200A amplifier; Axon Instruments, Foster City, CA). Data were acquired using the Iso2 software package (MFK, Niedernhausen, Germany), sampled at 2 kHz and stored on hard disk. All patch clamp experiments were performed at room temperature. Pipettes were made on a DMZ Universal Puller (München, Germany) from 1.5-mm borosilicate glass capillaries (Clark Electromedical Instruments, Reading, UK). The compositions of the different recording solutions used were (in mM) extracellular solution: 135 NaCl, 5 KCl, 10 CaCl2, 2 MgCl2, 5 Hepes, 10 glucose, pH 7.4 (NaOH); and pipette solution: 55 CsCl, 80 Cs2SO4, 2 MgCl2, 10 Hepes, 10 EGTA, 1 CaCl2, 5 ATP (Mg), pH 7.4 (CsOH).
ICa was evoked by 50-ms depolarizing voltage steps from a holding potential of −80 mV to a step potential of 10 mV at a frequency of 0.2 Hz. Current–voltage relationships were obtained by stepping from a holding potential of −80 mV to step potentials between −40 mV to +40 mV in 10-mV intervals. Pharmacological agents were applied through an application pipette.
Experiments Using Intracellular Dialysis of IP3
For the investigation of IP3-sensitive Ca2+ stores, pipettes were filled with the following solution (in mM): 135 CsCl, 10 MgCl2, 10 Hepes, 0.015 EGTA, 0.125 Fura-2 acid, 0.1 IP3, pH 7.2 (CsOH) (see also Parekh et al., 1997). After obtaining a gigaohm-seal, the cell of interest was perfused locally with nominally Ca2+-free extracellular solution. Imaging at excitation wavelengths of 360/390 nm was started at a rate of 4 Hz, and the classic whole-cell configuration was established (HP = −80 mV). The analysis of changes of [Ca2+]i was performed as described in the imaging section. When IP3 was omitted from the intracellular solution, no increase in 360/ 390 ratio was observed.
Test Substances
IP3 (Calbiochem, Bad Soden, Germany) and the catalytic subunit of protein kinase A (Promega, Heidelberg, Germany) were dissolved in water and frozen at −20°C. Tg (Molecular Probes, Leiden, The Netherlands) was dissolved in DMSO, Nisoldipine (Bayer, Leverkusen, Germany), and BayK8644 (Bayer) were dissolved in 30% ethanol. All remaining substances were obtained from Sigma. Stock solutions were prepared fresh or defrozen before use and diluted in extracellular solution or culture medium to the final concentration for superfusion of the recording chamber (patch clamp) or added to the bath. The final concentration of the solvent was below 0.05%. Averaged data are expressed as mean ± SEM.
Results
Establishment and Specificity of the Cardiac α-Actin Promoter–driven GFP Expression and Identification of Cardiac Precursor Cells
First, we investigated whether GFP could be stably expressed in ES cells under control of the α-actin promoter and what pattern of GFP expression could be observed during differentiation The pCX-(α-act)-EGFP-NeoR–transfected ES cells as well as EBs before plating (Fig. 1, A and B) displayed only weak fluorescence under microscopic observation. However, at the 7-d stage, i.e., 1 d after plating, areas with distinct fluorescence could be detected (data not shown). Most of these GFP-positive areas developed 48–72 h later into spontaneously contracting regions (Fig 1, C and D). During all stages of cardiomyogenesis, strong fluorescence was exclusively detected in these beating areas (Fig. 1, C and D). This overlap between GFP expression and beating clearly indicated the cardiac specificity of the human cardiac α-actin promoter.
Figure 1.

GFP expression under control of the human cardiac α-actin promoter during differentiation of ES cells. ES cells were electroporated with the pCX-(α-act)- EGFP-NeoR vector. (A and B) 5-d-old EBs (clone E4) in suspension displayed low GFP fluorescence (B). (C and D) 3 d after plating (9-d-old EB), only spontaneously beating areas showed strong GFP fluorescence. (A) Transmission light. (B and D) Fluorescence acquired with an FITC filter block. (C) Combined fluorescence and transmission light. Bar, 200 μm.
The microscopic pattern of GFP expression was quantitatively assessed using FACS®. The profile of pCX-(α-act)- EGFP-NeoR–transfected ES cells confirmed low fluorescence intensities at the ES cell stage (Fig. 2 B) comparable to nontransfected wild-type ES cells (Fig. 2 A). During EB development, an enlargement of the initial peak to higher fluorescence intensities was observed. In some clones, particularly with low initial fluorescence (Fig. 2 B, 0d), the appearance of a second peak corresponding to GFP-expressing cells was noticed (Fig. 2 B, 7d and 12d). In 7-d-old EBs, the fraction of GFP-positive cells amounted to 30–50% of the whole EB. The FACS® profile of EBs containing clusters of spontaneously contracting cardiomyocytes showed a further broadening of the fluorescent peak to higher fluorescence intensities (Fig. 2 B, 12d), possibly corresponding to the contracting cardiomyocytes. This was corroborated by measuring GFP fluorescence intensities of single cells isolated from EBs at different stages of development. Very low fluorescence levels were detected in 0–4-d-old cells, but a clear increase and diversification of the GFP fluorescence intensity was observed in cells from 8 d and more prominently from 10-d-old EBs. The highest fluorescence intensities were detected in spontaneously beating cardiomyocytes (data not shown).
Figure 2.
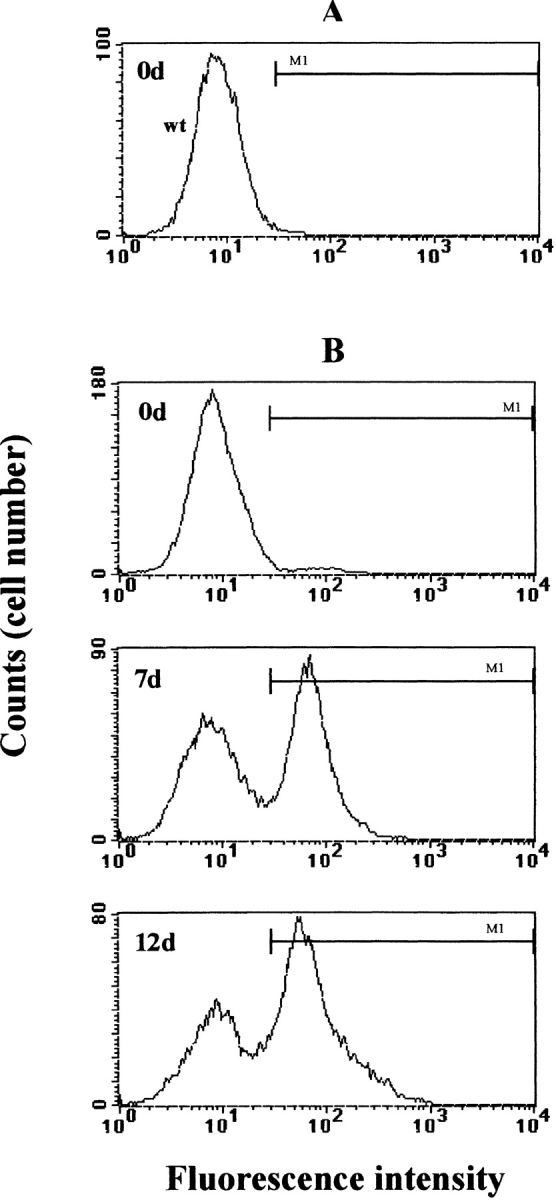
FACS® profiles of ES cells and EB-derived cells expressing GFP under control of the human cardiac α-actin promoter (pCX-(α-act)-EGFP-NeoR). FACS® analysis was performed on different stages of EB development as indicated in the upper left corners. The M1 bar marks the range of GFP fluorescence. GFP fluorescence intensities of nontransfected ES cells (wt, A) and pCX-(α-act)-EGFP-NeoR–transfected ES cells (B) were similar and characterized by low fluorescence intensities. ES cells carrying the cardiac pCX-(α-act)-EGFP-NeoR develop a fluorescent peak of high intensity during differentiation of EBs (7d and 12d). After appearance of spontaneously contracting cardiomyocytes, a further enlargement to higher fluorescence intensities was observed (12d).
The specificity of the GFP expression in pCX-(α-act)- EGFP-NeoR–transfected ES cells was further corroborated by immunocytochemistry on single ES cell–derived cells. GFP expression under the α-cardiac actin promoter proved to be tightly correlated with α-actin antibody staining (Fig. 3, A and B). Almost all (95%) of the GFP-positive cells (11 and 14 d) showed α-actin costaining (n = 343). Furthermore, the GFP-positive cells displayed morphological features typical for cardiomyocytes. Early stage cardiomyoctes were small and round and showed a homogeneous distribution of myofilament specific proteins (Fig. 3, A and B) (Hescheler et al., 1997). Late-stage cardiomyocytes were elongated with a typical pattern of condensed α-actinin, indicating the development of sarcomeres. In the late-stage cells, 93% of the GFP-expressing cells were α-actinin positive (Fig. 3, C and D; n = 96, 11–14 d).
Figure 3.

Immunocytochemical pattern of α-actin and α-actinin staining in single ES cell–derived cells expressing GFP under control of the human cardiac α-actin promoter. (A and B) Immunostaining with α-actin antibody of a GFP-positive cell. This cell displayed characteristic morphological features for an early stage cardiomyocyte with the typical round shape morphology and the low cytoplasm/nucleus ratio. (A) The GFP-derived fluorescence was spread over the whole cell. (B) The α-actin immunofluorescence was primarily expressed in the perinuclear region. (C and D) Comparison of GFP expression under control of the human cardiac α-actin promoter and α-actinin immunoreaction of a more elongated, late-stage cardiomyocyte. (C) In this more differentiated cardiomyocyte, the GFP fluorescence was spread over the entire cell. (D) The α-actinin immunofluorescence displayed a typical cross pattern, indicating sarcomeric organization in this cardiomyocyte. Bar, 10 μm.
Since 7-d-old GFP-positive cells had low α-actin content and did not yet display morphological features typical for cardiomyocytes, the more sensitive DAB method for immunostaining was used. 32% of 7-d-old cells were DAB positive (n = 191), whereas only 3.7% of DAB-positive cells (n = 161) were detected in undifferentiated D3 cells. This percentage of α-actin–containing cells corresponded well with the fraction of GFP-positive cells revealed with FACS® in 7-d-old EBs. To confirm further that GFP-positive cells (7–9 d) were indeed cardiac precursor cells staining with ANP, known to be expressed at early stages of cardiomyogenesis but not skeletal myogenesis (Miller-Hance et al., 1993; Hescheler et al., 1997), was performed. All GFP-positive cells were ANP positive (data not shown), unequivocally proving their cardiac nature.
VDCC Are Expressed in α-Actin Promoter–driven GFP-positive Cardiac Precursor Cells and Upregulated by Protein Kinase A
Initially, electrophysiological experiments were performed on several GFP-positive clones (A1, A10, and A17), and no difference in their characteristics between the parental ES cell line D3 and the different clones were noticed. For the functional investigation of GFP-positive cells presented in this study, cell clones (A1 and A17) were chosen in which the fluorescence of ES cells was comparable to wild-type ES cells but at later stages developed a second fluorescent peak observed with FACS®. These clones allowed the easy detection of GFP-positive cells already at the cardiac precursor stage. All EBs used for the isolation of single cells before 9 d of differentiation did not contain contracting areas.
First, we investigated at which time point ICa becomes functionally active during very early cardiac development. Single-cell Ca2+ imaging was performed, using the cell membrane–permeant Ca2+ indicator fura-2AM. From all cells within the visual field GFP fluorescence was determined, thereafter [Ca2+]i was monitored. GFP-positive and -negative cells were characterized by stable resting [Ca2+]i of 92.7 ± 10.5 nM (n = 10) and of 91.7 ± 9.8 nM (n = 10), respectively. As shown in Fig. 4 A, application of the dihydropyridine BayK8644 (0.5 μM), a selective opener of VDCC, led to a [Ca2+]i increase in a GFP-positive cell associated with [Ca2+]i oscillations (n = 2). Combined superfusion of BayK8644 and high K+ (140 mM) solution evoked a sustained increase of [Ca2+]i. Nisoldipine (0.5 μM), a selective blocker of VDCC, led to a decline of [Ca2+]i close to baseline levels (Fig. 4 A, n = 8), indicating the exclusive involvement of ICa. The [Ca2+]i increase evoked by coapplication of BayK8644 and high K+ solution was 252 ± 37 nM (n = 6) in 8-d-old cells. There was no change of [Ca2+]i in cells with no or only weak GFP fluorescence (Fig. 4 B, n = 20).
Figure 4.


Functional expression of VDCC determined with Ca2+ imaging in single GFP-positive cells of different stages. Single ES cell– derived cells were loaded with the membrane-permeant form of the Ca2+ indicator fura-2. First, individual cells were tested for their GFP fluorescence using 488-nm excitation light (1 s) and an FITC filter block. Then, the cytosolic Ca2+ concentration [Ca2+]i was monitored using a fura-2 filter block and 340/380 excitation light. The recording chamber was subsequently perfused with BayK8644/high K+–containing solution to depolarize the membrane potential and test for the functional expression of VDCC. (A) A GFP-positive cell, with an oscillatory [Ca2+]i increase upon application of the selective VDCC agonist BayK8644 (0.5 μM). Subsequent perfusion of BayK8644 and high K+ (140 mM) leads to a sustained increase in [Ca2+]i, which was blocked by the selective VDCC antagonist nisoldipine (0.5 μM). (B) In a GFP-negative cell, application of BayK8644/high K+ did not induce changes of [Ca2+]i. (C) GFP fluorescence intensities and the functional expression of VDCC proved strongly correlated. Cells derived from 6-d-old EBs had low GFP fluorescence and no changes in [Ca2+]i upon BayK8644/high K+ perfusion. On 7 d, only one cell displayed a [Ca2+]i increase upon BayK8644/ high K+ perfusion, but no difference in GFP fluorescence was detected. 8-d and older cells that expressed VDCC also displayed high GFP fluorescence intensities.
In 187 cells, the correlation between GFP fluorescence intensities and the functional expression of VDCC was investigated. As demonstrated in Fig. 4 C, a rise of [Ca2+]i upon superfusion with BayK8644/high K+ was observed as early as 7 d, and at that time only in one cell. This cell did not display a difference in the GFP fluorescence intensity compared with nonresponding cells (Fig. 4 C). In the later stages (8–11 d), there was a clear correlation between GFP intensity and the expression of VDCC, seen by a rise in [Ca2+]i upon superfusion with BayK8644/high K+ solution. On 9–11 d, almost all cells with bright GFP fluorescence responded to BayK8644/high K+ with a large increase of [Ca2+]i (1052.9 ± 223.8 nM, n = 20). Thus, at this stage of development the GFP expression was strongly correlated with ICa expression.
The experiments using Ca2+ imaging demonstrated that ICa was already functionally expressed during the initial steps of cardiomyogenesis. To investigate in more detail the biophysical profile, current density, and the regulation of ICa in cardiac precursor cells, we performed whole-cell patch clamp experiments on GFP-positive cells. These were identified using a fluorescence microscope. In control experiments, we found that ICa was, besides small amplitude K+ currents, the prominent ion channel detected at this early stage of development. Since initial experiments showed, that ICa was expressed at very low densities, 10 mM Ca2+ as charge carrier was used. ICa was evoked applying depolarizing voltage steps from a holding potential of −80 mV to a test potential of +10 mV. The earliest time point at which ICa could be detected was 7 d. As can be seen in Fig. 5 A, the current–voltage relationship of ICa in a 7-d-old cardiac precursor cell proved to be similar to that of an 9-d-old cardiomyocyte (Fig. 5 B). The threshold of activation was close to −40 mV, and peak ICa was measured at +10 mV (Fig. 5, A and B). ICa was detected in 22.2% of the GFP-positive 7-d-old cells, but at very low density (3.8 ± 1.3 pA/pF, n = 54) (Fig. 5, C–E). The percentage of GFP-positive cells expressing ICa increased dramatically within the next 24 h and was close to 80% at 10 d (Fig. 5 D). GFP-negative cells did not express VDCC in 7–10-d-old EBs (n = 20; Fig. 5 C). The current was identified as cardiac ICa on the basis of its fast activation kinetics, current– voltage relationship (Fig. 5), and sensitivity to nisoldipine (2 μM, n = 2) (Fig. 6 A). To show the blocking effect of nisoldipine more clearly, the mean current for peak ICa before and after addition of the drug is shown (Fig. 6 A, 1 and 2, dotted line) in the time course (Fig. 6 A, right). The biophysical and pharmacological characteristics excluded that functional T-type and/or the skeletal muscle–specific slow-activating Ca2+ current reported for ES cell–derived skeletal myocytes (Rohwedel et al., 1994) were expressed in GFP-positive precursor cells.
Figure 5.

Patch clamp recordings of L-type Ca2+ currents (ICa) in GFP-positive ES cell–derived cells (10 mM extracellular Ca2+). For the recording of the current-voltage relationship, cells were voltage clamped in the whole-cell configuration at a holding potential of −80 mV, and 50-ms depolarizing voltage steps were applied from −40 mV to +40 mV in 10-mV increment steps. The current–voltage relationship of 7-d (A) and 9-d (B) cells was similar. The threshold for activation was typically around −40 mV and peak currents at +10 mV. The expression of ICa was investigated in GFP-negative and -positive cells. (C) ICa was detected only in GFP-positive cells. (C and D) ICa was not detected before 7 d, and in the following days a clear increase in the peak current amplitude was observed. (D) Correlation between differentiation stage and number of GFP-positive cells expressing ICa. (E) Peak ICa densities increased with increasing age of EB-derived cells (same cell population as in C).
Figure 6.

Pharmacology and modulation of ICa in 7-d-old GFP-positive cells. 7-d-old GFP-positive cells were voltage clamped at −80 mV, and 50-ms depolarizing pulses to +10 mV were applied at a frequency of 0.2 Hz (10 mM extracellular Ca2+). (A) Application of the VDCC selective antagonist nisoldipine (1 μM) blocked ICa, (current traces, left), confirming that the inward current was ICa. The time course (right) demonstrated that ICa was blocked upon nisoldipine application. Every single point in the time course represents the peak ICa evoked by a depolarizing voltage step, and the numbers indicate the voltage steps displayed on the left side. The two horizontal lines represent the mean current level taken before and after addition of nisoldipine. Initially, the mean current was stable, and after nisoldipine addition, ICa was completely blocked. (B) Superfusion with the adenylyl-cyclase activator forskolin (1 μM) did not increase the ICa amplitude. The mean current level in the time course remains unaltered, confirming that forskolin was without effect. (C) Dialysis with the catalytic subunit of PKA (7 μM) led to an increase of ICa. This can also be seen from the linear regression displayed in the time course. (D) A quantitative comparison of the development of ICa in 7-d-old GFP-positive cells in the absence (gray bar) and in the presence of the catalytic subunit of PKA (black bar) is shown. The relationship of the peak current after 5 min and after 1 min is shown. In the control group, a reduction of ICa over time, probably because current run down, was noted. In contrast, ICa, increased in the presence of the catalytic subunit of PKA, indicating that at this early stage the VDCC can already be phosphorylated.
Next, we investigated the regulation of ICa in these cardiac precursor cells. Superfusion with forskolin (1 μM), a selective activator of the adenylyl-cyclase, did not result in an increase of ICa (Fig. 6 B) in 7-d-old cells, indicating that the cAMP-dependent pathway was not yet functional. A characteristic property of the L-type Ca2+ channel is the increase in current amplitude upon phosphorylation by PKA (Osterrieder et al., 1982). Therefore, we tested whether ICa could be stimulated by dialysis with the catalytic subunit of PKA in 7-d-old cardiac precursor cells. The amplitude of ICa measured after 5 min cell dialysis with the catalytic subunit of PKA was normalized to the value obtained after 1 min. As seen in Fig. 6 D, four out of four cells tested displayed an increase of peak ICa, (the average increase of peak ICa amounts to 1.7-fold). This is also reflected in the time course of peak ICa (Fig. 6 C, right; note the linear regression superimposed on the time course). In control cells, either stable ICa amplitudes or run down of ICa was observed (n = 5; Fig. 6 D).
Functional Ryanodine-sensitive Ca2+ Stores Are Detected Later than ICa in Most Early Stage Cardiomyocytes; IP3 Receptors and the Sarco-/Endoplasmic Ca2+-ATPase Are Found during All Differentiation Stages
For the investigation of functional ryanodine-sensitive Ca2+ stores, caffeine (10 mM) was applied on GFP-positive cells through a puffer pipette. Because of the close correlation between GFP fluorescence intensity and VDCC expression (Fig. 4 C), only cells with GFP intensities larger than 60 counts were chosen for these experiments. As shown in Fig. 7, A and C, most of the GFP-positive cells showed no detectable caffeine responses at 8/9 d. Within the following 2 d, there was a clear increase in the percentage of responding cells in these early, GFP-expressing cardiomyocytes. As depicted in Fig. 7 B, application of caffeine leads to a rise of [Ca2+]i before (234 ± 36 nM) and after superfusion with high K+/BayK8644 solution (1,993 ± 684 nM, n = 5, 10/11d). Most of the GFP-positive cells at 9 d express functional VDCC but not ryanodine-sensitive Ca2+ stores, whereas 24 h later most of the GFP-positive cells coexpress both (Fig. 7 C).
Figure 7.


Temporal correlation between the functional expression of VDCC and ryanodine-sensitive Ca2+ stores using Ca2+ imaging. ES cell–derived cells of different developmental stages were first tested for their GFP fluorescence intensity and subsequently for the functional expression of VDCC with superfusion of high K+/BayK8644 or for ryanodine-sensitive stores with application of caffeine (10 mM) through a puffer pipette. (A) Representative experiment of a GFP-positive 8-d-old cell, which does not respond to caffeine (arrows indicate start of application, duration 7 s) but displays a [Ca2+]i increase upon high K+/BayK8644 perfusion. (B) An 11-d-old GFP-positive cell responds to caffeine (arrows) and high K+/BayK8644 with a large transient and a smaller, more sustained rise of [Ca2+]i, respectively, indicating the functional expression of ryanodine-sensitive Ca2+ stores and VDCC. The depolarization-induced [Ca2+]i rise is larger and faster inactivating than in 8-d-old cells. (C) The correlation between caffeine and VDCC expression, tested in different cells during various differentiation stages. For this analysis, only cells with GFP fluorescence intensities (60 counts were selected). In most of the early stage cardiomyocytes the functional expression of VDCC occurs before ryanodine-sensitive Ca2+ stores.
We tested also for the expression of IP3-sensitive Ca2+ stores by dialyzing voltage-clamped ES cells and EB-derived cardiomyocytes of different stages with IP3 (100 μM) and fura-2 (125 μM) (Fig. 8, right panels). To avoid the activation of Ca2+ influx pathway(s) (holding potential −80 mV), the cells were superfused with nominally Ca2+-free solution. Cells of various differentiation stages (ES cells, 5, 7, and 9 d, n = 4 for each differentiation stage) were examined and responded to IP3 perfusion with an increase of the 360/390-nm ratio 10–20 s after establishment of the whole-cell configuration (Fig. 8). There was no significant difference in the response between the various stages of development or between GFP-positive and -negative cells (data not shown). Cell dialysis with fura-2 but without IP3 in the patch pipette resulted in all cells tested (n = 5) in a decrease of the 360/390-nm ratio (Fig. 8, right panels, insets), probably because of a lowering of resting [Ca2+]i caused by the high concentration of exogenous buffers added to the cell (Neher and Augustine, 1992).
Figure 8.

Functional expression of the sarcoplasmic Ca2+-ATPase and IP3-sensitive Ca2+ stores in ES cells and ES cell–derived cardiac precursor cells. The expression of the sarcoplasmic Ca2+-ATPase was investigated by addition of the selective antagonist Tg (1 μM) (left panels). (A) Tg evoked a sustained increase of [Ca2+]i in ES cells, indicating activation of a capacitative Ca2+ influx pathway. This was confirmed by application of Gd3+ (1 μM), which resulted in a fast decline of elevated [Ca2+]i to control levels. (B) In contrast, application of Tg in a cardiac precursor cell (7 d) resulted in a transient rise of [Ca2+]i. The expression of IP3-sensitive Ca2+ stores was tested by intracellular dialysis of ES cell–derived cells during different stages of development with IP3 (100 μM) and the Ca2+ indicator fura-2 (125 M) through patch-pipette (right panels). Changes in [Ca2+]i were monitored using measurements of the 360/390 ratio. Establishment of the classic whole-cell configuration (arrow) evoked in ES cells (A) and 7-d-old cardiomyocytes (B) a fast increase of the 360/390 ratio because of an increase of [Ca2+]i, indicating the functional expression of IP3-sensitive stores. In control experiments, omission of IP3 from the pipette solution evoked a decrease of the 360/390 ratio (insets, identical calibration as for IP3 experiments).
Application of the selective Ca2+-ATPase inhibitor Tg (1 μM) (Thastrup et al., 1990) resulted in GFP-positive as well as -negative cells of all differentiation stages tested (0–9 d) in a fast increase of [Ca2+]i (Fig. 8, left panels). In ES cells, this increase consisted of a transient and a gadolinium (Gd3+)-sensitive sustained phase (Fig. 8 A, left; n = 5), pointing towards activation of a Ca2+ influx pathway. In contrast, the Tg-induced rise of [Ca2+]i in cardiac precursor cells (Fig. 8 B, left; n = 5) was only transient.
Discussion
The main goal of the present study was the functional characterization of cardiomyocytes before the initiation of contraction. In particular, we investigated the functional expression of cellular components playing a key role for cardiac function, i.e., L-type Ca2+ channels, Ca2+ release sites, and Ca2+ pumps.
Since the cardiac precursor cells still lack the characteristic cross striation and spontaneous contractions, we have used the in vivo fluorescent reporter gene GFP for the identification of these early cardiomyocytes. For this purpose, we have used the ES cell system for the differentiation of cardiomyocytes (Doetschman et al., 1985; Wobus et al., 1991; Westfall et al., 1997) and established stably transfected ES cell lines, where the GFP expression was under control of the cardiac-specific human cardiac α-actin promoter (Minty and Kedes, 1986; Pari et al., 1991). The stable GFP expression has proven particularly helpful for our investigation since it allowed the identification of GFP-positive cells even very early during development. As reported for transgenic mice, where (E)GFP expression was under control of the ubiquitous β-actin promoter (Ikawa et al., 1995; Okabe et al., 1997), (E)GFP did not interfere on ES cell–derived cardiomyocytes. The α-actin promoter was chosen because transcripts for cardiac α-actin were detected as early as on E7.5 in the developing murine heart (Sassoon et al., 1988; Lyons et al., 1991). Accordingly, the activity of the LacZ reporter gene under control of the (−440 to +6) segment of the human cardiac α-actin promoter has been shown to be cardiac specific and switched on before the onset of spontaneous contractions in EBs (Metzger et al., 1996).
The pattern of GFP fluorescence as well as the overlap between GFP expression and spontaneous contractions indicated the specificity, which was further confirmed by immunocytochemistry. It is well known from the literature that cardiac α-actin and skeletal α-actin are coexpressed in both cardiac and skeletal muscle during embryonic development (Sassoon et al., 1988; Alonso et al., 1990; Lyons et al., 1991). However, the GFP-positive precursor cells in our experiments did clearly not comprise skeletal muscle cells for the following reasons: (a) the Ca2+ currents determined in these cells displayed fast activation kinetics, which clearly differed from the slow activation kinetics typical for the skeletal Ca2+ current. Moreover, T-type Ca2+ currents were excluded because of the current–voltage relationship, pharmacology, and PKA-dependent phosphorylation. (b) GFP-positive cells of later developmental stages displayed electrophysiological as well as morphological characteristics typical for cardiomyocytes. (c) All GFP-positive precursor cells showed immunostaining for ANP, which is known to be expressed early during cardiomyogenesis, but not in skeletal myocytes (Miller-Hance et al., 1993; Hescheler et al., 1997). Because of the fundamental role of VDCC and Ca2+ storage organelles for cardiac function, their functional expression was investigated in these early GFP-positive cardiomyocytes. Many studies have been performed on later embryonic and neonatal mammalian cardiomyocytes, where expression and biophysical characteristics of VDCC and Ca2+ handling proteins differed relatively little from terminally differentiated cardiomyocytes (Josephson and Sperelakis, 1989; Masuda and Sperelakis, 1993; Davies et al., 1996; Takano and Noma, 1997). However, almost no functional data are available on very early mammalian cardiomyocytes before E11. Therefore, the ES cell differentiation system in combination with cardiac α-actin promoter–driven GFP expression allowed the identification and functional characterization of cardiomyocytes before beating. Patch clamp studies demonstrated the expression of L-type Ca2+ channels at very low density 1 d after plating (7 d). In contrast to embryonic chicken cardiomyocytes, where a decrease of ICa density during development was reported (Tohse et al., 1992b ), in the present preparation, a steep increase in ICa density from 7- to 10-d-old cardiomyocytes was observed. The current was identified as VDCC based on its biophysical and pharmacological characteristics, which were similar to VDCC of adult cardiomyocytes. In line with our previous findings on early stage ES cell–derived cardiomyocytes (Maltsev et al., 1994), ICa was blocked completely by nisoldipine making an involvement of additional Ca2+ channel isoforms, i.e., T-type Ca2+ channels unlikely. Already at this early stage ICa was stimulated by the catalytic subunit of PKA as described for terminally differentiated cardiomyocytes (Osterrieder et al., 1982; Hartzell and Fischmeister, 1986; Kameyama et al., 1986a ). These data provide strong evidence for similar structural properties of the Ca2+ channel protein, at least in regard to the phosphorylation sites at this very early stage of development. Similar to a recent report by An et al. (1996) for E11–13 murine cardiomyocytes, the ICa amplitude was not increased upon application of forskolin, a stimulator of adenylyl-cyclase, in the ES cell–derived cardiac precursor cells. An et al. suggested a deficiency of the PKA holoenzyme. Because phosphodiesterases (Fischmeister and Hartzell, 1990) and phosphatases (Kameyama et al., 1986b ; Wiechen et al., 1995) play an important role in cAMP breakdown and L-type Ca2+ channel dephosphorylation, respectively, future studies have to clarify whether they are already functional in cardiac precursor cells and involved in the lack of the forskolin response. The functional expression of the Ca2+-ATPase and IP3 receptor stores was proven by a rise in [Ca2+]i upon application of Tg and IP3, respectively, during all stages of development. The experiments using Tg confirmed at a functional level previous findings, using in situ hybridization and Northern blot analysis in rat (Moorman et al., 1995) as well as murine embryos/EBs (Ganim et al., 1992), that the Ca2+-ATPase (SERCA2) is already expressed very early during cardiac development. Which SERCA isoform/s is/are present at the ES cell stage is currently not known. In contrast to terminally differentiated ventricular cardiomyocytes in which Tg did not induce changes of [Ca2+]i (Gomez et al., 1996; Song et al., 1997), it evoked a transient [Ca2+]i increase in early stage cardiomyocytes. This difference may point to a low activity of the Na+-Ca2+ exchanger and/or the dominant role of the sarcoplasmic Ca2+-ATPase for Ca2+ homeostasis at this early developmental stage. Most notably, the functional expression of ryanodine-sensitive Ca2+ stores was delayed in comparison to the expression of ICa in the majority of cells tested. This may explain why oscillations in membrane potential are registered earlier than contractions in chick (Fujii et al., 1981) and rat (Hirota et al., 1985) embryonic cardiomyocytes, despite the presence of contractile proteins. This could be due to the lack of CICR, the fundamental process responsible for excitation–contraction coupling (Fabiato, 1985; Barcenas-Ruiz and Wier, 1987; du Bell and Houser, 1987; Nabauer et al., 1989). In the literature, electromechanical coupling in the fetal heart (late embryonic stage) is suggested to be largely dependent on transsarcolemmal Ca2+ influx, rather than Ca2+ released from the SR (Nayler and Fassold, 1977; Mahony and Jones, 1986; Klitzner and Friedman, 1989; Chin et al., 1990). In addition, the SR was found to be morphologically smaller in neonatal ventricular cardiomyocytes (Olivetti et al., 1980), and the number of ryanodine receptors in fetal rat ventricular cardiomyocytes (E22) was reduced as compared with adult rat ventricular cardiomyocytes (Ramesh et al., 1995). Nevertheless, Su and Chang (1993) report caffeine-induced contractions in fetal hearts. Accordingly, a spatial coassociation between ryanodine receptors and VDCC has been reported for chick cardiomyocytes early during development (Sun et al., 1995; Flucher and Franzini-Armstrong, 1996). Recently, embryonic lethality between E10.5–11.5 of mice carrying a gene inactivation of the ryanodine 2 receptor was described (Takeshima et al., 1998). While the hearts of mutant mice started to spontaneously contract at E9.5, severe morphological changes of the SR and the mitochondria were detected. The authors suggest that Ry-2 may not be required for excitation–contraction coupling at this early embryonic stage but play a crucial role for Ca2+ homeostasis. Our data fit nicely in since we demonstrate herewith functional ryanodine-sensitive Ca2+ stores in early stage cardiomyocytes, and we provide at least indirect evidence for a role of ryanodine-sensitive Ca2+ receptors/stores for the establishment of contractile activity.
Therefore, we report to the best of our knowledge for the first time the functional characterization of cardiomyocytes before the beginning of spontaneous contractions. In these cardiac precursor cells, the VDCC are already functionally expressed and can be stimulated via protein kinase A–dependent phosphorylation. At this stage, IP3 stores as well as sarcoplasmic Ca2+-ATPases are already functional, while caffeine-sensitive ryanodine receptors/stores are not yet expressed. Interestingly, even though ryanodine stores may not play such an important role in excitation–contraction coupling at this early stage, in our system their functional expression coincides with the initiation of contractions. In the future, it will be interesting to address the role of VDCC as well as of ryanodine receptors for cardiomyogenesis by using selective pharmacological blockers during different stages of ES cell–derived cardiomyogenesis.
Acknowledgments
We thank Dr. M. Okabe (University of Osaka, Japan) and Dr. J. Miyazaki (Tohoku University, Japan) for kindly providing the expression vector (pCX-h-EGFP), Dr. M.W. McBurney (University of Ottawa, Canada) for supplying us with the pHCActLacZ (−440 to +6 segment of the human cardiac α-actin promoter), and Dr. I. Drobinskaja, Dr. Han Jie, D. Metzler, B. Nowotny, and J. Siodlaczek for assistance in cell culture work and immunocytochemistry. We are further grateful to Dr. Anna Wobus (Gatersleben, Germany) for supplying us with the D3 ES cell line and for helpful discussions and to Dr. I.P. Hall (University of Nottingham, UK) for carefully reading the manuscript.
This study was supported by ZEBET.
Abbreviations used in this paper
- ANP
atrial natriuretic peptide
- CICR
calcium-induced calcium release
- DAB
3,3-diaminobenzidine-tetrahydrochloride
- EB
embryoid body
- ES
embryonic stem
- GFP
green fluorescent protein
- PKA
cAMP-dependent protein kinase A
- SR
sarcoplasmic reticulum
- Tg
thapsigargin
- VDCC
voltage-dependent L-type Ca2+ channels
Footnotes
E. Kolossov and B.K. Fleischmann contributed equally to the manuscript.
References
- Alonso S, Garner I, Vandekerckhove J, Buckingham M. Genetic analysis of the interaction between cardiac and skeletal actin gene expression in striated muscle of the mouse. J Mol Biol. 1990;211:727–738. doi: 10.1016/0022-2836(90)90073-U. [DOI] [PubMed] [Google Scholar]
- An RH, Davies MP, Doevendans PA, Kubalak SW, Bangalore R, Chien KR, Kass RS. Developmental changes in β-adrenergic modulation of L-type Ca2+channels in embryonic mouse heart. Circ Res. 1996;78:371–378. doi: 10.1161/01.res.78.3.371. [DOI] [PubMed] [Google Scholar]
- Barcenas-Ruiz L, Wier WG. Voltage dependence of intracellular [Ca2+]itransients in guinea pig ventricular myocytes. Circ Res. 1987;61:148–154. doi: 10.1161/01.res.61.1.148. [DOI] [PubMed] [Google Scholar]
- Bers, D.M. 1997. Ca transport during contraction and relaxation in mammalian ventricular muscle. Basic Res. Cardiol. 92(Suppl):1–10. [DOI] [PubMed]
- Chalfie M, Tu Y, Euskirchen G, Ward WW, Prasher DC. Green fluorescent protein as a marker for gene expression. Science. 1994;263:802–805. doi: 10.1126/science.8303295. [DOI] [PubMed] [Google Scholar]
- Chin TK, Friedman WF, Klitzner TS. Developmental changes in cardiac myocyte calcium regulation. Circ Res. 1990;67:574–579. doi: 10.1161/01.res.67.3.574. [DOI] [PubMed] [Google Scholar]
- Davies MP, An RH, Doevendans P, Kubalak S, Chien KR, Kass RS. Developmental changes in ionic channel activity in the embryonic murine heart. Circ Res. 1996;78:15–25. doi: 10.1161/01.res.78.1.15. [DOI] [PubMed] [Google Scholar]
- Doetschman TC, Eistetter H, Katz M, Schmidt W, Kemler R. The in vitro development of blastocyst-derived embryonic stem cell lines: formation of visceral yolk sac, blood islands and myocardium. J Embryol Exp Morphol. 1985;87:27–45. [PubMed] [Google Scholar]
- du Bell WH, Houser SR. A comparison of cytosolic free Ca2+in resting feline and rat ventricular myocytes. Cell Calcium. 1987;8:259–268. doi: 10.1016/0143-4160(87)90002-9. [DOI] [PubMed] [Google Scholar]
- Fabiato A. Time and calcium dependence of activation and inactivation of calcium-induced release of calcium from the sarcoplasmic reticulum of a skinned canine cardiac purkinje cell. J Gen Physiol. 1985;85:247–289. doi: 10.1085/jgp.85.2.247. [DOI] [PMC free article] [PubMed] [Google Scholar]
- Fischmeister R, Hartzell HC. Regulation of calcium current by low-K mcyclic AMP phosphodiesterases in cardiac cells. Mol Pharmacol. 1990;38:426–433. [PubMed] [Google Scholar]
- Fishman MC, Chien KR. Fashioning the vertebrate heart: earliest embryonic decisions. Development (Camb) 1997;124:2099–2117. doi: 10.1242/dev.124.11.2099. [DOI] [PubMed] [Google Scholar]
- Flucher BE, Franzini-Armstrong C. Formation of junctions involved in excitation-contraction coupling in skeletal and cardiac muscle. Proc Natl Acad Sci USA. 1996;93:8101–8106. doi: 10.1073/pnas.93.15.8101. [DOI] [PMC free article] [PubMed] [Google Scholar]
- Fujii S, Hirota A, Kamino K. Optical recording of development of electrical activity in embryonic chick heart during early phases of cardiogenesis. J Physiol (Lond) 1981;311:147–160. doi: 10.1113/jphysiol.1981.sp013578. [DOI] [PMC free article] [PubMed] [Google Scholar]
- Ganim JR, Luo W, Ponniah S, Grupp I, Kim HW, Ferguson DG, Kadambi V, Neumann JC, Doetschman T, Kranias EG. Mouse phospholamban gene expression during development in vivo and in vitro. Circ Res. 1992;71:1021–1030. doi: 10.1161/01.res.71.5.1021. [DOI] [PubMed] [Google Scholar]
- Gomez AM, Cheng H, Lederer WJ, Bers DM. Ca2+ diffusion and sarcoplasmic reticulum transport both contribute to [Ca2+]i decline during Ca2+sparks in rat ventricular myocytes. J Physiol (Lond) 1996;496:575–581. doi: 10.1113/jphysiol.1996.sp021708. [DOI] [PMC free article] [PubMed] [Google Scholar]
- Grynkiewicz G, Poenie M, Tsien RY. A new generation of Ca2+indicators with greatly improved fluorescence properties. J Biol Chem. 1985;260:3440–3450. [PubMed] [Google Scholar]
- Hamill OP, Marty A, Neher E, Sakmann B, Sigworth FJ. Improved patch-clamp techniques for high-resolution current recording from cells and cell-free membrane patches. Pflugers Arch. 1981;391:85–100. doi: 10.1007/BF00656997. [DOI] [PubMed] [Google Scholar]
- Hartzell HC, Fischmeister R. Opposite effects of cyclic GMP and cyclic AMP on Ca2+current in single heart cells. Nature. 1986;323:273–275. doi: 10.1038/323273a0. [DOI] [PubMed] [Google Scholar]
- Hescheler J, Fleischmann BK, Lentini S, Maltsev VA, Rohwedel J, Wobus AM, Addicks K. Embryonic stem cells: a model to study structural and functional properties in cardiomyogenesis. Cardiovasc Res. 1997;36:149–162. doi: 10.1016/s0008-6363(97)00193-4. [DOI] [PubMed] [Google Scholar]
- Hirota A, Kamino K, Komuro H, Sakai T, Yada T. Early events in development of electrical activity and contraction in embryonic rat heart assessed by optical recording. J Physiol (Lond) 1985;369:209–227. doi: 10.1113/jphysiol.1985.sp015897. [DOI] [PMC free article] [PubMed] [Google Scholar]
- Ikawa M, Kominami K, Yoshimura Y, Tanaka K, Nishimune Y, Okabe M. A rapid and non-invasive selection of transgenic embryos before implantation using green fluorescent protein (GFP) FEBS Lett. 1995;375:125–128. doi: 10.1016/0014-5793(95)01162-8. [DOI] [PubMed] [Google Scholar]
- Josephson IR, Sperelakis N. Two types of outward K+channel currents in early embryonic chick ventricular myocytes. J Dev Physiol. 1989;12:201–207. [PubMed] [Google Scholar]
- Kameyama M, Hescheler J, Hofmann F, Trautwein W. Modulation of Ca current during the phosphorylation cycle in the guinea pig heart. Pflugers Arch. 1986a;407:123–128. doi: 10.1007/BF00580662. [DOI] [PubMed] [Google Scholar]
- Kameyama M, Hescheler J, Mieskes G, Trautwein W. The protein-specific phosphatase 1 antagonizes the β-adrenergic increase of the cardiac Ca current. Pflugers Arch. 1986b;407:461–463. doi: 10.1007/BF00652635. [DOI] [PubMed] [Google Scholar]
- Klitzner TS, Friedman WF. A diminished role for the sarcoplasmic reticulum in newborn myocardial contraction: effects of ryanodine. Pediatr Res. 1989;26:98–101. doi: 10.1203/00006450-198908000-00005. [DOI] [PubMed] [Google Scholar]
- Lyons GE, Buckingham ME, Mannherz HG. α-Actin proteins and gene transcripts are colocalized in embryonic mouse muscle. Development (Camb) 1991;111:451–454. doi: 10.1242/dev.111.2.451. [DOI] [PubMed] [Google Scholar]
- Mahony L, Jones LR. Developmental changes in cardiac sarcoplasmic reticulum in sheep. J Biol Chem. 1986;261:15257–15265. [PubMed] [Google Scholar]
- Maltsev VA, Wobus AM, Rohwedel J, Bader M, Hescheler J. Cardiomyocytes differentiated in vitro from embryonic stem cells developmentally express cardiac-specific genes and ionic currents. Circ Res. 1994;75:233–244. doi: 10.1161/01.res.75.2.233. [DOI] [PubMed] [Google Scholar]
- Masuda H, Sperelakis N. Inwardly rectifying potassium current in rat fetal and neonatal ventricular cardiomyocytes. Am J Physiol. 1993;265:H1107–H1111. doi: 10.1152/ajpheart.1993.265.4.H1107. [DOI] [PubMed] [Google Scholar]
- Masuda H, Sumii K, Sperelakis N. Long openings of calcium channels in fetal rat ventricular cardiomyocytes. Pflugers Arch. 1995;429:595–597. doi: 10.1007/BF00704167. [DOI] [PubMed] [Google Scholar]
- Meissner G. Ryanodine receptor/Ca2+release channels and their regulation by endogenous effectors. Annu Rev Physiol. 1994;56:485–508. doi: 10.1146/annurev.ph.56.030194.002413. [DOI] [PubMed] [Google Scholar]
- Metzger JM, Lin WI, Johnston RA, Westfall MV, Samuelson LC. Myosin heavy chain expression in contracting myocytes isolated during embryonic stem cell cardiogenesis. Circ Res. 1995;76:710–719. doi: 10.1161/01.res.76.5.710. [DOI] [PubMed] [Google Scholar]
- Metzger JM, Lin WI, Samuelson LC. Vital staining of cardiac myocytes during embryonic stem cell cardiogenesis in vitro. Circ Res. 1996;78:547–552. doi: 10.1161/01.res.78.4.547. [DOI] [PubMed] [Google Scholar]
- Miller-Hance WC, La Corbiere M, Fuller SJ, Evans SM, Lyons G, Schmidt C, Robbins J, Chien KR. In vitro chamber specification during embryonic stem cell cardiogenesis. Expression of the ventricular myosin light chain-2 gene is independent of heart tube formation. J Biol Chem. 1993;268:25244–25252. [PubMed] [Google Scholar]
- Minty A, Kedes L. Upstream regions of the human cardiac actin gene that modulate its transcription in muscle cells: presence of an evolutionarily conserved repeated motif. Mol Cell Biol. 1986;6:2125–2136. doi: 10.1128/mcb.6.6.2125. [DOI] [PMC free article] [PubMed] [Google Scholar]
- Moorman AF, Vermeulen JL, Koban MU, Schwartz K, Lamers WH, Boheler KR. Patterns of expression of sarcoplasmic reticulum Ca(2+)- ATPase and phospholamban mRNAs during rat heart development. Circ Res. 1995;76:616–625. doi: 10.1161/01.res.76.4.616. [DOI] [PubMed] [Google Scholar]
- Nabauer M, Callewaert G, Cleemann L, Morad M. Regulation of calcium release is gated by calcium current, not gating charge, in cardiac myocytes. Science. 1989;244:800–803. doi: 10.1126/science.2543067. [DOI] [PubMed] [Google Scholar]
- Nayler WG, Fassold E. Calcium accumulating and ATPase activity of cardiac sarcoplasmic reticulum before and after birth. Cardiovasc Res. 1977;11:231–237. doi: 10.1093/cvr/11.3.231. [DOI] [PubMed] [Google Scholar]
- Neher E, Augustine GJ. Calcium gradients and buffers in bovine chromaffin cells. J Physiol (Lond) 1992;450:273–301. doi: 10.1113/jphysiol.1992.sp019127. [DOI] [PMC free article] [PubMed] [Google Scholar]
- Okabe M, Ikawa M, Kominami K, Nakanishi T, Nishimune Y. “Green mice” as a source of ubiquitous green cells. FEBS Lett. 1997;407:313–319. doi: 10.1016/s0014-5793(97)00313-x. [DOI] [PubMed] [Google Scholar]
- Olivetti G, Anversa P, Loud AV. Morphometric study of early postnatal development in the left and right ventricular myocardium of the rat. II. Tissue composition, capillary growth, and sarcoplasmic alterations. Circ Res. 1980;46:503–512. doi: 10.1161/01.res.46.4.503. [DOI] [PubMed] [Google Scholar]
- Osterrieder W, Brum G, Hescheler J, Trautwein W, Flockerzi V, Hofmann F. Injection of subunits of cyclic AMP-dependent protein kinase into cardiac myocytes modulates Ca2+current. Nature. 1982;298:576–578. doi: 10.1038/298576a0. [DOI] [PubMed] [Google Scholar]
- Parekh AB, Fleig A, Penner R. The store-operated calcium current I(crac): nonlinear activation by insp3 and dissociation from calcium release. Cell. 1997;89:973–980. doi: 10.1016/s0092-8674(00)80282-2. [DOI] [PubMed] [Google Scholar]
- Pari G, Jardine K, McBurney MW. Multiple CArG boxes in the human cardiac actin gene promoter required for expression in embryonic cardiac muscle cells developing in vitro from embryonal carcinoma cells. Mol Cell Biol. 1991;11:4796–4803. doi: 10.1128/mcb.11.9.4796. [DOI] [PMC free article] [PubMed] [Google Scholar]
- Prasher DC, Eckenrode VK, Ward WW, Prendergast FG, Cormier MJ. Primary structure of the Aequorea victoriagreen-fluorescent protein. Gene. 1992;111:229–233. doi: 10.1016/0378-1119(92)90691-h. [DOI] [PubMed] [Google Scholar]
- Ramesh V, Kresch MJ, Katz AM, Kim DH. Characterization of Ca(2+)-release channels in fetal and adult rat hearts. Am J Physiol. 1995;269:H778–H782. doi: 10.1152/ajpheart.1995.269.3.H778. [DOI] [PubMed] [Google Scholar]
- Reuter H. Calcium channel modulation by neurotransmitters, enzymes and drugs. Nature. 1983;301:569–574. doi: 10.1038/301569a0. [DOI] [PubMed] [Google Scholar]
- Rohwedel J, Maltsev V, Bober E, Arnold HH, Hescheler J, Wobus AM. Muscle cell differentiation of embryonic stem cells reflects myogenesis in vivo: developmentally regulated expression of myogenic determination genes and functional expression of ionic currents. Dev Biol. 1994;164:87–101. doi: 10.1006/dbio.1994.1182. [DOI] [PubMed] [Google Scholar]
- Sanchez A, Jones WK, Gulick J, Doetschman T, Robbins J. Myosin heavy chain gene expression in mouse embryoid bodies. An in vitro developmental study. J Biol Chem. 1991;266:22419–22426. [PubMed] [Google Scholar]
- Sassoon DA, Garner I, Buckingham M. Transcripts of α-cardiac and α-skeletal actins are early markers for myogenesis in the mouse embryo. Development (Camb) 1988;104:155–164. doi: 10.1242/dev.104.1.155. [DOI] [PubMed] [Google Scholar]
- Song LS, Stern MD, Lakatta EG, Cheng H. Partial depletion of sarcoplasmic reticulum calcium does not prevent calcium sparks in rat ventricular myocytes. J Physiol (Lond) 1997;505:665–675. doi: 10.1111/j.1469-7793.1997.665ba.x. [DOI] [PMC free article] [PubMed] [Google Scholar]
- Su JY, Chang YI. Modulation of sarcoplasmic reticulum Ca(2+)- release channels by caffeine, Ca2+, and Mg2+in skinned myocardial fibers of fetal and adult rats. Pflugers Arch. 1993;423:300–306. doi: 10.1007/BF00374409. [DOI] [PubMed] [Google Scholar]
- Sun XH, Protasi F, Takahashi M, Takeshima H, Ferguson DG, Franzini-Armstrong C. Molecular architecture of membranes involved in excitation–contraction coupling of cardiac muscle. J Cell Biol. 1995;129:659–671. doi: 10.1083/jcb.129.3.659. [DOI] [PMC free article] [PubMed] [Google Scholar]
- Takano M, Noma A. Development of muscarinic potassium current in fetal and neonatal rat heart. Am J Physiol. 1997;272:H1188–H1195. doi: 10.1152/ajpheart.1997.272.3.H1188. [DOI] [PubMed] [Google Scholar]
- Takeshima H, Komazaki S, Hirose K, Nishi M, Noda T, Iino M. Embryonic lethality and abnormal cardiac myocytes in mice lacking ryanodine receptor type 2. EMBO (Eur Mol Biol Organ) J. 1998;17:3309–3316. doi: 10.1093/emboj/17.12.3309. [DOI] [PMC free article] [PubMed] [Google Scholar]
- Thastrup O, Cullen PJ, Drobak BK, Hanley MR, Dawson AP. Thapsigargin, a tumor promoter, discharges intracellular Ca2+ stores by specific inhibition of the endoplasmic reticulum Ca2(+)-ATPase. Proc Natl Acad Sci USA. 1990;87:2466–2470. doi: 10.1073/pnas.87.7.2466. [DOI] [PMC free article] [PubMed] [Google Scholar]
- Tohse N, Masuda H, Sperelakis N. Novel isoform of Ca2+channel in rat fetal cardiomyocytes. J Physiol (Lond) 1992a;451:295–306. doi: 10.1113/jphysiol.1992.sp019165. [DOI] [PMC free article] [PubMed] [Google Scholar]
- Tohse N, Meszaros J, Sperelakis N. Developmental changes in long-opening behavior of L–type Ca2+channels in embryonic chick heart cells. Circ Res. 1992b;71:376–384. doi: 10.1161/01.res.71.2.376. [DOI] [PubMed] [Google Scholar]
- Trautwein W, Hescheler J. Regulation of cardiac L-type calcium current by phosphorylation and G proteins. Annu Rev Physiol. 1990;52:257–274. doi: 10.1146/annurev.ph.52.030190.001353. [DOI] [PubMed] [Google Scholar]
- Westfall MV, Pasyk KA, Yule DI, Samuelson LC, Metzger JM. Ultrastructure and cell-cell coupling of cardiac myocytes differentiating in embryonic stem cell cultures. Cell Motil Cytoskel. 1997;36:43–54. doi: 10.1002/(SICI)1097-0169(1997)36:1<43::AID-CM4>3.0.CO;2-I. [DOI] [PubMed] [Google Scholar]
- Wiechen K, Yue DT, Herzig S. Two distinct functional effects of protein phosphatase inhibitors on guinea-pig cardiac L-type Ca2+channels. J Physiol (Lond) 1995;484:583–592. doi: 10.1113/jphysiol.1995.sp020688. [DOI] [PMC free article] [PubMed] [Google Scholar]
- Wobus AM, Wallukat G, Hescheler J. Pluripotent mouse embryonic stem cells are able to differentiate into cardiomyocytes expressing chronotropic responses to adrenergic and cholinergic agents and Ca2+channel blockers. Differentiation. 1991;48:173–182. doi: 10.1111/j.1432-0436.1991.tb00255.x. [DOI] [PubMed] [Google Scholar]