Abstract
The F-ATPase of the bacterium Propionigenium modestum is driven by an electrochemical sodium gradient between the cell interior and its environment. Here we present a mechanochemical model for the transduction of transmembrane sodium-motive force into rotary torque. The same mechanism is likely to operate in other F-ATPases, including the proton-driven F-ATPases of Escherichia coli.
The culmination of metabolism is the generation of ATP from a transmembrane electromotive gradient. This conversion of electrochemical energy into the chemical energy of the terminal phosphoric anhydride bond of ATP is accomplished by the enzyme ATP synthase—also called F1Fo-ATP synthase, or F1Fo-ATPase. The latter name reflects the fact that the enzyme is reversible and can act as a proton (or Na+) -pumping ATPase. Closely related ATP synthases are found in the bacterial cytoplasmic membrane, the inner membrane of mitochondria, and the thylakoid membrane of chloroplasts. These enzymes consist of a membrane-embedded portion, Fo, which contains the ion channel, and the soluble F1 moiety, which harbors the nucleotide-binding sites in which ATP is synthesized or hydrolyzed (for reviews see refs. 1–6).
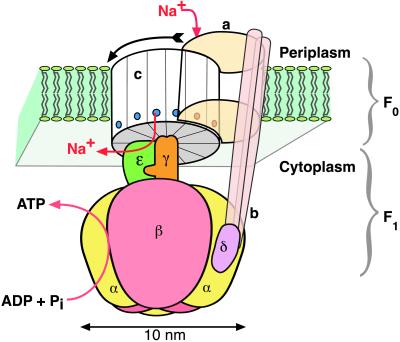
Fig. 1 shows a schematic diagram of ATP synthase that summarizes a great deal of experimental work. Isolated F1 (also called F1-ATPase) hydrolyzes ATP and is composed of subunits α3β3γδɛ (subscripts refer to the subunit stoichiometry). The majority of the α3β3γ structure has been solved by x-ray crystallography (7). The structure shows a cylinder formed by the three α and three β subunits alternating around a central cavity through which the asymmetrically bent shaft of the γ subunit extends and protrudes. The γ subunit asymmetry correlates with the different conformations assumed by each of the three catalytic βs, in accordance to Boyer’s “binding change mechanism” (8). This strongly supports the view that the binding changes of the β subunits are coupled to the rotation of the γ subunit. This rotational coupling is confirmed by several recent studies which demonstrate unequivocally that ATP hydrolysis drives rotation of the γ subunit within the α3β3γ subcomplex of F1 (9–12), and that subunit ɛ rotates with γ as a unit (13, 14). The rotation is reversed during ATP synthesis, driven by the downhill movement of the coupling ions through the Fo sector.
Figure 1.
Schematic diagram of the Na+ FoF1 ATPase. The rotor consists of subunits c12γɛ, and the stator consists of subunits ab2δ(αβ)3. Six nucleotide-binding sites lie at the αβ interfaces; three catalytic sites alternate with three noncatalytic sites. The arrow indicates the direction of rotation during ATP synthesis.
The Fo portion of ATP synthase has been most intensely studied with the enzymes from the bacteria Escherichia coli and Propionigenium modestum. The subunit composition of Fo is ab2c12. The c subunit consists of twin membrane-spanning α-helices that are connected by a cytoplasmic loop. Evidence from electron and atomic force microscopy indicates that the c subunits are assembled into a 12-unit ring that is flanked at the periphery by the a and the two b subunits (15–17). The b subunits attach the a subunit to an α subunit of the α3β3 headpiece via the δ subunit (18, 19). The a subunit is an integral membrane protein consisting of five or six membrane-spanning α-helices (20–23). According to NMR analyses of E. coli subunit c in chloroform/methanol/water, the two helices pack closely to one another, extending over 40 and 30 residues, respectively, with a short interruption after D61 of the C-terminal α-helix (24). The proton-binding D61 residue was postulated to reside within the middle of the membrane. Recent NMR structure analyses of P. modestum subunit c in dodecyl sulfate micelles revealed folding into four clearly defined α-helices of which the N- and C-terminal helices are the most hydrophobic and of sufficient length to span the membrane (U. Matthey, G. Kaim, P.D., D. Braun, and K. Wüthrich, unpublished results). The α-helical structure is interrupted on both strands in the Na+-binding site region (Q32, E65, S66) (25). This observation suggests that the site is located at the cytoplasmic boundary of the membrane and that the additional two helices and the loop are cytoplasmic or membrane-associated but not membrane-integral. This location of the binding site is consistent with biochemical evidence showing that the binding sites of more than one c subunit are readily accessible from the aqueous phase (26).
The overall construction of the Fo and F1 sectors has the structure of a counter-rotating “rotor” and “stator” assembly comprising, respectively, c12γɛ and ab2δα3β3. Indeed, several lines of evidence with the ATP synthase of P. modestum strongly supports the idea that the c and a subunit assemblies counter-rotate during the translocation of the coupling Na+ ions: (i) Mutants within subunits c or a that alter the coupling ion specificity were isolated, showing a specific interaction of either subunit with the coupling ions (25, 27, 28). (ii) In an ATPase with a Na+-impermeable a subunit mutation, 1 Na+ per ATPase was occluded in an ATP-dependent fashion (26). (iii) In the mutant enzyme with partially dicyclohexyl carbodiimide-modified c subunits, Na+ occlusion was impaired when ATP was added first and Na+ second, but not when this order was reversed (29). (iv) With the wild-type enzyme reconstituted into proteoliposomes, Na+ ions were rapidly exchanged between the two compartments of the membrane. The exchange was abolished when the system switched from an idling into a torque-generating operation mode, either by the hydrolysis of ATP or with the driving force provided by an electric potential (29). Interestingly, a Na+ concentration gradient was unable to induce the switch; ATP synthesis by the enzymes from P. modestum or E. coli depended on the electric potential (29, 30).
On the basis of these and other data, several authors have proposed qualitative models for how ion flow generates counter-rotation of the rotor and stator segments of ATP synthase (9, 26, 29, 31–33). Of these, only Elston, et al. (33) provided a quantitative account of how a rotary torque is generated by the transmembrane electrochemical gradient (33). In their model, they did not take into account the role of the membrane potential or the property elaborated for P. modestum that the rotor ion-binding sites (E65) are in equilibrium with the cytoplasm. With this picture of the P. modestum motor in mind, we have constructed a model that incorporates this new information and can account quantitatively for most of the experimental data on the P. modestum Fo motor.
A Quantitative Model for the Fo Motor of P. modestum
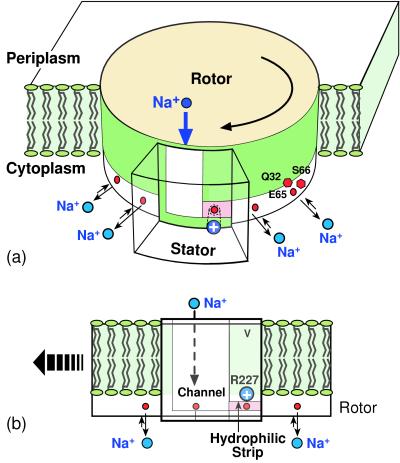
During ATP synthesis, the rotor turns clockwise as viewed from the periplasm. This unidirectional rotation requires an asymmetry somewhere in the rotor–stator assembly. The rotor, consisting of 12 double α-helices, is thought to form a symmetrical disk into which the γ-shaft inserts (34). If so, the asymmetry must exist on the stator—in particular, on the a subunit because that is the only stator element that abuts the rotor. Fig. 2a shows a schematic view of the rotor–stator model we are proposing here. The rotor–stator interface must present a hydrophobic barrier against leakage of ions from the periplasm to the cytoplasm. Thus the ion channel should not provide an uninterrupted path connecting the periplasm with the cytoplasm. The fundamental asymmetry that determines the direction of rotation in our model is the horizontal hydrophilic strip at the rotor–stator interface that connects the half-channel laterally to the cytoplasm; this is shown face-on in Fig. 2b. This hydrophilic strip permits charged (unoccupied) rotor sites to enter the rotor–stator interface from the right and pass as far to the left as the edge of the stator channel. We place the positive stator charge (R227) close to the strip. This positioning has the dual effect of repelling ions in the channel—thus preventing ion leakage—and attracting unoccupied negative rotor sites when they enter the rotor–stator interface. Entering rotor sites are very likely to be empty for two reasons. First, the rotor sites are in equilibrium with the cytoplasmic reservoir; therefore, because the cytoplasmic ion concentration is low, the sites will be mostly unoccupied. Second, an occupied rotor site that enters the rotor–stator interface and approaches the stator charge will have its pKa (i.e., binding affinity) reduced, causing it to give up its sodium ion to the cytoplasmic reservoir.
Figure 2.
(a) Schematic of the rotor–stator assembly in P. modestum. During ATP synthesis, the rotor turns to the left (clockwise viewed from the periplasm). The rotor section below the level of the membrane contains the 12 ion-binding sites. Each site consists of the triad Q32/E65/S66, which coordinates a sodium ion. The stator contains an aqueous channel that conducts ions from the periplasmic (positive) reservoir to the level of the horizontal hydrophilic strip. The positive stator charge, R227, blocks leakage of ions along this strip to the cytoplasm. (b) Face-on view of the rotor–stator assembly. Rotation during synthesis is to the left. There are four rotor sites located near the stator, two within the rotor–stator interface and two adjacent laterally. The stator is penetrated by an aqueous channel that admits ions from the periplasm, but ions can exit to the cytoplasm only by boarding a rotor site and passing through the dielectric barrier forming the left wall of the channel. If the occupied site moves to the right, it quickly loses its ion back to the channel when it approaches the positive stator charge, R227.
A negatively charged (unoccupied) rotor site residing in the channel interacts electrostatically with the stator in another important way. A charged site attempting to leave the channel (to the left in Fig. 2) and enter the hydrophobic rotor–stator interface encounters an electrostatic barrier arising from the discontinuity in the dielectric constant between the aqueous channel, ɛc, and the stator, ɛs (see the discussion below). To pass through the stator to the left the rotor site must bind an ion from the channel. When occupied by a sodium ion the electrostatic field of the site is reduced to a dipole, and it can be considered almost neutral. Thus occupied, a site faces but a small electrostatic barrier when leaving the channel to the left. The stator charge ensures that an occupied site moving to the right will quickly lose its ion back to the channel. To deduce the consequences of these rotor–stator interactions we must formulate them quantitatively as follows.
The rotor sites outside the stator are in contact with the cytoplasm, and the site in the stator channel is in contact with the periplasm. However, the rotor–stator interaction depends only on the ionization state of the 4 rotor sites within and adjacent to the stator. Thus the chemical state of the rotor–stator assembly, denoted by s, has 24 = 16 possibilities because each of these 4 sites may be occupied or empty. Transitions between states occur when a site binds or releases a sodium ion. Because the relaxation to equilibrium after a proton association/dissociation event is much faster than the mechanical motion of the rotor, we can treat the transitions between these states as a Markov chain (33). Because of the electrostatic interactions between the rotor sites and the stator charge, the transitions between states depend on the angular position of the rotor, denoted θ. The evolution of the rotor’s chemical state is symbolically described by the equation (see the supplemental data on the PNAS web site, www.pnas.org):
 |
1 |
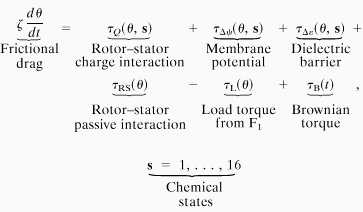
where K(θ) is the matrix of transition rates between the chemical states. The motion of the rotor can be described by equating the viscous drag on the rotor to the torques that act on the rotor and the Brownian force modeling the rotor’s thermal fluctuations [i.e., the Langevin equation (35, 36)]:
 |
2 |
The terms on the right-hand side of Eq. 2 are as follows (the computations are detailed in the supplemental data published on the PNAS web site, www.pnas.org).
(i) τQ(θ, s) is due to the electrostatic interaction between the stator charge (R227) and the rotor sites that are within the hydrophilic rotor–stator strip. The charged (unoccupied) site will be attracted by the stator charge (R227) according to Coulomb’s law corresponding to the dielectric and shielding environment of the stator.
(ii) τΔψ(θ, s) is due to the membrane potential drop across the horizontal segment between the periplasmic channel and the stator boundary.
(iii) τΔɛ(θ, s) is the electrostatic barrier that opposes the entry of a charged site into the hydrophobic rotor–stator interface.
(iv) τRS(θ) is the passive rotor–stator interaction. We will discuss the origin and role of this term in Results.
(v) τL(θ) is the load exerted by F1 on the rotor through the γ-shaft.
(vi) τB(t) is the random Brownian torque due to the thermal fluctuations of the rotor.
As indicated by their dependence on s, the three electrostatic torques depend on the chemical state of the rotor site; that is, whether a site is charged (unoccupied) or uncharged (occupied).
In summary, the following effects combine to drive the rotor.
(i) The stator charge (R227) attracts an unoccupied rotor site; blocks leaking of ions through the channel; and lowers the binding affinity (pKa) of rotor sites, causing the mobile ion to dissociate as an occupied rotor site approaches it.
The last two effects couple the rotation of the motor tightly to the ion flux through the rotor–stator interface.
(ii) The membrane potential creates an electrostatic gradient that biases the thermal escape of the rotor site from the positive stator charge (R227) into the periplasmic channel (to the left in Fig. 2); and decreases the dissociation rate of sodium ions from the rotor site to the periplasmic reservoir.
The extent of these two effects depends on the fraction of the total voltage drop across the horizontal segment and the periplasmic channel. We shall assume that the channel is aqueous and that most of the voltage drop is across the horizontal segment.
(iii) The dielectric barrier at the left of the channel prevents an unoccupied rotor site from entering the stator from the left in Fig. 2.
(iv) Brownian motion drives rotational diffusion of the rotor.
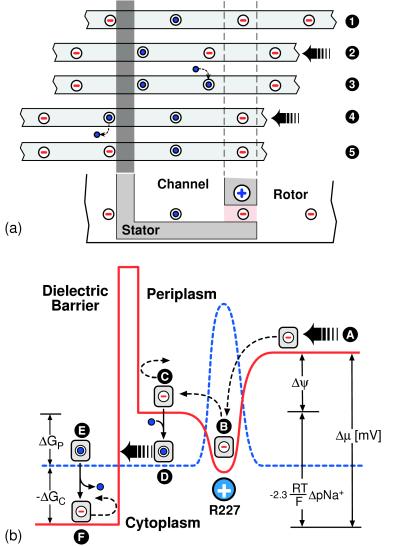
Eqs. 1 and 2 describe how these effects combine to drive the rotor. Solutions of the model equations will be presented below; however, an intuitive picture of how the motor works is shown in Fig. 3a, which depicts one sequence of events that advance the rotor by 1 rotor unit, 2π/12. The mechanism of energy transduction is summarized in Fig. 3b, which shows a projection of the free energy onto a rotor site as the site moves through the stator. The binding and dissociation of ions to the rotor site switches the electrostatic potential seen by the rotor, which biases the rotor’s diffusion to the left.
Figure 3.
(a) A typical sequence of events that advance the rotor by one step of 2π/12. Consider the initial position of the rotor shown at ➊. The third site from the left is held in the electrostatic well of the stator charge. Step ➊ → ➋: the rotor fluctuates until the third (empty) site thermally jumps out of the potential well of the stator charge. This jump is biased by the transmembrane potential and is helped by the dielectric barrier preventing the first (empty) rotor site from entering the low-dielectric medium of the stator from the right. ➋ → ➌: once the third rotor site is out of the potential well of the stator charge, it quickly binds a sodium ion from the periplasmic (acidic) reservoir. ➌ → ➍: the positive stator charge pulls the empty fourth rotor site into its potential well. Because the second rotor site is neutralized, it can pass through the dielectric barrier. ➍ → ➎: once the second rotor site passes out of the stator its sodium ion quickly dissociates into the cytoplasmic reservoir. Once empty, it cannot go back into the low dielectric rotor–stator interface. ➎ is exactly the same state as ➊, but shifted to the left by one rotor step. (b) Free energy diagram of one rotor site as it passes through the rotor–stator interface. The chemical reactions of ion binding and dissociation to the rotor site switch the potentials seen by the rotor site between that corresponding to an empty site (solid line) and that corresponding to a neutralized site with an ion bound (broken line). Step A → B: the rotor diffuses to the left, bringing the empty (negatively charged) site into the attractive field of the positive stator charge (R227). B → C: once the site is captured, the membrane potential biases the thermal escape of the site to the left (by tilting the potential and lowering the left edge). C → D: the site quickly picks up an ion from the periplasmic channel, which drops the site to the neutralized site potential (broken line). D → E: this allows the occupied site to pass through the dielectric barrier. (If the site diffuses to the right, the ion quickly dissociates from the site as it approaches the stator charge.) E → F: upon exiting the stator the site loses its sodium ion. Now charged, the site sees the stator dielectric barrier, which prevents back-diffusion. The cycle decreases the free energy of the system by an amount equal to the electromotive force: Δμ = Δψ −2.3(RT/F)ΔpNa, where R is the gas constant, F is the Faraday constant, and pNa is the negative log of the Na concentration. The free energy changes accompanying ion binding from the periplasm (P) and dissociation to the cytoplasm (C) are ΔGP = −(2.3RT/F)(pKa − pNaP) and ΔGC = −(2.3RT/F)(pNaC − pKa), respectively.
To summarize: The sodium motor is driven by biased diffusion of the rotor, the bias provided by the three electrostatic effects listed above. Note that the membrane potential can be viewed as a “power stroke”; however, in the absence of rotor diffusion it cannot drive the motor to the left. Rather, it biases the thermal escape of the rotor to the left.
RESULTS
The Motor Advances Stepwise with Occasional Reversals.
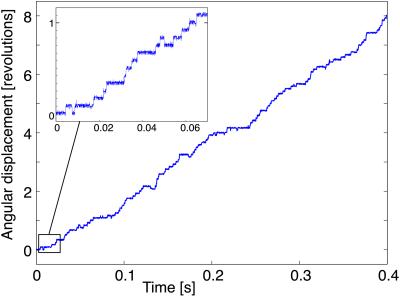
The first requirement of the model is that it rotate at the correct rate and be capable of generating the torque required to release ATP from the catalytic sites of F1 (8). Fig. 4 shows a trajectory of the motor when subject to a load of 45 pN⋅nm. The motor advances stochastically in steps of 2π/12 at a rate of 20 Hz, with occasional reversals. This rotation rate corresponds to an ATP synthesis rate of ≈60 per s (3 ATP per revolution of γ, corresponding to an average of 4 Na+/ATP). This is consistent with the estimated synthesis rate of E. coli and P. modestum (P.D., unpublished results).
Figure 4.
Trajectory of the rotor position, θ(t). The motor advances stochastically in steps of 2π/12, with a mean velocity (slope) of ≈20 Hz. There are occasional reversals whose frequency increases with the Na+ concentration in the cytoplasm because the dielectric barrier is seen only by empty sites.
The Motor Generates a Torque Sufficient to Produce ATP.
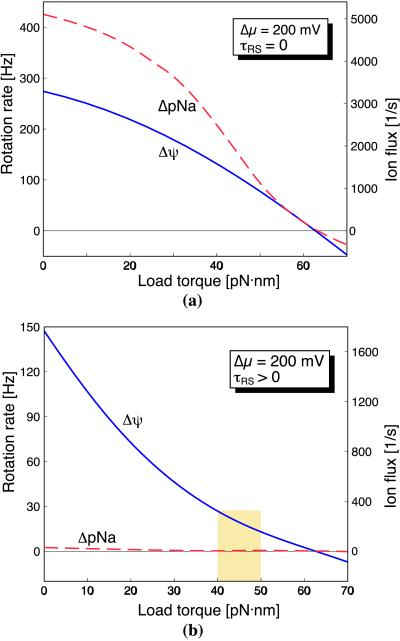
In Fig. 5 we have plotted the rotation rate as a function of the resisting load from F1 [τL(θ) in Eq. 2] for two extreme situations: (i) when the torque is generated completely by the membrane potential, Δψ (solid line), and (ii) when it is generated completely by the ion concentration difference (broken line); combinations lie between the two curves. The figure shows that the model can reproduce the observed synthesis rate when subjected to the required load. When the passive interaction between the rotor and stator is negligible, Fig. 5a shows that the membrane potential and the concentration difference contribute about equally to torque generation. For a load torque between 40 and ≈50 pN⋅nm, the rotation rate is 100 to ≈150 Hz, which corresponds to a synthesis rate of ≈400 per s.
Figure 5.
The motor rotation rate and sodium flux as functions of the load torque. Lines represent the velocity; the sodium flux is tightly coupled and so the flux curves are superimposed on the rotation curves. Each panel compares the results for two different forms of the sodium motive force. Solid lines, the motor is completely driven by the membrane potential, [Na+]P = [Na+]C = 1 mM and Δψ = 200 mV. Broken lines, the motor is completely driven by the ion concentration difference, [Na+]P = 300 mM, [Na+]C = 0.1 mM, and Δψ = 0. (a) Load–velocity curve when the passive rotor–stator interaction, τRS, = 0. In this case, the membrane potential and concentration difference contribute about equally to the torque. (b) Load–velocity curve when the passive rotor–stator interaction, τRS, ≠ 0. In this case, the rate-limiting step is the rotor diffusing out of the retarding potential between the rotor and stator, and the torque is generated almost completely by the membrane potential.
The situation appears to be quite different for bacteria. The ATP synthases of P. modestum and E. coli produce ATP at a much lower rate, ≈50 molecules per s; that is, at physiological operating conditions, the rotation rate is 15–20 Hz. To reduce the model’s rotation rate sufficiently we had to slow the motor by introducing an additional retarding interaction (electrostatic, steric, or both) between the rotor and the stator (τRS in Eq. 2). Since the rotor is 2π/12 symmetrical, we modeled the interaction, τRS(θ), by a 2π/12 periodic potential with a depth of ≈10 kBT; the shape of this potential proved irrelevant. This slowed the rotation rate to the physiological range of P. modestum, as shown in Fig. 5b. The concomitant result of adding this interaction is that the rotation is driven almost completely by the membrane potential, with the concentration difference playing almost no role in torque generation. Indeed, this is just the situation observed under experimental conditions (29, 30).
The Idle Motor Catalyzes the Exchange of Sodium Ions.
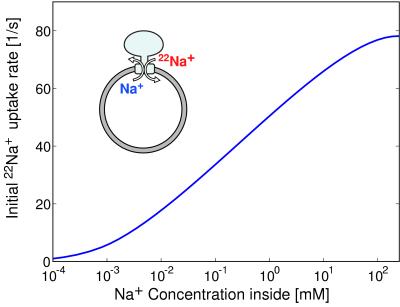
An important check on the assumptions of the model can be obtained from the sodium exchange experiments of Kaim et al. (29). In these experiments, liposomes with ATPase of P. modestum incorporated contained 100 mM NaCl. When the liposomes were exposed to a bath of radioactively labeled 2 mM 22NaCl outside, sodium ions exchanged between the inside and outside, causing a flow of 22Na+ from outside to inside against a 50-fold concentration gradient.
With no potential difference between the inside and outside of the liposomes, the sodium concentration gradient cannot overcome the free energy barrier of the rotor and stator interaction, and the motor will not rotate. However, the rotor can fluctuate and carry a rotor site back and forth through the low-dielectric region of the stator separating the outside and the inside of the liposomes. Because a rotor site must be occupied to pass through this low-dielectric region, each time the rotor site cycles through the region and back, it carries one sodium ion from outside to inside and one from inside to outside. Fig. 6 shows the initial 22Na+ uptake rate as a function of the Na+ concentration inside the liposomes. The 22Na+ uptake decreases as the Na+ concentration inside the liposomes is reduced. This result is consistent with the observation of Kaim and Dimroth (29) that 22Na+ uptake stops if concentration inside is zero.
Figure 6.
Sodium exchange experiment (see text). The computation is explained in the supplemental data published on the PNAS web site (www.pnas.org).
The Motor Operates in Reverse as an Ion Pump.
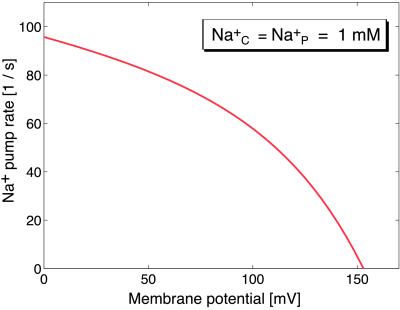
Finally, we require that the motor be capable of performing as an ion pump when driven in reverse by a torque generated in F1 from ATP hydrolysis. We have plotted in Fig. 7 the ion pumping behavior against a range of membrane potentials. In this calculation the motor is driven in reverse by the torque generated in F1 corresponding to an ATP concentration of 1 mM (38).
Figure 7.
The sodium pump rate is plotted versus membrane potential when the Fo motor is driven backwards as a pump by the F1 motor hydrolyzing ATP. The computation is explained in the supplemental data published on the PNAS web site (www.pnas.org).
The Same Operating Principle Can Drive the Proton F-ATPases.
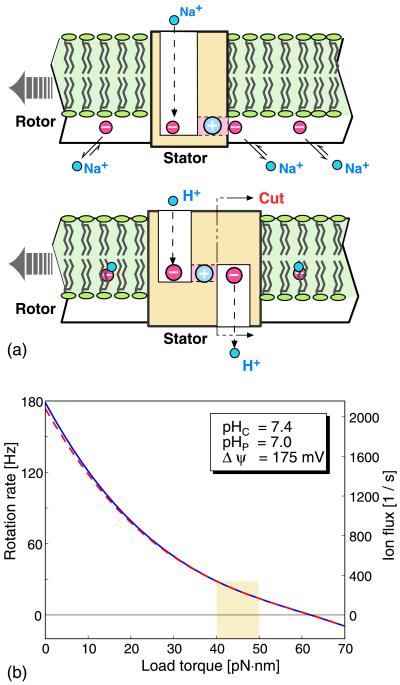
In the proton Fo ATPases, there is some evidence that the rotor site (D61 in E. coli) is not accessible from the cytoplasm as it is in the sodium motor (22, 24, 39). To deal with this situation, Elston et al. (33) proposed a model for torque generation in the proton Fo motor of mitochondria and E. coli. Fig. 8a shows the structural comparison between the one-channel model described above and the two-channel model in ref. 33. The principle of operation is the same in both variants: electrostatic forces bias the rotational diffusion of the rotor. However, Elston et al. assumed that the membrane potential drop takes place entirely across the half-channels, so it plays no role in biasing the escape of a rotor site from the grasp of the stator charge. Fig. 8b shows a comparison between the load–velocity behavior of the two models when the same potential drop exists across the horizontal hydrophilic strip. The parameter values used in the computations are listed in Table 1. We see that the two perform nearly identically.
Figure 8.
(a) The relationship between the one-channel model of P. modestum (Upper) and the two-channel model of E. coli (Lower) (33). In E. coli the rotor sites (D61) may not be accessible from the cytoplasm, but only via a cytoplasmic half-channel. In the sodium motor the cytoplasmic channel is unnecessary because the rotor sites (E65) are accessible directly to the cytoplasmic reservoir. The E. coli stator can be converted to the P. modestum stator simply by cutting off the cytoplasmic channel and moving the row of rotor sites below the membrane level. (b) Comparison of the load–velocity curves for the one-channel model (solid line) and the two-channel model (broken line) applied to the proton-driven E. coli motor. The two models perform practically the same.
Table 1.
Parameter values used in the simulations
| Parameter | H+ ATPase | Na+ ATPase |
|---|---|---|
| Ion diffusion constant (DI), nm2⋅s−1 | 9.3 × 10⁹ | 1.0 × 10⁹ |
| Diffusion constant of rotor (Dr), s−1 | 1.0 × 10⁴ | 1.0 × 10⁴ |
| Dielectric constant of stator (ɛs) | 4.0 | 4.0 |
| Bilayer viscosity (η), poise | 10 | 10 |
| Radius of rotor (R), nm | 3 | 3 |
| Ion conductivity of channel, M−1⋅s−1 | 1.2 × 10¹¹ | 1.2 × 10⁷ |
| pKa of rotor sites | 7.1 | 3.5 |
| Concentration of periplasmic side | pHp = 7.0 | [Na+]p = 1.0 mM |
| Concentration of cytoplasmic side | pHC = 7.4 | [Na+]C = 1.0 mM |
| Membrane potential (Δψ) | 175 mV = 7 kBT | 200 mV = 8.0 kBT |
CONCLUSIONS
We have presented a model for the mechanochemistry of the sodium Fo-ATPase of P. modestum that is in quantitative agreement with the chemical, mechanical, and structural experimental data. The motor is driven by a combination of electrostatic effects: Negatively charged rotor sites that diffuse into the rotor–stator interface are captured by the positive stator charge, R227. Thermal fluctuations permit the captured site to escape long enough to pick up an ion from the periplasmic channel. This escape is biased by the membrane potential. When occupied, a rotor site is nearly neutral, and it can then pass through the hydrophobic rotor–stator interface to the cytoplasm. Once a site has lost its ion to the cytoplasm its diffusive motions are “ratcheted”: it cannot move backwards into the hydrophobic portion of the rotor–stator interface. Thus the rotor progresses driven by a combination of electrostatic attraction and biased diffusion (40). This mechanism is capable of generating sufficient torque to release ATP from the catalytic sites of F1 in accordance with the binding change mechanism. When driven in reverse, the motor performs as an efficient sodium pump, which suggests a relationship with the structurally similar V-ATPase proton pumps—a connection that will be treated in a subsequent publication. Finally, we should note that there are similarities between the model presented here and the model of Berg and Kahn for the bacterial flagellar motor (41, 42). This similarity is perhaps not surprising because it has long been speculated that there is an evolutionary relationship between the two. This also suggests that the mechanism elucidated here may be employed widely by cells to convert transmembrane electrochemical gradients into mechanical motions.
Supplementary Material
Acknowledgments
G.O. and H.W. were supported by National Science Foundation Grant DMS 9220719.
Footnotes
This paper was submitted directly (Track II) to the Proceedings Office.
A Commentary on this article begins on page 4735.
The height of this barrier is given approximately by ≈200 [(1/ɛc) − (1/ɛs)] ≈ 45kBT ≈ 27 kcal/mol (kB is the Boltzmann constant and T is the absolute temperature; 1 kcal = 4.18 J), where ɛc and ɛs are the dielectric constants of the aqueous channel and the stator, respectively (37).
References
- 1.Futai M, Omote H, Maeda M. Biochem Soc Trans. 1995;23:785–789. doi: 10.1042/bst0230785. [DOI] [PubMed] [Google Scholar]
- 2.Fillingame, R. (1990) in Molecular Mechanics of ATP Synthesis by F1Fo-Type Proton-Transporting ATP Synthases, Bacterial Energetics, ed. Krulwich, T. (Academic, London), Vol. 12, pp. 345–392.
- 3.Deckers-Hebestreit G, Altendorf K. Annu Rev Microbiol. 1996;50:791–824. doi: 10.1146/annurev.micro.50.1.791. [DOI] [PubMed] [Google Scholar]
- 4.Dimroth P. Biochim Biophys Acta. 1997;1318:11–51. doi: 10.1016/s0005-2728(96)00127-2. [DOI] [PubMed] [Google Scholar]
- 5.Weber J, Senior A E. Biochim Biophys Acta. 1997;1319:19–58. doi: 10.1016/s0005-2728(96)00121-1. [DOI] [PubMed] [Google Scholar]
- 6.Allison W. Acc Chem Res. 1998;31:819–826. [Google Scholar]
- 7.Abrahams J, Leslie A, Lutter R, Walker J. Nature (London) 1994;370:621–628. doi: 10.1038/370621a0. [DOI] [PubMed] [Google Scholar]
- 8.Boyer P. Biochim Biophys Acta. 1993;1140:215–250. doi: 10.1016/0005-2728(93)90063-l. [DOI] [PubMed] [Google Scholar]
- 9.Duncan T M, Bulygin V V, Zhou Y, Hutcheon M L, Cross R L. Proc Natl Acad Sci USA. 1995;92:10964–10968. doi: 10.1073/pnas.92.24.10964. [DOI] [PMC free article] [PubMed] [Google Scholar]
- 10.Sabbert D, Engelbrecht S, Junge W. Nature (London) 1996;381:623–625. doi: 10.1038/381623a0. [DOI] [PubMed] [Google Scholar]
- 11.Noji H, Yasuda R, Yoshida M, Kinosita K. Nature (London) 1997;386:299–302. doi: 10.1038/386299a0. [DOI] [PubMed] [Google Scholar]
- 12.Yasuda R, Noji H, Kinosita K, Yoshida M. Cell. 1998;93:1117–1124. doi: 10.1016/s0092-8674(00)81456-7. [DOI] [PubMed] [Google Scholar]
- 13.Capaldi R, Aggeler R, Wilkens S, Gruber G. J Bioenerg Biomembr. 1996;28:397–401. doi: 10.1007/BF02113980. [DOI] [PubMed] [Google Scholar]
- 14.Kato-Yamada Y, Noji H, Yasuda R, Kinosita K, Jr, Yoshida M. J Biol Chem. 1998;273:19375–19377. doi: 10.1074/jbc.273.31.19375. [DOI] [PubMed] [Google Scholar]
- 15.Birkenhager R, Hoppert M, Deckers-Hebestreit G, Mayer F, Altendorf K. Eur J Biochem. 1995;230:58–67. [PubMed] [Google Scholar]
- 16.Singh S, Turina P, Bustamante C J, Keller D J, Capaldi R. FEBS Lett. 1996;397:30–34. doi: 10.1016/s0014-5793(96)01127-1. [DOI] [PubMed] [Google Scholar]
- 17.Takeyasu K, Omote H, Nettikadan S, Tokumasu F, Iwamoto-Kihara A, Futai M. FEBS Lett. 1996;392:110–113. doi: 10.1016/0014-5793(96)00796-x. [DOI] [PubMed] [Google Scholar]
- 18.Lill H, Hensel F, Junge W, Engelbrecht S. J Biol Chem. 1996;271:32737–32742. doi: 10.1074/jbc.271.51.32737. [DOI] [PubMed] [Google Scholar]
- 19.Ogilvie I, Aggeler R, Capaldi R A. J Biol Chem. 1997;272:16652–16656. doi: 10.1074/jbc.272.26.16652. [DOI] [PubMed] [Google Scholar]
- 20.Yamada H, Moriyama Y, Maeda M, Futai M. FEBS Lett. 1996;390:34–38. doi: 10.1016/0014-5793(96)00621-7. [DOI] [PubMed] [Google Scholar]
- 21.Jäger H, Birkenhäger R, Stalz W D, Altendorf K, Deckers-Hebestreit G. Eur J Biochem. 1998;251:122–132. doi: 10.1046/j.1432-1327.1998.2510122.x. [DOI] [PubMed] [Google Scholar]
- 22.Long J C, Wang S, Vik S B. J Biol Chem. 1998;273:16235–16240. doi: 10.1074/jbc.273.26.16235. [DOI] [PubMed] [Google Scholar]
- 23.Valiyaveetil F, Fillingame R. J Biol Chem. 1998;273:16241–16247. doi: 10.1074/jbc.273.26.16241. [DOI] [PubMed] [Google Scholar]
- 24.Girvin M, Rastogi V, Abildgaard F, Markley J, Fillingame E. Biochemistry. 1998;37:8817–8824. doi: 10.1021/bi980511m. [DOI] [PubMed] [Google Scholar]
- 25.Kaim G, Wehrle F, Gerike U, Dimroth P. Biochemistry. 1997;36:9185–9194. doi: 10.1021/bi970831q. [DOI] [PubMed] [Google Scholar]
- 26.Kaim G, Matthey U, Dimroth P. EMBO J. 1998;17:688–695. doi: 10.1093/emboj/17.3.688. [DOI] [PMC free article] [PubMed] [Google Scholar]
- 27.Kaim G, Dimroth P. J Mol Biol. 1995;253:726–738. doi: 10.1006/jmbi.1995.0586. [DOI] [PubMed] [Google Scholar]
- 28.Kaim G, Dimroth P. Biochemistry. 1998;37:4626–4634. doi: 10.1021/bi973022f. [DOI] [PubMed] [Google Scholar]
- 29.Kaim G, Dimroth P. EMBO J. 1998;17:5887–5895. doi: 10.1093/emboj/17.20.5887. [DOI] [PMC free article] [PubMed] [Google Scholar]
- 30.Kaim G, Dimroth P. FEBS Lett. 1998;434:57–60. doi: 10.1016/s0014-5793(98)00969-7. [DOI] [PubMed] [Google Scholar]
- 31.Junge W, Lill H, Engelbrecht S. Trends Biochem Sci. 1997;22:420–423. doi: 10.1016/s0968-0004(97)01129-8. [DOI] [PubMed] [Google Scholar]
- 32.Vik S B, Antonio B J. J Biol Chem. 1994;269:30364–30369. [PubMed] [Google Scholar]
- 33.Elston T, Wang H, Oster G. Nature (London) 1998;391:510–514. doi: 10.1038/35185. [DOI] [PubMed] [Google Scholar]
- 34.Groth G, Walker J. FEBS Lett. 1997;410:117–123. doi: 10.1016/s0014-5793(97)00529-2. [DOI] [PubMed] [Google Scholar]
- 35.Gardiner C. Handbook of Stochastic Methods. New York: Springer; 1985. [Google Scholar]
- 36.Risken H. The Fokker-Planck Equation. New York: Springer; 1989. [Google Scholar]
- 37.Israelachvili J. Intermolecular and Surface Forces. New York: Academic; 1992. [Google Scholar]
- 38.Wang H, Oster G. Nature (London) 1998;396:279–282. doi: 10.1038/24409. [DOI] [PubMed] [Google Scholar]
- 39.Jones P, Jiang W, Fillingame R. J Biol Chem. 1998;273:17178–17185. doi: 10.1074/jbc.273.27.17178. [DOI] [PubMed] [Google Scholar]
- 40.Peskin C S, Odell G M, Oster G. Biophys J. 1993;65:316–324. doi: 10.1016/S0006-3495(93)81035-X. [DOI] [PMC free article] [PubMed] [Google Scholar]
- 41.Berg H, Khan S. In: A Model for the Flagellar Rotary Motor. Sund H, Veeger C, editors. Berlin: de Gruyter; 1983. pp. 485–497. [Google Scholar]
- 42.Meister M, Caplan S R, Berg H C. Biophys J. 1989;55:905–914. doi: 10.1016/S0006-3495(89)82889-9. [DOI] [PMC free article] [PubMed] [Google Scholar]
Associated Data
This section collects any data citations, data availability statements, or supplementary materials included in this article.


