

Abstract
Strong, actomyosin-dependent, pinching tractions in steadily locomoting (gliding) fish keratocytes revealed by traction imaging present a paradox, since only forces perpendicular to the direction of locomotion are apparent, leaving the actual propulsive forces unresolved. When keratocytes become transiently “stuck” by their trailing edge and adopt a fibroblast-like morphology, the tractions opposing locomotion are concentrated into the tail, leaving the active pinching and propulsive tractions clearly visible under the cell body. Stuck keratocytes can develop ∼1 mdyn (10,000 pN) total propulsive thrust, originating in the wings of the cell. The leading lamella develops no detectable propulsive traction, even when the cell pulls on its transient tail anchorage. The separation of propulsive and adhesive tractions in the stuck phenotype leads to a mechanically consistent hypothesis that resolves the traction paradox for gliding keratocytes: the propulsive tractions driving locomotion are normally canceled by adhesive tractions resisting locomotion, leaving only the pinching tractions as a resultant. The resolution of the traction pattern into its components specifies conditions to be met for models of cytoskeletal force production, such as the dynamic network contraction model (Svitkina, T.M., A.B. Verkhovsky, K.M. McQuade, and G.G. Borisy. 1997. J. Cell Biol. 139:397–415). The traction pattern associated with cells undergoing sharp turns differs markedly from the normal pinching traction pattern, and can be accounted for by postulating an asymmetry in contractile activity of the opposed lateral wings of the cell.
Keywords: cell locomotion, traction stresses, keratocytes, actomyosin
E pidermal fish and amphibian keratocytes (Bereiter-Hahn et al., 1981; Euteneuer and Schliwa, 1986) have emerged as important models for cell locomotion for several reasons. These cells often exhibit a very regular form of locomotion that proceeds with nearly constant speed and direction while maintaining a distinctive semicircular shape. This means that the kinematic rules of locomotion can be established (Lee et al., 1993) and that perturbations in locomotion resulting from, for example, alterations in adhesion (de Beus and Jacobson, 1998) or changes in local ionic composition (Mittal and Bereiter-Hahn, 1985) can readily be discerned. An explicit understanding of the physics of locomotion in a morphologically simple model system should reveal principles that are conserved in more complex forms of motility; for example, in parts of a cell that display, overall, a morphologically complicated locomotory phenotype. Moreover, as details of keratocyte cytoskeletal ultrastructure (Small et al., 1995; Svitkina et al., 1997) and dynamics (Theriot and Mitchison, 1991; Anderson et al., 1996) and force generation (Lee et al., 1994) emerge, the simplified nature of this biological model may allow an understanding of how many diverse molecular mechanisms are integrated into the locomotory phenotype.
To locomote, a cell must be capable of exerting traction on a substratum, the extracellular matrix, or on other cells. The traction forces that locomoting keratocytes exert have recently been spatially resolved on silicone rubber substrata (Lee et al., 1994; Oliver et al., 1995, 1998; Dembo et al., 1996). In this method, crawling cells are plated on thin silicone rubber films. The traction stresses exerted by the cells on the substratum generate two-dimensional deformations, which are monitored by measuring the displacements of 1-μm polystyrene latex beads embedded in the films. Computational techniques are then used to convert the displacement information into an image of the traction stress distribution (Dembo et al., 1996). Such “traction imaging” is significant for its ability to reveal absolute and relative traction stresses generated beneath individual cells with temporal resolution of <1 s. The spatial resolution of the method is on the order of 5 μm.
However, our previous results showing the predominant equatorial or “pinching” traction pattern exhibited by gliding keratocytes was paradoxical in that the major traction stresses revealed were exerted perpendicular to the direction of keratocyte locomotion. The current study resolves this paradox showing how the propulsive tractions driving locomotion are normally canceled by adhesive tractions resisting locomotion, leaving only the equatorial tractions as a resultant. This conclusion was made possible by the analysis of tethered cells in which the propulsive and adhesive tractions are clearly separated. In this case, the adhesive tractions become concentrated to the stationary tail region, while the propulsive tractions remain resident in the body of the tethered cell that creeps forward. Moreover, the resolution of the traction pattern into its components specifies conditions to be met for models of cytoskeletal force production, such as the dynamic network contraction model (Svitkina et al., 1997), and a comparison of our results with this model indicates that several revisions of the model are required.
The properties of traction images can also be exploited to clarify the mechanism by which cells regulate adhesion and contractility to control and maintain the direction of locomotion. For example, when cells move in circular paths they must rotate as well as translate, which means that it is necessary for them to exert propulsive torque. In principle, the existence of such torque should result in a well-defined change in the cell-substratum traction image. However, the identification of propulsive torque is obscured by the superposition of frictional torque, but the situation can be clarified by studying cells that demonstrate marked alterations of normal motility. In particular, we have examined the traction images of individual keratocytes in which normal rectilinear gliding motion has been replaced by a continual circling or turning motion. In such locomotory patterns, the traction image of the turning phenotype is radically altered compared with the standard pinching pattern seen in gliding cells. These alterations form the basis for a simple model of the disturbances of force and torque that underlie the turning phenotype.
Other recent techniques to measure cell substratum tractions include those developed by Pelham and Wang (1997) based on polyacrylamide substrata, and a refined wrinkling method described by Burton and Taylor (1997). Cell-substratum tractions have also been measured using microscopic cantilevers machined into silicon substrata (Galbraith and Sheetz, 1997).
Materials and Methods
Reagents
Pharmacological agents: 2,3-butanedione 2-monoxime (BDM;1 Sigma Chemical Co), an inhibitor of actin–myosin interactions, and 1-(5-isoquinolinyl sulfonyl)-2-methyl piperazine (H7; Sigma Chemical Co.), a broad specificity kinase inhibitor, were dissolved in water as stock solutions of 500 and 30 mM, respectively. KT 5926 (Calbiochem Corp.), an inhibitor of myosin light chain kinase, was dissolved in DMSO as a stock solution of 6 mM. Stock solutions were used to make working dilutions of each drug in serum free tissue culture medium.
Cells
Freshwater molly fish, Poecilia sphenops, from a local pet shop, were kept in tanks at ambient room temperature. Marine killifish, Fundulus heteroclitus, were kept in recirculating seawater tanks at the Marine Biological Laboratory (Woods Hole, MA). Primary cell cultures of fish epidermal keratocytes from both species were similarly prepared as previously described (Oliver et al., 1995). Molly fish cells were used in all experiments except for the high-resolution microscopy studies, which used killifish cells.
Silicone Rubber Traction Force Measurements
Nonwrinkling, Elastic Substrata.
Nonwrinkling, elastic substrata in Rappaport chambers (22-mm diameter Pyrex tubing cut into 8-mm cylinders) were made as previously described (Oliver et al., 1995), and used for quantitative traction mapping. Vaseline/lanolin/paraffin wax (VALAP) was substituted for vacuum grease to make a better cover glass seal at the chamber's base.
Traction Mapping.
Traction mapping is a computer deduction of the spatial distribution of cell traction stresses, based on reproducing the observed patterns of multiple particle displacements in a two-dimensional material with elastic properties. An individual traction stress generated by the cell against the substratum is represented as an arrow, whose length and direction is proportional to the magnitude and direction of that stress. Confidence in the traction data is measured by a statistical test of the data robustness after the introduction of random Gaussian noise to the bead displacement data. Since addition of random noise to the displacements could be in any direction, it was necessary to repeat this operation for a sufficiently large sample of trials to yield a statistical sample of related traction maps. The results of 10 of these independent simulations are summarized as a cluster of four maximum likelihood error vectors (known as a “bootstrap,” see Dembo et al., 1996) at each node. The box defined by the pointed ends of the four bootstrap vectors gives a measure of the uncertainty of both the direction and magnitude of the computed traction stress. That is, if one does a series of independent trials in which the maximum likelihood displacement arrows are perturbed by adding noise as described above, then the pointed end of the recomputed traction vectors lie inside this box 66% of the time. In particular, the “angle of spread” defined by the bootstrap vectors is a graphical device to indicate on the map how well traction directions may be resolved above background noise. Thus, a spread of 360° is indicative of a poor signal/noise ratio. Conversely, one would place high confidence in a spread of as little as 30°.
Wrinkling, Elastic Substrata.
Wrinkling rubber was used for qualitatively monitoring traction forces in the presence of actomyosin-perturbing drugs and was prepared as previously described (Pletjushkina et al., 1998; Oliver et al., 1998), with the following modification. Wrinkling rubber was prepared by glow discharge vulcanization of a small drop of silicone oil (3–4 μl of dimethylpolysiloxane, 12,500 centistokes; Sigma Chemical Co.), placed at the center of a cover glass that had been precleaned in 8 M HCl, rinsed in distilled water, and dried. Cells in suspension, concentrated in a small drop of tissue culture medium, were allowed to attach to cover glasses with and without an island of wrinkling silicone rubber ∼4 mm in diameter. A cover glass with adherent cells was assembled into a microscope slide flowchamber (Fig. 1). The flowchamber represented an improved means of maintaining uninterrupted imaging of cells during changes of the incubating medium. Only the flat, wrinkle-free central area of the silicone rubber island was used for cell observations. Relative wrinkling levels were measured in an unbiased and semiautomated way. First, a Sobell edge-finding algorithm was applied to the raw video images to render pixels occupied by wrinkles as black (zero gray level). The area of the film wrinkled was then expressed as the percentage of black pixels counted in each panel, after manually correcting for the presence of cell edges and other black, nonwrinkle objects. The relative degree of wrinkling before and after drug application was displayed as a histogram normalized to 100% wrinkling for control cells.
Figure 1.

Side and top view of flowchamber, modified from an apparatus designed by Dr. Joseph Wolenski for molecular motility assays (personal communication, 1995 Physiology Course; Marine Biology Laboratory). Two cover glasses, 25 × 50 and 25 × 40 mm, form the “floor” and “roof,” respectively, of a flowcell that is open at each end, but closed on its long sides by glass or plastic spacers. Vacuum grease is used to assemble these components and is also used to surround each entrance to the flowcell with circular “berms.” These grease enclosures permit drugs or appropriate medium changes to be introduced into the chamber from one side with a Pasteur pipette and aspirated from the other side with a finely drawn out plastic transfer pipette or filter paper cut into strips. This can be easily done without leaking fluid onto the microscope or disturbing the position of the stage. Cells are allowed to attach to one face of the chamber interior before assembly; alternatively, they may be introduced into the chamber as a cell suspension and allowed to settle out onto the chamber floor. To facilitate handling, the flowchamber is attached to a flat aluminum plate, similar in overall dimensions to a regular glass microscope slide. A cutout in this plate permits good optical contact to be made between the chamber and oil immersion objectives and condensers, on either an upright or an inverted microscope. In addition, the rigidity of this plate prevents the glass chamber from flexing during focusing of oil immersion objectives. This basic design was further modified by incorporating an island of silicone rubber onto the floor of the chamber, onto which single cells were attached before assembly. In this configuration of the flow chamber, thicker spacers and long working distance objectives were required to access the focal plane of the cells.
Drug Perfusion Flowchamber for Continuous Monitoring of Cell Traction during Locomotion
It was not feasible to make large numbers of traction maps for the drug experiments due to the constraints imposed by full traction mapping. These include sensitivity of elastic films to changes in medium in the Rappaport chamber, sampling error implicit in studying small numbers of cells, and time and effort required to map many cells (Oliver et al., 1995; Dembo et al., 1996). Instead, we applied the semiquantitative wrinkling assay (see for example Chrzanowska-Wodnicka and Burridge, 1996), modified here for a flowchamber, which is ideally suited to sampling many cells simultaneously while maintaining uninterrupted observation of cell traction force generation during repeated changes in medium. The choice of spacer in the chamber was a compromise between a thin spacer that minimized the “dead volume” (∼200 μl) of the chamber and discouraged unstirred layers during perfusion, and a thick spacer that permitted adequate perfusion of adherent cells located in the narrow region of the chamber between the silicone rubber island and the chamber roof. Unattached cells and loose cell debris were washed away by flushing several changes of tissue culture medium through the flow chamber before image recording. Drug solutions were added to the slide in increasing concentrations by freely dropping them onto the space enclosed by a “berm” of grease on one side of the chamber. A strip of filter paper was used to wick away solutions from the other side of the slide, drawing a stream of fluid through the chamber by capillarity. Only in this way could a single cell be observed at high magnification or a group of cells studied at low magnification during multiple chamber perfusions without interrupting the continuity of video recording.
Video Microscopy
Microscopy, image processing, and analysis were performed as previously described (Oliver et al., 1995, 1998; Dembo et al., 1996). Video images from a Dage Newvicon camera were captured as digital TIFF files on a Matrox LC imaging card, driven by the time-lapse dialogue of MetaMorph (Universal Imaging Corp.). Stacks of TIFF files were replayed as movies to detect motion. Individual TIFF files were removed from stacks for image analysis on Image-1 software (Universal Imaging Corp.).
Results
Traction Patterns for Gliding Keratocytes
Fig. 2, a and b, shows the relationship between the phase contrast and traction images of a keratocyte locomoting with nearly constant speed and direction. Note that the major traction stresses are directed perpendicular to the cell's direction of locomotion, in a pincer-like pattern. In Fig. 2 c, the small “angle of spread” (good coherence) of four summary bootstrap vectors at a single traction node in the lateral lamella (rectangular inset) indicates strong confidence in substantial, equatorially directed pinching tractions at this location. Conversely, the large angle of spread at a node in the leading lamella (circled inset) indicates traction stresses of a magnitude below the assay's threshold of detection. For comparison, a single keratocyte is shown on wrinkling rubber in Fig. 2 d. The large wrinkle parallel to the direction of locomotion is qualitatively consistent with the equatorially oriented pincer-like tractions exerted in the gliding mode of locomotion.
Figure 2.

(a) Phase contrast micrograph of a keratocyte engaged in steady state gliding locomotion on a silicone rubber substratum with embedded beads, in the direction indicated by the large arrow. Cell is outlined in white for clarity. (b) Traction map for the same cell. Each small arrow represents the magnitude and direction of the traction stress at the location corresponding to the tail of the arrow. (c) The same data as in b with “bootstrap” tractions. This statistical treatment of the data indicates graphically the level of confidence in the traction stresses after randomly generated noise is added to the bead displacements. The tighter the angular distribution of tractions, the better the level of confidence in the direction of the traction vector. (d) Differential interference contrast image of a keratocyte locomoting on a strongly cross-linked silicone rubber substratum. Note the large compression wrinkle beneath and parallel to the cell's axis of locomotion. The cell is moving forward in the direction shown by the arrow. Bars: 10 μm.
A stable pattern of tractions during 2 min of steady rectilinear gliding locomotion for one cell is seen in Fig. 3. Minor deviations from a mean pattern may reflect temporal changes in cell shape, adhesion distribution, and velocity as well as the local properties of the substrata.
Figure 3.
Time-lapse traction map series for a keratocyte undergoing steady gliding in a straight line. Bold arrow indicates direction of locomotion. Time interval between panels is 30 s.
Wrinkling Is Dependent on Actomyosin Interactions
Chrzanowska-Wodnicka and Burridge (1996) have shown that 20 mM BDM, and 15 μM KT 5926 can each inhibit the wrinkling of silicone rubber substrata by BalbC 3T3 cells in response to lysophosphatidic acid (LPA), (while 300 μM H7 inhibited myosin light chain incorporation of 32P). To test whether traction force development in keratocytes is also dependent on the contractility of actomyosin, we carried out a similar wrinkling study.
General Effects of Contractility Inhibiting Agents on Keratocytes Locomoting on Glass
Fig. 4, a–c, illustrates a single cell locomoting on glass before, during, and after chamber perfusion with 10 mM BDM. Within 5 min of exposure to BDM, keratocytes adopt a stationary but ruffling “fried egg” phenotype (Fig. 4 b), may exhibit a partial loss of the fan shaped lamellipodium in this less polarized morphology but otherwise remain adherent, and spread. Removal of the drug quickly restores the fan shape (Fig. 4 c). Fig. 4, d–f, illustrates a population of cells on glass before (d), during, and after perfusion with a concentration of 750 μM H7. Again, nonpolarized, immotile “fried egg” cells predominate within 7 min of adding drug (Fig. 4 e). Gliding fan shapes are restored after washing out the drug (Fig. 4 f). Similar morphological and locomotory changes occur in the presence of 100 μM KT 5926, but not with the solvent (DMSO) control.
Figure 4.

The effect of BDM and H7 on keratocytes locomoting on glass substrata. (a–c) DIC time-lapse images from a flowchamber experiment illustrate typical behavior of a single killifish keratocyte before (a), during (b), and after (c) perfusion with 10 mM BDM. This rapidly locomoting cell was kept in the microscope's field of view (image is ∼65 μm wide) over the course of the experiment by tracking it with the microscope stage. (d–f) DIC time lapse images from another flowchamber experiment illustrate the behavior of a sample of goldfish keratocytes before (d), during (e), and after (f) perfusion with 750 μM H7. Cells in control medium (d) were predominantly polarized, fan shaped, and locomoting. 7 min after the application of H7 (e), most cells were stationary and had a “fried-egg” morphology. Observation was continued for 73 min of exposure to H7. (f) 13 min after the drug was washed out with control medium, cells have regained their locomotory (fan-shaped) morphology. Few cells detached, despite their loss of polarity in the presence of H7. Field of view is fixed and ∼350-μm wide. Arrows on various panels indicate direction of locomotion for particular cells.
Table I shows how keratocytes locomoting on glass respond to increasing concentrations of BDM, and this data illustrates the extreme sensitivity of a sample of keratocytes to concentrations of BDM >4 mM. Overall morphology and locomotion for this sample of cells is expressed as an index of motility (IM), where IM = (number of locomoting fan-shaped cells/total number of adherent cells) × 100. In general, as the drug concentration and exposure time increased, the IM approached 0 as a greater proportion of the cells lost polarity and stopped locomoting. The effects of BDM are reversible. Cells readily recovered their locomotory phenotype and reestablished a high IM within a short time after drug washout. Individual cells remained adherent to the substratum in the presence of BDM concentrations up to 100 mM, and withstood the shear forces generated by the flowchamber. This indicates that cell adhesion is maintained even when motility is inhibited by BDM. A similar effect on motility was observed for cells on glass in the presence of increasing concentrations of H7, with a maximum effect seen at ∼750 μM (data not shown).
Table I.
Inhibition of Keratocyte Locomotion by BDM
| Experiment | BDM concentration (mM) | n | ||||||||||||||||
|---|---|---|---|---|---|---|---|---|---|---|---|---|---|---|---|---|---|---|
| 0 (control) | 1 | 2 | 4 | 6 | 8 | 10 | 0 (washout) | |||||||||||
| Index of motility (IM)* | ||||||||||||||||||
| A | 96 | 74 | 57 | — | — | — | — | 90 | 24 | |||||||||
| B | 100 | — | — | 23 | — | — | — | 100 | 25 | |||||||||
| C | 70 | — | — | — | 0 | — | — | 65 | 23 | |||||||||
| D | 80 | — | — | — | — | 0 | — | 77 | 30 | |||||||||
| E | 77 | — | — | — | — | — | 0 | 75 | 21 | |||||||||
Index of motility for keratocytes on glass ± BDM. n, number of cells.
Effects of Myosin Inhibitors on Traction Force Generation (Wrinkling)
Fig. 5 shows the principle of the wrinkling assay for a single keratocyte. The prominent wrinkle characterizing control cells is parallel to the direction of locomotion (Fig. 5 a). This is consistent with the strong pincer-like equatorial tractions previously mapped (Fig. 2; Oliver et al., 1995). This wrinkle relaxed substantially in the presence of 50 mM BDM (Fig. 5 b), indicating a considerable reduction in equatorial tractions; the effect is reversible by removing the drug (Fig. 5 c). A sample of control cells generated a tight network of multiple traction wrinkles (data not shown). Wrinkles diminished after perfusion with BDM or KT 5926 and were reestablished within minutes of washout. Fig. 6 summarizes the relative degree of wrinkling assayed for these two drugs, normalized to control cells. There was a 75–80% reduction in wrinkling in the presence of 100 mM BDM and 0.1 mM KT 5926, with recovery to ∼56% of control values after drug washout. The number of cells sampled in a single field of view was similar for each of the drugs tested, and this number remained constant despite repeated perfusions of the same chamber (mean cell count = 73.8 ± 11.4 for nine trials in three chambers). Slight variation in cell number over time could be accounted for by the passage of locomoting cells into and out of the field of view, by the presence of clumps of cells, or by the occasional detachment of cells during perfusion. Both BDM and KT 5926 reduced wrinkling, but at markedly different concentrations, consistent with the order of efficacy in a similar assay using BalbC 3T3 cells (Chrzanowska-Wodnicka and Burridge, 1996).
Figure 5.
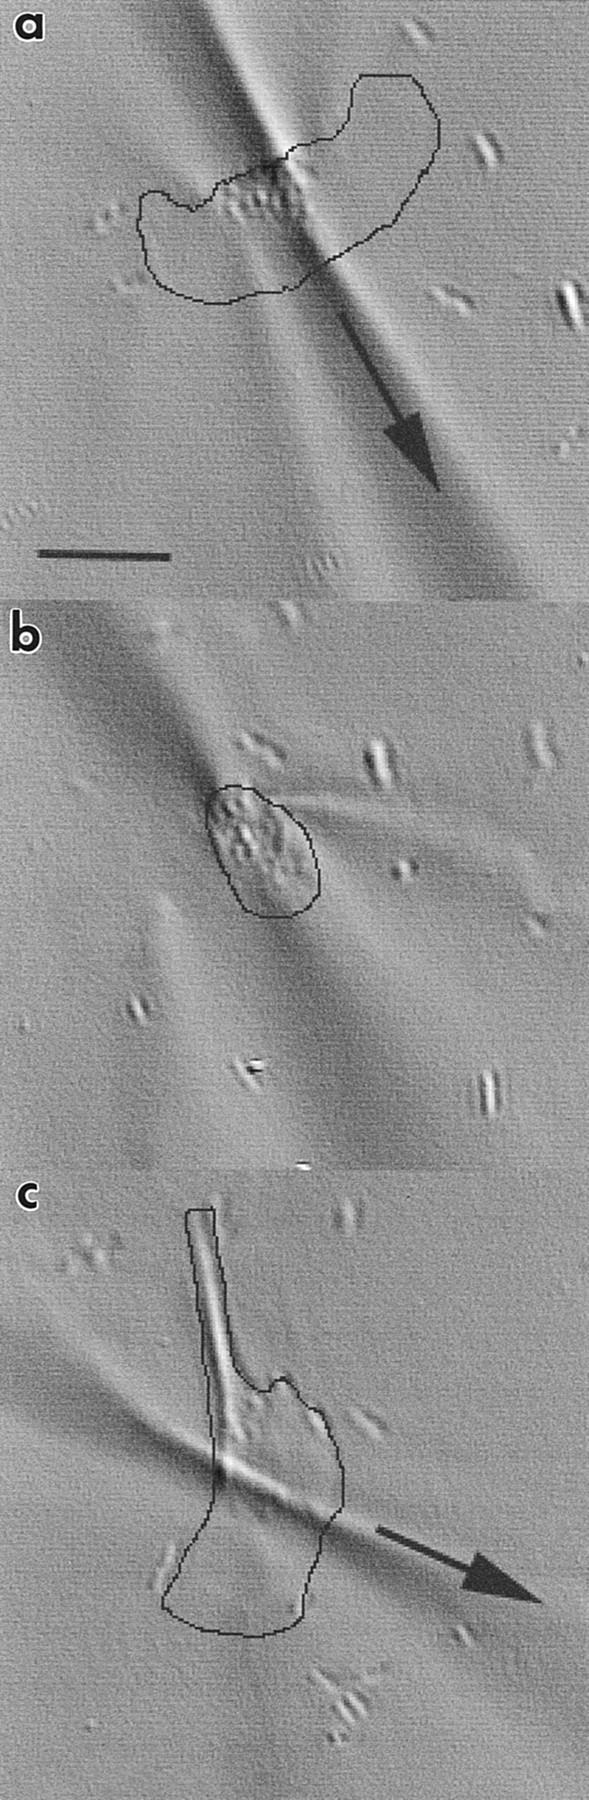
The effect of BDM on a single keratocyte locomoting on wrinkling substrata. Time-lapse images from a flowchamber experiment before (a), during (b), and after (c) perfusion with 50 mM BDM. Cell margins are outlined in black for clarity. Arrows indicate direction of cell locomotion. Bar, 25 μm.
Figure 6.

Summary histogram of relative wrinkling (measured as described in Materials and Methods) in the presence and absence of BDM and KT 5926.
Tractions Exerted by Cells that Become Stuck at Their Trailing Edges
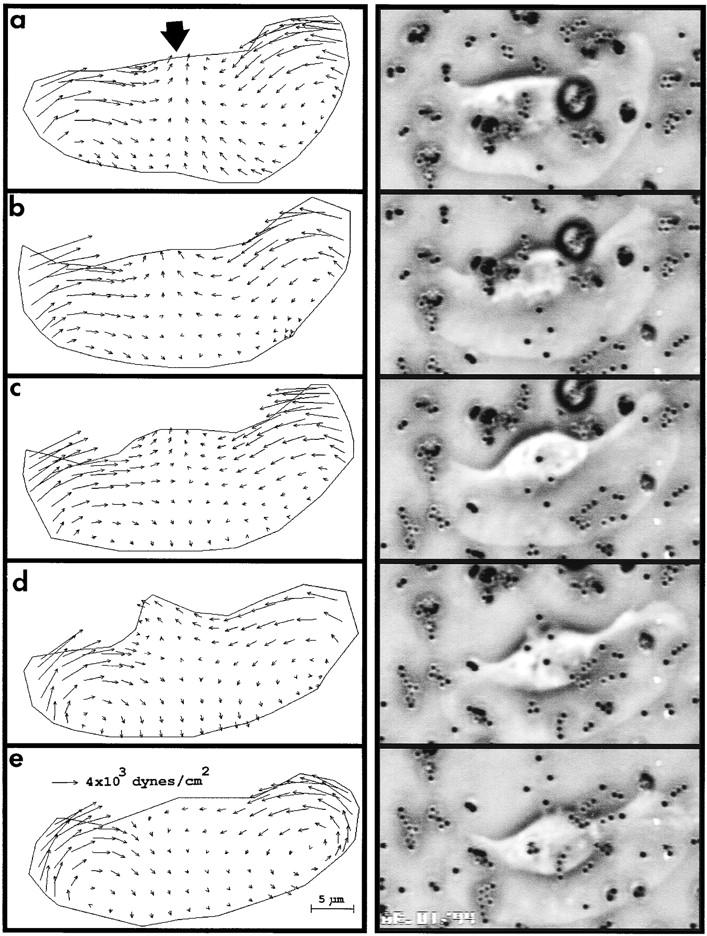
A clear alteration of the steady state traction distribution is seen in keratocytes that become spontaneously attached to the substratum at their trailing edges. When this happens, the body of the cell continues to move forward, with the result that tails of varying length develop and the cell assumes a fibroblast-like morphology. Fig. 7, a and b, shows two time points in the process of tail growth for a single cell. This figure clearly shows that, within 50 s, pinching tractions reorient to provide both pinching and significant rearward-directed “propulsive” tractions in the cell body. At the same time, forward-directed “frictional” tractions become visible in the tail. Note that tractions remain negligible at the narrow “midbody” as well as at the leading edge.
Figure 7.

Traction maps for three cells, a–b, c, and d, whose trailing edges have adhered to sticky patches on nonwrinkling silicone substratum. The first two maps are accompanied by original phase contrast micrographs of the cell. S indicates the location of a sticky patch at the rear of each cell in c and d. Bold arrows indicate direction of locomotion. Time interval separating images a and b is 50 s.
Fig. 7, c and d, shows traction maps for two additional stuck cells, one with a very short tail and one with a very long tail. In all cases, the tail remained in place while the cell body continued to slowly advance and exert pinching tractions. The speed of advance of the cell body was diminished compared with the gliding cell, but the magnitude of the mean squared traction generated by the cell was increased by 10–20% (mean squared traction is the area average of the norm of the traction vector). However, in addition to the pinching tractions, the cell body of the stuck cell exerts a distinct component of propulsive (rearward-directed) traction. These propulsive tractions have the same location as the pinching tractions, i.e., in the wings of the cell.
Surprisingly, tractions at the leading edge of a stuck cell are not significantly altered from those of the gliding cell (i.e., the tractions at the leading edge remain negligible when the cell is stuck). In all cases of stuck cells, adhesion at the tail eventually ruptured. Subsequent to such rupture, all stuck cells recovered a normal fan shape and resumed the steady state gliding mode. The length of the tail when rupture occurred was unpredictable (both examples of stuck cells shown in Fig. 7, c and d, represent the condition just before rupture). The frictional tractions occurring in the tail of stuck cells had a maximal magnitude of ∼12 × 103 dyn/cm2. The total force propelling the cell body forward against the retarding load of the tail was on the order of 1 mdyn. This value was obtained by integrating stress over the adherent tail of the cell.
Turning Cells
Fig. 8 a shows a representative traction map for a cell turning clockwise (the turning radius is greater than four cell diameters). This figure shows that during long radius turning there is minimal redistribution of tractions compared with the traction map for steady state locomotion (compare with Fig. 2 b or 3 e). This is consistent with little or no change to the cell's shape. A similar pattern (in mirror image) was seen for cells turning in the opposite direction (not shown).
Figure 8.

(a) The traction map for a cell making a long radius turn to the right shows features similar to steady state cells. Bold curved arrow indicates the cell's trajectory. (b) Traction map for a cell making a short-radius turn, clockwise about pivot point O on the substratum. (c) Trajectory plotted (arrowed circle) over 24 min of circling locomotion, superimposed over total cell area (white plus black) and nuclear area (black) for the cell traction map shown in b. (d) Successive nuclear profiles for the same cell, recorded over 24 min of circling locomotion around pivot point O. For discussion purposes, R and L designate right and left sides of the cell.
Fig. 8 b shows the traction map for another cell turning clockwise about a pivot point (O) (the turning radius is less than one cell diameter). Fig. 8 c shows the cell's circular trajectory, based on centroid tracking of successive nuclear profiles (black polygon) over 24 min. Overlapping nuclear profiles recorded during this maneuver are shown superimposed on one another in Fig. 8 d. Note that in executing this turn the cell rotates as well as translates towards the top of the page (left to right from the cell's viewpoint). Cells were induced into this circling behavior by incorporating beads with adsorbed poly-l-lysine into the substratum. A similar pattern (in mirror image) was seen for cells turning in the opposite direction (not shown). An analysis of the traction image of a sharply turning cell will be presented in the discussion.
Discussion
These new results can be employed to enhance our understanding of the keratocyte traction patterns. Our previous results showing the predominant equatorial traction pattern exhibited by gliding cells (the “pinching” pattern) was paradoxical in that the major traction stresses revealed were exerted perpendicular to the direction of keratocyte locomotion (Lee et al., 1994; Oliver et al., 1995). The current study shows how this paradox can be resolved by hypothesizing that the propulsive tractions driving locomotion are normally canceled by adhesive tractions resisting locomotion. This hypothesis was constructed from new data and analysis of tethered cells, in which the propulsive and adhesive components of the traction pattern are clearly well separated. The resolution of net tractions into components can also be applied to turning cells. The traction patterns associated with cells undergoing sharp turns differs markedly from the normal pinching traction pattern and can be accounted for by postulating an asymmetry in contractile activity of the opposed lateral wings of the cell.
Mechanical Principles Required for the Interpretation of Traction Images
To understand the motion of a cell from a mechanical standpoint, the forces acting on the cell must be analyzed. The total force acting on a contact-dependent locomoting cell consists of several components. These are schematically depicted in Fig. 9 (top) and comprise reactions (a) to rearward-directed propulsive tractions (a′) exerted by the cell's molecular motors, viscous drag (b) between the cell and the aqueous medium, and reactions (c) to forward-directed frictional tractions (c′) caused by tension in the adhesive bonds to the substratum. Note that the propulsive and frictional components as shown in Fig. 9 (top) may not always be so clearly separated, but rather may be locally commingled such that they are difficult to resolve. The net force required to move a keratocyte smoothly forward in low viscosity medium is negligible because both the inertia of the cell and the viscosity of the aqueous medium are so small. Thus, we conclude from Newton's second law that there is always a nearly perfect global balance of the propulsive and frictional reactive components exerted on the cell by the substratum. Furthermore, by Newton's third law (action and reaction), this means that there will also be a global balance in the forces exerted on the substratum by the cell. Hence, integrating the vectors of a traction image over the entire region of cell-substratum contact will always yield zero. A similar analysis shows that the total torque exerted by the cell on the substratum is also zero.
Figure 9.

(top) Forces exerted in cell locomotion. A locomoting cell attached to a substratum experiences several component forces that comprise reactions (a) to rearward-directed propulsive forces (a′) exerted by the cell's molecular motors, viscous drag (b) between the cell and the aqueous medium, and reactions (c) to forward-directed frictional tractions (c′) caused by tension in the adhesive bonds to the substratum. The net force required to move the keratocyte smoothly forward in a low viscosity medium is negligible because both the inertia of the cell and the viscosity of the aqueous medium are so small. (bottom) Components of stuck cell traction image. In stuck cells, it may be presumed that all friction is concentrated in the well-defined “tail” and that the traction in the cell body represents pure isometric motor activity. The traction patterns of stuck cells can be decomposed into pinching, propulsive, frictional, and resultant tractions. Pinching tractions are concentrated in the wings of the cell and are negligible near the midline and the leading edge. They are the direct result of motor activity, but they are perpendicular to the normal direction of locomotion, so they apply no propulsive thrust. Propulsive tractions have a similar distribution to the pinching tractions and are also due to direct motor activity. The difference is that they are oriented so as to provide forward thrust for locomotion. Frictional tractions (everything left over) oppose (by definition) the forward motion of the cell and are not due to direct motor activity. In the stuck cell, they are concentrated in the tail as shown, but in other cases they may have different distributions (see below). Resultant tractions are the prediction for the observed traction image (compare with Fig. 7 b). Each vector is computed by simple point-by-point vector addition of the pinching, propulsive, and frictional tractions. The total area integral of x and y components of force and torque about an arbitrary origin must always be zero. The arrow indicates the direction of cell locomotion.
Separation of Propulsive and Adhesive Traction in Keratocytes Stuck at Their Trailing Edges
The global balance of forces pertaining in any traction image can be exploited to help identify the magnitude, direction, and location of the specific active stresses provided by molecular motors, and to separate these from corresponding properties of those frictional stresses that resist motion. The “stuck” keratocyte is a case in point. Occasionally, gliding keratocytes become transiently stuck by strong adherence of their trailing margin and develop a remarkably fibroblast-like shape, having a fan-shaped lamella and a distinct tail. Stuck cells provide a natural laboratory wherein the frictional tractions become concentrated to the tail region. Because of the global force balance, the concentration of “frictional” tractions in the tail of such cells implies a reverse enrichment of “propulsive” traction in the main cell body. In such cases, the traction map of the cell body of a stuck cell provides a glimpse of isometric motor activity with much reduced contamination by friction.
To help in subsequent analysis of stuck (Fig. 9 b), gliding (Fig. 10 a), and turning (Fig. 10 b) cells, we have schematically separated the various contributions to the observed traction pattern into three traction components, pinching, propulsive, and frictional, such that vector addition of these components produces the measured traction pattern. For stuck cells (Fig. 9 b), we first show the so-called pinching tractions, which are concentrated in the wings of the cell and are oriented perpendicular to the usual direction of locomotion. Next, we sketch the propulsive tractions. These are also concentrated in the wings but are oriented so as to push the substratum backward and provide forward thrust to the cell body. Thirdly, we schematically show the frictional tractions concentrated in the tail. Adding these three components together produces a resultant that can be compared with the observed traction images of stuck cells (Fig. 7). The pinching and propulsive tractions are identified as being the direct result of motor activity because they are seen to persist under the moving cell body in stuck cells and because they do not oppose forward locomotion.
Figure 10.

(a) Starting with the traction pattern of the stuck cell, we generate the gliding cell by a simple redistribution of the frictions. The pinching and propulsive tractions are essentially unchanged from the case of the stuck cell. The only difference is that the frictional tractions are now distributed in the wings of the cell such that when the traction fields are added together the frictions cancel the propulsive tractions. This leaves the pinching tractions as the visible remainder (resultant). The arrow indicates the direction of cell locomotion. (b) Components of traction image for a cell turning clockwise. Note that the pinching tractions on the right half of the cell are slightly stronger than on the left. This tends to drive the cell sideways (to the right) like a crab. The propulsive tractions on the left of the cell are slightly stronger than on the right. This provides a net torque tending to cause clockwise rotation. Frictional tractions are required to oppose and cancel the forces and the torque. This means that they must have the general direction as shown and that they must be collected far on the left side of the cell to have sufficient moment arm. The qualitative pattern (resultant) obtained by adding these components reproduces the main features of the pattern shown in Fig. 8 b. In particular, this model reproduces the clockwise direction of the traction vector field seen on the cell's left (outside of turn). The arrow indicates the direction of cell locomotion. For discussion purposes, R and L designate right and left sides of cell.
An interesting property of the traction image of stuck cells is that the locus of maximum active traction stress is in the vicinity of the lateral edges of the cell (similar to the gliding cell). The leading edge of the keratocyte is unable to develop detectable propulsive traction stresses, even when the cell is stuck and trying to pull free. Note that the lack of propulsive traction development at the leading edge is similar to the gliding cell (Fig. 2 b). This reinforces the assertion that the major propulsive engines of the keratocyte are localized in the wings. By integrating the rearward-directed component of the traction vector field in several stuck cells, we find that the net propulsive thrust of a keratocyte is ∼1 mdyn (10,000 pN). This compares favorably with the force (∼5 mdyn) required to stall a locomoting keratocyte with a calibrated microneedle (Oliver et al., 1995) and is somewhat greater than the force required to extend a neurite (Lamoureux et al., 1989). The root mean squared magnitude of the tractions for a stalled cell (5,000 dyn/cm2) is actually slightly larger than that reported previously for gliding cells (Dembo et al., 1996). Thus, there is no deficiency in the ability of stuck cells to generate and apply force to the substratum (if anything, these cells are superior to gliding cells in this regard). The stuck phenotype is a case in which the processes governing adhesive debonding at the tail are primary determinants that subsequently induce extensive changes in patterns of force generation and cellular morphology. Similarly, tail release in fibroblasts stimulates retraction-induced spreading (Chen, 1981).
Origin of the Traction Pattern Characteristic of the Gliding Mode of Locomotion
The traction distribution in the stuck phenotype permits an explanation of the paradoxical traction pattern characteristic of gliding keratocytes. A model of the relationship between the stuck and gliding phenotypes is illustrated by comparing Figs. 9 b and 10 a. Essentially, this model shows that the entire difference between these two phenotypes can be explained by a simple change in the distribution of the frictional tractions exerted by adhesive bonds. There is no need to invoke any difference in the activity of the molecular motors (this is implied by the similar magnitude of the root mean squared traction stresses for both stuck and gliding cells). Fig. 10 a illustrates a schematic decomposition of the traction pattern for gliding cells into its components: pinching, propulsive, and the frictional (adhesive) tractions. The observed superposition of these three components is shown as the resultant tractions. Note that the propulsive and frictional components are hypothesized to be identical, to a first approximation, but in opposite directions. (Since gliding cells are adherent, propulsive tractions must exist to overcome this adhesion, although the equatorial tractions may also be employed to peel away the adhesions at the lateral edges, see below.) Based on the visualization of propulsive tractions in the stuck cell, these tractions for the gliding cell are also placed in the wings. Thus, in this hypothesis, the forward directed frictional tractions and rearward directed propulsive tractions perfectly cancel each another. This local cancellation, in which only the pinching tractions remain, explains why gliding cells seem to move so effortlessly. The rearward propulsive tractions necessary to drive locomotion, as well as the frictional tractions resisting movement, are largely hidden in the composite traction image. The decomposition in Fig. 10 a is an oversimplification because local cancellation of propulsive and frictional tractions is clearly not always complete. Some rearward-directed, propulsive traction components are seen in the wings of the cells in traction images shown in Figs. 2 and 3. However, the notion of local cancellation of propulsive and frictional tractions explains the paradoxical pinching pattern characteristic of gliding keratocytes.
A consistent and unexpected finding in all our images of gliding cells is the absence of propulsive tractions at the front of the cell. This does not exclude the possibility that there might be very small propulsive tractions at this locus (“small” in this context is <10% of the pinching tractions). Our data therefore suggests that the leading edge protrudes forward in a process that requires minimal propulsive traction at the front edge (Lee et al., 1994; Oliver et al., 1995; Dembo et al., 1996). This is surprising when compared with the implied force generating role of filopodia and lamellipodia in other cells, e.g., neurite growth cones. However, in fibroblasts, the situation is not fully resolved: Dembo and Wang (1999) find that fibroblasts can exert strong traction under the lamellipodium, while Galbraith and Sheets (1997) and Harris et al. (1980) found that strong pulling tractions are absent within 5 μm of the leading edge.
Several additional observations indirectly support the basic idea that protrusion does not require pulling molecular motors situated at the leading edge. These suggest that forward progress of the keratocyte cell body (nuclear mound), which does require pulling tractions, is decoupled from leading edge extension. de Beus and Jacobson (1998) showed that prevention of new β1-integrin–mediated adhesion inhibited lamellar protrusion while permitting continued retraction of the trailing margin. Anderson et al. (1996) showed that in the presence of cytochalasin B, the cell body continued moving forward for twice the distance covered by the lamellipodium before all motility ceased.
The Gliding Mode of Locomotion and the Dynamic Network Contraction Model
One intriguing model for cytoskeletal force production in keratocytes is the dynamic network contraction (DNC) model (Svitkina et al., 1997) based on elegant ultrastructural and fluorescence microscopy studies. In principle, this model must account for the traction image measured for gliding cells. That is, the contractility proposed to be generated by the model in combination with the adhesion distribution for gliding keratocytes should produce the active tractions required for locomotion (see Fig. 11 a). These active tractions are shown as the vector sum of the pinching and propulsive tractions (see Fig. 10 a), but not the adhesive tractions. Proposed revisions to the DNC model, as discussed below, are given in Fig. 11 b.
Figure 11.

(a) Proposed relationship between contractility, adhesion, and traction pattern for locomoting keratocyte. (Left) DNC model (Svitkina et al., 1977) showing the orthogonal actin network (cross-hatch), with clusters of myosin II bipolar filaments (small v's) that increase in density towards the lamellipodial–cell body transition zone (curved double line). Compression of actin filaments and myosin bundling in this zone is proposed to generate the cytoskeletal contractility that drives forward translocation of the cell body (arrow). (Center) Interference reflection microscopy image showing the crescent-shaped area of close contact beneath a live keratocyte locomoting on a glass substratum (courtesy of Dr. Juliet Lee, University of Connecticut at Storrs). (Right) The sum of active (pinching and propulsive) traction distributions revealed by mapping traction stresses beneath the cell. (b) Possible modifications to the DNC model. Actomyosin contractility along a proposed equatorial, sarcomere-like structure (1) generates pinching tractions (2) and breaks adhesive bonds beneath retraction fibers (3). DNC generates propulsive tractions in the “wings” of the cell (4), but is downregulated at the front leading edge (5).
The dominant feature of the traction images for gliding keratocytes are the pinching tractions. In addition, it is important to realize that equatorial contractility is so pronounced that the entire rear lateral actin meshwork is pulled in, as deduced from the curvature of photoactivated actin bars (Theriot and Mitchison, 1991; Lee et al., 1993). As articulated, the DNC model has marked anisotropy producing predominantly propulsive tractions in the direction of locomotion that are used to pull the cell body forward, but it does not directly address the origin of the strong equatorial contractility. One possible way to account for these strong, pinching tractions is to postulate isotropic lamellar contractility (Heidemann and Buxbaum, 1998). Another possibility is that contractility underlying these tractions may be based on a “sarcomeric-like” contraction, dependent on actomyosin bundles running parallel to the equator (Anderson et al., 1996) that could be produced by dynamic network contraction. Svitkina et al. (1997) rejected this structure as being important because its slight convex curvature was thought to generate a force component that resists locomotion. This curvature probably results from the fact that bundles are strongly, but transiently, anchored at the rear lateral margins, often with focal adhesion-like contacts (Lee and Jacobson, 1997). Nevertheless, the sarcomeric-like mechanism seems like an attractive candidate to explain the main feature of the keratocyte traction image, a strong pinching component perpendicular to the direction of cell motion. Thus, we have depicted it in the schematic of the contractile mechanism (Fig. 11 b).
A second characteristic of traction distributions is that the propulsive and pinching tractions are localized predominantly in the wings of the keratocyte. This is seen from the fact that even when cells are tethered, the propulsive tractions appear in the wings and not under the front leading lamella. Dynamic network contraction, which is postulated to produce forces along the axis of locomotion, should be most active in these regions, and we have depicted it as producing propulsive tractions (Fig. 11 b, 4) in these regions. There is a large reduction in propulsive traction in the vicinity of the front leading edge. Since adhesion is indicated in this region (as judged by the IRM image in Fig. 11 a, center), the contractility in this part of the lamella must be downregulated to explain this reduction in traction. This is consistent with the relatively high actin network density and low myosin cluster density in the front portion of the lamella (Svitkina et al., 1997). Such reduced contractility could lower cortical tension along the extending margin and lead to enhanced protrusion (Kolega, 1986; Rotsch et al., 1999) as required by the graded radial extension model of keratocyte movement (Lee et al., 1993).
Possible Roles for the Dominant, Actomyosin-based Pinching Tractions
One clear role for the pinching tractions and the structures that produce them is to maintain the fan shape characteristic of keratocytes, since agents that inhibit the pinching tractions also lead to loss of this shape. Furthermore, the use of BDM and KT 5926 suggests that the strong equatorial tractions present in the normal gliding cell are dependent on actomyosin interactions. Significantly, the concentration dependence of BDM's effects (Figure 3 f in Cramer and Mitchison, 1995), reflected by the rate of spreading in postmitotic Ptk2 cells and by the inhibition of platelet nonmuscle myosin II, is similar to the concentration dependence we observe when BDM inhibits keratocyte motility on glass (Table I). Three independent assays thus confirm that half maximal inhibition occurs in the presence of 2.5–4 mM BDM. This argues strongly for the dependence of keratocyte shape and locomotion (both are contributing factors in our index of motility) on the presence of functional nonmuscle myosin II.
The strong equatorial tractions correspond to regions where close contacts, as revealed by interference reflection microscopy in Fig. 11 a (center), diminish in area at the rear lateral margins (arrows), consistent with the notion that these tractions may play a role in peeling away rear adhesions. This may be compared with the ease with which a piece of adhesive tape may be peeled from a surface by peeling from an edge or corner, rather than the center. In the method reported here, tractions can be calibrated absolutely (Dembo et al., 1996) and the maximal traction stresses correspond well to the failure stress characteristic of amoebae close contacts (Opas, 1987), supporting the idea that these pincer-like tractions are sufficiently strong to assist in peeling away the trailing margin.
The occurrence of pinching tractions may be the result of the biological context (the epithelium of the scale) in which these cells find themselves. Such tractions result from contractile actomyosin structures that are needed for normal epithelial tissue structure and wound healing responses, but become remodeled when individual keratocytes break away from the cell sheet and undergo rapid locomotion. That is, these forces are normally employed to maintain and remodel the epithelial sheet and only when a single cell is released are they partially used to achieve a high, uniform velocity. In this sense, keratocyte locomotion may not be fully efficient. The situation may be analogous to fibroblasts in that the tractions produced by fibroblasts are much stronger than needed for locomotion, prompting Harris et al. (1981) to postulate that their primary role was to remodel the extracellular matrix. The difference in orientation of the major traction forces between keratocytes and fibroblasts is most likely related to the relative difficulty of adhesive tail detachment in these cell types, but it also reveals an important difference in the regulation of force orientation between the two cell types. Even when keratocytes become stuck and develop tails, the pinching tractions persist, suggesting that this traction orientation is characteristic of this epithelial cell type.
Traction Distributions that Produce Turning
The properties of traction images can also be exploited to clarify the mechanism by which cells regulate adhesion and contractility to control and maintain the direction of locomotion. A turning motion can be considered as the sum of a gliding motion and a pivoting motion about the center of mass. That is, when cells move in circular paths, they must rotate as well as translate, which means that it is necessary for them to exert propulsive torque. In cells that execute very gradual turns, the contribution of the pivoting motion is minor and the underlying traction distribution does not differ substantially from that of a keratocyte “gliding” in a straight line (compare Figs. 8 a and 2 b). However, in the case of cells that turn sharply (Fig. 8 b), we are able to discern a stereotypical morphology and pattern of traction that differs radically from that of the gliding cell. To find the simplest way of explaining the turning phenotype, we will analyze the traction image (Fig. 10 b) using the decomposition of tractions for the stuck cell as a starting point. Examination of the stuck cell (Fig. 9 b) illustrates that the only way to obtain the necessary propulsive torque to turn a cell is to change the propulsive tractions on one side (Fig. 10 b, L), so that they are slightly stronger than on the other side (R). Note that the propulsive tractions have to change because they are the only ones that have a nonzero moment arm about the center of mass. For simplicity, we propose to obtain this increase while keeping the total magnitude of the motor activity of the cell constant. Geometrically, this means that we can redirect (rotate) some of the pinching tractions on one side of the cell (L) so that they now have a rearward-directed component.
In Fig. 10 b, we show pinching and propulsive traction distributions similar to that of a stuck keratocyte (strong in the wings, diminishing towards the center), except that on the left side of the cell (L), we have converted some of the pinching activity into propulsive activity for the reasons described above. As a result of the asymmetric pinching tractions, the cell experiences a force that tends to move it sideways (towards the cell's right), like a crab. Simultaneously, the propulsive tractions exert a clockwise torque and also a force that moves the cell forward in the usual way. This is similar to the pattern of forces acting on a rowboat that is moving crosswind with one oar slightly longer than the other. In Fig. 10 b, we show the necessary frictional (adhesive) tractions that must go along with this kind of propulsive activity. The basic requirement is that these tractions are needed to balance total force in both the x and y directions, and are also needed to balance torque about the center of mass. The force balance basically fixes the magnitude and direction of the total friction force. The concentration of the friction in the left wing of the cell is then dictated because the friction needs to have the longest possible moment arm to achieve torque balance. Finally, we show the vector addition of the three preceding traction fields given as the resultant in Fig. 10 b. This figure reproduces the main features of the experimentally derived traction map for a clockwise-directed turning cell (see Fig. 8 b). We conclude from this analysis of the turning cell that the observed behavior can be explained by postulating a slight asymmetry in the motor activity of one side of the cell versus the other.
How might molecular mechanisms be translated into the mechanics required to turn the cell? Changes in cell stiffness accompany turning cells (Bereiter-Hahn and Luers, 1998). Perturbation experiments have demonstrated that altering the normal patterns of adhesion and contractility will redirect the cell. Disrupting lamellipod adhesion with low doses of antiintegrin antibodies in Xenopus keratocytes results in a redirection of cell movement (de Beus and Jacobson, 1998). In addition, when Anderson et al. (1996) asymmetrically disrupted the cytoskeleton by traumatic microinjection on one side of the cell body, keratocytes changed their direction of locomotion. Releasing calcium locally near the lateral edge of a keratocyte causes it to turn towards the source of calcium (Mittal and Bereiter-Hahn, 1985). These observations demonstrate that asymmetric alterations in contractility and/or adhesion can be the basis for directional control of locomotion. One of the most fascinating challenges will be to relate the changing traction patterns required for cell motility and morphogenesis to the way in which the adhesions and motor activities that produce traction are regulated.
Acknowledgments
We thank Professor Albert Harris for his critical review of this manuscript, Dr. Juliet Lee for the IRM image in Fig. 11 a, and Chris Kennedy at peaktechnology.com for the cell tiling software. The comments of the reviewers were especially helpful in revising this work.
This study was supported by National Institutes of Health grant GM-35325.
Abbreviations used in this paper
- BDM
2,3-butanedione 2-monoxime
- DNC
dynamic network contraction
References
- Anderson KI, Wang Y-L, Small JV. Coordination of protrusion and translocation of the keratocyte involves rolling of the cell body. J Cell Biol. 1996;134:1209–1218. doi: 10.1083/jcb.134.5.1209. [DOI] [PMC free article] [PubMed] [Google Scholar]
- Bereiter-Hahn J, Strohmeier R, Kunzenbacher I, Beck K, Voth M. Locomotion of Xenopusepidermal cells in primary culture. J Cell Sci. 1981;52:289–311. doi: 10.1242/jcs.52.1.289. [DOI] [PubMed] [Google Scholar]
- Bereiter-Hahn J, Luers H. Subcellular tension fields and mechanical resistance of the lamellar front related to the direction of locomotion. Cell Biochem Biophys. 1998;29:243–262. doi: 10.1007/BF02737897. [DOI] [PubMed] [Google Scholar]
- Burton K, Taylor DL. Traction forces of cytokinesis measured with optically modified elastic substrata. Nature. 1997;385:450–454. doi: 10.1038/385450a0. [DOI] [PubMed] [Google Scholar]
- Chen W-T. Mechanism of retraction of the trailing edge during fibroblast movement. J Cell Biol. 1981;90:187–200. doi: 10.1083/jcb.90.1.187. [DOI] [PMC free article] [PubMed] [Google Scholar]
- Chrzanowska-Wodnicka M, Burridge K. Rho-stimulated contractility drives the formation of stress fibers and focal adhesions. J Cell Biol. 1996;133:1403–1415. doi: 10.1083/jcb.133.6.1403. [DOI] [PMC free article] [PubMed] [Google Scholar]
- Cramer LP, Mitchison TJ. Myosin is involved in postmitotic cell spreading. J Cell Biol. 1995;131:179–189. doi: 10.1083/jcb.131.1.179. [DOI] [PMC free article] [PubMed] [Google Scholar]
- de Beus E, Jacobson K. Integrin involvement in keratocyte locomotion. Cell Motil Cytoskelet. 1998;41:126–137. doi: 10.1002/(SICI)1097-0169(1998)41:2<126::AID-CM4>3.0.CO;2-C. [DOI] [PubMed] [Google Scholar]
- Dembo M, Oliver T, Ishihara A, Jacobson K. Imaging the traction forces exerted by locomoting cells with the elastic substratum method. Biophys J. 1996;70:2008–2022. doi: 10.1016/S0006-3495(96)79767-9. [DOI] [PMC free article] [PubMed] [Google Scholar]
- Dembo M, Wang Y-L. Stresses at the cell-to-substrate interface during locomotion of fibroblasts. Biophys J. 1999;76:2307–2316. doi: 10.1016/S0006-3495(99)77386-8. [DOI] [PMC free article] [PubMed] [Google Scholar]
- Euteneuer U, Schliwa M. The function of microtubules in directional cell movement. Ann NY Acad Sci. 1986;466:867–886. doi: 10.1111/j.1749-6632.1986.tb38473.x. [DOI] [PubMed] [Google Scholar]
- Galbraith CG, Sheetz MP. A micromachined device provides a new bend on fibroblast traction forces. Proc Natl Acad Sci USA. 1997;94:9114–9118. doi: 10.1073/pnas.94.17.9114. [DOI] [PMC free article] [PubMed] [Google Scholar]
- Harris A, Wild P, Stopak D. Silicone rubber substrata: a new wrinkle in the study of cell locomotion. Science. 1980;208:177–179. doi: 10.1126/science.6987736. [DOI] [PubMed] [Google Scholar]
- Harris A, Stopak D, Wild P. Fibroblast traction as a mechanism for collagen morphogenesis. Nature. 1981;290:249–251. doi: 10.1038/290249a0. [DOI] [PubMed] [Google Scholar]
- Heidemann SR, Buxbaum RE. Cell crawling: first the motor, now the transmission. J Cell Biol. 1998;141:1–4. doi: 10.1083/jcb.141.1.1. [DOI] [PMC free article] [PubMed] [Google Scholar]
- Kolega J. Effects of mechanical tension on protrusive activity and microfilament and intermediate filament organization in an epidermal epithelium moving in culture. J Cell Biol. 1986;102:1400–1411. doi: 10.1083/jcb.102.4.1400. [DOI] [PMC free article] [PubMed] [Google Scholar]
- Lamoureux P, Buxbaum RE, Heidemann SR. Direct evidence that growth cones pull. Nature. 1989;340:159–162. doi: 10.1038/340159a0. [DOI] [PubMed] [Google Scholar]
- Lee J, Ishihara A, Theriot J, Jacobson K. Principles of locomotion for simple shaped cells. Nature. 1993;362:167–171. doi: 10.1038/362167a0. [DOI] [PubMed] [Google Scholar]
- Lee J, Leonard M, Oliver T, Ishihara A, Jacobson K. Traction forces generated by locomoting keratocytes. J Cell Biol. 1994;127:1957–1964. doi: 10.1083/jcb.127.6.1957. [DOI] [PMC free article] [PubMed] [Google Scholar]
- Lee J, Jacobson K. The composition and dynamics of cell-substratum adhesions in Locomoting fish keratocytes. J Cell Sci. 1997;110:2833–2844. doi: 10.1242/jcs.110.22.2833. [DOI] [PubMed] [Google Scholar]
- Mittal AK, Bereiter-Hahn J. Ionic control of locomotion and shape in epithelial cells: I. Role of calcium flux. Cell Motil. 1985;5:123–136. doi: 10.1002/cm.970050205. [DOI] [PubMed] [Google Scholar]
- Oliver T, Dembo M, Jacobson K. Traction forces in locomoting cells. Cell Motil Cytoskelet. 1995;31:225–240. doi: 10.1002/cm.970310306. [DOI] [PubMed] [Google Scholar]
- Oliver T, Jacobson K, Dembo M. Design and use of substrata to measure forces exerted by cultured cells. Methods Enzymol. 1998;298:497–521. doi: 10.1016/s0076-6879(98)98042-9. [DOI] [PubMed] [Google Scholar]
- Opas, M. 1987. The transmission of forces between cells and their environment. In Cytomechanics. J. Bereiter-Hahn, O.R. Anderson, and W.E. Reif, editors. Springer-Verlag, New York. 274–285.
- Pelham RJ, Wang Y-L. Cell locomotion and focal adhesions are regulated by substrate flexibility. Proc Natl Acad Sci USA. 1997;94:13661–13665. doi: 10.1073/pnas.94.25.13661. [DOI] [PMC free article] [PubMed] [Google Scholar]
- Pletjushkina OJ, Belkin AM, Ivanova OJ, Oliver T, Vasiliev JM, Jacobson K. Maturation of cell-substratum focal adhesions induced by depolymerization of microtubules is mediated by increased cortical tension. Cell Adhes Commun. 1998;5:121–135. doi: 10.3109/15419069809040286. [DOI] [PubMed] [Google Scholar]
- Rotsch C, Jacobson K, Radmacher M. Dimensional and mechanical dynamics of active and stable edges in motile fibroblasts investigated by atomic force microscopy. Proc Natl Acad Sci USA. 1999;99:921–926. doi: 10.1073/pnas.96.3.921. [DOI] [PMC free article] [PubMed] [Google Scholar]
- Small JV, Herzog M, Anderson K. Actin filament organization in the fish keratocyte lamellipodium. J Cell Biol. 1995;129:1275–1286. doi: 10.1083/jcb.129.5.1275. [DOI] [PMC free article] [PubMed] [Google Scholar]
- Svitkina TM, Verkhovsky AB, McQuade KM, Borisy GG. Analysis of the actin-myosin II system in fish epidermal keratocytes: mechanism of cell body translocation. J Cell Biol. 1997;139:397–415. doi: 10.1083/jcb.139.2.397. [DOI] [PMC free article] [PubMed] [Google Scholar]
- Theriot JA, Mitchison TJ. Actin microfilament dynamics in locomoting cells. Nature. 1991;352:126–131. doi: 10.1038/352126a0. [DOI] [PubMed] [Google Scholar]