

Abstract
Physical training regulates muscle metabolic and contractile properties by altering gene expression. Electrical activity evoked in muscle fiber membrane during physical activity is crucial for such regulation, but the subsequent intracellular pathway is virtually unmapped. Here we investigate the ability of myogenin, a muscle-specific transcription factor strongly regulated by electrical activity, to alter muscle phenotype. Myogenin was overexpressed in transgenic mice using regulatory elements that confer strong expression confined to differentiated post-mitotic fast muscle fibers. In fast muscles from such mice, the activity levels of oxidative mitochondrial enzymes were elevated two- to threefold, whereas levels of glycolytic enzymes were reduced to levels 0.3–0.6 times those found in wild-type mice. Histochemical analysis shows widespread increases in mitochondrial components and glycogen accumulation. The changes in enzyme content were accompanied by a reduction in fiber size, such that many fibers acquired a size typical of oxidative fibers. No change in fiber type-specific myosin heavy chain isoform expression was observed. Changes in metabolic properties without changes in myosins are observed after moderate endurance training in mammals, including humans. Our data suggest that myogenin regulated by electrical activity may mediate effects of physical training on metabolic capacity in muscle.
Keywords: enzymes, exercise, gene expression regulation, mitochondria, muscle fibers
Skeletal muscle is composed of muscle fibers with diverse functional properties optimized for different tasks. These properties are linked to the molecular makeup of the cells, and it has traditionally been popular to classify muscle fibers into distinct fiber types based on the biochemical properties of their myosin and content of metabolic enzymes. Today, fiber types can be precisely classified according to the myosin heavy chain (MyHC)1 gene that is expressed. Usually, one of four major MyHC genes are expressed in adult rodent skeletal muscle fiber, which have been dubbed types 1, 2A, 2X (also called 2D), and 2B (Schiaffino et al., 1989). These fiber types differ along a continuum of contraction speed, type 1 being the slowest and 2B the fastest. They also differ in endurance, such that type 1 fatigues slowly and 2B rapidly. The speed of fiber contraction is most likely dependent on MyHC type (Reiser et al., 1985; Bottinelli et al., 1994). On the other hand, endurance is more closely related to the ability of the tissue to provide ATP for the actomyosin crossbridge cycle during contraction, and therefore is dependent on the content of metabolic enzymes. Type 1 fibers generally have high levels of oxidative enzymes providing a slow, but stable, and long lasting supply of ATP derived from oxidation of nutrients provided by the blood. Type 2B fibers have high levels of glycolytic enzymes providing a rapid source of ATP independent of oxygen, but this pathway rapidly depletes the glycogen energy stores of type 2B fibers, and fatigue develops after brief usage.
Fully differentiated muscle fibers can undergo substantial phenotypic change in order to adapt to changing demands of the environment. Such changes can be quite dramatic, but, even so, they can occur in preexisting fibers without prior cell death and regeneration (Gorza et al., 1988). Thus, with some exceptions, changes in the pattern of usage induced experimentally by electrical stimulation through implanted electrodes can alter a muscle fiber phenotype from one extreme to the other, e.g., from type 2B to type 1 (Mayne et al., 1993; Windisch et al., 1998). Such complete fiber type transformations apparently require long periods of treatment with completely altered activity patterns (for review see Gundersen, 1998). Thus, studies on the effect of physical training in humans or animals have typically led to less dramatic changes (for reviews see Henriksson and Hickner, 1994; Fitts and Widrick, 1996). Although changes within type 2 (e.g., from 2B to 2A) have been described (see Abdelmalki et al., 1993; Wang et al., 1993; Kraemer et al., 1995), training frequently induces dramatic changes in metabolic properties without MyHC fiber type conversion (see Kiens et al., 1993; Schluter and Fitts, 1994).
Whereas muscle plasticity is well described at the phenomenological level in a variety of experimental and training situations, little is known about the intracellular pathways linking demand (activity, load, etc.) to changes in gene expression of proteins related to metabolism and contraction. Various transcription factors are known to regulate muscle gene expression, among them are four muscle-specific basic helix-loop-helix proteins: MyoD, myogenin, MRF4, and Myf5 (for reviews see Weintraub, 1993; Molkentin and Olson, 1996). These factors were originally isolated as key regulatory molecules in early muscle differentiation, but expression continues in mature muscle tissue of adult animals, suggesting that they may play a more extended role. In particular, it has been postulated that they provide a link between electrical activity and gene regulation. Thus, upon paralysis, the levels of mRNA for all four myogenic factors are elevated (Duclert et al., 1991; Eftimie et al., 1991; Witzemann and Sakmann, 1991; Buonanno et al., 1992; Neville et al., 1992; Merlie et al., 1994), and this elevation is thought to take part in the development of acetylcholine supersensitivity (Piette et al., 1990; Gilmour et al., 1991; Jia et al., 1992; Prody and Merlie, 1992; Simon and Burden, 1993; Dürr et al., 1994; Gundersen et al., 1995). The helix-loop-helix superfamily has also been implicated in maintenance of mature innervated muscle fiber character, as the negative regulator of helix-loop-helix proteins, Id-1, causes atrophy of fibers in which it is overexpressed (Gundersen and Merlie, 1994). Furthermore, the level of myogenic factors differs between MyHC fiber types, and changes in the level parallel MyHC fiber type conversion (Hughes et al., 1993b; Voytik et al., 1993). In particular, subtle shifts in MyHC fiber type detected in mice lacking a functional MyoD gene have raised the possibility that myogenic factors might contribute to the control of the properties of specific adult fiber types (Hughes et al., 1997).
In the present study, we show that overexpression of the transcription factor myogenin in muscle cells of transgenic mice induced a shift in metabolic enzyme content, such that levels of oxidative enzymes were increased while glycolytic enzymes were reduced. This shift in the slow direction occurred without detectable changes in MyHC fiber type.
Materials and Methods
Transgenic Animals
To overexpress myogenin and Id-1 in differentiated muscle cells the myogenin (MMg) and Id-1 (MId) transgenes were inserted into the genome of mice by conventional transgenic techniques described previously (Gundersen et al., 1993, 1995; Gundersen and Merlie, 1994). In brief, the MMg transgene contains rat myogenin cDNA (Wright et al., 1989) and the MId transgene contains mouse Id-1 cDNA (Benezra et al., 1990). Both transgenes are driven by the myosin light chain 1 promoter and 3′ 1/3 enhancer, which have been shown to confer expression only in differentiated post-mitotic muscle fibers (Rosenthal et al., 1989). Moreover, the expression is fiber type-dependent, such that the level of expression declines in the order 2B > 2X > 2A > 1 (Donoghue et al., 1991). Animals containing the MMg transgene have a high neonatal lethality, whereas bearers of the MId transgene have the same survival rate as nontransgenic littermates. The MId transgene can overcome the deleterious effect of the MMg transgene such that bearers of both transgenes (MMg + MId) have normal survival rates (Gundersen et al., 1995). Thus, we propagate the MMg transgene in double transgenic mice (MMg + MId), which are mated to wild-type mice to yield offspring of the following four genotypes identified by PCR analysis (Hanley and Merlie, 1991): MMg, MId, MMg + MId, and wild-type. The wild-type littermates served as controls in the present study (for further detail see Gundersen et al., 1995). In all cases the analyzed muscles were from mice that were 2–6-mo old.
RNA and Western Analysis
RNA was extracted as described by Chomczynski and Sacchi (1987), and the level of rat myogenin mRNA from the transgene was determined by RNase protection assays as described by Melton et al. (1984). The specificities of the protected bands were determined by hybridization against equal amounts of yeast tRNA. For further details see Gundersen et al. (1995).
Protein extracts were prepared in 50 mM Tris-HCl, pH 7.4, 0.6 M NaCl, 5 mM EDTA, 10% SDS, 1 μg/ml pepstatin A, 0.1% PMSF, 1% β-mercaptoethanol by homogenization in volumes normalized for wet weight of tissue. After separation on 12.5% SDS-PAGE, electroblotting to Amersham Hybond-C super filters, and blocking with 3% Tween 20, 5% horse serum in PBS, proteins were reacted with 1:70 diluted primary monoclonal tissue culture supernatants in 0.5% Tween 20, PBS. Detection was with 1:1,500 HRP-conjugated rabbit anti–mouse Ig (Dako Corp.) followed by the ECL kit.
Enzyme Analysis
Mice were anesthetized by ether, single muscles were dissected out, and snap frozen in liquid nitrogen. Muscle samples were homogenized directly from frozen in a stabilizing medium containing 50% glycerol, 20 mM phosphate buffer, pH 7.4, 5 mM β-mercaptoethanol, 0.5 mM EDTA, 0.02% BSA at a dilution of 1:100 based on wet weight. All assays for a particular enzyme were performed on the same day, over a 60-min incubation period at 25°C. Activities are given as mol · kg wet wt−1h−1. Final readings were made fluorometrically in a vol of 1 ml. Standards were carried through the entire procedure. Detailed protocols for analyzing the activity of each of the enzymes were published previously (Lowry et al., 1978; Chi et al., 1983, 1986; Henriksson et al., 1986).
Enzyme and Immunohistochemistry
Individual mouse muscles were dissected from hindlimbs, mounted in OCT, frozen in freezing isopentane, and 10–15 μm cryostat sections were cut from the midbelly region, mounted on gelatin coated glass slides, and stained as described by Dubowitz (1985) for either: periodic acid-Schiff to reveal glycogen content, NADH-tetrazolium reductase to show mitochondrial complex I content, or succinate dehydrogenase to determine mitochondrial complex II content. For immunohistochemistry, sections were stained as in Hughes et al. (1993a) using Vector biotin-conjugated class-specific secondary antibodies and the Vectastain ABC kit. HRP was detected with diaminobenzidine and cobalt enhancement. Serial cryosections were exposed to mAbs that recognize epitopes on distinct MyHC isoforms. A4.951 and A4.840 were used to detect slow MyHC, A4.74 to detect type 2A MyHC, and N2.261 to detect both slow and 2A MyHC (Hughes et al., 1993a). To distinguish developmental isoforms of fast MyHCs F1.652 (embryonic), N3.36, A4.1519 and N1.551 (staining subsets of neonatal and type 2), BF-F3 (adult 2B) and BF35 (all non-type 2X) were employed (Schiaffino et al., 1989; Cho et al., 1994). Analysis and photography were performed on a Zeiss Axiophot using Normarski optics. Fiber numbers (see Table II) were determined by scoring each fiber in the full cross section of the muscle as either positive or negative for each antibody. Thus, 300–500 soleus fibers and ∼1,000 extensor digitorum longus (EDL) fibers were scored in each leg.
Table II.
MMg Transgene Causes Fast Fiber Cross Sectional Area to Decrease
| Genotype | Metabolic fiber type | MyHC fiber type | ||||||||||
|---|---|---|---|---|---|---|---|---|---|---|---|---|
| AllArea |
Glycolytic | Oxidative | Type 2BArea |
|||||||||
| Area | Number | Area | Number | |||||||||
| μm2 ± SEM (n) | μm2 ± SEM | % ± SD | μm2 ± SEM | % ± SD | μm2 ± SEM (n) | |||||||
| wt | 1,119 ± 130 (3) | 1,553 ± 151 | 40 ± 6 | 827 ± 86 | 60 ± 6 | 1,330 ± 101 (3) | ||||||
| MMg | 823 ± 114 (3) | NA | ‡0 | 823 ± 114 | ‡100 | ‡705 ± 19 (4) | ||||||
| MMg + MId | 728 ± 84 (4) | *840 ± 116 | *28 ± 2 | 678 ± 73 | *72 ± 2 | ND | ||||||
| MId | 662 (1) | 727 | 56 | 578 | 44 | ND | ||||||
EDL muscles of animals of each genotype were cryosectioned and reacted for NADH tetrazolium reductase or 2B MyHC. The cross sectional area of each of >200 fibers from the midregion of each muscle was quantified, and the mean area and number of fibers for each category were determined. The means were then averaged to produce the values shown. A statistically robust unbalanced ANOVA determined whether fiber populations varied in size depending on fiber type, individual animal, and genotype. Significant differences were found between animals of the same genotype. After accounting for individual variation, significant differences from wild-type at the genotype level are represented by
(P < 0.05),
(P < 0.001). Distinct metabolic fiber types differed significantly (P < 0.01) in fiber size in wild-type and MId, but not in MMg or MMg + MId.
Fiber Size Analysis
Cross section images close to the midbelly of EDL muscles that had been stained for NADH-tetrazolium reductase were captured on a Macintosh computer and analyzed with NIH Image. Sections were only included in the analysis if fiber major axes showed near random orientation, indicating they were cut close to transversely. Several hundred fibers in each muscle were outlined with the mouse and their parameters (including staining pattern, area, and axis orientation) were recorded. Mean fiber areas were calculated for each fiber type in each muscle. Average fiber size from groups of the same genotype was determined by a weighted average of these means. However, to test accurately for statistically significant differences, an ANOVA test was performed, using Mathematica (Dunn et al., 1997).
Results
Metabolic Profile of Fast and Slow Wild-Type Muscles
Mouse strains have been shown to differ in fiber type content, so we first determined the activity of ten enzymes in three different muscles, plantaris, tibialis anterior, and soleus, in wild-type mice of similar genetic background to the transgenic animal. AK (see Table I for full enzyme names) is a mitochondrial enzyme involved in high energy phosphate transfer and we found no significant difference between fast and slow muscles (Table I). HK, PHRL, GOPDH, PK, and LDH are enzymes catalyzing individual steps in glycolysis. With the exception of HK, these enzymes had highest activity in the fast glycolytic plantaris muscle, and lowest in the slow oxidative soleus (Table I). HK is known to be high in slow muscles (Chi et al., 1992) and this was confirmed in the present study (Table I). In contrast, Thiol, BOAC, Cit Syn, and MDH are all enzymes that take part in oxidative energy production, and these were all highest in the oxidative soleus and lowest in the glycolytic plantaris muscles (Table I). The ratio of the activity of each enzyme in the slow soleus to the fast plantaris varied between 0.2 and 0.5 for the glycolytic enzymes (excluding HK), and between 2 and 3 for the oxidative enzymes. These values are illustrated in Fig. 1 which shows the enzyme profile of the slow soleus compared with the fast plantaris. It is evident, and this is in agreement with previous studies, that glycolytic enzyme activities in our nontransgenic mice are higher in fast muscles than in slow muscles, while the opposite is the case for oxidative enzymes.
Table I.
Enzyme Activity in Muscles of Wild-Type Mice (mol · kg−1h−1)
| Enzyme | Muscle | |||||||||||
|---|---|---|---|---|---|---|---|---|---|---|---|---|
| Code no. | Full name | Function | Acronym | Plantaris | Tibialis anterior | Soleus | ||||||
| EC2.7.4.3 | Adenylate kinase | Purine salvage | AK | 289.5 ± 26.5 | 286.6 ± 13.2 | 230.4 ± 4.6 | ||||||
| EC2.7.1.1 | Hexokinase | Glycolysis | HK | 2.2 ± 0.4 | 2.7 ± 0.6 | 2.4 ± 0.1 | ||||||
| EC2.4.1.1 | Glycogen phosphorylase | Glycogen degradation | PHRL | 14.2 ± 1.0 | 11.2 ± 0.4 | 4.1 ± 0.4 | ||||||
| EC1.1.1.8 | Glycerol-3-phosphate dehydrogenase (NAD+) | Glycolysis | GOPDH | 10.7 ± 0.9 | 10.9 ± 1.8 | 2.1 ± 0.3 | ||||||
| EC2.7.1.40 | Pyruvate kinase | Glycolysis | PK | 91.3 ± 4.5 | 91.7 ± 3.4 | 37.4 ± 3.2 | ||||||
| EC1.1.1.27 | Lactate dehydrogenase | Glycolysis | LDH | 174.3 ± 7.5 | 167.1 ± 12.1 | 61.8 ± 2.9 | ||||||
| EC2.3.1.9 | Acetoacetyl-CoA thiolase | Fatty acid degradation | Thiol | 2.5 ± 0.5 | 3.3 ± 0.3 | 5.1 ± 0.4 | ||||||
| EC1.1.1.35 | β-hydroxyacyl-CoA dehydrogenase | Fatty acid degradation | BOAC | 9.3 ± 1.6 | 12.1 ± 2.1 | 15.2 ± 0.6 | ||||||
| EC4.1.3.7 | Citrate (si)-synthase | Tricarboxylic acid cycle | Cit Syn | 1.3 ± 0.3 | 1.6 ± 0.4 | 2.7 ± 0.4 | ||||||
| EC1.1.1.37 | Malate dehydrogenase | Tricarboxylic acid cycle | MDH | 25.5 ± 3.3 | 30.0 ± 3.4 | 35.0 ± 1.2 | ||||||
Data given as mean ± SEM of four muscles.
Figure 1.

Fast muscle has higher glycolytic and lower oxidative enzyme activity than slow muscle. Enzyme activity in four wild-type soleus muscles was determined and divided by the mean value for each enzyme in the wild-type plantaris (Table I). Values are given as mean ± SEM on a logarithmic scale. *Significant differences between soleus and plantaris (two-tailed t test, P ≤ 0.05). The full names of the enzymes are given in Table I.
Myogenin Expression in Transgenic Mice
To determine the role of myogenin in adult muscle fibers, we examined MMg transgenic mice in which myogenin cDNA is expressed from the myosin light chain 1 promoter and 3′ 1/3 enhancer (Rosenthal et al., 1989). The level of transgenic rat mRNA in the mice was previously reported to be 100-fold of the endogenous form (Gundersen et al., 1995). We confirm by RNase protection that muscle RNA from the MMg mice and MMg + MId mice hybridized strongly with rat mRNA sequence, while RNA from MId and wild-type mice was below the detection limit (Fig. 2). To demonstrate that myogenin protein is accumulated from the transgene, we performed Western analysis on extracts of adult transgenic and wild-type littermate thigh muscle (Fig. 2). While no myogenin was detectable in wild-type muscle extract, in MMg muscle extract a band was readily detected of ∼32,000 M r, the reported size of myogenin protein (Li et al., 1992). No aberrant sized bands were observed to differ between MMg and wild-type animals. We confirmed the transgene-specificity of the 32,000-M r band by analyzing mice that carried MMg on the MId transgenic background. Whereas the MId mouse did not contain detectable myogenin immunoreactivity, the MMg + MId double transgenic animal showed higher myogenin immunoreactivity than the MMg animal (Fig. 2). Attempts to visualize myogenin protein in tissue sections of wild-type, MMg, MId, or MMg + MId mice were not successful, despite use of three distinct mAbs to different epitopes, including the F5D reagent employed in the Western analysis. It is possible that in vivo adult muscle myogenin may be present in an immunologically unreactive form. Nevertheless, the MMg transgene causes accumulation of a protein with immunoreactivity and size typical of myogenin in the predominantly fast thigh muscle of adult mice.
Figure 2.

The myogenin transgene produces mRNA and protein as shown by RNase protection and Western blotting. In the RNA protection assay, thigh muscle RNA extracts were hybridized against a rat myogenin cDNA template containing the sequence between the StuI site at base 398 of the coding sequence and a StyI site 31 bases into the 3′ noncoding sequence protecting 495 bases of the mRNA. In the Western blot thigh muscle, protein extracts were analyzed using antibody F5D that recognizes murine myogenin (Wright et al., 1991). Weak background bands are detected at several positions in all lanes containing muscle protein. In parallel experiments, these bands, but not the band at 32,000 M r, were also detected by a control antibody of the same subclass (IgG1) directed against embryonic MyHC, although no genuine embryonic MyHC was observed at 220,000 M r. Equal protein loading was demonstrated by Coomassie blue staining, which showed no detectable difference between the four samples in the proteins ∼32,000 M r. Values at left are M r × 10−3.
Myogenin Induces a Shift towards Oxidative Metabolism
As the MMg transgene is expected to be expressed predominantly in fast muscles (Donoghue et al., 1991), we first investigated the fast white plantaris muscle of adult MMg mice. When this and other fast muscles were inspected macroscopically, they appeared more red than in wild-type mice, suggesting a higher myoglobin content, a classical sign of a change in fiber type (Ranviér, 1874). The levels of the oxidative enzymes Thiol, BOAC, Cit Syn, and MDH were 6.1 ± 0.1, 25.0 ± 1.9, 4.3 ± 0.1, and 40.2 ± 0.1 (two muscles, mean ± SEM, mol · kg−1h−1), respectively. This represents a two- to threefold increase compared with levels found in plantaris muscles of wild-type littermate mice (Fig. 3, upper panel). The activity levels of the glycolytic enzymes HK, PHRL, GOPDH, PK, and LDH were 2.8 ± 0.0, 7.8 ± 0.26, 3.4 ± 0.4, 55.9 ± 1.5, and 85.5 ± 0.9, respectively. This represents reductions to levels 0.3– 0.6 times the levels in wild-type, with the exception that the glycolytic HK was not significantly changed (Fig. 3, upper panel). Thus, the plantaris muscle of the MMg mice had a changed enzyme profile from one typical of a fast muscle to one typical of a slow muscle. This is most evident by comparing the profiles in Fig. 1 and the upper panel of Fig. 3, which are remarkably similar. In quantitative terms, MMg plantaris muscles had even higher oxidative enzyme activities than those found in the soleus, but the glycolytic enzymes were not reduced to levels quite as low as in the wild-type soleus. Similar comparisons were made for the fast tibialis anterior muscle (Fig. 3, middle panel). Again, all the oxidative enzymes were significantly increased. The effect on glycolytic enzymes was less pronounced, but the tibialis anterior showed a tendency towards an increase in glycolytic activity.
Figure 3.
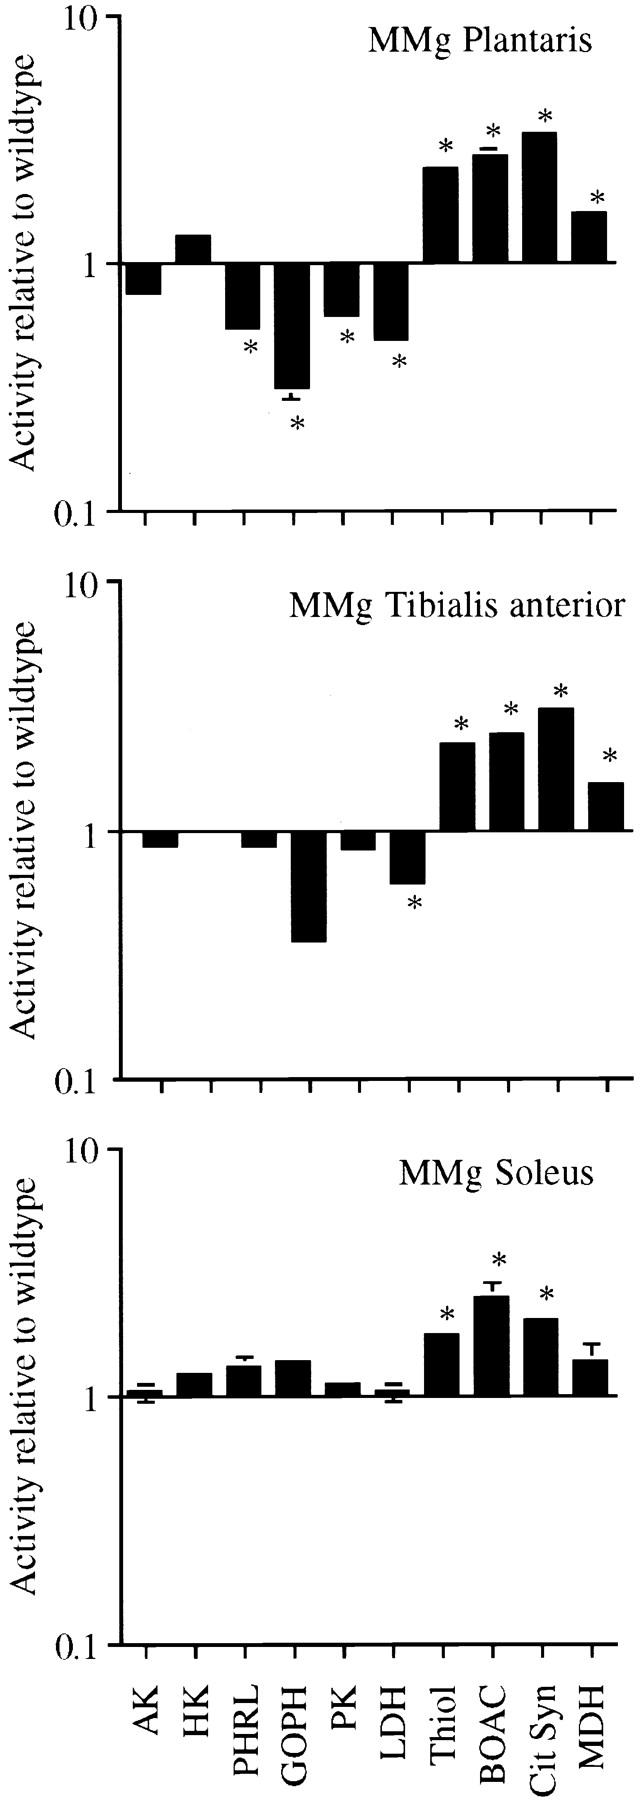
Myogenin overexpression causes a shift from glycolytic to oxidative metabolism. Enzyme activity in plantaris, tibialis anterior, and soleus muscles from MMg transgenic mice was determined and divided by the mean value for each enzyme found in the same wild-type muscles (Table I). Values are given as mean ± SEM on a logarithmic scale. *Significant differences between transgenic and wild-type muscles (two-tailed t test, P ≤ 0.05). The full names of the enzymes are given in Table I. Note the similarity between the upper panel and Fig. 1.
The mouse soleus contains a mixture of type 1 and 2A fibers with no 2B fibers, and very few 2X fibers (see below, and Schmalbruch, 1985). Although the MMg transgene expression would be expected to be relatively low in this muscle, several of the oxidative enzymes showed significantly increased activity (Fig. 3, lower panel). There were no significant changes in glycolytic enzymes (Fig. 3, lower panel), but these enzymes are already low in the wild-type soleus.
We have previously reported that ∼90% of the myogenin overexpressing mice died during the first few days after birth (Gundersen et al., 1995). The effect was probably not insertion specific. A pathological evaluation revealed nothing unusual in the neonates, but since the regulatory regions in the transgene confer expression only in muscle, it was suggested that the deaths were caused by some subtle muscle pathology (Gundersen et al., 1995). As we are dealing with outbred mice, this raised the possibility that the different enzyme levels observed in surviving adult MMg mice were caused by selection rather than specific effects of overexpressing myogenin. Therefore, we investigated the effects of overexpressing myogenin in animals that had no increased lethality. This was achieved by crossbreeding the MMg animals with transgenic MId animals overexpressing the negative regulator Id-1 (see Materials and Methods; Gundersen et al., 1995). After determining that the MId transgene itself had minimal effects on enzyme levels (Fig. 4, left panels), enzyme activity was investigated in animals having both transgenes (MMg + MId). These mice had enzyme levels similar to those found in muscles containing only the MMg transgene (Fig. 4, right panels). In the MMg + MId mice, the effect of myogenin overexpression cannot be attributed to selection since the doubly transgenic animals had no increased neonatal lethality (Gundersen et al., 1995). Thus, in all muscles examined, the MMg transgene caused a shift towards oxidative character.
Figure 4.
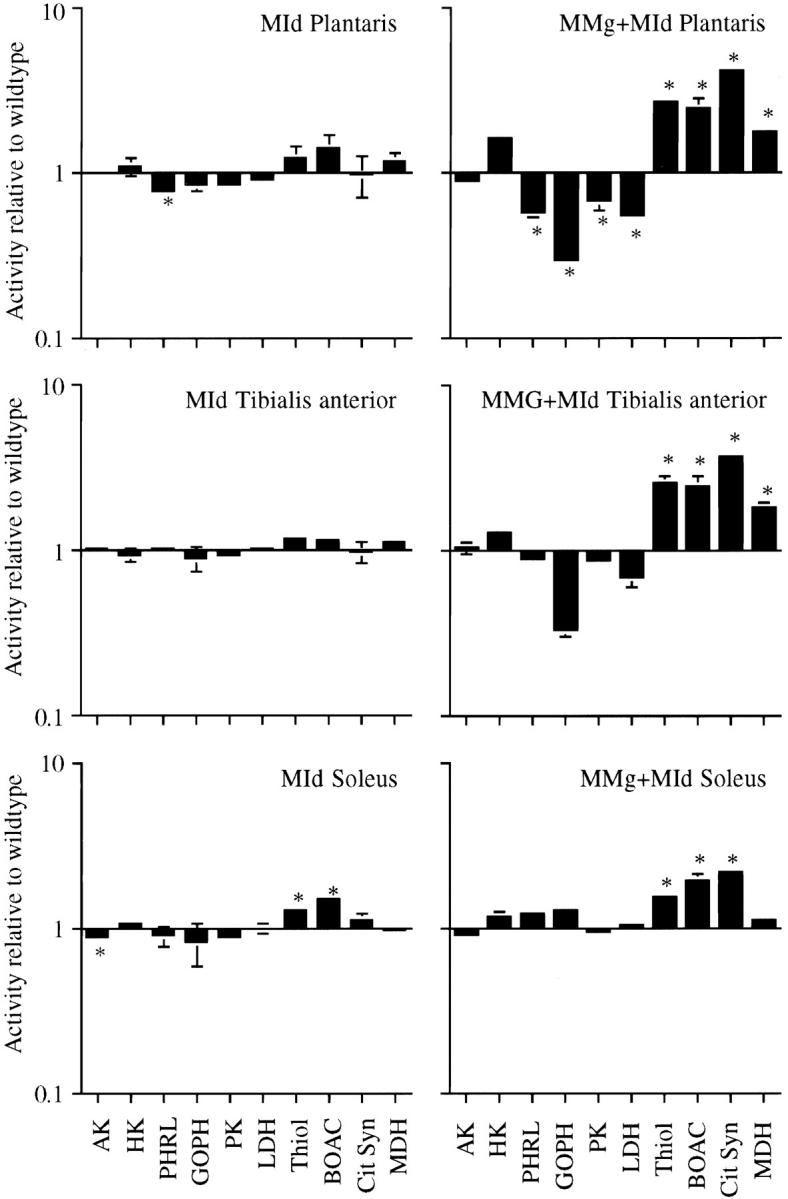
Rescue of MMg mice with the MId transgene does not prevent metabolic changes. Enzyme activity in plantaris, tibialis anterior, and soleus muscles from MId transgenic mice (left) or in MMg + MId transgenic mice (right) was determined and divided by the mean value for each enzyme found in wild-type muscles (Table I). Values are given as mean ± SEM on a logarithmic scale. *Significant differences between transgenic and wild-type muscles (two-tailed t test, P ≤ 0.05). The full names of the enzymes are given in Table I.
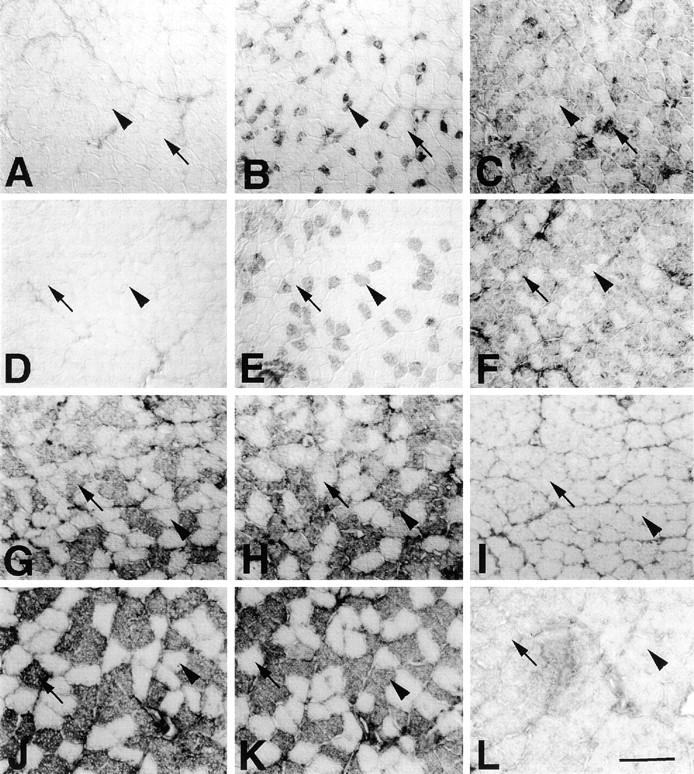
To analyze the changes in metabolic properties of MMg and MMg + MId muscles in greater detail, we employed enzyme histochemistry on tissue sections. Although this approach is nonquantitative, it has the advantage of revealing which muscle fibers are altered by the transgene. We examined the well-defined fast EDL muscle, and observed dramatic changes in metabolic properties of a subpopulation of fibers in the presence of the MMg transgene (Fig. 5). Fast glycolytic type 2B fibers became oxidative, whereas no change was detected in oxidative type 2A fibers. In wild-type mice, the smallest type 2A oxidative fibers generally contain little cytoplasmic glycogen (Fig. 5 A, arrows). In MMg mice, glycogen content of such fibers remained low, consistent with the predicted low level of expression of the transgene in these fibers. In contrast, in wild-type mice the large fast fibers, almost all of which express type 2B or 2X MyHC, fell into two groups: one group that had low levels of glycogen, and another group of slightly smaller size that contained higher levels of glycogen (Fig. 5 A). In MMg mice, the overall number of glycogen-rich fibers was greatly increased, so that fibers in both groups must have raised glycogen content, compared with wild-type littermates (Fig. 5, A and B).
Figure 5.

MMg transgene induces increased mitochondrial enzymes and glycogen. Serial sections of EDL muscles of wild-type, MMg, MMg + MId, or MId ∼120 d female mice were reacted for glycogen, NADH tetrazolium reductase, and succinate dehydrogenase. Arrows indicate fibers expressing type 2A MyHC, determined by comparison with adjacent sections. Bar, 100 μm.
In parallel with the alteration in cytoplasmic glycogen content of the fastest fibers, there was a change in mitochondrial enzyme activities, which are normally highest in mitochondria-rich oxidative fiber types. NADH-tetrazolium reductase and SDH are part of the mitochondrial electron transport chain. The activities of both enzymes were markedly increased in type 2B/2X fibers of MMg EDL, compared with the wild-type (Fig. 5, E, F, I, and J). In contrast, the high mitochondrial enzyme activity of type 2A fibers remained unchanged. Thus, the change in mitochondrial enzyme activity detected in whole muscle homogenates could also be detected at the single fiber level. Therefore, fibers expressing distinct MyHC isoforms and with distinct glycogen content could not be distinguished by mitochondrial enzymes in the MMg EDL.
The fastest classes of fibers showed the greatest change in MMg mice. Similar changes were also observed in MMg + MId mice, but not in control animals carrying the MId transgene alone, in which fiber type heterogeneity in metabolic properties was clearly detectable and similar to wild-type mice (Fig. 5). Analysis of several animals of each genotype gave similar results. However, the phenotype in MMg + MId mice appeared more variable than that of MMg mice. The vast majority of the 2B fibers of all pure MMg animals reacted more strongly than did normal 2B fibers when stained for glycogen, SDH, or NADH-tetrazolium reductase. Two out of the four MMg + MId animals analyzed displayed a similar histochemical picture, but in two other animals the 2B fibers were less affected, and a significant number of the fibers were no different from 2B fibers in wild-type mice.
Increased Oxidative Capacity Is Accompanied by Reduced Fiber Size
In wild-type mice, type 1 and 2A oxidative fibers normally have lower cross sectional area than glycolytic 2B fibers. Small fiber size in oxidative fibers aids rapid diffusion of oxygen from the surrounding capillaries into the fiber interior core. In MMg mice, in which all fibers are essentially oxidative, the size was much more uniform, and in particular, the 2B fibers were much smaller than in the wild-type (Figs. 5 and 6; Table II). The mean area of this fiber type was depressed almost 50%, and the maximal 2B fiber cross sectional area was reduced from 2,500 μm2 in wild-type to 1,300 μm2 in MMg mice. In wild-type animals, the ∼50% of fibers with low mitochondrial content tended to have areas of ∼1,500 μm2, and the other 50% of mitochondria-rich fibers had areas of ∼800 μm2. In contrast, in MMg mice the average area of all fibers (essentially all of which are mitochondria-rich) was significantly reduced to ∼800 μm2.
Figure 6.
MyHC fiber type is unaffected in MMg mice. Serial sections of EDL (A–F) and soleus (G–L) muscles of wild-type (A–C, G–I) or MMg (D–F, J–L) ∼120 d female mice were stained for A4.951 (slow; A, D, G, and J), A4.74 (2A; B, E, H, and K) and BF-F3 (2B; C, F, I, and L). In both animals, the majority of fibers reacted with a single antibody, confirming that fibers express predominantly a single MyHC isoform. In EDL, rare 2A fibers (arrowhead, A–F) were interspersed with abundant 2B fibers (arrows, A–F). In soleus, the 2A fibers (arrowhead, G–L) were more abundant than in EDL, and most other fibers contained slow type 1 MyHC (arrows, G–L). Note that the apparent increase in size of 2A fibers in MMg EDL was not observed in other animals, and probably reflects individual variation commonly observed. Bar, 100 μm.
Massive disappearance of mitochondria-poor fibers in wild-type animals could have contributed to the observed results. However, the total number of fibers in four EDL muscles from wild-type mice was 1,071 ± 250 (SD), whereas four EDLs from MMg mice contained 844 ± 151 fibers. This potential small difference was not significant (t test) and could not account for the wholesale metabolic fiber type conversion observed in the MMg mice.
Fiber area was also reduced in MMg + MId mice. Moreover, even the residual 25% of mitochondria-poor fibers in some of these animals was significantly reduced in size to ∼840 μm2. However, as we reported previously, MId transgenic mice also show alterations in muscle fiber area (Gundersen and Merlie, 1994), so it is impossible to determine whether the reduction in area of the residual glycolytic fibers in MMg + MId mice is due to the MMg or the MId transgene. Nonetheless, we conclude that when the MMg transgene acts alone it causes the large glycolytic 2B fibers normally present in EDL to acquire a size comparable to the smaller oxidative fiber types. This change could be an adaptation to the increased oxidative metabolism, but we cannot exclude that it might be related to impaired growth during development.
MMg Mice Have Normal MyHC Fiber Types
Having observed changes in the size of fibers and activity of glycolytic and oxidative metabolic enzymes typical of fast muscles, we examined the expression of fast and slow MyHC isoforms to determine whether these muscle properties also responded to the presence of the MMg transgene. Slow soleus and fast gastrocnemius, plantaris, tibialis anterior, and EDL muscles were dissected from MMg transgenic and control wild-type littermates, and the proportion and distribution of distinct fiber types analyzed with antibodies to specific MyHC isoforms. Despite normal animal to animal variation, none of the investigated muscles showed any consistent difference in the number or distribution of MyHC examined (Fig. 6), although the sizes of type 2B MyHC-containing fibers were reduced, as described above (Fig. 6, C and F; Table II). In particular, no increase in the number of A4.840 reactive slow fibers was observed (Fig. 6, A, D, G, and J; Table III) in either fast or slow muscle, nor was any shift in the expression of distinct fast MyHC isoforms detected. For example, there was no increase in the number of fibers reactive with the A4.74 antibody for 2A MyHC usually present in oxidative fast fibers (Fig. 6, B, E, H, and K; Table III), and no decrease in the number of fibers reactive with BF-F3 antibody for 2B MyHC normally characteristic of fast glycolytic fibers (Fig. 6, C, F, I, and L; Table III). Analysis with antibodies to embryonic MyHC (F1.652), neonatal fast MyHC (N1.551, N3.36), and antibody BF35, thought to detect MyHCs in all fibers except type 2X (Schiaffino et al., 1989), showed no difference in MMg mice compared with wild-type littermates (data not shown). Thus, MMg mice show no alteration in fiber type composition based on expression of a wide variety of MyHC isoforms.
Table III.
Fiber Type Frequency (%) Is Unaffected by Myogenin Overexpression
| Genotype | n | Proportion of fibers of type | ||||||||
|---|---|---|---|---|---|---|---|---|---|---|
| 1 | 2A | 2B | 2X* | |||||||
| EDL | ||||||||||
| Wild-type | 4 | 0.9 ± 0.5 | 12 ± 2 | 68 ± 4 | 19 | |||||
| MMg | 4 | 0.7 ± 0.5 | 9 ± 3 | 74 ± 5 | 16 | |||||
| MMg + MId | 3 | 1.2 ± 0.6 | 14 ± 4 | 67 ± 7 | 18 | |||||
| Tibialis anterior (deep) | ||||||||||
| Wild-type | 4 | 2 ± 1 | 24 ± 8 | 47 ± 21 | 27 | |||||
| MMg | 3 | 1 ± 1 | 19 ± 8 | 59 ± 18 | 21 | |||||
| Tibialis anterior (superficial) | ||||||||||
| Wild-type | 4 | 0 | 0 | 91 ± 7 | 9 | |||||
| MMg | 3 | 0 | 0 | 90 ± 3 | 10 | |||||
| Soleus | ||||||||||
| Wild-type | 7 | 55 ± 6 | 51 ± 3 | 0 | 0 | |||||
| MMg | 3 | 60 ± 1 | 41 ± 4 | 0 | 0 | |||||
| MMg + MId | 4 | 57 ± 6 | 49 ± 5 | 0 | 0 | |||||
Serial cryostat sections of muscles from MMg, MMg + MId, and control wild-type littermates were stained with A4.840 (slow, 1), A4.74 (2A), and BF-F3 (2B). Fiber numbers (± SEM) in whole cross sections were counted and scored as positive or negative for each antibody.
2X fiber frequencies are calculated assuming type 1 + 2A + 2B + 2X = 100%, and are shown for comparison. In soleus, a few fibers express both slow and 2A MyHC. MId mice were not analyzed because the small size of fibers in the animals made accurate counting difficult. Most detailed analysis was performed on EDL and soleus in which all fibers in the muscles were scored. For other muscles, a representative field containing ∼250–300 fibers was scored with each antibody in a similar area at approximately the same proximo-distal level within the leg, as judged by independent anatomical markers.
To rule out the possibility that selective mortality among MMg pups could hide differences in MyHC, we also examined MId and MMg + MId for changes in fibers expressing MyHC isoforms. Again, no differences from control animals were observed in the proportions of fibers of particular MyHC types (Table III). Thus, despite showing a shift in the metabolic character of both fast and slow muscles, we were unable to detect a change in MyHC expression induced by the MMg transgene.
Discussion
Overexpression of myogenin influenced the activity of metabolic enzymes, inducing a shift from glycolytic metabolism to oxidative fat-using metabolism in muscles that are normally glycolytic. This shift was accompanied by a reduction in glycolytic fiber size to a diameter typical of oxidative fibers, an increased level of glycogen, and a reddening color of white muscles which expressed the transgene at high levels. This complex change in phenotype essentially mimics the effects of endurance training on muscle (for reviews see Holloszy, 1976, 1988; Henriksson and Hickner, 1994; Henriksson, 1995), and such changes are thought to be a prerequisite for the increased muscular fatigue-resistance obtained by training. It has been observed previously that myogenin is more highly expressed in regions with high oxidative capacity and mitochondrial content than in glycolytic muscles, in both rodents and fish (Hughes et al., 1993b; Voytik et al., 1993; Rescan et al., 1995). Hence, the present findings suggest that myogenin might somehow be involved in gene regulation during fiber type differentiation or adaptation to different training states.
Regulation of Muscle Fiber Type
Although mechanical stretch and hormones also seem to play a role, it is generally thought that physical activity regulates muscle gene expression through electrical activity (for review see Gundersen, 1998). Myogenin expression is strongly regulated by activity (Duclert et al., 1991; Eftimie et al., 1991; Witzemann and Sakmann, 1991; Buonanno et al., 1992; Neville et al., 1992; Merlie et al., 1994), and thought to be involved in the development of denervation supersensitivity for acetylcholine by directly transactivating the genes for the subunits of the acetylcholine receptor (Piette et al., 1990; Gilmour et al., 1991; Jia et al., 1992; Prody and Merlie, 1992; Simon and Burden, 1993; Dürr et al., 1994). Although it is tempting to draw parallels between activity regulation of acetylcholine receptor and activity regulation of metabolic properties, there are important differences. For example, denervation only has small and variable effects on metabolic enzymes (data not shown; Gundersen et al., 1988) despite leading to a strong upregulation of all myogenic factors, including myogenin, and having dramatic effects on acetylcholine receptor expression. Upregulation of myogenin alone in MMg mice, on the other hand, leads to decline of MyoD and MRF4 mRNAs, and only a mild upregulation of the acetylcholine receptor (Gundersen et al., 1995), but has strong effects on metabolic enzymes. It adds to the complexity of this system that myogenic factors of the helix-loop-helix family are thought to work as heterodimers with E proteins (Weintraub et al., 1991), that may themselves vary between tissues (Hu et al., 1992). On the basis of correlations between myogenic factors and MyHC expression, it was previously suggested that the myogenin/MyoD ratio might regulate fiber phenotype (Hughes et al., 1993b). The present work seems to support this idea since manipulation of myogenin expression, which leads to a reciprocal downregulation of MyoD (Gundersen et al., 1995), causes an increase in oxidative metabolism in muscle fibers. The correlations observed previously between MyHC and myogenic factors could be accounted for by a relationship to metabolic properties, because slow MyHC expressing fibers are oxidative and fast 2B fibers are glycolytic. Our data support the conclusion drawn from studies on effects of moderate endurance training: oxidative enzyme activity and MyHC type can be regulated independently (see Kiens et al., 1993; Schluter and Fitts, 1994). On the other hand, the finding that myogenin also had an effect on glycolytic enzymes without accompanying change in MyHC contrasts with training studies in which glycolytic enzyme changes were observed only after more extensive training or electrical stimulation, and so were thought to parallel changes in MyHC fiber type (Henriksson and Hickner, 1994). Our data suggest that even changes in glycolytic enzymes can be uncoupled from alterations in MyHC fiber type.
Nevertheless, we cannot exclude the possibility that myogenin is involved in MyHC fiber type conversions under different conditions than those existing in surviving MMg mice. The absence of MyHC changes could be related to the level of myogenin expressed, or perhaps to a mechanism compensating for persistent artificial high levels of myogenin in MMg animals. A compensatory mechanism might be suspected because, as described previously, only a minority of the mice overexpressing myogenin survive (Gundersen et al., 1995). It is notable that myoD null mice also show increased neonatal death (Rudnicki et al., 1992), and that the surviving myoD mutants have only small changes in MyHC phenotype (Hughes et al., 1997).
While we prefer a model where myogenin is a link in the pathway between activity and muscle phenotype, we cannot exclude that the overexpression of myogenin in itself influences activity. Although the animals appeared to move normally, one can speculate that myogenin might have impaired neuromuscular transmission. Due to the high safety factor in neuromuscular synapses, impairment of transmission would have to be major, and more importantly, reduced levels of activity would tend to induce shifts in metabolism to the opposite direction of the one observed, i.e., from oxidative to glycolytic. On the other hand, the shift towards oxidative metabolism could be explained if the myogenin overexpression animals had higher activity levels than wild-type animals. Increased cell autonomous fibrillatory activity such as observed in denervated muscles (Purves and Sakmann, 1974) cannot be excluded. Alternatively, increased activity could be triggered from the CNS, e.g., caused by ectopic transgene expression. However, when the same expression system was coupled to the reporter chloramphenicol acetyltransferase (CAT), which provides a sensitive assay for detection of expression, CAT activity was not found in the brain or any other nonmuscle tissue (Rosenthal et al., 1989).
Intracellular Pathways for Determination of Muscle Fiber Type
All the oxidative enzymes measured are mitochondrial enzymes, and all were increased in MMg mice. However, AK activity did not change, even though two of the three forms of AK are nuclearly encoded proteins located in mitochondria (Nobumoto et al., 1998). The distinct changes, in particular mitochondrial enzymes, are similar to the changes observed after endurance training, and suggest not only an increase in mitochondria, but also an alteration in mitochondrial composition (Holloszy, 1988). NADH tetrazolium reductase and SDH activities of the electron transport chain increased, indicating coordinated upregulation of mitochondrial proteins encoded by both nuclear and mitochondrial genes. Moreover, NADH-TR and SDH staining patterns gave the impression of an increase in number and distribution of mitochondria, supporting the conclusion that an alteration in number and makeup of mitochondria is promoted by myogenin overexpression. The pathway connecting myogenin to changes in mitochondrial content in the MMg mice is unknown. In other systems, mitochondrial activity is thought to be at least partly mediated through transcriptional regulation, but the mechanisms governing the concerted expression of several nuclear and mitochondrial encoded genes for mitochondrial proteins are still not well understood (Scarpulla, 1997). A possible effect of myogenin on the genes for metabolic enzymes could be direct, by binding to the promoter of such genes, or indirect, through altering processes that normally regulate mitochondrial biogenesis and cell metabolic status. In a variety of mammalian cell types, recent studies implicate nuclear respiratory factor 1 (NRF-1) in nuclear synthesis of both RNAs encoding several mitochondrial proteins and in genes involved in mitochondrial DNA replication (C.A. Virbasius et al., 1993; J.V. Virbasius et al., 1993; Virbasius and Scarpulla, 1994; Xia et al., 1997). In cardiac myocytes, NRF-1 expression is induced by electrical activity by an unknown mechanism (Xia et al., 1997). Although myogenic factors are not expressed in heart, our data raise the possibility that myogenin could serve as a link between activity and NRF-1–regulated mitochondrial biogenesis in skeletal muscle.
Several promoters of metabolic enzyme genes contain the consensus sequence for the binding site of helix-loop-helix transcription factors (E-box), and in genes encoding muscle/heart-specific forms of the cytochrome c oxidase subunits VIII and VIa, it has been shown that an intact E-box is required for efficient tissue-specific transcription (Wan and Moreadith, 1995; Lenka et al., 1996). For the VIII subunit, negative effects of Id-1 were also demonstrated, strengthening the idea that helix-loop-helix proteins are important in regulating this gene. The VIa subunit required a MEF-2 site, in addition to the E-box, so myogenic factors might also interact indirectly through this sequence (Molkentin et al., 1995). The promoters for several glycolytic enzymes also contain E-boxes, but in these cases the E-box was found unnecessary for muscle-specific expression. It is, however, still possible that myogenic factors act indirectly on these promoters (Molkentin et al., 1995), since MEF-2 sites are important for muscle-specific expression (Nakatsuji et al., 1992; Hidaka et al., 1993; Feo et al., 1995; Froman et al., 1998). Besides, even if myogenic factors might not be required for tissue-specific expression, such factors may still regulate fiber type- or activity-dependent expression. Moreover, few studies have addressed the possibility that myogenic factors could act as transcriptional suppressors, rather than activators (e.g., of glycolytic enzymes).
In conclusion, our data raise the possibility that skeletal muscle myogenin, regulated by electrical activity, brings about metabolic changes either through direct effects on genes coding for muscle-specific mitochondrial and cytoplasmic enzymes, and/or indirectly on more ubiquitous mitochondrial genes by enhancing expression of master regulators of mitochondrial biogenesis, like NRF-1. Recently, it has been reported that cyclosporin A can alter muscle fiber type, possibly through effects of the calcium-activated protein phosphatase calcineurin on the NFAT transcription factors (Chin et al., 1998). The relationship of the results presented here to the effect of cyclosporin A is currently unclear. However, it would not be surprising if several distinct groups of transcription factors were capable of modulating different aspects of muscle fiber type.
Abbreviations used in this paper
- EDL
musculus extensor digitorum longus
- MId
Id-1 transgene
- MMg
myogenin transgene
- MMg + MId
double transgenic mice
- MyHC
myosin heavy chain
- NRF-1
nuclear respiratory factor 1
Footnotes
This work was initiated in the laboratory of the late John P. Merlie. We would like to dedicate this paper to him, who died at the peak of his professional life, and to Oliver H. Lowry who was a role model for several generations of scientists. We are grateful to Ms. Alison Maggs for technical assistance and Drs. Jan Henriksson (Stockholm), and Terje Lømo (Oslo) for comments on previous versions of this manuscript.
S.M. Hughes was supported by the Medical Research Council. K. Gundersen was supported by the Norwegian Research Council and the Norwegian Cancer Society.
References
- Abdelmalki A, Fimbel S, Mayet-Sornay MH, Sempore B, Favier R. Aerobic capacity and skeletal muscle properties of normoxic and hypoxic rats. Pflügers Arch. 1993;431:671–679. doi: 10.1007/BF02253829. [DOI] [PubMed] [Google Scholar]
- Benezra R, Davis RL, Lockshon D, Turner DL, Weintraub H. The protein Id: a negative regulator of helix-loop-helix DNA binding proteins. Cell. 1990;61:49–59. doi: 10.1016/0092-8674(90)90214-y. [DOI] [PubMed] [Google Scholar]
- Bottinelli R, Betto R, Schiaffino S, Reggiani C. Unloaded shortening velocity and myosin heavy chain and alkali light chain isoforms composition in rat skeletal muscle fibres. J Physiol. 1994;478:341–349. doi: 10.1113/jphysiol.1994.sp020254. [DOI] [PMC free article] [PubMed] [Google Scholar]
- Buonanno A, Apone L, Morasso MI, Beers R, Brenner HR, Eftimie R. The myoD family of myogenic factors is regulated by electrical activity: isolation and characterization of a mouse myf-5 cDNA. Nucleic Acids Res. 1992;20:539–544. doi: 10.1093/nar/20.3.539. [DOI] [PMC free article] [PubMed] [Google Scholar]
- Chi MM, Hintz CS, Coyle EF, Martin WH, Ivy JL, Nemeth PM, Holloszy JO, Lowry OH. Effects of detraining on enzymes of energy metabolism in individual human muscle fibers. Am J Physiol. 1983;244:C276–C287. doi: 10.1152/ajpcell.1983.244.3.C276. [DOI] [PubMed] [Google Scholar]
- Chi MM, Hintz CS, Henrikson J, Salmons S, Hellendahl RP, Park JL, Nemeth PM, Lowry OH. Chronic stimulation of mammalian muscle: enzyme changes in individual fibers. Am J Physiol. 1986;251:C633–C642. doi: 10.1152/ajpcell.1986.251.4.C633. [DOI] [PubMed] [Google Scholar]
- Chi MM, Choksi R, Nemeth P, Krasnov I, Ilyina-Kakueva E, Manchester JK, Lowry OH. Effects of microgravity and tail suspension on enzymes of individual soleus and tibialis anterior fibers. J Appl Physiol. 1992;73:66S–73S. doi: 10.1152/jappl.1992.73.2.S66. [DOI] [PubMed] [Google Scholar]
- Chin E, Olson EN, Richardson JA, Yang Q, Humphries C, Shelton JM, Wu H, Zhu W, Bassel-Duby R, Williams RS. A calcineurin-dependent transcriptional pathway controls skeletal muscle fiber type. Genes Dev. 1998;12:2499–2509. doi: 10.1101/gad.12.16.2499. [DOI] [PMC free article] [PubMed] [Google Scholar]
- Cho M, Hughes SM, Karsch MI, Travis M, Leinwand LA, Blau HM. Fast myosin heavy chains expressed in secondary mammalian muscle fibers at the time of their inception. J Cell Sci. 1994;107:2361–2371. doi: 10.1242/jcs.107.9.2361. [DOI] [PubMed] [Google Scholar]
- Chomczynski P, Sacchi N. Single-step method of RNA isolation by acid guanidinium thiocyanate-phenol-chloroform extraction. Anal Biochem. 1987;162:156–159. doi: 10.1006/abio.1987.9999. [DOI] [PubMed] [Google Scholar]
- Donoghue MJ, Alvarez JD, Merlie JP, Sanes JR. Fiber type- and position-dependent expression of a myosin light chain-CAT transgene detected with a novel histochemical stain for CAT. J Cell Biol. 1991;115:423–434. doi: 10.1083/jcb.115.2.423. [DOI] [PMC free article] [PubMed] [Google Scholar]
- Dubowitz, V. 1985. Muscle Biopsy: A Practical Approach. Balliére Tindall, London. 720 pp.
- Duclert A, Piette J, Changeux JP. Influence of innervation on myogenic factors and acetylcholine receptor α-subunit mRNAs. NeuroReport. 1991;2:25–28. doi: 10.1097/00001756-199101000-00006. [DOI] [PubMed] [Google Scholar]
- Dunn GA, Zicha D, Fraylich PE. Rapid, microtuble-dependent fluctuations of the cell margin. J Cell Sci. 1997;110:3091–3098. doi: 10.1242/jcs.110.24.3091. [DOI] [PubMed] [Google Scholar]
- Dürr I, Numberger M, Berberich C, Witzemann V. Characterization of the functional role of E-box elements for the transcriptional activity of rat acetylcholine receptor ε-subunit and γ-subunit gene promoters in primary muscle cell cultures. Eur J Biochem. 1994;224:353–364. doi: 10.1111/j.1432-1033.1994.00353.x. [DOI] [PubMed] [Google Scholar]
- Eftimie R, Brenner HR, Buonanno A. Myogenin and myoD join a family of skeletal muscle genes regulated by electrical activity. Proc Natl Acad Sci USA. 1991;88:1349–1353. doi: 10.1073/pnas.88.4.1349. [DOI] [PMC free article] [PubMed] [Google Scholar]
- Feo S, Antona V, Barbieri G, Passantino R, Calì L, Giallongo A. Transcription of the human β enolase gene (ENO-3) is regulated by an intronic muscle-specific enhancer that binds myocyte-specific enhancer factor 2 proteins and ubiquitous G-rich-box binding factors. Mol Cell Biol. 1995;15:5991–6002. doi: 10.1128/mcb.15.11.5991. [DOI] [PMC free article] [PubMed] [Google Scholar]
- Fitts, R.H., and J.J. Widrick. 1996. Muscle mechanics: adaptations with exercise training. In Exercise and Sport Sciences Reviews. J.O. Holloszy, editor. Williams & Wilkins, New York. 427–473. [PubMed]
- Froman BE, Tait RC, Gorin FA. Role of E and CArG boxes in developmental regulation of muscle glycogen phosphorylase promoter during myogenesis. DNA Cell Biol. 1998;17:105–115. doi: 10.1089/dna.1998.17.105. [DOI] [PubMed] [Google Scholar]
- Gilmour BP, Fanger GR, Newton C, Evans SM, Gardner PD. Multiple binding sites for myogenic regulatory factors are required for expression of the acetylcholine receptor γ-subunit gene. J Biol Chem. 1991;266:19871–19874. [PubMed] [Google Scholar]
- Gorza L, Gundersen K, Lømo T, Schiaffino S, Westgaard RH. Slow to fast transformation of denervated soleus muscles by chronic high frequency stimulation in the rat. J Physiol (Lond) 1988;402:627–649. doi: 10.1113/jphysiol.1988.sp017226. [DOI] [PMC free article] [PubMed] [Google Scholar]
- Gundersen K. Determination of muscle contractile properties: The importance of the nerve. Acta Physiol Scand. 1998;162:333–341. doi: 10.1046/j.1365-201X.1998.0336e.x. [DOI] [PubMed] [Google Scholar]
- Gundersen K, Merlie JP. Id-1 as a possible transcriptional mediator of muscle disuse atrophy. Proc Natl Acad Sci USA. 1994;91:3647–3651. doi: 10.1073/pnas.91.9.3647. [DOI] [PMC free article] [PubMed] [Google Scholar]
- Gundersen K, Leberer E, Lømo T, Pette D, Staron RS. Fibre type, calcium-sequestering proteins and metabolic enzymes in denervated and chronically stimulated muscles of the rat. J Physiol (Lond) 1988;398:177–189. doi: 10.1113/jphysiol.1988.sp017037. [DOI] [PMC free article] [PubMed] [Google Scholar]
- Gundersen K, Hanley T, Merlie JP. Transgenic embryo yield is increased by a simple, inexpensive micropipet treatment. Biotechniques. 1993;14:412–414. [PubMed] [Google Scholar]
- Gundersen K, Rabben I, Klocke BJ, Merlie J. Overexpression of myogenin in muscles of transgenic mice: interaction with Id-1, negative cross-regulation of myogenic factors and induction of extrasynaptic acetylcholine receptor expression. Mol Cell Biol. 1995;15:7127–7134. doi: 10.1128/mcb.15.12.7127. [DOI] [PMC free article] [PubMed] [Google Scholar]
- Hanley T, Merlie JP. Transgene detection in unpurified mouse tail DNA by polymerase chain reaction. Biotechniques. 1991;10:56. [PubMed] [Google Scholar]
- Henriksson J. Effect of training and nutrition on the development of skeletal muscle. J Sports Sci. 1995;13:S25–S30. doi: 10.1080/02640419508732273. [DOI] [PubMed] [Google Scholar]
- Henriksson, J., and J. Hickner. 1994. Training-induced adaptions in skeletal muscle. In Oxford Textbook of Sports Medicine. M. Harries, editor. Oxford University Press, Oxford. 27–45.
- Henriksson J, Chi MM, Hintz CS, Young DA, Kaiser KK, Salmons S, Lowry OH. Chronic stimulation of mammalian muscle: changes in enzymes of six metabolic pathways. Am J Physiol. 1986;251:C614–C632. doi: 10.1152/ajpcell.1986.251.4.C614. [DOI] [PubMed] [Google Scholar]
- Hidaka K, Yamamoto I, Arai Y, Mukai T. The MEF-3 motif is required for MEF-2-mediated skeletal muscle-specific induction of the rat aldolase A gene. Mol Cell Biol. 1993;13:6469–6478. doi: 10.1128/mcb.13.10.6469. [DOI] [PMC free article] [PubMed] [Google Scholar]
- Holloszy JO. Biochemical adaptions in muscle. Effects of exercise in mitochondrial oxygen uptake and respiratory activity in skeletal muscle. J Biol Chem. 1976;242:2278–2282. [PubMed] [Google Scholar]
- Holloszy, J.O. 1988. Metabolic consequences of endurance exercise training. In Exercise, Nutrition and Energy Metabolism. E.S. Horton, and R.L. Terjung, editors. Macmillan Publishing Company, New York. 427–475.
- Hu JS, Olson EN, Kingston RE. HEB, a helix-loop-helix protein related to E2A and ITF2 that can modulate the DNA-binding ability of myogenic regulatory factors. Mol Cell Biol. 1992;12:1031–1042. doi: 10.1128/mcb.12.3.1031. [DOI] [PMC free article] [PubMed] [Google Scholar]
- Hughes SM, Cho M, Karsch MI, Travis M, Silberstein L, Leinwand LA, Blau HM. Three slow myosin heavy chains sequentially expressed in developing mammalian skeletal muscle. Dev Biol. 1993a;158:183–199. doi: 10.1006/dbio.1993.1178. [DOI] [PubMed] [Google Scholar]
- Hughes SM, Taylor JM, Tapscott SJ, Gurley CM, Carter WJ, Peterson CA. Selective accumulation of myoD and myogenin mRNAs in fast and slow adult skeletal muscle is controlled by innervation and hormones. Development. 1993b;118:1137–1147. doi: 10.1242/dev.118.4.1137. [DOI] [PubMed] [Google Scholar]
- Hughes SM, Koishi K, Rudnicki M, Maggs AM. MyoD protein is differentially accumulated in fast and slow skeletal muscle fibres and required for normal fibre type balance in rodents. Mech Dev. 1997;61:151–163. doi: 10.1016/s0925-4773(96)00631-4. [DOI] [PubMed] [Google Scholar]
- Jia H-T, Tsay HJ, Schmidt J. Analysis of binding and activating functions of the chick muscle acetylcholine receptor γ-subunit upstream sequence. Cell Mol Neurobiol. 1992;12:241–258. doi: 10.1007/BF00712929. [DOI] [PMC free article] [PubMed] [Google Scholar]
- Kiens B, Éssen-Gustavsson B, Christensen NJ, Saltin B. Skeletal muscle substrate utilization during submaximal exercise in man: effect of endurance training. J Physiol (Lond) 1993;469:459–478. doi: 10.1113/jphysiol.1993.sp019823. [DOI] [PMC free article] [PubMed] [Google Scholar]
- Kraemer WJ, Patton JF, Gordon SE, Harman EA, Deschenes MR, Reynolds K, Newton RU, Triplett NT, Dziados JE. Compatibility of high-intensity strength and endurance training on hormonal and skeletal muscle adaptions. J Appl Physiol. 1995;78:976–989. doi: 10.1152/jappl.1995.78.3.976. [DOI] [PubMed] [Google Scholar]
- Lenka N, Basu A, Mullick J, Avadhani NG. The role of an E box binding basic helix loop helix protein in the cardiac muscle-specific expression of the rat cytochrome oxidase subunit VIII gene. J Biol Chem. 1996;271:30281–30289. doi: 10.1074/jbc.271.47.30281. [DOI] [PubMed] [Google Scholar]
- Li L, Zhou J, James G, Heller-Harison R, Czech MP, Olson EN. FGF inactivates myogenic helix-loop-helix proteins through phosphorylation of a conserved protein kinase C site in their DNA-binding domains. Cell. 1992;71:1181–1194. doi: 10.1016/s0092-8674(05)80066-2. [DOI] [PubMed] [Google Scholar]
- Lowry CV, Kimmey JS, Felder S, Chi MM, Kaiser KK, Passonneau PN, Kirk KA, Lowry OH. Enzyme patterns in single human muscle fibers. J Biol Chem. 1978;253:8269–8277. [PubMed] [Google Scholar]
- Mayne CN, Mokrusch T, Jarvis JC, Gilroy SJ, Salmons S. Stimulation-induced expression of slow muscle myoein in a fast muscle of the rat. Evidence of an unrestricted adaptive capacity. FEBS Lett. 1993;327:297–300. doi: 10.1016/0014-5793(93)81008-n. [DOI] [PubMed] [Google Scholar]
- Melton DA, Krieg PA, Rebagliati MR, Maniatis T, Zinn K, Green MR. Efficient in vitro synthesis of biologically active RNA and RNA hybridization probes from plasmids containing a bacteriophage SP6 promoter. Nucleic Acids Res. 1984;12:7035–7055. doi: 10.1093/nar/12.18.7035. [DOI] [PMC free article] [PubMed] [Google Scholar]
- Merlie JP, Mudd J, Cheng TC, Olson EN. Myogenin and acetylcholine receptor alpha gene promoters mediate transcriptional regulation in response to motor innervation. J Biol Chem. 1994;269:2461–2467. [PubMed] [Google Scholar]
- Molkentin JD, Olson EN. Defining the regulatory networks for muscle development. Curr Opin Genet Dev. 1996;6:445–453. doi: 10.1016/s0959-437x(96)80066-9. [DOI] [PubMed] [Google Scholar]
- Molkentin JD, Black BL, Martin JF, Olson EN. Cooperative activation of muscle gene expression by MEF2 and myogenic bHLH proteins. Cell. 1995;83:1125–1136. doi: 10.1016/0092-8674(95)90139-6. [DOI] [PubMed] [Google Scholar]
- Nakatsuji Y, Hidaka K, Tsujino S, Yamamoto Y, Mukai T, Yanagihara T, Kishimoto T, Sakoda S. A single MEF-2 site is a major positive regulatory element required for transcription of the muscle-specific subunit of the human phosphoglycerate mutase gene in skeletal and cardiac muscle cells. Mol Cell Biol. 1992;12:4384–4390. doi: 10.1128/mcb.12.10.4384. [DOI] [PMC free article] [PubMed] [Google Scholar]
- Neville CM, Schmidt M, Schmidt J. Response of myogenic determination factors to cessation and resumption of electrical activity in skeletal muscle: a possible role for myogenin in denervation supersensitivity. Cell Mol Neurobiol. 1992;12:511–527. doi: 10.1007/BF00711232. [DOI] [PMC free article] [PubMed] [Google Scholar]
- Nobumoto M, Yamada M, Song S, Inouye S, Nakazawa A. Mechanism of mitochondrial import of adenylate kinase isozymes. J Biochem. 1998;123:128–135. doi: 10.1093/oxfordjournals.jbchem.a021899. [DOI] [PubMed] [Google Scholar]
- Piette J, Bessereau JL, Huchet M, Changeux JP. Two adjacent MyoD1-binding sites regulate expression of the acetylcholine receptor α-subunit. Nature. 1990;345:353–355. doi: 10.1038/345353a0. [DOI] [PubMed] [Google Scholar]
- Prody CA, Merlie JP. A developmental and tissue-specific enhancer in the mouse skeletal muscle acetylcholine receptor α-subunit gene regulated by myogenic factors. J Biol Chem. 1992;266:22588–22596. [PubMed] [Google Scholar]
- Purves D, Sakmann B. The effect of contractile activity on fibrillation and extrajunctional acetylcholine-sensitivity in rat muscle maintained in organ culture. J Physiol (Lond) 1974;237:157–182. doi: 10.1113/jphysiol.1974.sp010475. [DOI] [PMC free article] [PubMed] [Google Scholar]
- Ranviér L. De quelques faits relatifs a l'histologie et a la physiologie des muscles stries. Archives de Physiologie Normale et Pathologique. 1874;6:1–15. [Google Scholar]
- Reiser PJ, Moss RL, Giulian GG, Greaser ML. Shortening velocity in single fibers from adult rabbit soleus muscles is correlated with myosin heavy chain composition. J Biol Chem. 1985;260:9077–9080. [PubMed] [Google Scholar]
- Rescan P-Y, Gauvry L, Paboeuf G. A gene with homology to myogenin is expressed in developing myotomal musculature of the rainbow trout and in vitro during the conversion of myosatellite cells into myotubes. FEBS Lett. 1995;362:89–92. doi: 10.1016/0014-5793(95)00215-u. [DOI] [PubMed] [Google Scholar]
- Rosenthal N, Kornhauser JM, Donoghue M, Rosen KM, Merlie JP. Myosin light chain enhancer activates muscle-specific developmentally regulated gene expression in transgenic mice. Proc Natl Acad Sci USA. 1989;86:7780–7784. doi: 10.1073/pnas.86.20.7780. [DOI] [PMC free article] [PubMed] [Google Scholar]
- Rudnicki MA, Braun T, Hinuma S, Jaenisch R. Inactivation of myoD in mice leads to up-regulation of myogenic HLH gene myf-5 and results in apparently normal muscle development. Cell. 1992;71:383–390. doi: 10.1016/0092-8674(92)90508-a. [DOI] [PubMed] [Google Scholar]
- Scarpulla RC. Nuclear control of respiratory chain expression in mammalian cells. J Bioenerg Biomembr. 1997;29:109–119. doi: 10.1023/a:1022681828846. [DOI] [PubMed] [Google Scholar]
- Schiaffino S, Gorza L, Sartore S, Saggin L, Ausoni S, Vianello M, Gundersen K, Lømo T. Three myosin heavy chain isoforms in type 2 skeletal muscle fibres. J Muscle Res Cell Motil. 1989;10:197–205. doi: 10.1007/BF01739810. [DOI] [PubMed] [Google Scholar]
- Schluter JM, Fitts RH. Shortening velocity and ATPase activity of rat skeletal muscle fibers: effects of endurance excercise training. Am J Physiol. 1994;267:E388–E395. doi: 10.1152/ajpcell.1994.266.6.C1699. [DOI] [PubMed] [Google Scholar]
- Schmalbruch, H. 1985. Skeletal Muscle. Springer-Verlag, Berlin. 440 pp.
- Simon AM, Burden SJ. An E box mediates activation and repression of the acetylcholine receptor δ-subunit gene during myogenesis. Mol Cell Biol. 1993;13:5133–5140. doi: 10.1128/mcb.13.9.5133. [DOI] [PMC free article] [PubMed] [Google Scholar]
- Virbasius CA, Virbasius JV, Scarpulla RC. NRF-1, an activator involved in nuclear-mitochondrial interactions, utilizes a new DNA-binding domain conserved in a family of developmental regulators. Genes Dev. 1993;7:2431–2445. doi: 10.1101/gad.7.12a.2431. [DOI] [PubMed] [Google Scholar]
- Virbasius JV, Scarpulla RC. Activation of the human mitochondrial transcription factor A gene by nuclear respiratory factors: a potential regulatory link between nuclear and mitochondrial gene expression in organelle biogenesis. Proc Natl Acad Sci USA. 1994;91:1309–1313. doi: 10.1073/pnas.91.4.1309. [DOI] [PMC free article] [PubMed] [Google Scholar]
- Virbasius JV, Virbasius CA, Scarpulla RC. Identity of GABP with NRF-2, a multisubunit activator of cytochrome oxidase expression, reveals a cellular role for an ETS domain activator of viral promoters. Genes Dev. 1993;7:380–392. doi: 10.1101/gad.7.3.380. [DOI] [PubMed] [Google Scholar]
- Voytik SL, Przyborsky M, Badylak SF, Koenieczny SF. Differential expression of muscle regulatory factor genes in normal and denervated adult rat hindlimb muscles. Dev Dyn. 1993;198:214–224. doi: 10.1002/aja.1001980307. [DOI] [PubMed] [Google Scholar]
- Wan B, Moreadith RW. Structural characterization and regulatory element analysis of the heart isoform of cytochrome c oxidase VIa. J Biol Chem. 1995;270:26433–26440. doi: 10.1074/jbc.270.44.26433. [DOI] [PubMed] [Google Scholar]
- Wang N, Hikida RS, Staron RS, Simoneau JA. Muscle fiber types of women after resistance training: quantitative ultrastructure and enzyme activity. Pflügers Arch. 1993;424:494–502. doi: 10.1007/BF00374913. [DOI] [PubMed] [Google Scholar]
- Weintraub H. The myoD family and myogenesis: redundancy, networks, and thresholds. Cell. 1993;75:1241–1244. doi: 10.1016/0092-8674(93)90610-3. [DOI] [PubMed] [Google Scholar]
- Weintraub H, Davis R, Tapscott S, Tahyer M, Krause M, Benezra R, Blackwell TK, Turner D, Rupp R, Hollenberg S, et al. The myoD family: nodal point during specification of the muscle cell lineage. Science. 1991;251:761–766. doi: 10.1126/science.1846704. [DOI] [PubMed] [Google Scholar]
- Windisch A, Gundersen K, Szabolcs MJ, Gruber H, Lømo T. Fast to slow transformation in electrically stimulated muscles of the rat. J Physiol (Lond) 1998;510:623–632. doi: 10.1111/j.1469-7793.1998.623bk.x. [DOI] [PMC free article] [PubMed] [Google Scholar]
- Witzemann V, Sakmann B. Differential regulation of myoD and myogenin mRNA by nerve induced muscle activity. FEBS Lett. 1991;282:259–264. doi: 10.1016/0014-5793(91)80490-t. [DOI] [PubMed] [Google Scholar]
- Wright WE, Sassoon DA, Lin VK. Myogenin, a factor regulating myogenesis, has a domain homologous to MyoD. Cell. 1989;56:607–617. doi: 10.1016/0092-8674(89)90583-7. [DOI] [PubMed] [Google Scholar]
- Wright WE, Binder M, Funk W. Cyclic amplification and selection of targets (CASTing) for the myogenin consensus binding site. Mol Cell Biol. 1991;11:4104–4110. doi: 10.1128/mcb.11.8.4104. [DOI] [PMC free article] [PubMed] [Google Scholar]
- Xia Y, Buja LM, Scarpulla RC, McMillin JB. Electrical stimulation of neonatal cardiomyocytes results in the sequential activation of nuclear genes governing mitochondrial proliferation and differentiation. Proc Natl Acad Sci USA. 1997;94:11399–11404. doi: 10.1073/pnas.94.21.11399. [DOI] [PMC free article] [PubMed] [Google Scholar]