

Abstract
We probe DNA hybridization kinetics by measuring the lifetime distribution of single 16-bp duplexes under thermal dissociation. Our unique approach, based on two DNA-coated microspheres in an extended optical tweezer, allows the study of single duplex DNA molecules under negligible molecular tension. In contrast to earlier experiments, we find a stretched exponential lifetime distribution, which is likely due to dissociation proceeding via a number of competing pathways between highly force-sensitive intermediate states. Similar measurements of microspheres linked by multiple DNA bridges find they have unexpected short bound lifetimes, also consistent with force sensitivity.
Introduction
The process of DNA hybridization requires the traversing of a multitude of intermediate steps to get from two random coil oligonucleotides to a tidy duplex DNA. For the past decade, single molecule experiments have used nanopore conductivity (1–3), or optical tweezers (4,5) to study the hybridization of short DNA duplexes and hairpins. These studies find a simple exponential lifetime distribution, consistent with there being a single rate-limiting step for dissociation. This finding is in contrast to fluorescence correlation spectroscopy (FCS) studies that find a stretched exponential lifetime distribution (6–8), hypothesized to be due to misfolded conformations during duplex formation (9,10). The two classes of experiments differ in the tension applied to the duplex (<1 pN in the FCS experiments versus a few picoNewtons in the others), the timescales probed, and the steric constraints applied to the dangling ends of partially dissociated intermediates.
To clarify this situation, we performed mechanical measurements of single duplexes under thermal dissociation at sub-picoNewton molecular tension. Our instrument consists of two micron-sized polymer spheres held by a line optical tweezer (11), linked by one or more DNA molecules (see Fig. 1 a). DNA bridge lifetimes and conformations are studied by measuring the spheres’ time-dependent separation, to a precision of few nanometers, using image-based particle tracking. The two microspheres share a roughly harmonic potential along the line and are strongly confined in the perpendicular directions. The length of the line tweezer is adjusted until short-range optical repulsions and a long-range trap-induced attraction cancel each other out near contact, ensuring that the measurements are made at effectively zero applied molecular tension.
Figure 1.

A schematic representation of our experiment, showing microspheres with DNA grafted to their surfaces. (a) Two different diameter microspheres trapped in a line optical tweezer. The 1.02-μm-diameter spheres contain either N ≈ 10 or 50 s1 strands that are 50 bases in length, and 0.84-μm-diameter spheres contain >105s2 strands that are 20 bases in length. (b) Single bridge formed by the hybridization of a third s3 strand complementary to the s1 and s2 strands.
We graft two different DNA strands, s1 and s2, to two populations of microspheres having discernibly different diameters. A third strand in solution, s3, can hybridize between them to form a molecular bridge (see Fig. 1 b). The length of the 16-basepair overlap between s2 and s3 is chosen to yield a bridge with reasonable dissociation rate at convenient experimental temperatures. We use a physical grafting method (12) to permanently attach DNA-grafted polymer surfactants to the microspheres. This results in a sterically stable, protein free, functionalized colloidal surface with ultra-low nonspecific binding (13). To study the single-molecule limit, the density of s1 strands is made very low, while the density of s2 is kept high to maintain a reasonable rate of bridge formation. Because the oligonucleotides are small compared to the microspheres, only molecules in a small contact region between the spheres can form molecular bridges. To study single DNA duplexes, we prepare spheres with N ≈ 10 s1 strands, yielding an expectation value for the number of strands in a contact region of only 〈n〉 ≈ 0.1. To study multiple-bridge binding, we prepare spheres with N ≈ 50 s1 strands, or 〈n〉 ≈ 0.5.
We find a stretched exponential lifetime distribution with a stretching exponent comparable to that found by FCS, but on a timescale several orders-of-magnitude longer; seconds versus milliseconds. (The latter difference in lifetime is no surprise given the difference in overlap length.) Since duplex formation requires less than a millisecond to complete (14), however, the stretched exponential behavior we observe is presumably a feature of the thermal dissociation process, while in the FCS experiments it may not be. Simple checks rule out both nonspecific binding between our microspheres and some alternative explanations for the observed nonexponential behavior, such as surface heterogeneity or slow microsphere diffusion. A second study at higher DNA density probes the kinetics of bound states with multiple DNA bridges between the microspheres. To understand the behavior of the multiple bridge system, we performed simulations using a Brownian dynamics approach (15,16). The mean binding lifetime in the multiple bridge experiments is significantly shorter than that expected from the simulation, suggesting that entropic constraints or strains in that case may accelerate dehybridization.
Materials and methods
Line optical tweezer and imaging
Our instrument consists of two microspheres held by an optical tweezer that has been extended in one direction in the focal plane, called a line optical tweezer (LOT), described previously (17). Briefly, a Gaussian beam from a diode laser (100 mW, λ = 830 nm; Melles-Griot, Carlsbad, CA) is given a ∼20× anamorphic, anastigmatic magnification using a cylindrical telescope and focused 5 μm into a sample chamber on an inverted microscope (DM-IRB; Leica, Wetzlar, Germany). The LOT holds the microspheres such that they are constrained to move along the LOT's line focus. By adjusting the trap length and laser polarization, the total optical forces acting between the microspheres can be nulled to ±25 fN (17).
The separation of the spheres is approximated by the in-plane distance between their brightness-weighted centroids (18) determined from bright field microscopy images. Images are collected at 200 frames/s using a noninterlaced, high-speed digital camera with a CMOS detector (Phantom 4; Vision Research, Wayne, NJ). Light from a second, stroboscopically pulsed (2W, λ = 808 nm) diode laser (Spectra Diode Laboratories, San Jose, CA) scrambled by a multimode optical fiber provides a quasi-Köhler illumination source (17) permitting exposure times <10 μs. Our image analysis algorithm corrects for diffraction blurred image overlap (19). Earlier work from our laboratory (17) used the known dependence of the microspheres’ hydrodynamic coupling to confirm the accuracy of our particle separation measurements near contact, and by extension the nulling of optical forces. At each s1 density, ∼106 images were collected from four sphere pairs and the results pooled together. Slow, few-nm drifts of the measured contact separation were removed by a detrending algorithm. Because our camera's burst image acquisition is not continuous, any binding events spanning a timing gap were discarded.
DNA and particle preparation
All DNA strands were custom-synthesized, amine-functionalized, and high-performance, liquid-chromatography-purified by Integrated DNA Technologies (Coralville, IA), and handled using standard aseptic protocols. All three DNA sequences are designed to have no secondary structure or unintentional affinity at experimental temperatures (13). The sequences used were:
grafted to 1.02-μm-diameter poly-styrene microspheres and
grafted to 0.84-μm-diameter polystyrene microspheres. These were bridged together by linker
via hybridization of the terminal 49 bases (underlined sequences) and 16 bases (bold sequences) to s1 and s2, respectively. The linker strands were carefully annealed onto the s1 strands using a thermocycler. Once the s3 linkers have been annealed onto the s1 microspheres, the 49-bp duplex overlap should be stable for the duration of our experiments. It is the thermal dissociation of the 16-bp duplex overlap between s2 and s3 that we study here.
Our microspheres are carboxylate-modified polystyrene colloids (CML; Seradyn, Indianapolis, IN) suspended in a buffer solution (150 mM NaCl, 10 mM Tris, pH = 8.0). While the carboxylate groups impart a significant charge to the surface, the ionic strength of the solvent leads to a screening length of <1 nm, which is much shorter than the ∼15 nm long DNA bridges. Moreover, control measurements show that the DNA-induced repulsive forces are not sensitive to modest changes in ionic strength. We use a physical grafting approach based on microsphere swelling and deswelling (12) to permanently attach DNA-grafted polymer surfactants (F-108 Pluronic; Invitrogen, Carlsbad, CA) to the microspheres. We achieved an ultra-low surface density of s1 via a competition between surfactants both with and without covalently attached DNA. The amount of grafted s1 was measured by flow cytometry at high s1 density, and confirmed to be linear in the two surfactants’ molar ratio. This dependence was then extrapolated to low molar ratio and s1 density.
Flow cytometry
Flow cytometry was used to quantify the number of grafted-DNA strands per particle using a FACScan Flow Cytometer (Becton Dickinson, San Jose, CA). We measured the mean fluorescence intensity (MFI) of the beads after hybridizing complementary fluorescein isothiocyanate (FITC)-labeled DNA to the grafted strands under saturating conditions. Equilibrium binding titration series allowed us to verify saturation and to check for any self-quenching at high surface densities. A parallel, similar titration series of beads containing no immobilized oligonucleotides showed no nonspecific binding between the FITC-labeled strands and the microsphere surface. Using the same buffer and fluorescence detector settings, we calibrated our flow cytometer by measuring the MFI of calibrated FITC standards (quantum FITC low-level mean equivalent soluble fluorophore (MESF) beads from Bangs Laboratories, Fishers, IN). This allows us to express the MFI of our beads in terms of MESFs, which approximately equals the number of FITC molecules per bead (and thus the number of immobilized DNA molecules).
To further refine the estimate, we measured the labeling efficiency fD of our FITC-labeled DNA using an ultraviolet spectrometer to determine the molar concentrations of DNA and FITC in solution. Approximately 85% of our DNA is attached to an FITC molecule. We also used a spectrofluorimeter to measure the intensity of our FITC-labeled DNA relative to free fluorescein, otherwise known as the relative quantum yield Qr, at a concentration of ∼100 nM. After subtraction of the appropriate buffer backgrounds, we obtained a quantum yield of ∼80%. With this information, we can convert our MESF values per bead to molecules per bead, i.e., molecules/bead = MESF/(fDQr).
Brownian dynamics simulation
We designed a simple Brownian dynamics simulation of our system (15), consisting of two diffusing surfaces grafted with n ligands that dynamically bridge together in a statistically independent manner. Here n is a dynamic variable sampled from a binomial distribution which accounts for the statistical variations of the number of ligands in the contact region, as the microspheres tumble in the trap. Since the contour length L of our grafted DNA is small compared to the radii of the microspheres, we modeled the system as two flat plates diffusing in one dimension. We used the experimental lubrication-reduced microsphere relative diffusivity (20) D, for the plate diffusivity. The plate was stepped via (16)
| (1) |
where h(t) is the plate separation at time t, i is the number of DNA bridges between plates at time t, v is the mean drift velocity of the plates due to a single DNA bridge, and dt is the size of the next time step. If no bridges have formed (i.e., i = 0), then h(t) executes a random walk from 0 to hmax. For i > 0, the entropic tension in the DNA bridge generates a mean drift velocity which pulls the plates together at a rate
| (2) |
where f(h) is the entropic force of a DNA bridge at plate separation h, which we model as a freely joined, semiflexible rod.
As time progresses, i dynamically changes as bridges form and break with their respective rate constants. To ensure that the simulation timesteps are short enough to model diffusion accurately, we introduce another rate constant, kD, where the plates diffuse with i unchanged. Events and nonuniform adaptive timesteps are generated using a kinetic Monte Carlo approach with the rates
| (3) |
where the total rate is k = (n − i) kon + ikoff + kD, which accounts for the fact that there are n − i unbridged s1 strands and i bridges at time t. The value of kon is h-dependent, reflecting the spatially varying concentration of reacting strands; its functional form is constrained by that of the pair interaction potential.
To model nonexponential dissociation kinetics, rather than using a constant koff in Eq. 3, the off-rates are drawn from a probability distribution, p(t), related to the lifetime distribution by a Laplace transform (21),
| (4) |
To simulate stretched exponential lifetimes, we numerically integrate this relation to estimate p(koff) for a user specified β and τ. Each simulated bridge is assigned an off-rate from this distribution upon formation.
Results and discussion
Typical time-varying separation data of the two microspheres in the low s1 density case are shown in Fig. 2 a, at 45°C. The spheres alternately spend as much as tens of seconds tightly bound together (separation <20 nm) or unbound diffusing the effective width of the optical trap (∼200 nm). Control experiments indicate that these binding events are due solely to DNA bridging: when any of the three strands are omitted, no binding events are observed. Even when all three strands are present, upon increasing the temperature to 47°C (above the estimated 16-bp duplex melting temperature), no binding events are observed (Fig. 2 b). Moreover, using a modified s3 strand shortened by one nucleotide, this binding/no-binding transition occurs at a temperature a few degrees lower, consistent with its lower computed melting temperature. To compute the lifetime of bound states, we segment separation trajectories using a simple thresholding method. Any thresholding approach is ambiguous for short lifetimes as it cannot distinguish genuine bound states from accidentals where the particles’ diffusing trajectory remained below threshold without a bridge being present. The separation distance has a lubrication-reduced diffusivity (20) sufficient to diffuse from contact to our threshold position in τD ≈ 20 ms. Accidentals become exponentially rare beyond several τD.
Figure 2.

Experimental data and simulations for the single DNA bridge case. (a) Time-dependent separation between the microspheres, h(t) for 1000 s at T = 45.0°C. Bridging by DNA leads to periods when the separation is constrained to a small value (examples circled), interrupted by intervals where the particles are free to diffuse apart in the trap (up to ∼150 nm apart). For clarity, only a few of the 200 measurements per second are shown. (b) Corresponding time-dependent separation at a temperature 2°C higher shows no DNA bridging events, consistent with the expected bridge melting temperature. (c) Double logarithmic probability distribution of bound state lifetime, with a stretched exponential form. Bars are 1 SD expected errors. Excess short times events are an artifact of our threshold algorithm. (d) Corresponding simulated distributions.
The distribution of bound lifetimes is shown in Fig. 2 b. Surprisingly, the lifetime distribution has a stretched exponential form, p(t) ∼ exp[−(t/τ0)β], with β = 0.45 ± 0.07 and τ0 ≈ 0.5 s. We were unable to fit the distribution to either a single- or double-exponential function. The β-value we find corresponds to those found in FCS studies (βhairpin = 0.44–0.54) (22), but the mean lifetime τ is three orders-of-magnitude longer. The long-time portion of the lifetime distribution was completely insensitive to the thresholding parameters or algorithm.
Our finding of a stretched exponential lifetime distribution places us at odds with all other nanomechanical measurements of DNA lifetime, using either nanopores (1,2) or optical tweezers (4,5). Before continuing to control studies that rule out various instrumental explanations for our anomalous result, we will briefly discuss DNA hybridization and the relevant literature.
Since activated processes over a single barrier have exponential kinetics, one explanation for nonexponential behavior would be if dissociation proceeded by multiple, competing pathways in configuration space. Given the myriad intermediate states that need to be traversed during dissociation, this does not seem out of the question. Duplex dissociation proceeds, however, by unzipping the two single-stranded backbones one basepair at a time against a free energy barrier (14). Such a one-dimensional sequence of intermediates, in general, still has exponential kinetics. Complicating matters somewhat are the DNA's random sequence, and the fact that unzipping can be nucleated from either of the duplex's free ends or an interior bubble. Moreover, the dangling single-strands of a partially unzipped intermediate can hybridize each other to reform a second duplex segment, increasing the total rezippering rate constant. Recent experiments provide some insight. Woodside and co-workers (5) studied single duplexes similar to ours under picoNewton tensions in an optical tweezer. In their case, the applied tension lowers the free energy barrier for one dissociation pathway, favoring unzippering that starts at one end and proceeds to the other (23). Similarly, nanopore experiments apply a voltage-induced force to one branch of a dissociating duplex (1–3) that promotes a one-dimensional unzippering pathway. While dissociation is completed before pore translocation in one experiment (1), the applied voltage was still found to measurably affect the dissociation rate. Thus, it seems plausible, in all these cases, that dissociation is forced to be one-dimensional and secondary rehybridization of dangling ends prevented by applied force, steric barriers, or both. We hypothesize that multiple unzippering pathways or the nucleation of secondary duplex segments may explain the nonexponential behavior both in the FCS experiments and in ours. Such explanations cannot explain all of the FCS results, however; a recent experiment has shown nonexponential behavior in DNA hairpins containing only a single complementary basepair (10).
To better understand the relation between DNA kinetics and the observed microsphere binding lifetimes, particularly for states with multiple bridges, we use a one-dimensional Brownian dynamics simulation. The microsphere surfaces were modeled as two flat plates with a lubrication-reduced relative diffusivity. Due to the spatially varying distribution of reacting strands, the bridge formation rate is separation-dependent and computed using a generalized mass action principle (11). The bridge dissociation rate is either a constant or a user-specified distribution function to simulate nonexponential kinetics. The plates diffuse freely when unbridged, otherwise they are also subject to a bridge-induced entropic tension. In the single-molecule bridge limit (〈n〉 = 0.1), the simulation confirms one's intuition that the observed microsphere bound-state lifetime distribution is identical to that of the bridging DNA duplexes (Fig. 2 c). This is a consequence of the system being reaction-limited (τD ≪ τ0). This result confirms that our observed kinetics are not an artifact associated with slow microsphere diffusion. While assuming a single rate constant for dissociation produces an exponential lifetime distribution of bound states, with the correct distribution of rate constants (see Materials and Methods), the simulation can trivially reproduce the experimental lifetime distribution (Fig. 2 c).
One potential explanation for nonexponential DNA kinetics could be unusual (e.g., adsorbed or sterically hindered) surface conformations of the reacting strands or bridges. Following an approach similar to our earlier work (11), we model the probability distribution of microsphere separations to confirm the expected DNA conformations. Since hybridization is slow compared to microsphere diffusion, we model the bound and unbound states separately,
| (5) |
where Pb and Pf are the probability distributions of the bound and free states, respectively, h is the separation, and α is the fraction of time bound. The spheres can be modeled as flat plates, having an entropic repulsion induced by “mushroom” s2 coils (24,25), bound together by a rigid rod bridge of length L = 15 nm having flexible links to the plates. Fig. 3 a shows the pair interaction potential, computed using the Boltzmann relation, ΔF(h) = − kBTln[P(h)]. After numerically blurring the model P(h) with a Gaussian kernel to simulate our instrumental resolution of 5 nm, the model provides an excellent fit taking α as the single free parameter.
Figure 3.

Microsphere interaction and bridge lengths conform to polymer theory models. (a) Spheres’ pair interaction energy at two temperatures, containing a temperature-dependent attraction due to bridging. Model curves (11) fit well with parameter α = 0 (top) and α = 0.1 (bottom). (b) Standard deviation σ of the microspheres separation for each bound state as a function of its lifetime. The distribution is consistent with a single mean value and statistical error, confirming that all DNA bridges assume essentially identical conformations.
As a check for heterogeneity among bridged states, we compute the standard deviation of Pb(h) for individual bound states, and plot them versus lifetime (Fig. 3 b). There is no detectable heterogeneity among single duplex bridges, nor any correlation between lifetime and bridge length, as might be the case if a subset of bridges had atypical conformations. Our model predicts a standard deviation of Pb of ≈ 2.5 nm, corresponding to 5.6 nm when our instrumental blurring is taken into account, consistent with the measured mean value of 5.4 nm. While the measured standard deviations are clearly dominated by our resolution, bridges with standard deviation ±1 nm from the mean would be detectable.
Many cases of biological binding or adhesion (26) are mediated by multiple bridges. The short tethers and low force used in our approach allow us to study such multivalent binding under remarkably controlled conditions. We increased the number of s1 strands by fivefold, while keeping the temperature and all other parameters constant. For 〈n〉 = 0.5, Poisson statistics suggest that roughly a third of the time a bridge is formed, it will be possible to form a second bridge as well, compared to a 5% probability at the lower density. As the s1 density is still quite low, however, their conformations should not change, nor will they contribute a significant entropic repulsion. Naturally, the lifetime of multipally bridged states should be longer than for single-bridge states. Remarkably, the observed lifetime distribution in the 〈n〉 = 0.5 case (Fig. 4 a) closely resembles the single bridge case, almost as if multipally bridged states were not present, in contrast to the results of simulations (Fig. 4 b). The forward rate of bridge formation, however, did increase by a factor of 4 ± 1 between the experiments, confirming that significantly more s1 strands were present. Moreover, the variations in the forward rate among beads are consistent with a binomial distribution of N values, confirming that the s1 density is correctly estimated.
Figure 4.
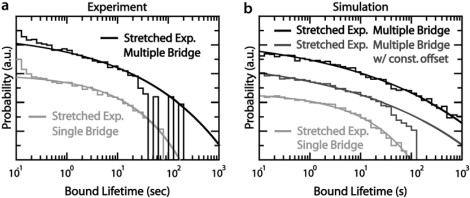
Experiments and simulations for the high s1 strand density, multiple-bridge case. (a) Double-logarithmic plot of the measured lifetime distribution for pairs of microspheres with 〈n〉 = 0.5 (top) s1 strands in the contact region; the 〈n〉 = 0.1 (bottom) is shown for comparison. Smooth curve corresponds to simulations without negative cooperativity, which predicts long-lived events that are not observed. (b) Simulated lifetime distributions for 〈n〉 = 0.5 (top) and 〈n〉 = 0.1 (bottom) without cooperativity. Simulating force-induced acceleration by incrementing dissociation by 0.5 s−1 suppresses long-lived states (middle). Smooth curves are best-fit stretched exponentials.
One explanation for the short lifetimes would be if an entropic penalty or stress associated with multipally bridged states accelerated dissociation. Because partially dissociated bridges are longer, the corresponding bridge and microsphere entropy is higher and the free energy lower. For a single bridge this entropic penalty is <1 kBT, corresponding to an entropic tension <0.25 pN. While the entropic penalty associated with multipally bridged states is harder to compute, if they were several kBT, then the corresponding forces would be in the pN range, comparable to literature experiments that show accelerated dissociation. We can crudely simulate this effect by artificially increasing the koff of bridges when the number of bridges is 2 or more. Indeed, even a modest acceleration, by 0.5–1 s−1 per bridge, enables the simulation to reproduce the data (Fig. 4 b).
In conclusion, we have measured the dissociation kinetics of single DNA duplexes at very low force, using a line optical tweezer approach (17). The duplex lifetime distribution follows a stretched exponential, which we hypothesize is due to the duplexes following multiple, highly force-sensitive pathways through a dissociation free energy landscape. Our approach appears well suited to the detailed study of multivalent binding at low forces, which is common in biological adhesion. Lastly, our findings indicate that mass-action based models for DNA-driven self-assembly (11) need to be reexamined; they may overestimate the binding strength in the many-bridge limit.
Acknowledgments
We thank P. Chaikin, D. Hammer, V. Manoharan, V. Milam, K. M. Van Citters, P. Nelson, and N. Seeman for useful and stimulating discussions.
This work was supported by the National Science Foundation-Materials Research Science and Engineering Center, the National Science Foundation-Division of Materials Research, and the National Science Foundation-Chemical and Transport Systems via the Nanoscale Interdisciplinary Research Team program.
Footnotes
Editor: Kathleen B. Hall.
References
- 1.Howorka S., Movileanu L., Braha O., Bayley H. Kinetics of duplex formation for individual DNA strands within a single protein nanopore. Proc. Natl. Acad. Sci. USA. 2001;98:12996–13001. doi: 10.1073/pnas.231434698. [DOI] [PMC free article] [PubMed] [Google Scholar]
- 2.Sauer-Budge A.F., Nyamwanda J.A., Lubensky D.K., Branton D. Unzipping kinetics of double-stranded DNA in a nanopore. Phys. Rev. Lett. 2003;90:238101. doi: 10.1103/PhysRevLett.90.238101. [DOI] [PubMed] [Google Scholar]
- 3.Mathé J., Visram H., Viasnoff V., Rabin Y., Meller A. Nanopore unzipping of individual DNA hairpin molecules. Biophys. J. 2004;87:3205–3212. doi: 10.1529/biophysj.104.047274. [DOI] [PMC free article] [PubMed] [Google Scholar]
- 4.Liphardt J., Onoa B., Smith S.B., Jr I.T., Bustamante C. Reversible unfolding of single RNA molecules by mechanical force. Science. 2001;292:733–737. doi: 10.1126/science.1058498. [DOI] [PubMed] [Google Scholar]
- 5.Woodside M.T., Behnke-Parks W.M., Larizadeh K., Travers K., Hershlag D., Block S.M. Nanomechanical measurements of the sequence-dependent folding landscapes of single nucleic acid hairpins. Proc. Natl. Acad. Sci. USA. 2006;103:6190–6195. doi: 10.1073/pnas.0511048103. [DOI] [PMC free article] [PubMed] [Google Scholar]
- 6.Bonnet G., Krichevsky O., Libchaber A. Kinetics of conformational fluctuations in DNA hairpin-loops. Proc. Natl. Acad. Sci. USA. 1998;95:8602–8606. doi: 10.1073/pnas.95.15.8602. [DOI] [PMC free article] [PubMed] [Google Scholar]
- 7.Wallace M.I., Ying L., Balasubramanian S., Klenerman D. Non-Arrhenius kinetics for the loop closure of a DNA hairpin. Proc. Natl. Acad. Sci. USA. 2001;98:5584–5589. doi: 10.1073/pnas.101523498. [DOI] [PMC free article] [PubMed] [Google Scholar]
- 8.Jung J., Orden A.V. Folding and unfolding kinetics of DNA hairpins in flowing solution by multiparameter fluorescence correlation spectroscopy. J. Phys. Chem. B. 2005;109:3648–3657. doi: 10.1021/jp0453515. [DOI] [PubMed] [Google Scholar]
- 9.Ansari A., Kuznetsov S.V., Shen Y. Configurational diffusion down a folding funnel described the dynamics of DNA hairpins. Proc. Natl. Acad. Sci. USA. 2001;98:7771–7776. doi: 10.1073/pnas.131477798. [DOI] [PMC free article] [PubMed] [Google Scholar]
- 10.Kim J., Doose S., Neuweiler H., Sauer M. The initial step of DNA hairpin folding: a kinetic analysis using fluorescence correlation spectroscopy. Nucleic Acids Res. 2006;34:2516–2527. doi: 10.1093/nar/gkl221. [DOI] [PMC free article] [PubMed] [Google Scholar]
- 11.Biancaniello P.L., Kim A.J., Crocker J.C. Colloidal interactions and self-assembly using DNA hybridization. Phys. Rev. Lett. 2005;94:058302. doi: 10.1103/PhysRevLett.94.058302. [DOI] [PubMed] [Google Scholar]
- 12.Kim A.J., Manoharan V.N., Crocker J.C. Swelling-based method for preparing stable, functionalized polymer colloids. J. Am. Chem. Soc. 2005;127:1592–1593. doi: 10.1021/ja0450051. [DOI] [PubMed] [Google Scholar]
- 13.Kim A.J., Biancaniello P.L., Crocker J.C. Engineering DNA-mediated colloidal crystallization. Langmuir. 2006;22:1991–2001. doi: 10.1021/la0528955. [DOI] [PubMed] [Google Scholar]
- 14.Hammes G.G. Wiley-Interscience; New York: 2000. Thermodynamics and Kinetics for the Biological Sciences. [Google Scholar]
- 15.Allen M.P., Tildesley D.J. 1st Ed. Oxford University Press; New York: 1987. Computer Simulation of Liquids. [Google Scholar]
- 16.Ermak D. A computer simulation of charged particles in solution. I. Technique and equilibrium properties. J. Chem. Phys. 1975;62:4189–4196. [Google Scholar]
- 17.Biancaniello P.A., Crocker J.C. Line optical tweezers instrument for measuring nanoscale interactions and kinetics. Rev. Sci. Instrum. 2006;77:113702. [Google Scholar]
- 18.Crocker J.C., Grier D.G. Methods of digital video microscopy for colloidal studies. J. Colloid Interface Sci. 1996;179:298–310. [Google Scholar]
- 19.Verma R., Crocker J.C., Lubensky T.C., Yodh A.G. Attractions between hard colloidal spheres in semiflexible polymer solutions. Macromolecules. 2000;33:177–186. [Google Scholar]
- 20.Van De Ven T.G.M. 1st Ed. Academic Press; London: 1989. Colloidal Hydrodynamics. [Google Scholar]
- 21.Ying L., Wallace M.I., Klenerman D. Two-state model of conformational fluctuation in a DNA hairpin-loop. Chem. Phys. Lett. 2000;334:145–150. [Google Scholar]
- 22.Wallace M.I., Ying L., Balasubramanian S., Klenerman D. FRET fluctuation spectroscopy: exploring the conformational dynamics of a DNA hairpin loop. J. Phys. Chem. B. 2000;104:11551–11555. [Google Scholar]
- 23.Lubensky D.K., Nelson D.R. Single molecule statistics and the polynucleotide unzipping transition. Phys. Rev. E. 2002;65:031917. doi: 10.1103/PhysRevE.65.031917. [DOI] [PubMed] [Google Scholar]
- 24.Dolan A.K., Edwards S.F. Theory of the stabilization of colloids by adsorbed polymer. Proc. R. Soc. Lond. A. 1974;337:509–516. [Google Scholar]
- 25.Murphy M.C., Rasnik I., Cheng W., Lohman T.M., Ha T. Probing single-stranded DNA conformational flexibility using fluorescence spectroscopy. Biophys. J. 2004;86:2530–2537. doi: 10.1016/S0006-3495(04)74308-8. [DOI] [PMC free article] [PubMed] [Google Scholar]
- 26.Leckband D., Israelachvili J.N. Intermolecular forces in biology. Q. Rev. Biophys. 2001;34:105–267. doi: 10.1017/s0033583501003687. [DOI] [PubMed] [Google Scholar]