

Abstract
Reentry is a mechanism underlying numerous cardiac arrhythmias. During reentry, head-tail interactions of the action potential can cause cycle length (CL) oscillations and affect the stability of reentry. We developed a method based on a difference-delay equation to determine the slopes of the action potential duration and conduction velocity restitution functions, known to be major determinants of reentrant arrhythmogenesis, from the spatial period P and the decay length D of damped CL oscillations. Using this approach, we analyzed CL oscillations after the induction of reentry and the resetting of reentry with electrical stimuli in rings of cultured neonatal rat ventricular myocytes grown on microelectrode arrays and in corresponding simulations with the Luo-Rudy model. In the experiments, P was larger and D was smaller after resetting impulses compared to the induction of reentry, indicating that reentry became more stable. Both restitution slopes were smaller. Consistent with the experimental findings, resetting of simulated reentry caused oscillations with gradually increasing P, decreasing D, and decreasing restitution slopes. However, these parameters remained constant when ion concentrations were clamped, revealing that intracellular ion accumulation stabilizes reentry. Thus, the analysis of CL oscillations during reentry opens new perspectives to gain quantitative insight into action potential restitution.
Introduction
Reentry underlies numerous types of clinically important tachyarrhythmias, which are frequent complications of heart disease and important causes of morbidity and mortality (1). During reentry, dynamic interactions can occur between the head of the action potential (AP) and its tail of relative refractoriness. These head-tail interactions are critical determinants of the stability of reentrant excitation (2). Invasion of the relative refractory tail by the head of the reentrant AP results in conduction slowing; subsequently, the wavefront recedes into more excitable tissue and the wavefront accelerates again, reinvading the tail. These variations of conduction velocity (CV) lead to oscillations of cycle length (1,2), defined as the period between two successive passages of the wavefront (2,3).
Head-tail interactions and the resulting oscillations of conduction are essentially determined by the characteristics of AP restitution. Important restitution parameters are the slope of the S1-S2 action potential duration (APD) restitution function (hereafter termed α) and the slope of the S1-S2 CV restitution function (hereafter termed γ) at the point corresponding to the steady-state value of the cycle length of reentry. While the slope α describes the variation of APD in response to a variation in the preceding diastolic interval (DI), the slope γ describes the corresponding change of CV. It has been proposed that reentry in a cardiac circuit is stable for α < 1, critical for α = 1, and unstable for α > 1 (4) and studies of reentry in two- and three-dimensional tissue have led to the consensus that both α and γ govern the stability of spiral waves and the transition between tachycardia and fibrillation (5–10). Therefore, α and γ are parameters of clinical importance, since they are directly influenced by pharmacological agents acting on membrane currents. For example, class III antiarrhythmic drugs, known to act on APD restitution, can increase α without altering CV restitution if pacing rate is left unchanged. However, in the context of reentry, drug-induced APD prolongation may shorten the DI, which can result in slower conduction, a prolonged cycle length and, in turn, in an increase of γ. Conversely, class Ic drugs, slowing conduction and modifying γ, may also affect α via an increase of cycle length during reentry.
The seminal studies of Frame et al. on canine tricuspid rings (3,11) demonstrated that oscillations of cycle length are characteristic of unstable reentry and often precede its spontaneous termination. Extensive investigations using mathematical models predicted that head-tail interactions occur at positions that vary dynamically in the circuit (2,4,12–15). Therefore, they are not bound to a specific location and the spatial period of the resulting oscillations of conduction can be a noninteger multiple of circuit length. To date, however, the existence of oscillations exhibiting this spatial characteristic has not been documented experimentally and the possibility to extract information regarding α and γ from cycle length oscillations has scarcely been explored.
Using patterned rings of cultured cardiac cells in which reentry was induced by programmed stimulation and reset by single stimuli, we demonstrate in this study the existence of damped oscillations of cycle length having, as predicted by theory, a spatial period which is a noninteger multiple of circuit length. We then pursued the goal to establish a mathematical link between the spatial period and the decay length of these damped oscillations and the restitution parameters α and γ. This method to quantify the restitution slopes was validated using computer simulations and applied to our experimental data. Finally, the simulations revealed that intracellular ion accumulation during reentry results in faster dissipating oscillations and thus in stabilization of reentry.
Materials and methods
Patterned cultures on microelectrode arrays
Patterned cultures of ventricular myocytes from 1–2 days old Wistar rats were prepared as described previously (16,17) and grown on microelectrode arrays (Sensors, Actuators and Microsystems Laboratory, University of Neuchâtel, Switzerland), which were mounted in custom-fabricated culture chambers (volume: 1 ml) (18). The animals were handled in accordance with the ethical principles and guidelines of the Swiss Academy of Medical Sciences. The cardiomyocytes were seeded at a density of 1650 cells/mm2.
As shown in Fig. 1 A, the growth pattern consisted of a ring (inner diameter, 0.99 cm; outer diameter, 1.11 cm; middle diameter, 1.05 cm; length, L, 3.3 cm) centered over a circular array of 16 equally spaced recording electrodes (diameter 40 μm, indium-tin oxide, silicium nitride passivation layer) and four stimulation dipoles (diameter 540 μm, coated with platinum).
Figure 1.

Induction and resetting of reentry in a patterned cardiomyocyte ring. (A) Photographs of a microelectrode array (left) and of a patterned ring (right). (B) Schematic of the ring, covering 16 recording electrodes (dots) and four stimulation dipoles. S1 and S2 indicate the dipoles used to induce reentry. (C) Electrograms illustrating the induction of reentry. Stimulus S2 was applied during the vulnerable window of the S1-induced AP and resulted in unidirectional conduction, generating reentry. (D) Resetting of reentry by a stimulus (S) applied during the excitable gap with the stimulation dipole S2.
Experiments were performed on 3–5 days’ old cultures. The preparations were first inspected under phase contrast microscopy to verify their structural integrity. Only intact preparations were used. To ensure an identical extracellular environment for all preparations during the experiments, the growth medium was replaced with Hanks’ balanced salts solution. The culture chambers, incorporating a connection interface, were then mounted into a custom amplifier array (gain: 1000×) and placed back into the incubator. A period ≥60 min was allowed for the equilibration of temperature (36.0 ± 0.1°C).
The preparations were stimulated with biphasic voltage pulses (18). Extracellular unipolar electrograms from the 16 recording electrodes were sampled at 10 kHz. Activation times were defined at the occurrence of the minimum of their first derivative (18,19).
Induction and resetting of reentry
As shown in Fig. 1 B, reentry was induced by programmed stimulation at two sites (S1, S2) separated by 90°. Stimulation at S1 at a critically short basic cycle length (BCL, 120–300 ms) still resulting in 1:1 capture of the stimulus (18) induced APs that propagated in both directions and collided at the opposite side of the ring (Fig. 1 C). When the S2 stimulus was applied during the vulnerable window (12) after the S1 response, it resulted in unidirectional conduction (Fig. 1 C). For every preparation, the vulnerable window was searched by trial and error using different S1-S2 intervals.
During reentry, cycle length (CL) was defined for each recording location as the interval between the current and the previous passage of the wavefront (2,3). When sustained reentry was established, it persisted for long periods of time (up to 28 h) at a stable cycle length (CLstable), with cycle-to-cycle variations that lay within the experimental error of CL determination (±0.2 ms). The average conduction velocity (CV) was determined as L/CLstable. Because our study focused on the dynamics of head-tail interactions in circuits that were not only structurally but also functionally uniform, we assessed the degree of conduction uniformity by calculating the coefficient of CV variation along the ring. Local conduction velocities were calculated for every segment between the 16 equally spaced recording electrodes as (L/16)/Δt, where Δt is conduction time along the segment, and the coefficient of CV variation was calculated as the ratio of the standard deviation of local CVs to the average CV. Only preparations with a coefficient of CV variation ≤15% were considered in this study.
During stable reentry, single stimuli were applied to shift (reset) the phase of the reentrant AP (Fig. 1 D). These pulses were not synchronized with the reentrant AP and therefore fell randomly within the reentrant cycle. Resetting was therefore successful only if the stimulus was strong enough and fell within the excitable gap of the reentrant wave. For each preparation, 10–20 resetting attempts were conducted. If resetting failed, the intensity of the stimulus was increased by a factor 1.5–2 and the attempts were repeated. Stimulus intensity was however not increased beyond 2.5 V, because we observed that stimulation using voltages above this value often damage the preparations (possibly by electroporation).
Computer simulations of reentry
Simulations of reentry in rings of 200–700 cells were conducted using both the Luo-Rudy phase-1 model of the ventricular myocyte (20) and the Luo-Rudy phase-2 (dynamic) model (21) incorporating the modifications published by Faber and Rudy (22).
The phase-1 model was used to investigate oscillations of CL as a function of the maximal conductances gNa and gK of the voltage-gated Na+ and K+ currents (INa and IK, respectively) and as a function of the time constant of the slow inactivation gate j of INa. Consistent with the approach of Qu et al. (5), the maximal conductance gsi of the slow inward current was reduced from 0.09 to 0.04 mS/cm2 to obtain APDs in the range of 100 ms as previously observed in the experimental preparations (16).
The phase-2 model, incorporating a more elaborate description of transmembrane currents and dynamic changes of [Na+]i, [K+]i, and [Ca2+]i, was used to examine the consequences of Na+ and Ca2+ accumulation during rapid activity on the dynamics of reentry.
The cells (length, 100 μm) were coupled with a lumped intracellular and gap-junctional intercellular conductance of 1.267 μS (23). Initial conditions were obtained from a stable resting cell. In the phase-2 model, initial ion concentrations were: [Na+]i = 11.08 mmol/L; [K+]i = 131.03 mmol/L; and [Ca2+]i = 0.080 μmol/L. Gating variables were set to their steady-state value at the resting membrane potential (Vm = –87.55 mV). Reentry was induced as in the experiments by pacing the ring at one point (S1) with a train of 19–40 pulses (200 μA/μF for 1 ms) at a critically short BCL (80–140 ms) that still resulted in 1:1 capture, followed by a S2 stimulus applied during the vulnerable window one-quarter-ring length away from S1.
Vm, ion concentrations, and gating variables were integrated using a time step of 0.005 ms with the Euler method. Activation times were defined by the occurrence of dVm/dtmax and APD was measured between dVm/dtmax and repolarization to −75 mV (∼95%).
Determination of CL oscillation parameters during reentry
In the experiments, series of CLs were constructed as a function of the cumulated distance (x) traveled by the wavefront normalized by circuit length L (y = x/L). Thus, y (number of rotations) and y+1 correspond to the same position in the ring.
In the cultured rings, the initiation of reentry was accompanied by an abrupt long-term shortening of CL (from the BCL of pacing before reentry induction to the CL of reentry itself). As we described in a previous article (18), an abrupt shortening of CL results in gradual multiphasic changes of conduction velocity in our biological preparations. Typically, at very short CLs, a gradual conduction slowing is observed over timescales of several seconds, followed by a gradual acceleration. For this reason, immediately after induction, the baseline CL of reentry exhibited a long-range trend on which the oscillations of interest were superimposed. For the induction experiments, this slow trend was therefore subtracted using a second-degree polynomial function to better capture the oscillatory CL dynamics. In the resetting experiments, this trend was absent because CLstable was the same before and after resetting, without long-term changes of CL and CV. The detrending procedure was therefore not necessary.
The series CL(y) were then fitted with the following damped sine function using the Levenberg-Marquardt gradient-expansion iterative least-squares algorithm (24),
where P is the spatial period of the oscillations, D is their decay length (the normalized distance after which their amplitude decays e-fold), A is the amplitude of the oscillations at y = 0, and φ is the phase. While A and φ depend on the arbitrary choice of the origin y = 0, P and D are characteristic of the damped oscillations. P and D are unitless parameters corresponding to multiples of L.
In the simulations, CL(y) was established at increments of y determined by the size of a cell. P was determined from the first three peaks (P1, P2, and P3) of the autocorrelation function of CL(y) as P = (P1+P2+P3)/6 and D was determined from the linear regression slope s of CL(y+P) versus CL(y) as D = −P/ln(s).
Estimation of restitution slopes from P and D
Using a difference-delay model of reentry, Courtemanche, Keener, and Glass (14) showed that the slope α of the APD restitution function, the slope γ of the CV restitution function, and the oscillation parameters P and D are linked by
where Q is a complex number defined as Q = a + bi = −1/D + 2πi/P.
We found that if Q is known (b = 2π/P and a = –1/D), this equation can be solved for α and γ:
Our derivation of the Courtemanche-Keener-Glass equation and its solution for α and γ are presented in detail in the Appendix. This equation was used to estimate α and γ from P and D. While α is unitless, γ has units of acceleration. Because CV is expressed in cm/s and time in ms, values of γ are given in cm/s/ms. The term can be considered as a normalized (unitless) CV restitution slope. From its value, γ can be calculated by multiplication by
Statistics
Values are given as mean ± SD. The value n represents the number of distinct preparations used. Data were compared using the Student's t-test and p < 0.05 was considered significant.
Results
Cycle length oscillations in cultured myocyte rings
To evaluate the stability of reentry in the cultured myocyte rings, we examined the transient variations of CL after the induction of reentry and after resetting of reentry by a single stimulus. Unidirectional conduction of the S2 response was obtained in 24 out of a total of 26 preparations (width of the vulnerable window: 0.2–1 ms) and resulted in sustained reentry in 21 cases. In the remaining three experiments, the unidirectional wavefront was blocked after 1–5 rotations. In four preparations, spontaneous reentry was already present at the onset of the experiment.
Fig. 2 A illustrates CL and CV in one experiment after the induction of sustained reentry. CL and CV exhibited transient spatial oscillations that dissipated after ∼20 rotations (corresponding to a duration of 2.6 s). CL thereafter stabilized to a value of 129 ms and the pattern of reentry remained identical from cycle to cycle with an average CV of 25.6 cm/s. The consecutive maxima and minima of CL and CV (vertical dotted lines in Fig. 2 A) occurred at different positions in the circuit (data points of different colors), demonstrating that CL and CV variations were not linked to a localized disturbance of conduction: in this case, the extrema of CV would have recurred at the same location in the circuit, and led to alternation of CL from turn to turn. Variations in CL would then have recurred exactly every second turn. Thus, oscillations of CL and CV were generated by dynamic head-tail interactions of the reentrant AP.
Figure 2.

Damped oscillations of CL and CV of reentrant APs immediately after induction (A) and after resetting (B). Data point colors correspond to the schematic (insets). The oscillations were fitted with a damped sine function (shaded curve) to determine their spatial period P and decay length D (P = 1.58 and D = 6.55 in A; P = 1.67 and D = 0.98 in B, respectively). (C) In this example, upon the induction of reentry, CL exhibited a slow decreasing trend (left, dotted curve). The oscillatory dynamics of CL were therefore analyzed in the detrended CL series (right).
The transient CL oscillations were fitted with a damped sine function to determine their spatial period P and their decay length D. For the data of Fig. 2 A, P = 1.58 and D = 6.44. The fact that P is a noninteger number further indicates that oscillations of CL were caused by head-tail interactions at positions varying dynamically from turn to turn. Similar damped oscillations were observed in all preparations in which sustained reentry was induced (P = 1.59 ± 0.12 and D = 5.19 ± 3.60, n = 21).
Fig. 2 B illustrates CL and CV after the resetting of reentrant excitation with a single stimulus, 22 min after the establishment of reentry at a constant CL. The impulse fell within the excitable gap and reset the position of the wavefront within the circuit (see also Fig. 1 D). This perturbation resulted in transient oscillations of CL and CV qualitatively similar to those observed after the induction of reentry; however, the oscillations dissipated over a shorter distance (P = 1.67 and D = 0.98).
In most induction experiments (19 out of 21), CL exhibited a long-range trend on which the oscillations of interest were superimposed. This slow trend of CL is in agreement with our previous finding that CV exhibits slow changes upon an abrupt shortening of CL (18). This trend was therefore subtracted to capture the oscillations of CL, as illustrated in Fig. 2 C for an induction experiment in which this long-range trend was prominent.
From the 21 different preparations in which sustained reentry was induced, successful resetting of the wavefront was possible in 15 experiments. In the remaining six cultures, resetting was either not possible or the stimulus fell into the vulnerable window at the tail of the reentrant AP and resulted in unidirectional conduction of a retrograde wavefront that collided with the reentrant AP and annihilated reentry. After a successful resetting impulse, CL oscillations were observed in 7 out of 15 preparations, permitting the determination of P and D (1.83 ± 0.17 and 0.92 ± 0.81, respectively). In the remaining eight experiments, despite the fact that the wavefront was successfully reset, CL oscillations were either absent or dissipated too rapidly (D < 0.25 rotations) to permit accurate quantification of P. Finally, resetting of the reentrant waves which were spontaneously present in four preparations at the beginning of the experiments resulted in oscillations characterized by P = 1.75 ± 0.15 and D = 1.33 ± 0.53. The noninteger values of P indicate that the oscillations after resetting were caused by dynamic head-tail interactions as well.
Comparison of oscillations characteristics at induction and after resetting
Fig. 3 A illustrates P and D in the P-D parameter space for all preparations. Solid symbols represent experiments in which reentry was induced by programmed stimulation. Open symbols represent experiments in which reentry was reset. Lines connecting data points correspond to the same preparation (induction and resetting, n = 7). The nonconnected solid squares represent the eight preparations in which wavefront resetting was not followed by identifiable CL oscillations. The nonconnected solid circles correspond to the six preparations in which reentry was induced electrically, but in which reentry either could not be reset or in which the resetting impulse stopped reentry. Finally, the nonconnected open squares correspond to resetting data in the four preparations in which reentry was spontaneously present at the beginning of the experiment.
Figure 3.

Comparison of P and D at induction of reentry and after resetting. (A) Values of P and D in the P-D parameter space, after induction (solid symbols) and after resetting (open symbols) of reentry (legend in the inset). Nonconnected solid squares represent preparations in which resetting was not followed by measurable CL oscillations. Solid circles correspond to preparations in which resetting attempts either failed or stopped reentry. Nonconnected open squares represent reentry resetting in preparations where spontaneous reentry was already present at the beginning of the experiment. (B) Compared to the induction of reentry, D was smaller after resetting (p < 0.05) and P was larger (p < 0.05).
There was no correlation between P and D, neither at induction nor after resetting. In addition, P and D were not correlated with CLstable (not shown). However, D was significantly lower after resetting compared to induction (Fig. 3 B; 1.07 ± 0.72, n = 11, vs. 5.19 ± 3.60, n = 26, p < 0.05), although there was no significant difference in CLstable between the two groups (129 ± 31 ms vs. 123 ± 9 ms). Moreover, P was significantly larger after resetting than after induction (1.80 ± 0.16 vs. 1.59 ± 0.12, p < 0.05). The decrease of D and increase of P was also observed for the seven individual preparations in which both induction and resetting produced CL oscillations (interconnecting lines in Fig. 3 A; D decreased from 4.52 ± 2.99 to 0.92 ± 0.81 and P increased from 1.58 ± 0.17 to 1.83 ± 0.17, n = 7, comparison using the paired Student's t-test: p < 0.05). The notion that D is smaller after resetting is further supported by the absence of measurable oscillations after resetting in the eight preparations in which clear oscillations were identified after induction.
The finding that D is smaller after resetting indicates that compared to induction, reentry stabilizes faster and over a shorter distance and therefore becomes more stable with time. Moreover, the change of both P and D indicates that CL oscillations were ruled by head-tail interactions with different characteristics at induction and after resetting.
CL oscillations in computer simulations: relationship among P, D, and restitution slopes
The slope α of the APD restitution function and the slope γ of the CV restitution function play an important role in determining head-tail interactions and the stability of reentry (2,13,14). To investigate the relationship between P, D, α, and γ and to evaluate the possibility to quantitatively predict α and γ from P and D (see Materials and Methods), simulations of reentry were run in a ring of 500 Luo-Rudy phase-1 model cells.
The induction of reentry is illustrated in Fig. 4 A. In this simulation, gNamax was 12 mS/cm2. CL exhibited damped oscillations with P = 1.842 and D = 2.85. APD and CV restitution curves were established by plotting the dynamically changing APD and CV of the propagating AP as a function of the preceding diastolic interval (DI). The slopes of these restitution curves (αdyn and γdyn) were then determined by linear regression (for the determination of γdyn, linear regression was restricted over a neighborhood ±5 ms around the steady-state DI value). The slopes α and γ predicted from P and D (α = 0.68, γ = 0.16 cm/s/ms, and ) were in a range of 10% of the values obtained directly from the restitution curves (αdyn = 0.73, γdyn = 0.18 cm/s/ms, and ).
Figure 4.

(A) Induction and (B) resetting of reentry in a ring of 500 Luo-Rudy phase 1 model cells (length: 5 cm) and evaluation of restitution slopes from restitution curves and from P and D. The dotted curves represent the exponential envelopes of the CL oscillations. The slopes αdyn, γdyn, and γdynCLstable/L were computed from the plotted restitution curves and compared with those calculated from P and D.
In Fig. 4 B, reentry was reset after it had stabilized. Interestingly, P and D of the resulting damped oscillations (1.841 and 2.59, respectively) were not manifestly different compared to induction. Accordingly, the measured restitution slopes (αdyn = 0.67, γdyn = 0.16, and ) and the slopes calculated from P and D (α = 0.65, γ = 0.16 cm/s/ms, and ) were similar to those after induction. CLstable was equal in both simulations (108.2 ms). To assess whether P and D depend on the prematurity of the resetting impulse relative to the wavefront, simulations were run in which the resetting stimulus was applied at different timings in the excitable gap (not shown). The amplitude of the oscillations was proportional to the prematurity of the resetting impulse (r > 0.99), whereas P and D were only minimally affected (by <0.3% for P and <3% for D, respectively).
As presented in Fig. 5, an investigation of stable AP parameters, P, D, and restitution slopes after induction and resetting was conducted as a function of the density of INa, of IK and of the kinetics of the slow INa inactivation gate j. To maximize head-tail interactions in this series of simulations, ring length was reduced to 200 cells, the time-dependent K+ current IK was scaled by a coefficient of 2, and the maximal INa conductance (gNamax) was reduced to 8 mS/cm2. This permitted to obtain oscillations with a broad range of P and D.
Figure 5.

Dependence of AP parameters, P, D, and restitution slopes on the density of IK (A), INa (B), and the kinetics of the inactivation gate j of INa (C), after induction (solid) and resetting (shaded) of reentry in a ring of 200 Luo-Rudy phase-1 model cells. Initial model parameters (marked by vertical dotted lines) were: gKmax coefficient, 2; gNamax, 8 mS/cm2; and τj divisor, 1. Solid lines indicate values obtained from the simulation. Dashed lines represent restitution slopes calculated from P and D. CL, APD, DI, and CV correspond to stable values after the damped oscillations had dissipated.
The reduction of the coefficient of gKmax from 2 to 1.4 (Fig. 5 A) resulted in a slight prolongation of APD accompanied by a slight shortening of DI. This small reduction of the DI was not sufficient to induce a significant slowing of conduction. Consequently, the decrease of CV and the increase of CL were minimal. However, the decrease of the DI was sufficient to increase α to values close to 1 and resulted in oscillations that lasted longer and longer, as evidenced by the dramatic increase of D. The modest increase of was accompanied by a small decrease of P. It was not possible to induce sustained reentry when the coefficient of gKmax was reduced further below 1.4, a situation in which the extrapolated value of α would become >1.
When INa was increased (Fig. 5 B), conduction was accelerated, leading to a shorter CL. However, the modulation of gNamax did not influence APD, and, consequently, DI decreased. Again, the shorter DI brought α close to 1, which caused oscillations with a larger D and a smaller P and, once more, it was not possible to induce sustained reentry when gNamax was increased above 12 mS/cm2.
A biphasic behavior was observed when the time constant τj of INa gate j was varied (Fig. 5 C). On the one hand, increasing the divisor of τj above 1 accelerated the recovery of INa from inactivation by shortening τj. Consequently, INa availability was increased, conduction was accelerated, and CL slightly decreased. Because this intervention did not affect APD, the decrease of CL was accompanied by a decrease of DI. This shortening of DI, however, did not sufficiently increase α so as to favor oscillations with a large D. Further acceleration of gate j had no major effect, because INa recovery was then governed by the fast inactivation gate h. On the other hand, decreasing the divisor of τj < 1 slowed INa recovery and promoted relative refractoriness, which led to conduction slowing and a prolongation of CL and DI. Accordingly, this was accompanied by a decrease of both restitution slopes and weaker head-tail interactions.
In all three series, there was a good correspondence between the slopes α and obtained from the restitution curves and estimated from P and D. The value α was estimated with a precision of 10% over a broad range of ion channel parameters and γ was slightly underestimated by maximally 20%. These data therefore show that in circuits of cardiac tissue, restitution slopes can be fairly estimated from CL oscillation characteristics. However, oscillation parameters and restitution slopes differed only minimally between induction and resetting of reentry. Similar results were obtained in rings of 300 and 500 cells (not shown).
CL oscillations in the Luo-Rudy phase-2 model: roles of intracellular Na+ and Ca2+ accumulation
The simulations using the phase-1 Luo-Rudy model (20), therefore, cannot explain the difference in P and D observed experimentally after induction and resetting of reentry. On the other hand, the phase-1 model does not take into account that intracellular ion concentrations are influenced by a change in pacing rate.
Using the phase-2 Luo-Rudy model (21), Faber and Rudy showed that intracellular accumulation of Na+ due to rapid activity leads to a progressive decrease of APD caused by a progressive increase of Na+/K+ pump current and reverse mode Na+/Ca2+ exchange current (22). In the context of reentry, APD shortening could increase the DI and shift the stable point on the restitution curves rightwards, toward less steep regions. The resulting smaller values of α and γ may then explain the larger values of P and smaller values of D observed experimentally.
To address this hypothesis, reentry was simulated using the model formulation of Faber and Rudy in circuits of 700 cells (Fig. 6). Reentry was induced by an S1-S2 protocol and reset after increasing time intervals (10–120 s). These simulations were run under three different conditions. First, the nominal model was used. Second, [Na+]i and [K+]i were clamped to their initial values. Third, [Na+]i and [K+]i were clamped to their initial values and myoplasmic [Ca2+] was clamped to 0.8 μmol/L (intermediate value of the Ca2+ transient).
Figure 6.

Effects of intracellular Na+ and Ca2+ accumulation on CL oscillations in a ring of 700 Luo-Rudy phase-2 model cells (length, 7 cm). (A) CL oscillations after induction and after resetting pulses applied at successive timings in the nominal model (top), during clamp of [Na+]i and [K+]i (middle), and during clamp of all ion concentrations (bottom). (B) Corresponding changes of [Na+]i, diastolic [Ca2+]i and stable values of CL, APD, and DI. (C) Corresponding changes in P and D. (D) Corresponding changes of restitution slopes.
In the nominal simulation, the extent of CL oscillations progressively decreased with time, as illustrated in Fig. 6 A. As expected, APD gradually decreased due to intracellular Na+ accumulation and DI decreased, while CL changed only minimally (Fig. 6 B). Consequently, P increased and D decreased (Fig. 6 C). These changes in P and D witnessed the progressively decreasing APD and CV restitution slopes (Fig. 6 D). Thus, head-tail interactions gradually diminished and reentry became more stable. When [Na+]i and [K+]i were clamped, D decreased and P increased during the first 10 s and remained unchanged thereafter. The slopes α and followed a similar course. Finally, when [Ca2+]i was clamped in addition to [Na+]i and [K+]i, no changes in oscillation parameters or restitution slopes were observed.
These ion clamp simulations thus support the concept that intracellular ion accumulation contributes to stabilize reentry via a gradual reduction of APD, leading to transient oscillations which dissipate faster in response to extrinsic electrical perturbations.
Estimation of α and γ during reentry in cultured rings
Using the functions evaluated above, APD and CV restitution slopes were calculated from the values of P and D obtained in the cultured rings. The calculated values are illustrated in Fig. 7 in a format similar to Fig. 3.
Figure 7.
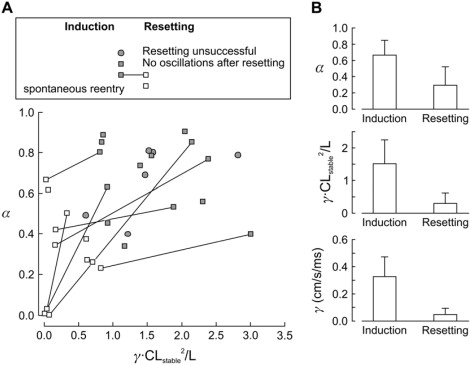
Comparison of restitution slopes calculated from P and D of CL oscillations recorded in the cultured cardiomyocyte rings after induction and resetting of reentry. (A) Values of α and γCLstable/L in the α−γCLstable/L parameter space, after induction (solid symbols) and resetting of reentry (open symbols), for the data shown in Fig. 3 (same data and same symbols). (B) Compared to the induction of reentry, α, γCLstable/L, and γ were all smaller after resetting (p < 0.05).
For the experiments in which P and D could be determined, the corresponding values of α were significantly lower after resetting compared to induction (0.29 ± 0.23, n = 11, vs. 0.67 ± 0.18, n = 21, p < 0.05). The values of and γ were significantly lower as well (: 0.30 ± 0.32 vs. 1.52 ± 0.73, p < 0.05; γ: 0.05 ± 0.05 vs. 0.33 ± 0.15 cm/s/ms, p < 0.05), as illustrated in Fig. 7 B. The decrease of both restitution slopes was also observed for individual preparations in which both induction and resetting were successful (interconnecting lines in Fig. 7 A; D decreased from 4.52 ± 2.99 to 0.92 ± 0.81 and P increased from 1.58 ± 0.17 to 1.83 ± 0.17, n = 7, comparison using the paired Student's t-test: p < 0.05). The absence of measurable oscillations after resetting in preparations in which clear oscillations were identified after induction suggests that restitution slopes decreased close to 0 (see Appendix). This analysis therefore suggests that reentry evolved into a regime characterized by a reduction of both restitution slopes and weaker head-tail interactions, for which intracellular Na+ accumulation might represent a potential mechanism.
Discussion
In the heart, the transition from a normal rhythm to reentrant excitation represents a profound change in electrical dynamics, which can compromise the pump function of the organ. In a clinical setting, it is therefore important not only to prevent the initiation of reentry but also to develop strategies to terminate it once a reentrant rhythm has established. One approach is to render it as less stable as possible to favor its spontaneous termination. In this context, the analysis of CL oscillations may provide quantitative insights into the notion of stability.
On the basis of this background, we investigated CL oscillations during reentry using a threefold approach that unified experiments, computer simulations, and mathematics. First, our experiments demonstrate the existence of damped CL oscillations with a spatial period being a noninteger multiple of circuit length. These oscillations dissipate faster upon the initiation compared to resetting of reentry. Second, the simulations of conduction using the Luo-Rudy phase-2 model provide a mechanistic explanation for this different oscillatory behavior by showing that the changes of P and D are related to intracellular Na+ accumulation, which reduces head-tail interactions by decreasing APD and increasing DI (22). Both experiments and simulations are thus in agreement with the prediction of Hund and Rudy (2) that intracellular Na+ accumulation shifts the operating point on the restitution curves toward less steep regions. Our results are also in line with the concept of Fei et al. that damped CL oscillations are particularly prominent in the presence of a partial excitable gap and disappear when the gap is fully excitable (11). Finally, we developed a mathematical approach to derive the slopes of the APD and CV restitution curves from the characteristics of CL oscillations.
Intracellular ion homeostasis determines the stability of reentry
Numerous studies have shown that reentry persisting for hours or days alters the electrophysiological properties of cardiac tissue in a manner that favors ease of inducing and maintaining its own arrhythmia. For example, in a canine model of chronic atrial fibrillation, such electrical remodeling was reported to reduce the densities of inward currents by changing the expression of the genes coding for the corresponding channels (25–27).
Still, little is known about the impact of rate-dependent changes of intracellular ion concentrations on the stability of reentry over a short time course. Our simulations indicate that intracellular ion homeostasis is another very important determinant of reentry stability and that deviations from this homeostasis can already exert a significant effect over the course of a few minutes. By promoting the stability of reentry, intracellular ion accumulation will therefore certainly influence the therapeutic efforts to interrupt this abnormal rhythm in vivo.
It cannot be excluded, however, that further mechanisms may have contributed to the behavior observed in our experiments in addition to ion accumulation. For example, a recent study showed that in rat atrial tissue, the expression of Kv1.5 is significantly increased already after a period as short as 30 min of rapid pacing (28). A possible associated increase in repolarizing ultrarapid delayed rectifier K+ current could therefore also have contributed to the observed changes in oscillatory behavior via a shortening of APD.
The slopes of the APD and CV restitution curves can be derived from CL oscillation characteristics
It is widely documented that the slope of the APD restitution function can predict the stability of electrical activation by determining how a disturbance of the DI (e.g., by premature activation) can affect the APD of the next activation, which subsequently alters the next DI and so on (6,7,29,30). The proposed mechanism is that a slope α ≥ 1 can lead to APD alternans and propagation block. Conversely, for slopes α < 1, disturbances in APD dissipate. Consistent with this opinion, drugs that decrease α have been shown to exhibit antiarrhythmic properties (7,31). In further studies, it has been proposed that both APD and CV restitution slopes are essential determinants of the stability of reentry and of the transition between tachycardia and fibrillation (5–10). Therefore, investigation of the restitution relationships represents a relevant approach in the context, e.g., of drug development (6,30,32).
Our approach offers the possibility to estimate the slopes of the restitution curves based on CL oscillations during reentry. Thus, we provide a general and simple method to characterize the stability of reentry in both experimental and numerical models of circus movement in homogeneous one-dimensional circuits. The theory underlying our approach assumes that the slopes of the S1-S2 restitution curves remain constant at the operating point on the curves corresponding to CLstable. In a previous study using the same biological preparations (18), we showed that upon an abrupt decrease of CL, CV approaches its new steady state very gradually over a period of 5–30 s. This suggests that restitution parameters (including the S1-S2 restitution curves) exhibit a slow drift after an abrupt change in CL. We therefore cannot exclude that transient changes of restitution parameters might have occurred after the induction of reentry in our experiments. Thus, the calculated slopes α and γ represent an average over the duration of the transient oscillations. We nevertheless presume that the drift of the S1-S2 restitution curves and the changes of α and γ were not major because CL oscillations usually dissipated after a very short period (in the range of 1–2 s).
Kalb et al. (33) and Tolkacheva et al. (34) have shown that every basic cycle length (BCL) is associated with its own S1-S2 APD restitution curve and thus with its own α. In our previous study (18), we established the S1-S2 restitution curve for BCL = 500 ms and observed that the slope of the APD restitution curve was negative (−0.02) at this value of BCL. In this study, BCL before and after reentry induction were much shorter than 500 ms, and, for this reason, the calculated positive values of α cannot be directly compared with the negative value established for BCL = 500 ms. Our results are nevertheless in accordance with the progression from slightly negative S1-S2 APD restitution slopes at large BCLs toward large positive slopes at short BCLs which was described earlier by Tolkacheva et al. (34).
The situation becomes undeniably more complex in intact cardiac tissue, because conduction occurs within a two- or three-dimensional substrate, which is not absolutely homogeneous in terms of microarchitecture (anisotropy and degree of intercellular coupling (35–38)), electrical function (e.g., heterogeneous expression of ion channels (39,40)), and in which wavefront curvature may exert additional influences (41). Furthermore, APD and CV may be more intricate functions of several preceding diastolic intervals (i.e., cardiac memory (42–44)). Finally, APD can be locally modulated by electrotonic interactions (44,45). These latter aspects may represent an explanation for the slight underestimation of the CV restitution slope by the mathematical function that we derived. While this complexity undeniably warrants further investigation, our study represents an exploratory step toward new approaches for the evaluation of reentry, with perspectives for both research and clinical applications.
Comparison with other experimental studies
In previous studies, Nagai et al. (46) and González et al. (47) investigated spatiotemporal patterns of spontaneous activity in cultured rings of embryonic chick heart cells. In one-third of the preparations, this activity was generated by pacemakers producing bidirectionally propagated wavefronts that collided at the opposite side of the ring. In the second-third of the preparations, the activity was characterized by a stable reentrant wavefront that persisted for periods ranging from 5 min to 1 h. Finally, in the last third, spontaneous activity was characterized by complex patterns in which periods of multiple pacemaker activity alternated with short periods of reentry. In these cases, reentry was initiated by the classical mechanism of unidirectional conduction block, presumably due to the differences in refractoriness of different pacemakers (46). In these preparations, the episodes of reentry stopped spontaneously.
During our experiments, however, we did not record any spontaneous initiation of reentrant waves after the culture medium was changed to Hank's balanced salts solution and the amplifier setup was mounted in the incubator. Pacemaker activity was either absent or scarce (0–1 Hz) and, if present, it could easily be overdriven by pacing. Furthermore, once sustained reentry was established using the S1-S2 protocol, it persisted for hours if left without any intervention.
These different patterns of spontaneous activity may be explained by the following two factors. First, the myocytes were fundamentally different in terms of species and ontogeny, and, presumably, depolarizing currents during the AP upstroke were stronger in our preparations. Second, in our study, the myocytes were seeded at a much larger density, promoting a high degree of intercellular communication. These two factors can explain why conduction was one order-of-magnitude faster in our preparations and why spontaneous conduction block did not occur.
In our study, however, spontaneous reentrant activity was already present in four preparations at the time the culture chamber with exchanged bath solution was mounted into the amplifier setup, and, therefore, we could not record the spontaneous initiation of reentry. We can then only speculate about the mechanism by which reentry was initiated in these cases. Possibly, during the medium exchange procedure, transient gradients in the composition of the extracellular medium and/or in temperature may have caused unidirectional block, which, combined with pacemaker activity, might have led to the initiation of reentry via mechanisms similar to that described by Nagai et al. (46) and González et al. (47).
Study limitations
Although permitting electrophysiological recordings over extended periods of time, the microelectrode arrays do not permit us to measure APD or DI. Therefore, analysis of APD and APD oscillations was not possible. As described in our previous study (18), optical AP mapping with voltage-sensitive dyes could not be used in the setting of the reentry induction and resetting experiments for the following reasons. First, the induction of reentry necessitates multiple trials. Repeated illuminations during optical mapping would then lead to photodynamic damage of the preparations (18,48) and alter the results. Second, the use of voltage-sensitive dyes to reliably measure APD requires the application of excitation-contraction uncouplers such as diacetyl monoxime or cytochalasin D, which are known to influence the dynamics of reentry (8,15,49). The microelectrode array approach circumvents these drawbacks and proves to be a promising tool in the experimental investigation of long-lasting reentry in predefined tissue structures. While the use of multiple transmembrane potential recordings using micropipettes would represent an ideal alternative to measure APD, this was not realizable at the present stage of our experimental system development.
As discussed extensively in our previous publication (18), it is documented by numerous studies that the repertoire of ion channels and membrane transporters in neonatal rat ventricular myocytes differs from that of adult cells and that the degree of expression of ion channels evolves with the age of the cultures. Because changes in the density of voltage-gated Na+ or K+ channels (and probably of other ion channels as well) have a profound impact on CL oscillation characteristics (as demonstrated in Fig. 5), it is therefore probable that these characteristics are different in adult tissue circuits of equal size and, a fortiori, in reentrant circuits in other species. Furthermore, the dynamics of membrane currents and of ion accumulation in our preparations are likely to differ quantitatively from the dynamics of the Luo-Rudy model. An accurate tuning of the model to our preparations was beyond the scope of this study. However, the mathematical functions to estimate restitution slopes are valid over a broad range of parameter settings, suggesting that they do not depend on the choice of a particular ionic model.
Because of the large computational cost of the Luo-Rudy phase-2 model, we used the simpler Luo-Rudy phase-1 model to validate the relationships among P, D, α, and γ and to investigate the behavior of oscillation characteristics during graded changes of gNamax, gKmax, and τj (Fig. 5). However, because the formulation of the Na+ current is identical in both the phase-1 and phase-2 models, we believe that corresponding simulations with the Luo-Rudy phase-2 model would provide results qualitatively similar to those obtained with the phase-1 model.
Appendix.
Mathematical analysis of reentry dynamics using a difference-delay model and its solution for restitution slopes
Courtemanche, Keener, and Glass performed a detailed theoretical treatment of the dynamics of reentry in one-dimensional circuits under the assumption of given action potential (AP) restitution functions (4,14). In this section, we provide a different derivation of the original equation of Courtemanche et al., which represents the starting point for our own subsequent analysis. Specifically, we were interested in obtaining information about APD and CV restitution from the characteristics of oscillations observed experimentally during reentry.
We consider an AP circulating in a homogeneous circuit of cardiac tissue of length L. Let p denote cycle length, i.e., the period (time interval) between two successive passages of the wavefront at a given location in the circuit. Let a denote action potential duration, r the diastolic interval (recovery time), and c conduction velocity (celerity) of the wavefront.
Assuming that a and c are given-functions of the preceding diastolic interval r, we express these restitution functions as a(r) and as c(r), respectively (note that c(r) is called “dispersion function” in the work of Courtemanche et al. (4,14)).
We define pst, ast, cst, and rst as the stable values of p, a, c, and r in the situation where reentry follows a stable uniform circular movement in which these parameters do not change with time. In this situation, pst, ast, cst, and rst are related by
| (1) |
and
| (2) |
If the functions a(r) and c(r) are given, we can define functions fa and fc as
| (3) |
and
| (4) |
Stable uniform reentry can then only exist if fa = fc. It must be noted that fa = fc is a necessary but not sufficient condition for stable uniform reentry to occur.
We now consider reentry during which p, a, c, and r vary with time and position, e.g., after induction or a resetting impulse. We define x as the cumulated distance (expressed in units of length) traveled by the wavefront. Thus, x, x+L, x+2L, etc., correspond to the same position on the circuit for successive passages of the wavefront (Fig. 8). The movement of the wavefront is then described by the function t(x), expressing the time of passage of the AP at cumulated distance x.
Figure 8.

Spatiotemporal relationship of conduction parameters t, c, a, r, and p (defined in the Appendix). The thick curve illustrates the movement of the wavefront and the thin curve denotes the movement of the repolarization tail. The shaded area denotes the depolarized state. Cumulated distance x was wrapped for every circuit length L. Thus, x and x−L correspond to the same position in the circuit. The thick vectors represent conduction velocities c(x) and c(x−L), for two successive passages of the wavefront at distances x and x−L, respectively.
As shown in Fig. 8, the parameters p, a, c, and r can then be expressed as functions of x and related as follows:
| (5) |
| (6) |
| (7) |
Differentiation of Eq. 5 in respect to x and substituting dt(x)/dx using Eq. 7 gives
| (8) |
and differentiation of Eq. 6 in respect to x gives
| (9) |
We assume that the variations of a, c, and r, occur in neighborhoods of ast, cst, and rst that are small enough such that the curvature of the restitution curves can be considered negligible. The restitution curves a(r) and c(r) can then be linearized as
| (10) |
and
| (11) |
where α is the slope of the APD restitution curve and γ is the slope of the CV restitution curve, respectively. The slope α is unitless but γ has units of acceleration (e.g., cm/s2 or cm/s/ms). Substituting Eq. 10 into Eq. 9 and Eq. 11 into Eq. 8 gives
| (12) |
and
| (13) |
If the variations of c are small in respect to cst, then
| (14) |
and we can use the limit
| (15) |
to reformulate Eq. 13 as
| (16) |
Finally, because we use normalized distance expressed in number of rotations instead of absolute distance in the analysis of our experiments, we introduce a normalized unitless coordinate y expressing x in number of rotations in the circuit of length L. Thus, y, y+1, y+2, … correspond to the same position in the circuit, r(y) corresponds to r(x), r(y−1) corresponds to r(x−L), p(y) corresponds to p(x), and dx = Ldy.Equations 12 and 16 can then be rewritten as
| (17) |
| (18) |
Equating the right sides of Eqs. 17 and 18 finally yields
| (19) |
This differential equation (Eq. 19) describes the dynamics of r(y). Note that the term is equal to (see Eq. 2) and is unitless.Functions r(y) satisfying Eq. 19 are linear combinations of the function
| (20) |
where A is an arbitrary constant and Q is a complex number. The constraint on Q (i.e., the characteristic equation for Q) can be found by substituting Eq. 20 into Eq. 19,
which, by factoring out AeQy, gives
| (21) |
Equation 21 is equivalent to Eq. 20 in the study of Courtemanche et al. (14) and we therefore refer to it as the Courtemanche-Keener-Glass (CKG) equation.
Oscillating reentry dynamics and determination of Q
The trivial root Q = 0 of the CKG equation corresponds to uniform circular movement r(y) = rst and thus p(y) = pst. Of obvious interest are the nonzero roots. The CKG equation cannot be solved analytically for Q and numerical methods have to be used to find the roots for a given couple (). As discussed by Courtemanche et al. (14), for α > 0 and > 0 (positive slopes of the restitution curves), there is no real nonzero root but there exists an infinity of complex roots, corresponding to different oscillating modes. Let Q = a + bi be a complex root (b ≠ 0). It can be easily verified that Q* = a − bi (the complex conjugate of Q) is also a root of the CKG equation. Because r, a, c, and p must be real variables, it is convenient to express r(y) as the linear combination
| (22) |
which, according to Euler's formula
| (23) |
corresponds to a damped oscillation
| (24) |
This solution of r(y) can be then substituted into Eqs. 6, 10, and 11 to obtain a(y), c(y), and p(y), which are similar damped sine functions offset by a phase and a constant term, e.g.,
| (25) |
in which A represents the amplitude of the oscillations at y = 0 and the phase φ depends on the arbitrary choice of the origin y = 0.
By letting D = −1/a and P = 2π/b (i.e., a = −1/D, b = 2π/P and Q = a + bi = −1/D + 2πi/P), we obtain
| (26) |
which is the function that we used to fit the damped oscillations of cycle length observed experimentally to obtain D, the decay length of the oscillations, and P, the spatial period of the oscillations. The complex number Q is linked to D and P by
| (27) |
The CKG equation in the situation of a known Q: solution for α and γ
As mentioned before, the CKG equation cannot be solved analytically for Q. Courtemanche et al. computed Q for given couples () using numerical methods. They demonstrated that for the case > 0, the oscillations are damped (a < 0) for 0 < α < 1 and unstable (divergent, a > 0) for α > 1. At the boundary α = 1, their analysis predicts the existence of persistent oscillations (a = 0).
In the context of our experimental study, we were interested in the inverse problem—i.e., in finding α and for a given value of Q (because L is known and pst is easy to determine experimentally, γ can be calculated from ).
By multiplying both sides by eQ, Eq. 21 can be rewritten as
| (28) |
and, by substituting Q = a + bi and applying Euler's formula, we obtain
| (29) |
Rearranging Eq. 29 gives
| (30) |
Because α and must both be real numbers, the real and imaginary parts of Eq. 30 can be separated:
| (31) |
The system of expressions in Eq. 31 is linear for α and For a < 0 and for b ≠ 0, the determinant of the system is nonzero and the algebraic solution of the system is
| (32) |
Fig. 9 illustrates the behavior of α and in the P-D parameter space (with 1 ≤ P ≤ 2, corresponding to the fundamental oscillating mode described by Courtemanche et al.), in which α and can be looked up from experimentally determined values of P and D.
Figure 9.

Behavior of the APD restitution slope α (blue) and the normalized CV restitution slope (red) as a function of P and D. Interestingly, certain combinations of P and D can exist only for negative values of α.
Acknowledgments
We express our gratitude to Prof. Stephan Rohr for the design and support of the experimental setup and to Regula Flückiger Labrada for the preparation of the cultures.
This study was supported by the Swiss National Science Foundation (grant No. 3100A0-100285 to J.P.K.).
Footnotes
Editor: Herbert Levine.
References
- 1.Kléber A.G., Rudy Y. Basic mechanisms of cardiac impulse propagation and associated arrhythmias. Physiol. Rev. 2004;84:431–488. doi: 10.1152/physrev.00025.2003. [DOI] [PubMed] [Google Scholar]
- 2.Hund T.J., Otani N.F., Rudy Y. Dynamics of action potential head-tail interaction during reentry in cardiac tissue: ionic mechanisms. Am. J. Physiol. Heart Circ. Physiol. 2000;279:H1869–H1879. doi: 10.1152/ajpheart.2000.279.4.H1869. [DOI] [PubMed] [Google Scholar]
- 3.Frame L.H., Simson M.B. Oscillations of conduction, action potential duration, and refractoriness. A mechanism for spontaneous termination of reentrant tachycardias. Circulation. 1988;78:1277–1287. doi: 10.1161/01.cir.78.5.1277. [DOI] [PubMed] [Google Scholar]
- 4.Courtemanche M., Glass L., Keener J.P. Instabilities of a propagating pulse in a ring of excitable media. Phys. Rev. Lett. 1993;70:2182–2185. doi: 10.1103/PhysRevLett.70.2182. [DOI] [PubMed] [Google Scholar]
- 5.Qu Z., Weiss J.N., Garfinkel A. Cardiac electrical restitution properties and stability of reentrant spiral waves: a simulation study. Am. J. Physiol. 1999;276:H269–H283. doi: 10.1152/ajpheart.1999.276.1.H269. [DOI] [PubMed] [Google Scholar]
- 6.Weiss J.N., Garfinkel A., Karagueuzian H.S., Qu Z., Chen P.S. Chaos and the transition to ventricular fibrillation: a new approach to antiarrhythmic drug evaluation. Circulation. 1999;99:2819–2826. doi: 10.1161/01.cir.99.21.2819. [DOI] [PubMed] [Google Scholar]
- 7.Garfinkel A., Kim Y.H., Voroshilovsky O., Qu Z., Kil J.R., Lee M.H., Karagueuzian H.S., Weiss J.N., Chen P.S. Preventing ventricular fibrillation by flattening cardiac restitution. Proc. Natl. Acad. Sci. USA. 2000;97:6061–6066. doi: 10.1073/pnas.090492697. [DOI] [PMC free article] [PubMed] [Google Scholar]
- 8.Banville I., Gray R.A. Effect of action potential duration and conduction velocity restitution and their spatial dispersion on alternans and the stability of arrhythmias. J. Cardiovasc. Electrophysiol. 2002;13:1141–1149. doi: 10.1046/j.1540-8167.2002.01141.x. [DOI] [PubMed] [Google Scholar]
- 9.Wu T.J., Lin S.F., Weiss J.N., Ting C.T., Chen P.S. Two types of ventricular fibrillation in isolated rabbit hearts: importance of excitability and action potential duration restitution. Circulation. 2002;106:1859–1866. doi: 10.1161/01.cir.0000031334.49170.fb. [DOI] [PubMed] [Google Scholar]
- 10.ten Tusscher K.H., Panfilov A.V. Alternans and spiral breakup in a human ventricular tissue model. Am. J. Physiol. Heart Circ. Physiol. 2006;291:H1088–H1100. doi: 10.1152/ajpheart.00109.2006. [DOI] [PubMed] [Google Scholar]
- 11.Fei H., Hanna M.S., Frame L.H. Assessing the excitable gap in reentry by resetting. Implications for tachycardia termination by premature stimuli and antiarrhythmic drugs. Circulation. 1996;94:2268–2277. doi: 10.1161/01.cir.94.9.2268. [DOI] [PubMed] [Google Scholar]
- 12.Quan W., Rudy Y. Unidirectional block and reentry of cardiac excitation: a model study. Circ. Res. 1990;66:367–382. doi: 10.1161/01.res.66.2.367. [DOI] [PubMed] [Google Scholar]
- 13.Vinet A., Roberge F.A. The dynamics of sustained reentry in a ring model of cardiac tissue. Ann. Biomed. Eng. 1994;22:568–591. doi: 10.1007/BF02368285. [DOI] [PubMed] [Google Scholar]
- 14.Courtemanche M., Keener J.P., Glass L. A delay equation representation of pulse circulation on a ring in excitable media. SIAM J. Appl. Math. 1996;56:119–142. [Google Scholar]
- 15.Chen X., Fenton F.H., Gray R.A. Head-tail interactions in numerical simulations of reentry in a ring of cardiac tissue. Heart Rhythm. 2005;2:1038–1046. doi: 10.1016/j.hrthm.2005.08.015. [DOI] [PubMed] [Google Scholar]
- 16.Rohr S., Schölly D.M., Kléber A.G. Patterned growth of neonatal rat heart cells in culture. Morphological and electrophysiological characterization. Circ. Res. 1991;68:114–130. doi: 10.1161/01.res.68.1.114. [DOI] [PubMed] [Google Scholar]
- 17.Rohr S., Flückiger-Labrada R., Kucera J.P. Photolithographically defined deposition of attachment factors as a versatile method for patterning the growth of different cell types in culture. Pflugers Arch. 2003;446:125–132. doi: 10.1007/s00424-002-1000-0. [DOI] [PubMed] [Google Scholar]
- 18.Kondratyev A.A., Ponard J.G., Munteanu A., Rohr S., Kucera J.P. Dynamic changes of cardiac conduction during rapid pacing. Am. J. Physiol. Heart Circ. Physiol. 2007;292:H1796–H1811. doi: 10.1152/ajpheart.00784.2006. [DOI] [PubMed] [Google Scholar]
- 19.Kucera J.P., Heuschkel M.O., Renaud P., Rohr S. Power-law behavior of beat-rate variability in monolayer cultures of neonatal rat ventricular myocytes. Circ. Res. 2000;86:1140–1145. doi: 10.1161/01.res.86.11.1140. [DOI] [PubMed] [Google Scholar]
- 20.Luo C.H., Rudy Y. A model of the ventricular cardiac action potential. Depolarization, repolarization, and their interaction. Circ. Res. 1991;68:1501–1526. doi: 10.1161/01.res.68.6.1501. [DOI] [PubMed] [Google Scholar]
- 21.Luo C.H., Rudy Y. A dynamic model of the cardiac ventricular action potential. I. Simulations of ionic currents and concentration changes. Circ. Res. 1994;74:1071–1096. doi: 10.1161/01.res.74.6.1071. [DOI] [PubMed] [Google Scholar]
- 22.Faber G.M., Rudy Y. Action potential and contractility changes in [Na+]i overloaded cardiac myocytes: a simulation study. Biophys. J. 2000;78:2392–2404. doi: 10.1016/S0006-3495(00)76783-X. [DOI] [PMC free article] [PubMed] [Google Scholar]
- 23.Shaw R.M., Rudy Y. Ionic mechanisms of propagation in cardiac tissue. Roles of the sodium and L-type calcium currents during reduced excitability and decreased gap junction coupling. Circ. Res. 1997;81:727–741. doi: 10.1161/01.res.81.5.727. [DOI] [PubMed] [Google Scholar]
- 24.Marquardt D.W. An algorithm for least-squares estimation of nonlinear parameters. J. Soc. Ind. Appl. Math. 1963;11:431–441. [Google Scholar]
- 25.Gaspo R., Bosch R.F., Bou-Abboud E., Nattel S. Tachycardia-induced changes in Na+ current in a chronic dog model of atrial fibrillation. Circ. Res. 1997;81:1045–1052. doi: 10.1161/01.res.81.6.1045. [DOI] [PubMed] [Google Scholar]
- 26.Yue L., Feng J., Gaspo R., Li G.R., Wang Z., Nattel S. Ionic remodeling underlying action potential changes in a canine model of atrial fibrillation. Circ. Res. 1997;81:512–525. doi: 10.1161/01.res.81.4.512. [DOI] [PubMed] [Google Scholar]
- 27.Yue L., Melnyk P., Gaspo R., Wang Z., Nattel S. Molecular mechanisms underlying ionic remodeling in a dog model of atrial fibrillation. Circ. Res. 1999;84:776–784. doi: 10.1161/01.res.84.7.776. [DOI] [PubMed] [Google Scholar]
- 28.Yamashita T., Murakawa Y., Hayami N., Fukui E., Kasaoka Y., Inoue M., Omata M. Short-term effects of rapid pacing on mRNA level of voltage-dependent K+ channels in rat atrium: electrical remodeling in paroxysmal atrial tachycardia. Circulation. 2000;101:2007–2014. doi: 10.1161/01.cir.101.16.2007. [DOI] [PubMed] [Google Scholar]
- 29.Koller M.L., Riccio M.L., Gilmour R.F. Effects of [K+]o on electrical restitution and activation dynamics during ventricular fibrillation. Am. J. Physiol. Heart Circ. Physiol. 2000;279:H2665–H2672. doi: 10.1152/ajpheart.2000.279.6.H2665. [DOI] [PubMed] [Google Scholar]
- 30.Gilmour R.F. A novel approach to identifying antiarrhythmic drug targets. Drug Discov. Today. 2003;8:162–167. doi: 10.1016/s1359-6446(02)02567-9. [DOI] [PubMed] [Google Scholar]
- 31.Riccio M.L., Koller M.L., Gilmour R.F. Electrical restitution and spatiotemporal organization during ventricular fibrillation. Circ. Res. 1999;84:955–963. doi: 10.1161/01.res.84.8.955. [DOI] [PubMed] [Google Scholar]
- 32.Wu R., Patwardhan A. Restitution of action potential duration during sequential changes in diastolic intervals shows multimodal behavior. Circ. Res. 2004;94:634–641. doi: 10.1161/01.RES.0000119322.87051.A9. [DOI] [PubMed] [Google Scholar]
- 33.Kalb S.S., Dobrovolny H.M., Tolkacheva E.G., Idriss S.F., Krassowska W., Gauthier D.J. The restitution portrait: a new method for investigating rate-dependent restitution. J. Cardiovasc. Electrophysiol. 2004;15:698–709. doi: 10.1046/j.1540-8167.2004.03550.x. [DOI] [PubMed] [Google Scholar]
- 34.Tolkacheva E.G., Anumonwo J.M., Jalife J. Action potential duration restitution portraits of mammalian ventricular myocytes: role of calcium current. Biophys. J. 2006;91:2735–2745. doi: 10.1529/biophysj.106.083865. [DOI] [PMC free article] [PubMed] [Google Scholar]
- 35.Brugada J., Boersma L., Kirchhof C.J., Heynen V.V., Allessie M.A. Reentrant excitation around a fixed obstacle in uniform anisotropic ventricular myocardium. Circulation. 1991;84:1296–1306. doi: 10.1161/01.cir.84.3.1296. [DOI] [PubMed] [Google Scholar]
- 36.Spach M.S., Josephson M.E. Initiating reentry: the role of nonuniform anisotropy in small circuits. J. Cardiovasc. Electrophysiol. 1994;5:182–209. doi: 10.1111/j.1540-8167.1994.tb01157.x. [DOI] [PubMed] [Google Scholar]
- 37.Spach M.S. Anisotropy of cardiac tissue: a major determinant of conduction? J. Cardiovasc. Electrophysiol. 1999;10:887–890. doi: 10.1111/j.1540-8167.1999.tb00271.x. [DOI] [PubMed] [Google Scholar]
- 38.LeGrice I.J., Smaill B.H., Chai L.Z., Edgar S.G., Gavin J.B., Hunter P.J. Laminar structure of the heart: ventricular myocyte arrangement and connective tissue architecture in the dog. Am. J. Physiol. 1995;269:H571–H582. doi: 10.1152/ajpheart.1995.269.2.H571. [DOI] [PubMed] [Google Scholar]
- 39.Antzelevitch C., Shimizu W., Yan G.X., Sicouri S. Cellular basis for QT dispersion. J. Electrocardiol. 1998;30(Suppl):168–175. doi: 10.1016/s0022-0736(98)80070-8. [DOI] [PubMed] [Google Scholar]
- 40.Antzelevitch C. Transmural dispersion of repolarization and the T wave. Cardiovasc. Res. 2001;50:426–431. doi: 10.1016/s0008-6363(01)00285-1. [DOI] [PubMed] [Google Scholar]
- 41.Cabo C., Pertsov A.M., Baxter W.T., Davidenko J.M., Gray R.A., Jalife J. Wave-front curvature as a cause of slow conduction and block in isolated cardiac muscle. Circ. Res. 1994;75:1014–1028. doi: 10.1161/01.res.75.6.1014. [DOI] [PubMed] [Google Scholar]
- 42.Hund T.J., Rudy Y. Determinants of excitability in cardiac myocytes: mechanistic investigation of memory effect. Biophys. J. 2000;79:3095–3104. doi: 10.1016/S0006-3495(00)76544-1. [DOI] [PMC free article] [PubMed] [Google Scholar]
- 43.Banville I., Chattipakorn N., Gray R.A. Restitution dynamics during pacing and arrhythmias in isolated pig hearts. J. Cardiovasc. Electrophysiol. 2004;15:455–463. doi: 10.1046/j.1540-8167.2004.03330.x. [DOI] [PubMed] [Google Scholar]
- 44.Cherry E.M., Fenton F.H. Suppression of alternans and conduction blocks despite steep APD restitution: electrotonic, memory, and conduction velocity restitution effects. Am. J. Physiol. Heart Circ. Physiol. 2004;286:H2332–H2341. doi: 10.1152/ajpheart.00747.2003. [DOI] [PubMed] [Google Scholar]
- 45.Vinet A. Quasiperiodic circus movement in a loop model of cardiac tissue: multistability and low dimensional equivalence. Ann. Biomed. Eng. 2000;28:704–720. doi: 10.1114/1.1289458. [DOI] [PubMed] [Google Scholar]
- 46.Nagai Y., Gonzalez H., Shrier A., Glass L. Paroxysmal starting and stopping of circulating waves in excitable media. Phys. Rev. Lett. 2000;84:4248–4251. doi: 10.1103/PhysRevLett.84.4248. [DOI] [PubMed] [Google Scholar]
- 47.Gonzalez H., Nagai Y., Bub G., Glass L., Shrier A. Reentrant waves in a ring of embryonic chick ventricular cells imaged with a Ca2+ sensitive dye. Biosystems. 2003;71:71–80. doi: 10.1016/s0303-2647(03)00111-4. [DOI] [PubMed] [Google Scholar]
- 48.Rohr S., Salzberg B.M. Multiple site optical recording of transmembrane voltage in patterned growth heart cell cultures: assessing electrical behavior, with microsecond resolution, on a cellular and subcellular scale. Biophys. J. 1994;67:1301–1315. doi: 10.1016/S0006-3495(94)80602-2. [DOI] [PMC free article] [PubMed] [Google Scholar]
- 49.Lee M.H., Lin S.F., Ohara T., Omichi C., Okuyama Y., Chudin E., Garfinkel A., Weiss J.N., Karagueuzian H.S., Chen P.S. Effects of diacetyl monoxime and cytochalasin D on ventricular fibrillation in swine right ventricles. Am. J. Physiol. Heart Circ. Physiol. 2001;280:H2689–H2696. doi: 10.1152/ajpheart.2001.280.6.H2689. [DOI] [PubMed] [Google Scholar]