

Abstract
CD1d-restricted natural killer (NK)T cells are known to potently secrete T helper (Th)1 and Th2 cytokines and to mediate cytolysis, but it is unclear how these contrasting functional activities are regulated. Using lipid antigen–loaded CD1d tetramers, we have distinguished two subsets of CD1d-restricted T cells in fresh peripheral blood that differ in cytokine production and cytotoxic activation. One subset, which was CD4−, selectively produced the Th1 cytokines interferon γ and tumor necrosis factor α, and expressed NKG2d, a marker associated with cytolysis of microbially infected and neoplastic cells. This subset up-regulated perforin after exposure to interleukin (IL)-2 or IL-12. In contrast, CD4+ CD1d-restricted NKT cells potently produced both Th1 and Th2 cytokines, up-regulated perforin in response to stimulation by phorbol myristate acetate and ionomycin but not IL-2 or IL-12, and could be induced to express CD95L. Further, for both CD1d-restricted NKT cell subsets, we found that antigenic stimulation induced cytokine production but not perforin expression, whereas exposure to inflammatory factors enhanced perforin expression but did not stimulate cytokine production. These results show that the various activities of CD1d-restricted T cells in tumor rejection, autoimmune disease, and microbial infections could result from activation of functionally distinct subsets, and that inflammatory and antigenic stimuli may influence different effector functions.
Keywords: Th1/Th2 cytokines, cytotoxic T cells, lipid antigens, autoimmune disease, cancer
Introduction
CD1 glycoproteins comprise a family of antigen-presenting molecules that present lipid and glycolipid antigens to T cells (1). Five CD1 isoforms have been identified (CD1a, b, c, d, and e), all of which are present in humans, while mice and rats possess only CD1d (1). CD1d-restricted T cells have been identified in both mice and humans, and have drawn attention for their unusual ability to secrete both Th1 and Th2 cytokines rapidly upon stimulation (2–4). CD1d-restricted T cells were first characterized in the mouse and were found to express a highly restricted TCR repertoire - an invariantly rearranged Vα14/Jα281 TCR α chain paired mainly with Vβ8+ TCR β chains (5, 6). Subsequently, other murine CD1d-restricted T cells expressing a variety of TCR α and β chains with diverse junctional rearrangements were also identified (7–10). Human CD1d-restricted T cells have been cloned that have a canonical Vα24/JαQ TCR α chain that is homologous to the murine Vα14+ TCR α chain, and is paired with Vβ11+ TCR β chains (11). Human bone marrow T cells that recognize CD1d and utilize other TCR α and β chains have also recently been described (12). Murine CD1d-restricted T cells were initially characterized as comprising the small subset of T cells that coexpress the NK1.1 antigen (now called CD161), a marker found on all NK cells, and were therefore called “NKT” cells (2). However, recent studies have demonstrated that not all CD1d-restricted T cells are CD161+ (13, 14), and that CD161 can be expressed by a very large number of MHC class I and class II–restricted T cells after lymphokine activation or viral infection (15–17). Hence, CD1d-restricted T cells and CD161+ NKT cells are overlapping but not identical T cell subpopulations.
The natural antigens recognized by CD1d-restricted T cells are largely unidentified. Many CD1d-restricted T cells appear to respond to self-antigens presented by CD1d molecules, and some may react to microbial lipids (9, 18, 19). Additionally, most murine Vα14+ and human Vα24+ CD1d-restricted T cells have been found to respond strongly to CD1d-mediated presentation of α-galactosylceramide (α-GalCer)*, an unusual glycosphingolipid derived from a marine sponge (20, 21). This lipid is not a physiological antigen, but appears to be an unusual cross-reactive molecule that is recognized by a large number of CD1d-restricted T cells that otherwise have distinct antigenic specificities (18). CD1d-restricted T cells with diversely rearranged TCRs can also recognize self-antigens presented by CD1d, but the clones that have been tested thus far do not respond to α-GalCer, suggesting they may have different antigenic specificities than TCR α-invariant CD1d-restricted T cells (9, 18).
CD1d-restricted T cells are associated with prevention of type I diabetes and other autoimmune diseases (22–24), are required for rejection of certain tumors (25, 26), and may participate in immune responses to certain microbial infections (19, 27). These effects of CD1d-restricted T cells in vivo appear to entail secretion of either Th1 or Th2 cytokines, and may involve cytolysis. For example, in type I diabetes the protective effect of CD1d-restricted T cells correlates with their secretion of IL-4 and/or IL-10 (22, 28, 29). In contrast, activation of CD1d-restricted T cells by administration of the α-GalCer antigen results in heightened IFN-γ production, and has a beneficial effect on several microbial infections (30–32). In tumor rejection it is unclear whether CD1d-restricted T cells function primarily to secrete IFN-γ, which then activates cytolytic antitumor effectors such as NK cells, γδ T cells, or CTLs, or whether CD1d-restricted T cells themselves carry out the cytotoxic functions that eliminate the tumor cells (25, 33, 34). Thus, it seems likely that the important functions of CD1d-restricted T cells in vivo involve secretion of Th1 or Th2 cytokines, or cell killing. However, how these distinct effector functions of CD1d-restricted T cells are regulated, and what physiological stimuli activate their different responses, remain unknown.
Recently, a novel technique has been developed that uses soluble antigen presenting molecules, loaded with a specific antigen and complexed into a fluorescently labeled tetrameric form (“tetramers”), to detect and characterize antigen-specific T cells (35). This approach is particularly powerful because it permits characterization of antigen-specific T cells from fresh peripheral blood or tissue, without requiring culture in vitro, and therefore allows an excellent assessment of their properties in vivo. In this study, we use α-GalCer loaded CD1d tetramers to evaluate the functions and responses to different physiological stimuli of fresh CD1d-restricted T cells from human peripheral blood. Surprisingly, we find evidence of at least two functionally distinct subsets of α-GalCer-reactive CD1d-restricted T cells. Furthermore, antigenic and cytokine-mediated stimulation had different effects on the functional states of CD1d-restricted T cells. These findings clarify how CD1d-restricted T cells could render distinct Th1 and Th2 responses, provide insight into the potential role of CD1d-restricted T cells in IL-12–dependent tumor rejection, and suggest CD1d-restricted T cells may have cytotoxic functions in microbial infections that have not previously been appreciated.
Materials and Methods
Generation and Purification of the Human CD1d-Fc Fusion Protein.
The human CD1d-Fc fusion protein was constructed, produced, and purified as described previously for a similar murine CD1d-Fc fusion protein (18). Briefly, a single chain construct was designed encoding human β2m, a glycine-serine (gly-ser) spacer peptide, the coding region of human CD1d truncated immediately before the transmembrane domain, another gly-ser spacer peptide, and the hinge region and Fc portions of murine IgG2a. Synthetic oligonucleotide PCR primers for PCR amplification of the truncated human CD1d fragment were obtained from Operon Technologies. The 5′ primer oligonucleotide sequence was 5′-GCGCGGACTAGTGCTGAAGTCCCGCAAAGGCTTTTC-3′, and the 3′ primer sequence was 5′-GGAAGAGCGGCCGCTCCAGTAGAGGATGATGTCCTG- GCC-3′. The human β2m+linker, and linker+Fc cDNA fragments were PCR amplified and subcloned together with the CD1d fragment as described previously (18). The resulting construct was fully sequenced to ensure that no coding mutations were present, subcloned into the pBJ1-neo expression vector (36), and transfected into Chinese hamster ovary cells and grown as described previously (18). Dimeric fusion protein was purified from culture supernatants by protein A column chromatography followed by acid elution, then further purified by size exclusion chromatography on a Superose 6 column (Amersham Pharmacia Biotech), and concentrated by ultrafiltration in the presence of 0.5 mg/ml OVA.
Preparation of the α-GalCer Lipid Antigen.
α-GalCer was synthesized as described previously (37). The lyophilized lipid was dissolved in DMSO at a concentration of 100 μg/ml by incubation for at least 12 h at 37°C with agitation, then stored at –20°C. Prior to use the antigen was thawed at room temperature, then sonicated for 10 min at 37°C.
Tetrameric Complexing and Antigen Loading.
Tetrameric complexes of the CD1d–Fc fusion protein or the IgG2a isotype UPC10 negative control mAb (Sigma-Aldrich) were formed using fluorescently labeled protein A molecules. Protein A molecules spontaneously associate in solution at neutral pH with immunoglobulin Fc regions, forming stable complexes containing 4 Fc molecules and 2 protein A molecules, or 1 Fc molecule and 1 protein A molecule (38). The CD1d-Fc fusion protein or UPC10 mAb were incubated overnight at 37°C with Alexa 488 dye labeled protein A (Molecular Probes). Tetrameric complexes were purified by size exclusion chromatography on a Pharmacia Superose 6 column, and concentrated by ultrafiltration in the presence of 0.5 mg/ml OVA. Similar nonfluorescent complexes for use as a flow cytometry blocking reagent were prepared using the UPC10 mAb and unlabeled protein A (Sigma-Aldrich). To load the fusion protein with antigen, a 40:1 molar ratio of α-GalCer dissolved in DMSO was incubated with the CD1d tetramer for 24 to 48 h at 37°C.
Purification and Stimulation of Human PBMC Samples.
Human venous blood samples were drawn from healthy volunteer donors. PBMCs were purified by ficoll density gradient centrifugation (Amersham Pharmacia Biotech). For most analyses, to reduce nonspecific staining, B cells were removed by CD19 magnetic bead depletion using the MACS® system, according to the manufacturer's protocol (Miltenyi Biotec). For analyses of NKG2d expression, CD4+ cells were also removed from a portion of each sample by CD4 magnetic bead depletion using the MACS® system. For stimulation experiments, freshly purified B cell depleted PBMCs were transferred into culture medium (RPMI supplemented with l-glutamine and penicillin/streptomycin, Life Technologies, and 10% bovine calf serum, Hyclone Laboratories) containing a final concentration of 1 μg/ml α-GalCer, 20 nM IL-2 (Chiron Corp.), 20 ng/ml IL-12 (Peprotech), or 1 μg/ml purified LPS (Sigma-Aldrich) in the presence or absence of monensin (BD PharMingen) as specified, and incubated for 12–14 h at 37°C and 5% CO2. For samples that were incubated overnight without monensin, the incubation was continued for an additional 4 h in the presence of monensin to allow intracellular proteins to accumulate. PMA/ionomycin stimulation was performed for 6 h at 37°C and 5% CO2 in culture medium containing 25 ng/ml PMA (Sigma-Aldrich), 1 μg/ml ionomycin (Sigma-Aldrich), and monensin. Unstimulated control samples were incubated overnight in culture medium containing monensin at 37°C and 5% CO2.
Flow Cytometric Staining and Analysis.
Each analysis was performed on PBMC samples from at least three different donors. PBMC samples were blocked with a solution containing 100 μg/ml nonfluorescent UPC10 tetramer, 50 μg/ml MOPC21 IgG1 mAb (Sigma-Aldrich), 0.5 mg/ml OVA, and 0.05% NaN3. Staining and analysis were performed in FACS® buffer containing 1 mg/ml BSA in PBS and 0.05% NaN3. For analysis of cell surface markers, the samples were stained with the α-GalCer–loaded CD1d tetramer, DMSO mock-treated CD1d tetramer, or the UPC10 negative control tetramer, each diluted to 30 μg/ml in FACS® buffer, and phycoerythrin (PE)-or cychrome (Cy)-conjugated antibodies against the following markers, as specified: CD3-Cy, CD4-Cy, CD8α-Cy, CD161-PE, CD94-PE, CD69-PE, CD62L-PE, CXCR3-PE, CCR5-PE, CD103-PE, mIgG1-PE negative control, mIgG2a-PE negative control, (all from BD PharMingen); CD8β-PE (Beckman Coulter); α4β7 (ACT1 mAb, provided by Millenium Pharmaceuticals) conjugated to pyridyldisulfide derivatized R-PE (Molecular Probes). Analysis of cutaneous lymphocyte antigen (CLA) expression was performed using unconjugated anti-CLA followed by mouse anti–rat IgM-PE (both from BD PharMingen). CCR7 expression was evaluated using an anti-CCR7 mAb (clone 2H4, provided by Millenium Pharmaceuticals) followed by rat anti–mouse IgM-PE (Jackson ImmunoResearch Laboratories). Staining for NKG2d was performed using the α-GalCer loaded or DMSO mock-treated CD1d tetramer and the 1D11 mAb (provided by Thomas Spies), or a negative control mAb, followed by anti–Igκ-PE (BD PharMingen).
For intracellular staining the samples were blocked as described above, then stained with the α-GalCer loaded or DMSO mock-treated CD1d tetramer and anti–CD3-Cy or anti-CD4-Cy, then fixed and permeabilized according to the manufacturer's protocol (BD PharMingen), and then stained using the following PE-conjugated antibodies: anti–IFN-γ, anti–TNF-α, anti-GM–CSF, anti–IL-2, anti–IL-4, anti–IL-5, anti–IL-6, anti–IL-10, anti–IL-13, anti-perforin; or mIgG1, mIgG2a, rIgG1, rIgG2a, mIgG2b negative control antibodies (BD PharMingen); or anti-CD95L–PE from Caltag Laboratories.
Flow cytometric data collection was performed on a Becton Dickinson FACScan™, and at least 50–200,000 events were collected for each sample to ensure a sufficient number of tetramer positive events for analysis. Data analysis was performed using Flowjo flow cytometry software (Treestar, Inc.). Samples were gated on lymphocytes using forward and side scatter parameters. Positive staining for each maker was determined by comparison to appropriate isotype-matched negative controls and unstimulated samples.
Results and Discussion
Flow Cytometric Staining Using CD1d Tetramers.
To investigate the functions of fresh peripheral blood CD1d-restricted T cells, we used tetrameric complexes of a human CD1d-Fc fusion protein, or the isotype-matched negative control UPC10 mAb, and fluorescently tagged protein A in flow cytometric analyses. To verify its specificity, the CD1d tetramer was tested for staining of two human CD1d-restricted NKT cell clones, DN2.B9 and DN1.10B3, that respond functionally to α-GalCer (21). The CD1d tetramer was preincubated with α-GalCer dissolved in DMSO, or with an equivalent volume of DMSO alone. Clearly positive staining of NKT clones DN1.10B3 and DN2.B9 was observed using the CD1d tetramer preincubated with α-GalCer (MFI = 67.3 and 86.2, respectively), while staining by the CD1d tetramer that was mock-treated with DMSO (MFI = 3.2 and 3.03), was equivalent to that of the UPC10 negative control complex (MFI = 3.03 and 3.04). Thus, addition of a lipid antigen was required for CD1d tetramer binding to the NKT cell clones. Three αβ T cell clones and one γδ T cell clone that were not CD1d-restricted were stained by neither the α-GalCer antigen treated, nor the DMSO mock-treated CD1d tetramer (data not shown), suggesting the CD1d tetramer staining was specific for CD1d-restricted T cells.
We next used two-color flow cytometric analysis on PBMC samples purified from 20 healthy donors to assess the staining of peripheral blood T cells with the α-GalCer–loaded CD1d tetramer. The samples were stained with an anti-CD3 mAb and the CD1d tetramer treated with α-GalCer, or DMSO, or with the UPC10 negative control complex. A small population of T cells that stained positively with the α-GalCer–treated tetramer could be detected for 15 out of 20 donors, whereas staining with the DMSO mock-treated CD1d tetramer was equivalent to the UPC10 negative control complex (Fig. 1 a and b, and data not shown). For 5 out of 20 donors, the percentage of T cells stained by the α-GalCer–treated CD1d tetramer was not greater than the negative control staining (data not shown). The percentage of the total T cells that were specifically stained with the tetramer ranged from undetectable (<0.01% of the CD3+ lymphocytes) to 2.34%, with a median of 0.034% and a mean of 0.194%. Thus, in most healthy donors a small subpopulation of peripheral blood T cells could be detected using α-GalCer–loaded CD1d tetramers. The frequencies of α-GalCer reactive CD1d-restricted T cells observed in our analysis are similar to those obtained by Karadimitris et al. who used human CD1d tetramers loaded with α-GalCer to analyze PBMC samples from seven hepatitis C virus–infected patients and three healthy donors (39). Two reports have suggested that some NK cells may recognize CD1 molecules (40, 41). However, we observed no CD1d-specific staining of CD3− lymphocytes (see Fig. 1 a and b).
Figure 1.

Flow cytometric staining of fresh human PBMCs using CD1d-Fc tetramers and antibodies against cell surface markers. a, b, and d are composite contour/dot plots, in which areas of infrequent events are shown as individual dots and higher density areas are shown as concentric probability contours with each successive layer depicting an increased frequency of events. a and b show lymphocytes from a PBMC sample that was stained with anti-CD3, and CD1d tetramers treated with DMSO or α-GalCer, respectively. c is a contour plot showing the CD4 and CD8β staining of α-GalCer–loaded tetramer positive lymphocytes. d shows the CD161 and α-GalCer–loaded CD1d tetramer staining of CD3+ lymphocytes. Numbers in boxed areas of a and b, and in the corners of c and d show the percentage of events contained within the boxes or quadrants, respectively.
We confirmed that the CD1d tetramer staining of human peripheral blood lymphocytes was specific for CD1d-restricted T cells by deriving T cell clones from the stained population. 14 T cell clones were established from four donors by flow cytometric sorting of tetramer positive cells. Flow cytometric analysis of the clones revealed uniform positive staining using the α-GalCer–loaded CD1d tetramer and no staining using the DMSO-treated CD1d tetramer or the negative control UPC10 complex (data not shown). The clones also secreted cytokines (including IFN-γ, IL-4, and GM-CSF) in response to CD1d-transfectants in the presence of α-GalCer, but did not respond to α-GalCer–treated untransfected parent cells (unpublished data). Thus, human peripheral blood T cells stained by the α-GalCer loaded tetramer are CD1d specific and recognize the α-GalCer lipid antigen.
Phenotypic Characterization of CD1d Tetramer Positive Cells.
Murine α-GalCer–specific CD1d-restricted T cells have been shown to be CD4+ or CD4 and CD8 double negative, and to include CD161+ and CD161− cells (13, 14). We investigated CD4, CD8α, and CD8β staining for CD1d tetramer positive T cells from human peripheral blood of four healthy donors. An anti-CD4 mAb stained approximately half of the tetramer positive cells (mean = 51 ± 19%, and see Fig. 1 c). Approximately half of the tetramer positive cells stained positively for CD8α (mean = 51 ± 15%), but little or no positive staining was observed for CD8β (Fig. 1 c). Therefore, CD1d tetramer positive T cells in human peripheral blood can be divided into two subsets: a CD4+ subset and a CD4− subset that contains cells expressing CD8αα homodimers, but almost none expressing CD8αβ heterodimers.
We next examined expression of the NK complex receptors CD161, CD94, and CD69 by CD1d tetramer positive T cells. In C57Bl/6 mice, generally <5% of splenic T cells coexpress CD161, and 60–80% of these T cells are stained by α-GalCer loaded murine CD1d tetramers (13, 14). However, an analysis of CD161 staining of human peripheral blood lymphocytes found that ∼25% of the T cells from healthy adult donors coexpressed CD161 (42). We found that a mean of 17 ± 8.4% of the total peripheral blood T cells from five healthy donors expressed CD161, but only a small fraction stained positively with the α-GalCer loaded human CD1d tetramer (Fig. 1 d). Most tetramer positive T cells were positive for CD161 (mean = 72 ± 14%). In contrast, CD94 was expressed by a mean of 49 ± 22% of the CD1d tetramer positive cells, and CD69 was detected on very few tetramer positive cells (mean = 6.4 ± 2.8%). Hence, our results show that most CD1d tetramer positive T cells express CD161 but are not necessarily positive for other NK complex markers, and the great majority of human CD161+ T cells are not α-GalCer specific CD1d-restricted T cells.
Cytokine Production by Fresh CD1d-restricted T Cells.
CD1d-restricted T cells were first noted for their ability to rapidly secrete substantial amounts of the Th2 cytokine IL-4 upon anti-CD3 stimulation, but more recent investigations using α-GalCer to selectively stimulate murine CD1d-restricted T cells have observed Th1 biased cytokine responses immediately after stimulation (43–46). Analysis of cytokine production by in vitro cultured human CD1d-restricted T cell clones has demonstrated that most clones from healthy donors produce both IFN-γ and IL-4, but it is unclear whether this is representative of the cytokine secretion of CD1d-restricted T cells in vivo (21, 29). Therefore, we performed intracellular cytokine staining to investigate cytokine production by CD1d-restricted T cells freshly isolated from human peripheral blood.
PBMC samples were treated for 6 h with PMA and ionomycin or incubated overnight with α-GalCer, or with no stimulus, in culture medium containing monensin to block exocytosis. The samples were then washed and stained with the α-GalCer–loaded CD1d tetramer and anti-CD3 or anti-CD4, then fixed and permeabilized and stained with antibodies to Th1 or Th2 cytokines, or isotype-matched negative control antibodies. This protocol resulted in clear positive staining by the anti-cytokine antibodies compared with the isotype matched negative control antibodies for a fraction of both the tetramer positive and tetramer negative T cells in the PMA/ionomycin treated samples (Fig. 2 and Table I). For the α-GalCer–treated samples, a fraction of the tetramer positive cells stained positively for cytokines, while the tetramer negative cells were equivalent to the unstimulated control (Table I, and data not shown). Unstimulated samples gave little or no positive staining for any of the cytokines (Table I, and data not shown).
Figure 2.

Flow cytometric probability contour plots of CD1d tetramer positive lymphocytes stained for intracellular cytokines. The plots are gated on the α-GalCer–loaded CD1d tetramer positive lymphocytes within a PBMC sample, and show staining with anti-CD4 on the y-axes, and antibodies to the intracelluar cytokines shown (b-j), or a negative control (a), on the x-axes. Plots b-j show staining of a PBMC sample that was stimulated with PMA and ionomycin in the presence of monensin. The negative control antibody staining (a) was performed on an unstimulated PBMC sample from the same donor. Numbers in the corners indicate the percentage of the events contained within each quadrant.
Table I.
Cytokine Production by CD14 Tetramer-stained T Cell Subsets
| Stimulation | Tetramer subset | IFN-γ | TNF-α | GM-CSF | IL-2 | IL-4 | IL-5 | IL-6 | IL-10 | IL-13 |
|---|---|---|---|---|---|---|---|---|---|---|
| None | CD4+ | 2.7 (1.5) | 2.3 (1.9) | 1.7 (1.2) | 1.7 (1.2) | 3.2 (2.5) | 0.9 (1.0) | 3.1 (1.1) | 1.6 (1.6) | 2.6 (2.9) |
| CD4− | 0 (0) | 0 (0) | 0 (0) | 0 (0) | 0.7 (1.5) | 0 (0) | 0 (0) | 0.3 (0.6) | 0 (0) | |
| PMA/iono | CD4+ | 92 (1.5) | 87 (4.6) | 48 (23) | 54 (22) | 36 (11) | 19 (5.4) | 23 (10) | 22 (2.5) | 22 (5.7) |
| CD4− | 91 (7.1) | 72 (5.9) | 18 (16) | 11 (5.6) | 9.4 (5.8) | 0 (0) | 0.6 (1.1) | 0.3 (0.6) | 0.3 (0.6) | |
| α-GalCer | CD4+ | 45 (8.6) | 32 (3.5) | 12 (15) | 13 (13) | 16 (9.5) | 10 (7.5) | 9 (6.4) | 10 (11) | 12 (13) |
| CD4− | 35 (19) | 25 (14) | 0 (0) | 0.7 (1.4) | 3.1 (.9) | 0 (0) | 2.9 (3.8) | 1.1 (2.3) | 0 (0) | |
| PMA/iono | Negative | 22 (13) | 17 (11) | 2.6 (1.8) | 20 (8.9) | 1.0 (0.8) | 0.08 (0.11) | 0.02 (0.03) | 0.5 (0.4) | 0.6 (0.3) |
The percentage of CD4+ and CD4− CD1d tetramer positive lymphocytes that produced intracellular cytokines after α-GalCer, PMA/ionomycin, or no stimulation. For comparison, the percentage of CD1d tetramer negative T cells that produced intracellular cytokines after PMA/ionomycin stimulation is also shown. The mean percentages of cells that stained positively are given first, with the standard deviations shown in parentheses. The results are compiled from 2–4 independent analyses of PBMC samples from three to six healthy donors.
Remarkably, there was a clear-cut difference in the cytokines produced by the CD4+ and CD4− tetramer positive subsets: the CD4+ subset made both Th1 and Th2 cytokines, whereas the CD4− subset overwhelmingly made IFN-γ and TNF-α (Fig. 2 and Table I). PMA/ionomycin treatment was more efficient at inducing cytokine production than was incubation with α-GalCer, but the difference in cytokine production between the CD4+ and CD4− subsets was observed for both types of stimulation (Table I). Hence, CD4 expression distinguishes two subsets of CD1d-restricted T cells that have different patterns of cytokine production.
These results support the hypothesis that CD1d-restricted T cells overall are a potent cytokine producing subpopulation, since compared with tetramer negative T cells, a large percentage of the CD1d tetramer positive T cells stained positively for each of the cytokines tested (Table I). Surprisingly, we find that in healthy donors most CD1d-restricted T cells produced Th1 cytokines, and only a minority produced each of the Th2 cytokines analyzed. Because each cytokine was tested separately in this analysis, it is unclear whether the Th2 cytokines were all produced by the same CD4+ tetramer positive cells or by different subsets. However, because only ∼8% of the CD4+ tetramer positive cells did not produce IFN-γ, and Th2 cytokines were generally produced by at least 20% of the CD4+ tetramer positive cells, most of the CD4+ tetramer positive cells that stained positively for Th2 cytokines in our analysis probably also produce IFN-γ (see Table I). Thus, many Th2 cytokine producing tetramer positive cells probably have a Th0 cytokine production phenotype, rather than a traditional Th2 phenotype.
Nevertheless, compared with tetramer negative T cells, Th2 cytokine producing cells were unusually common in the CD4+ tetramer positive population (see Table I). Particularly for IL-5 and IL-6, tetramer negative T cells that stained positively were extremely rare, and CD1d tetramer positive cells made up a significant fraction of the total IL-5– and IL-6–producing PBMC T cells (mean = 13 ± 7.1% and 19 ± 14%, respectively). Thus, while the tetramer positive population as a whole appeared biased toward Th1 cytokine production, CD1d-restricted T cells may be a very important source of certain Th2 cytokines. Moreover, if the CD4− and CD4+ subsets can be differentially activated in vivo, the segregation of CD1d-restricted T cells into these two subsets that have different cytokine secretion profiles could explain how some CD1d-restricted T cell–mediated responses appear strongly biased toward Th1 cytokines, while in other cases Th2 responses are prominent.
Cytolytic Functions of CD1d-restricted T Cells.
To investigate the cytotoxic potential of fresh peripheral blood CD1d-restricted T cells, we performed intracellular staining for perforin on unstimulated PBMC samples from five healthy donors. There was generally little or no positive perforin staining of the CD4+ tetramer positive subset (mean = 8.5% positive and Fig. 3 a, top quadrants). In contrast, the percentage of the CD4− tetramer positive subset that stained positively for perforin varied substantially from donor to donor (range = 0–55%, mean = 23%, and Fig. 3 a, bottom quadrants). Hence, most CD1d-restricted T cells from unstimulated peripheral blood did not express perforin, but cells of the CD4− subset more frequently contained perforin than the CD4+ subset.
Figure 3.
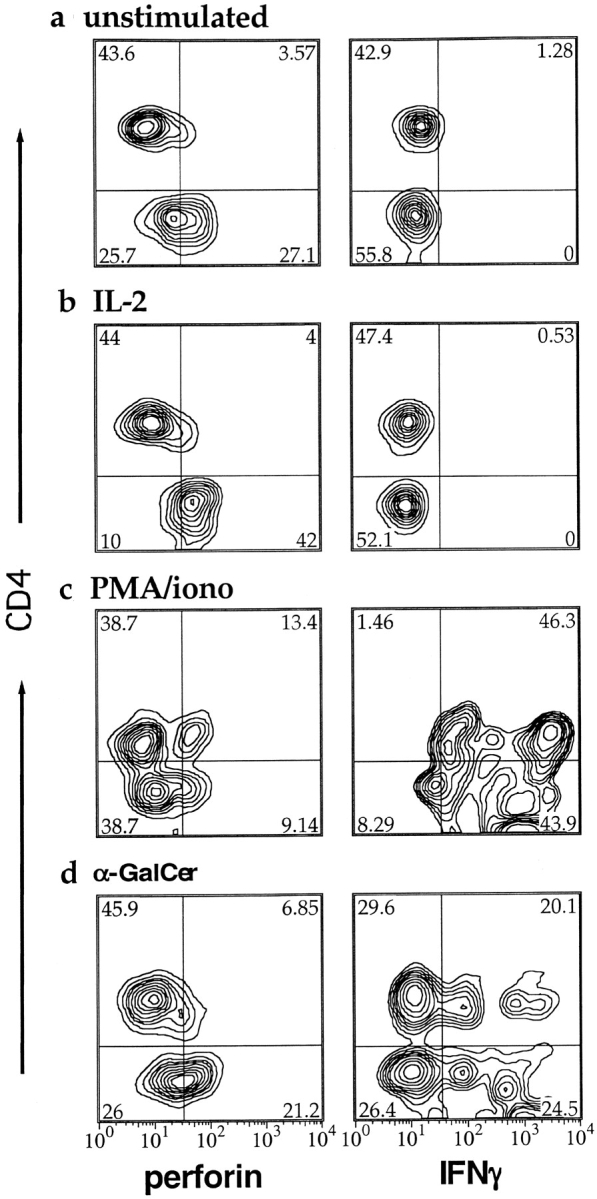
Flow cytometric probability contour plots showing intracellular perforin and IFN-γ staining of CD1d tetramer positive lymphocytes after stimulation. The plots are gated on α-GalCer–loaded CD1d tetramer positive lymphocytes within a PBMC sample, after the following treatments: no stimulation (a); IL-2 stimulation (b); PMA/ionomycin stimulation (c); and α-GalCer stimulation (d). The left column shows perforin staining, and the right shows IFN-γ staining. The y-axes of all plots show CD4 staining on a four decade log scale. Numbers in the corners indicate the percentage of the events contained within each quadrant.
Several reports have indicated that exposure to IL-2, IL-12, or α-GalCer may enhance cytotoxicity by cultured CD1d-restricted NKT cells (47–50). To investigate the effects of stimulation on effector functions of CD1d-restricted T cells, we incubated PBMC samples overnight with α-GalCer, IL-2, IL-12, or LPS which potently induces secretion of inflammatory cytokines, or treated them for 6 h with PMA and ionomycin. Treatment with α-GalCer, IL-2, IL-12, and PMA/ionomycin was performed in the presence of monensin to prevent secretion of cytokines or other factors that could secondarily affect the CD1d-restricted T cells. LPS treatment was performed in the presence or absence of monensin, to compare effects resulting from the inflammatory response induced by LPS, with direct effects of LPS. After stimulation the PBMC samples were stained with the α-GalCer–treated CD1d tetramer and anti-CD4, then fixed, permeabilized, and stained for perforin or IFN-γ expression.
IL-2, IL-12, and PMA/Ionomycin Stimulation.
After IL-2 or IL-12 treatment, a large fraction of the CD4− CD1d tetramer positive cells expressed perforin, but the CD4+ subset was still almost completely perforin negative (Fig. 3 b and Fig. 4 a). Hence, exposure to IL-2 or IL-12 alone is sufficient to upregulate perforin for much of the CD4−, but not the CD4+ CD1d-restricted subset. In contrast, PMA and ionomycin stimulation reproducibly induced a fraction of the CD4+ tetramer positive cells to express perforin, but did not enhance perforin staining in the CD4− subset (Fig. 3 c and Fig. 4 a). Thus, perforin expression is induced by different stimuli in CD1d-restricted T cells of the CD4+ and CD4− subsets. CD1d-restricted T cells of the two subsets may therefore carry out cytolytic functions in response to different signals in vivo.
Figure 4.

Mean percentages of CD1d tetramer positive cells staining positively for perforin and IFN-γ after stimulation. Plot a shows perforin staining, plot b shows IFN-γ staining, after stimulation as shown on the y-axis at the left. Gray bars show CD4− and stippled bars show CD4+ CD1d tetramer positive cells. Results are from six independent experiments on three healthy donors.
LPS Stimulation.
Interestingly, treatment of the PBMC samples with LPS in the absence of monensin provided sufficient stimulation for CD1d-restricted T cells of both the CD4− and CD4+ subsets to up-regulate perforin expression (Fig. 4 a). However, perforin staining was not clearly enhanced by incubation with LPS in the presence of monensin (Fig. 4 a). Therefore, the effect of LPS may be due to expression of soluble and/or cell surface molecules that depend on intracellular transport. These results show that inflammatory conditions, including exposure to LPS which is an early indicator of gram negative bacterial infection, may prime a fraction of CD1d-restricted T cells for cytolytic function.
Antigenic Stimulation.
Unexpectedly, TCR stimulation by antigen led to a qualitatively different outcome than stimulation by cytokines or LPS. Treatment of PBMC samples with α-GalCer in the presence of monensin did not result in significantly increased numbers of perforin-positive CD1d tetramer positive cells (Figs. 3 d and 4 a). However, such α-GalCer treatment did induce IFN-γ production in both CD4− and CD4+ tetramer positive cells (Fig. 3 h and Fig. 4 b). Remarkably, in contrast to their effects on perforin, IL-2, IL-12, and LPS completely failed to induce IFN-γ production in either subset of CD1d tetramer positive cells (Fig. 3 f and Fig. 4 b). Thus, exposure to a lipid antigen resulted in IFN-γ production, but did not lead to up-regulation of intracellular perforin, whereas exposure to IL-2, IL-12, or LPS enhanced perforin staining, but did not induce IFN-γ production.
This result contrasts with two reports that found increased cytotoxicity or granzyme B expression in Vα24+ NKT cells cultured with α-GalCer (47, 48). However, in these studies the Vα24+ NKT cells were cultured with monocytes or monocyte-derived dendritic cells and treated with α-GalCer in the absence of monensin. In a murine model, NKT cells induced monocyte-derived cells to secrete IL-12 after addition of α-GalCer (49). Hence, culture of CD1d-restricted T cells with α-GalCer and myeloid cells could result in secondary stimulation of cytotoxicity by IL-12 or other factors.
Overnight incubation of the PBMC samples with α-GalCer in the absence of monensin resulted in a dramatic (∼80%) reduction in the number of CD1d tetramer positive cells detected compared with unstimulated samples (data not shown). This effect resembles the disappearance of CD1d-restricted T cells in vivo upon administration of α-GalCer that has been observed in a murine system (14). Incubation of the PBMC samples with IL-2, IL-12, LPS, or PMA and ionomycin did not lead to a significant reduction in the number of CD1d tetramer positive cells detected. Moreover, when incubation of PBMC samples with α-GalCer was performed in the presence of monensin the number of CD1d tetramer positive cells was generally 80–100% of the number detected in unstimulated control samples. Hence, the disappearance of CD1d tetramer positive cells was specific to α-GalCer stimulation and depended on intracellular transport, suggesting it may result from secretion or cell surface expression of as yet unidentified factors.
Cytokine Receptor Expression.
To assess whether the lack of perforin up-regulation in response to IL-12 and IL-2 in the CD4+ CD1d-restricted T cell subset could be due to the absence of appropriate cytokine receptors, we evaluated expression of the IL-12 and IL-2 receptors by tetramer positive cells. The IL-12 receptor β1 chain was detected on cells of both the CD4− and CD4+ CD1d tetramer positive subsets (mean = 61 ± 6.8% and 57 ± 27% positive, respectively). Similarly, IL-2 receptor expression was detected on cells of both CD1d tetramer positive subsets, but expression of the intermediate- and high-affinity forms differed between the CD4+ and CD4− subsets. The IL-2 receptor α chain (CD25) was expressed by 26 ± 1.3% of the CD4+ tetramer positive cells, but by very few of the CD4− cells (mean = 7.0 ± 7.3%), while the IL-2 receptor β chain (CD122) was detected on a mean of 74 ± 8.2% of the CD4- tetramer positive cells, and on 59 ± 28% of the CD4+ cells. Hence, a fraction of the CD4+ CD1d tetramer positive cells expressed the high affinity IL-2 receptor (CD25+CD122), whereas most CD4− CD1d-restricted T cells expressed the intermediate affinity IL-2 receptor (CD122). Nonetheless, the lack of perforin expression in response to IL-12 and IL-2 by CD4+ tetramer positive cells was not simply due to an absence of the cytokine receptors, underscoring the finding that expression of intracellular perforin appears to be regulated differently in the CD4+ and CD4− CD1d-restricted T cell subsets.
Expression of Receptors Associated with Cell Killing.
NKG2d is a lectin encoded in the NK complex that is expressed by NK cells, γδ T cells, and CD8+ αβ T cells, that mediates or costimulates cytolysis of virally and bacterially infected or neoplastic cells that express certain stress-induced antigens (51–54). We investigated CD1d-restricted T cell expression of cell surface NKG2d by two color flow cytometric analysis. As a directly conjugated anti-NKG2d antibody was not available, we compared PBMC samples depleted of CD4+ cells to CD4 undepleted samples to evaluate whether NKG2d expression was biased toward CD4+ or CD4− CD1d-restricted T cells. In PBMC samples that were not depleted of CD4+ cells, approximately half of the CD1d tetramer positive cells stained positively for NKG2d (Fig. 5 a, top panel). In PBMC samples that were CD4 depleted, the fraction of CD1d tetramer-positive cells that were NKG2d-positive was increased (Fig. 5 a, bottom panel), suggesting that the CD4− CD1d-restricted T cell subset is enriched for NKG2d expression compared with the CD4+ subset.
Figure 5.

Flow cytometric probability contour plots showing NKG2d and CD95L staining of CD1d tetramer positive cells. The plots are gated on CD1d tetramer positive lymphocytes. a shows NKG2d staining of a sample before depletion of CD4+ cells (top panel), compared with NKG2d staining after depletion of CD4+ cells (bottom panel). b shows CD4 staining compared with intracellular staining for CD95L for an unstimulated sample (top panel), and a PMA and ionomycin stimulated sample (bottom panel).
Taken together with our finding that exposure to IL-2, IL-12, or LPS results in enhanced perforin expression, this observation suggests CD4− CD1d-restricted T cells could play a previously unrecognized role in microbial infections. Exposure to inflammatory conditions may serve to activate the cytotoxic functions of CD4− CD1d-restricted T cells, and NKG2d expression could permit cytolysis of a broad range of virally or bacterially infected cells. Moreover, this observation could provide insight into the role of CD1d-restricted T cells in tumor rejection. CD1d-restricted T cells are required for the rejection of murine metastatic tumors induced by pharmacological administration of IL-12 or α-GalCer, and also appear to be involved in elimination of tumors mediated by endogenous IL-12 secretion (25, 55, 56). Paradoxically, however, tumor rejection is not blocked by antibodies to CD1d (55). Our results indicate IL-12–activated CD4− CD1d-restricted T cells could recognize tumor cells via engagement of NKG2d rather than the TCR, and that cytolysis could thus be CD1d-independent.
Cytotoxicity mediated by NKT cells has also been associated with Fas/Fas ligand interactions (57). We investigated FasL (CD95L) expression by CD1d-restricted T cells after stimulation of PBMC samples with IL-2, IL-12, α-GalCer, or PMA/ionomycin. Because CD95L is rapidly cleaved from the cell surface by serum metalloproteinases (58), we used intracellular staining to detect expression. In unstimulated samples, there was little or no positive staining for CD95L among CD4− tetramer positive cells (mean = 1.9 ± 3.4%), but slightly more positive staining of the CD4+ subset (mean = 5.6 ± 5.2%). (Fig. 5, top panel). Treatment with α-GalCer, IL-2, or IL-12 did not enhance CD95L staining for either subset (data not shown). In contrast, after PMA/ionomycin stimulation a mean of 28 ± 19% of the CD4+ subset, and 7.5 ± 8.1% of the CD4− subset, were positive for CD95L (see Fig. 5, bottom panel). Hence, mainly CD4+ CD1d-restricted T cells could be induced to express CD95L, suggesting that regulatory functions mediated by Fas/FasL interactions may be performed mostly by the CD4+ CD1d-restricted subset in vivo.
CD1d-restricted T Cell Homing Receptors.
Elevated numbers of T cells expressing Vα24/JαQ TCRs have recently been demonstrated in two inflammatory sites, chronic inflammatory demyelinating polyneuropathy lesions and periodontitis lesions, suggesting CD1d-restricted T cells may migrate preferentially to areas of inflammation (59, 60). To investigate the possible destinations of CD1d-restricted T cells in peripheral blood, we stained for a series of homing and chemokine receptors. In contrast to cytokine production and perforin upregulation, chemokine and homing receptor expression did not correlate clearly with CD4 expression by CD1d tetramer positive cells (Table II). Most tetramer positive cells were negative for CD62L and CCR7, which are receptors involved in trafficking to lymph nodes (Table II). A fraction of the CD1d tetramer positive cells stained positively for the integrin α4β7, a molecule that is expressed on effector cells that home to the gut and associated lymphoid sites, and a fraction was positive for the CLA, which is associated with homing to skin (Table II). The tetramer positive cells were almost completely negative for the integrin αEβ7, which is expressed by intraepithelial lymphocytes and a small percentage of peripheral blood T cells (Table II). Two chemokine receptors that are associated with Th1 responses and migration to sites of inflammation, CCR5 and CXCR3, were expressed by large percentages of CD1d tetramer positive cells (Table II). Almost all tetramer positive cells stained positively for CXCR4, a chemokine receptor that recognizes a broadly distributed ligand, stromal cell–derived factor 1α. Hence, most CD1d tetramer positive cells in peripheral blood had a phenotype consistent with homing to peripheral tissues and recruitment to sites of inflammation.
Table II.
Chemokine and Homing Receptor Expression by CD1d Tetramer-stained T Cells
| Tetramer subset | CXCR3 | CCR5 | CXCR4 | CCR7 | CD62L | α4β7 | αEβ7 | CLA |
|---|---|---|---|---|---|---|---|---|
| CD4+ | 63 (16) | 51 (19) | 99 (0.6) | 16 (10) | 24 (20) | 28 (17) | 1 (0.6) | 14 (8.6) |
| CD4− | 44 (13) | 74 (17) | 99 (1.7) | 5.8 (8.0) | 11 (8.3) | 33 (29) | 0 (0) | 19 (16) |
| Negative | 47 (12) | 26 (14) | NA | NA | 53 (17) | 52 (11) | 1.3 (0.6) | 19 (6.3) |
The percentage of CD4+ and CD4− CD1d tetramer positive lymphocytes that stained positively for chemokine and homing receptors. For comparison, the percentage of CD1d tetramer negative T cells staining positively for each marker is also shown. The mean percentages of cells that stained positively are given first, with the standard deviations shown in parentheses. The results are compiled from three to five independent analyses of four healthy donors.
Conclusions.
Our results emphasize that CD1d-restricted T cells may be important cytolytic as well as cytokine-producing effector cells that migrate to peripheral sites of inflammation or immunological activity. A large percentage of the CD4− CD1d tetramer positive cells appeared to become primed for cytolytic function by exposure to IL-2 and IL-12, and this subset was also primarily oriented toward secretion of Th1 cytokines. Hence, CD4− CD1d-restricted T cells had characteristics associated with activation of cell-mediated effector functions and cytolysis, a profile resembling NK cells. Their up-regulation of perforin in response to inflammatory stimuli and expression of NKG2d suggests CD4− CD1d-restricted T cell may also resemble NK cells by performing cytolytic effector functions in antibacterial, antiviral, and antitumor immune responses.
In contrast, CD4+ CD1d-restricted T cells may be more oriented toward providing B cell help or immunoregulatory functions, as this subset accounted for almost all Th2 cytokine production by CD1d-restricted T cells, and could be induced to express CD95L. Based on their potent Th2 cytokine production, CD4+ CD1d-restricted T cells might be predicted to be responsible for the protective effect of NKT cells observed in autoimmune diabetes. An intriguing further possibility, however, is that CD4− CD1d-restricted T cells could play a pathogenic role in autoimmune disease by mediating cytotoxicity in response to inflammatory conditions, and/or by secreting Th1 cytokines in response to self antigen recognition.
We also show that antigenic- and cytokine-mediated stimulation can have profoundly different effects on CD1d-restricted T cells, and that the CD4− and CD4+ CD1d-restricted T cell populations respond differently to these stimuli. The principal APCs that have been found to express CD1d in humans are B cells and myeloid cells, in particular monocytes, macrophages, and dendritic cells (61, 62). Fresh B cells do not secrete IL-2 or IL-12, whereas monocytes can produce IL-12, and activated T cells may secrete IL-2 locally. Thus, our results suggest three potential functional outcomes for CD4− CD1d-restricted T cell activation: (i) those that recognize antigens presented by CD1d+ B cells may become activated for cytokine secretion but not cytotoxicity; (ii) those that receive antigenic stimulation from monocytes could be primed for cytolysis in addition to cytokine secretion; and (iii) exposure to IL-2, IL-12, or inflammatory agents such as LPS, in the absence of antigenic stimulation could lead to cytolytic activation without cytokine production. Hence, in addition to recognition of specific antigens, the type of APC and the local cytokine environment are likely to be critical factors that regulate the effector functions of CD1d-restricted T cells.
Acknowledgments
The authors would like to thank Kirin Brewery, Corp. for providing synthetic lipid antigens and Dr. Lewis Lanier for the DX1 and DX22 mAbs used in preliminary studies, and Carrie Morehouse for excellent technical assistance.
This work was supported by grant AI28973 from the National Institutes of Health (NIH) to M.B. Brenner, and by grants from the Ministry of Health, Labor, and Welfare in Japan and Japan Health Sciences Foundation to S. Miyake and T. Yamamura. J.E. Gumperz was supported by NIH grant T32-AI07306 and by a grant from The Medical Foundation, Charles A. King Trust.
Footnotes
Abbreviations used in this paper: α-GalCer, α-galactosylceramide; CLA, cutaneous lymphocyte antigen.
References
- 1.Porcelli, S.A., and R.L. Modlin. 1999. The CD1 system: antigen-presenting molecules for T cell recognition of lipids and glycolipids. Annu. Rev. Immunol. 17:297–329. [DOI] [PubMed] [Google Scholar]
- 2.Bendelac, A., O. Lantz, M.E. Quimby, J.W. Yewdell, J.R. Bennink, and R.R. Brutkiewicz. 1995. CD1 recognition by mouse NK1+ T lymphocytes. Science. 268:863–865. [DOI] [PubMed] [Google Scholar]
- 3.Exley, M., J. Garcia, S.P. Balk, and S. Porcelli. 1997. Requirements for CD1d recognition by human invariant Vα24+ CD4−CD8− T cells. J. Exp. Med. 186:109–120. [DOI] [PMC free article] [PubMed] [Google Scholar]
- 4.Chen, H., and W.E. Paul. 1997. Cultured NK1.1+ CD4+ T cells produce large amounts of IL-4 and IFN-γ upon activation by anti-CD3 or CD1. J. Immunol. 159:2240–2249. [PubMed] [Google Scholar]
- 5.Koseki, H., H. Asano, T. Inaba, N. Miyashita, K. Moriwaki, K.F. Lindahl, Y. Mizutani, K. Imai, and M. Taniguchi. 1991. Dominant expression of a distinctive V14+ T-cell antigen receptor α chain in mice. Proc. Natl. Acad. Sci. USA. 88:7518–7522. [DOI] [PMC free article] [PubMed] [Google Scholar]
- 6.Lantz, O., and A. Bendelac. 1994. An invariant T cell receptor α chain is used by a unique subset of major histocompatibility complex class I-specific CD4+ and CD4−8− T cells in mice and humans. J. Exp. Med. 180:1097–1106. [DOI] [PMC free article] [PubMed] [Google Scholar]
- 7.Behar, S.M., T.A. Podrebarac, C.J. Roy, C.R. Wang, and M.B. Brenner. 1999. Diverse TCRs recognize murine CD1. J. Immunol. 162:161–167. [PubMed] [Google Scholar]
- 8.Cardell, S., S. Tangri, S. Chan, M. Kronenberg, C. Benoist, and D. Mathis. 1995. CD1-restricted CD4+ T cells in major histocompatibility complex class II deficient mice. J. Exp. Med. 182:993–1004. [DOI] [PMC free article] [PubMed] [Google Scholar]
- 9.Chiu, Y.H., J. Jayawardena, A. Weiss, D. Lee, S.H. Park, A. Dautry-Varsat, and A. Bendelac. 1999. Distinct subsets of CD1d-restricted T cells recognize self-antigens loaded in different cellular compartments. J. Exp. Med. 189:103–110. [DOI] [PMC free article] [PubMed] [Google Scholar]
- 10.Park, S.-H., A. Weiss, K. Benlagha, T. Kyin, L. Teyton, and A. Bendelac. 2001. The mouse CD1d-restricted repertoire is dominated by a few autoreactive T cell receptor families. J. Exp. Med. 193:893–904. [DOI] [PMC free article] [PubMed] [Google Scholar]
- 11.Porcelli, S., D. Gerdes, A.M. Fertig, and S.P. Balk. 1996. Human T cells expressing an invariant V α24-JαQ TCR α are CD4− and heterogeneous with respect to TCR β expression. Hum. Immunol. 48:63–67. [DOI] [PubMed] [Google Scholar]
- 12.Exley, M.A., S.M. Tahir, O. Cheng, A. Shaulov, R. Joyce, D. Avigan, R. Sackstein, and S.P. Balk. 2001. A major fraction of human bone marrow lymphocytes are Th2-like CD1d− reactive T cells that can suppress mixed lymphocyte responses. J. Immunol. 167:5531–5534. [DOI] [PubMed] [Google Scholar]
- 13.Benlagha, K., A. Weiss, A. Beavis, L. Teyton, and A. Bendelac. 2000. In vivo identification of glycolipid antigen-specific T cells using fluorescent CD1d tetramers. J. Exp. Med. 191:1895–1903. [DOI] [PMC free article] [PubMed] [Google Scholar]
- 14.Matsuda, J.L., O.V. Naidenko, L. Gapin, T. Nakayama, M. Taniguchi, C.R. Wang, Y. Koezuka, and M. Kronenberg. 2000. Tracking the response of natural killer T cells to a glycolipid antigen using CD1d tetramers. J. Exp. Med. 192:741–754. [DOI] [PMC free article] [PubMed] [Google Scholar]
- 15.Assarsson, E., T. Kambayashi, J.K. Sandberg, S. Hong, M. Taniguchi, L. Van Kaer, H.G. Ljunggren, and B.J. Chambers. 2000. CD8+ T cells rapidly acquire NK1.1 and NK cell-associated molecules upon stimulation in vitro and in vivo. J. Immunol. 165:3673–3679. [DOI] [PubMed] [Google Scholar]
- 16.Kambayashi, T., E. Assarsson, J. Michaelsson, P. Berglund, A.D. Diehl, B.J. Chambers, and H.G. Ljunggren. 2000. Emergence of CD8+ T cells expressing NK cell receptors in influenza A virus-infected mice. J. Immunol. 165:4964–4969. [DOI] [PubMed] [Google Scholar]
- 17.Slifka, M.K., R.R. Pagarigan, and J.L. Whitton. 2000. NK markers are expressed on a high percentage of virus-specific CD8+ and CD4+ T cells. J. Immunol. 164:2009–2015. [DOI] [PubMed] [Google Scholar]
- 18.Gumperz, J.E., C. Roy, A. Makowska, D. Lum, M. Sugita, T. Podrebarac, Y. Koezuka, S.A. Porcelli, S. Cardell, M.B. Brenner, and S.M. Behar. 2000. Murine CD1d-restricted T cell recognition of cellular lipids. Immunity. 12:211–221. [DOI] [PubMed] [Google Scholar]
- 19.Apostolou, I., Y. Takahama, C. Belmant, T. Kawano, M. Huerre, G. Marchal, J. Cui, M. Taniguchi, H. Nakauchi, J.J. Fournie, et al. 1999. Murine natural killer T(NKT) cells (correction of natural killer cells) contribute to the granulomatous reaction caused by mycobacterial cell walls. Proc. Natl. Acad. Sci. USA. 96:5141–5146. [DOI] [PMC free article] [PubMed] [Google Scholar]
- 20.Kawano, T., J. Cui, Y. Koezuka, I. Toura, Y. Kaneko, K. Motoki, H. Ueno, R. Nakagawa, H. Sato, E. Kondo, et al. 1997. CD1d-restricted and TCR-mediated activation of vα14 NKT cells by glycosylceramides. Science. 278:1626–1629. [DOI] [PubMed] [Google Scholar]
- 21.Spada, F.M., Y. Koezuka, and S.A. Porcelli. 1998. CD1d-restricted recognition of synthetic glycolipid antigens by human natural killer T cells. J. Exp. Med. 188:1529–1534. [DOI] [PMC free article] [PubMed] [Google Scholar]
- 22.Shi, F.D., M. Flodstrom, B. Balasa, S.H. Kim, K. Van Gunst, J.L. Strominger, S.B. Wilson, and N. Sarvetnick. 2001. Germ line deletion of the CD1 locus exacerbates diabetes in the NOD mouse. Proc. Natl. Acad. Sci. USA. 98:6777–6782. [DOI] [PMC free article] [PubMed] [Google Scholar]
- 23.Mieza, M.A., T. Itoh, J.Q. Cui, Y. Makino, T. Kawano, K. Tsuchida, T. Koike, T. Shirai, H. Yagita, A. Matsuzawa, et al. 1996. Selective reduction of Vα14+ NK T cells associated with disease development in autoimmune-prone mice. J. Immunol. 156:4035–4040. [PubMed] [Google Scholar]
- 24.Sumida, T., A. Sakamoto, H. Murata, Y. Makino, H. Takahashi, S. Yoshida, K. Nishioka, I. Iwamoto, and M. Taniguchi. 1995. Selective reduction of T cells bearing invariant Vα24JαQ antigen receptor in patients with systemic sclerosis. J. Exp. Med. 182:1163–1168. [DOI] [PMC free article] [PubMed] [Google Scholar]
- 25.Cui, J., T. Shin, T. Kawano, H. Sato, E. Kondo, I. Toura, Y. Kaneko, H. Koseki, M. Kanno, and M. Taniguchi. 1997. Requirement for Vα14 NKT cells in IL-12-mediated rejection of tumors. Science. 278:1623–1626. [DOI] [PubMed] [Google Scholar]
- 26.Toura, I., T. Kawano, Y. Akutsu, T. Nakayama, T. Ochiai, and M. Taniguchi. 1999. Cutting edge: inhibition of experimental tumor metastasis by dendritic cells pulsed with α-galactosylceramide. J. Immunol. 163:2387–2391. [PubMed] [Google Scholar]
- 27.Kumar, H., A. Belperron, S.W. Barthold, and L.K. Bockenstedt. 2000. Cutting edge: CD1d deficiency impairs murine host defense against the spirochete, Borrelia burgdorferi. J. Immunol. 165:4797–4801. [DOI] [PubMed] [Google Scholar]
- 28.Hammond, K.J.L., L.D. Poulton, L.J. Palmisano, P.A. Silveira, D.I. Godfrey, and A.G. Baxter. 1998. α/β-Tcell receptor (TCR)+CD4−CD8− (NKT) thymocytes prevent insulin-dependent diabetes mellitus in nonobese diabetic (NOD) mice by the influence of IL-4 and/or IL-10. J. Exp. Med. 187:1047–1056. [DOI] [PMC free article] [PubMed] [Google Scholar]
- 29.Wilson, S.B., S.C. Kent, K.T. Patton, T. Orban, R.A. Jackson, M. Exley, S. Porcelli, D. Schatz, M.A. Atkinson, S.P. Balk, et al. 1998. Extreme Th1 bias of invariant Vα24JαQ T cells in type 1 diabetes. Nature. 391:177–181. [DOI] [PubMed] [Google Scholar]
- 30.Gonzalez-Aseguinolaza, G., C. de Oliveira, M. Tomaska, S. Hong, O. Bruna-Romero, T. Nakayama, M. Taniguchi, A. Bendelac, L. Van Kaer, Y. Koezuka, and M. Tsuji. 2000. α-galactosylceramide-activated Vα14 natural killer T cells mediate protection against murine malaria. Proc. Natl. Acad. Sci. USA. 97:8461–8466. [DOI] [PMC free article] [PubMed] [Google Scholar]
- 31.Kakimi, K., L.G. Guidotti, Y. Koezuka, and F.V. Chisari. 2000. Natural killer T cell activation inhibits hepatitis B virus replication in vivo. J. Exp. Med. 192:921–930. [DOI] [PMC free article] [PubMed] [Google Scholar]
- 32.Kawakami, K., Y. Kinjo, S. Yara, Y. Koguchi, K. Uezu, T. Nakayama, M. Taniguchi, and A. Saito. 2001. Activation of Vα14+ natural killer T cells by alpha-galactosylceramide results in development of Th1 response and local host resistance in mice infected with Cryptococcus neoformans. Infect. Immun. 69:213–220. [DOI] [PMC free article] [PubMed] [Google Scholar]
- 33.Ishihara, S., M. Nieda, J. Kitayama, T. Osada, T. Yabe, A. Kikuchi, Y. Koezuka, S.A. Porcelli, K. Tadokoro, H. Nagawa, and T. Juji. 2000. α-glycosylceramides enhance the antitumor cytotoxicity of hepatic lymphocytes obtained from cancer patients by activating CD3−CD56+ NK cells in vitro. J. Immunol. 165:1659–1664. [DOI] [PubMed] [Google Scholar]
- 34.Eberl, G., and H.R. MacDonald. 2000. Selective induction of NK cell proliferation and cytotoxicity by activated NKT cells. Eur. J. Immunol. 30:985–992. [DOI] [PubMed] [Google Scholar]
- 35.Altman, J.D., P.A.H. Moss, P.J.R. Goulder, D.H. Barouch, M.G. McHeyzer-Williams, J.I. Bell, A.J. McMichael, and M.M. Davis. 1996. Phenotypic analysis of antigen-specific T lymphocytes. Science. 274:94–96. [DOI] [PubMed] [Google Scholar]
- 36.Lin, A., B. Devaux, A. Green, C. Sagerström, J.F. Elliot, and M.M. Davis. 1990. Expression of T cell antigen receptor heterodimers in a lipid-linked form. Science. 249:677–679. [DOI] [PubMed] [Google Scholar]
- 37.Morita, M., T. Natori, K. Akimoto, T. Osawa, H. Fukushima, and Y. Koezuka. 1995. Synthesis of α-, β-monoglycosylceramides and four diastereomers of an α-galactosylceramide. Bioorg. Med. Chem. Lett. 5:699. [Google Scholar]
- 38.Langone, J.J., C. Das, R. Mainwaring, and W.T. Shearer. 1985. Complexes prepared from protein A and human serum, IgG, or Fcγ fragments: characterization by immunochemical analysis of ultracentrifugation fractions and studies on their interconversion. Mol. and Cell. Biochem. 65:159–170. [DOI] [PubMed] [Google Scholar]
- 39.Karadimitris, A., S. Gadola, M. Altamirano, D. Brown, A. Woolfson, P. Klenerman, J.L. Chen, Y. Koezuka, I.A. Roberts, D.A. Price, et al. 2001. Human CD1d-glycolipid tetramers generated by in vitro oxidative refolding chromatography. Proc. Natl. Acad. Sci. USA. 98:3294–3298. [DOI] [PMC free article] [PubMed] [Google Scholar]
- 40.Chang, C.S., L. Brossay, M. Kronenberg, and K.P. Kane. 1999. The murine nonclassical class I major histocompatibility complex-like CD1.1 molecule protects target cells from lymphokine-activated killer cell cytolysis. J. Exp. Med. 189:483–491. [DOI] [PMC free article] [PubMed] [Google Scholar]
- 41.Carbone, E., G. Terrazzano, A. Melian, D. Zanzi, L. Moretta, S. Porcelli, K. Karre, and S. Zappacosta. 2000. Inhibition of human NK cell-mediated killing by CD1 molecules. J. Immunol. 164:6130–6137. [DOI] [PubMed] [Google Scholar]
- 42.Lanier, L.L., C. Chang, and J.H. Phillips. 1994. Human NKR-P1A. A disulfide-linked homodimer of the C-type lectin superfamily expressed by a subset of NK and T lymphocytes. J. Immunol. 153:2417–2428. [PubMed] [Google Scholar]
- 43.Carnaud, C., D. Lee, O. Donnars, S.H. Park, A. Beavis, Y. Koezuka, and A. Bendelac. 1999. Cutting edge: Cross-talk between cells of the innate immune system: NKT cells rapidly activate NK cells. J. Immunol. 163:4647–4650. [PubMed] [Google Scholar]
- 44.Burdin, N., L. Brossay, and M. Kronenberg. 1999. Immunization with α-galactosylceramide polarizes CD1-reactive NK T cells towards Th2 cytokine synthesis. Eur. J. Immunol. 29:2014–2025. [DOI] [PubMed] [Google Scholar]
- 45.Nishimura, T., H. Kitamura, K. Iwakabe, T. Yahata, A. Ohta, M. Sato, K. Takeda, K. Okumura, L. Van Kaer, T. Kawano, et al. 2000. The interface between innate and acquired immunity: glycolipid antigen presentation by CD1d-expressing dendritic cells to NKT cells induces the differentiation of antigen-specific cytotoxic T lymphocytes. Int. Immunol. 12:987–994. [DOI] [PubMed] [Google Scholar]
- 46.Singh, N., S. Hong, D.C. Scherer, I. Serizawa, N. Burdin, M. Kronenberg, Y. Koezuka, and L. Van Kaer. 1999. Cutting edge: activation of NK T cells by CD1d and α-galactosylceramide directs conventional T cells to the acquisition of a Th2 phenotype. J. Immunol. 163:2373–2377. [PubMed] [Google Scholar]
- 47.Van Der Vliet, H.J., N. Nishi, Y. Koezuka, M.A. Peyrat, B.M. Von Blomberg, A.J. Van Den Eertwegh, H.M. Pinedo, G. Giaccone, and R.J. Scheper. 1999. Effects of α-galactosylceramide (KRN7000), interleukin-12 and interleukin-7 on phenotype and cytokine profile of human Vα24+ Vβ11+ T cells. Immunology. 98:557–563. [DOI] [PMC free article] [PubMed] [Google Scholar]
- 48.Nicol, A., M. Nieda, Y. Koezuka, S. Porcelli, K. Suzuki, K. Tadokoro, S. Durrant, and T. Juji. 2000. Human invariant vα24+ natural killer T cells activated by α-galactosylceramide (KRN7000) have cytotoxic anti-tumour activity through mechanisms distinct from T cells and natural killer cells. Immunology. 99:229–234. [DOI] [PMC free article] [PubMed] [Google Scholar]
- 49.Kitamura, H., K. Iwakabe, T. Yahata, S. Nishimura, A. Ohta, Y. Ohmi, M. Sato, K. Takeda, K. Okumura, L. Van Kaer, et al. 1999. The natural killer T (NKT) cell ligand α-galactosylceramide demonstrates its immunopotentiating effect by inducing interleukin (IL)-12 production by dendritic cells and IL-12 receptor expression on NKT cells. J. Exp. Med. 189:1121–1128. [DOI] [PMC free article] [PubMed] [Google Scholar]
- 50.Hafner, M., W. Falk, B. Echtenacher, and D.N. Mannel. 1999. Interleukin-12 activates NK cells for IFN-γ-dependent and NKT cells for IFN-γ-independent antimetastatic activity. Eur. Cytokine Netw. 10:541–548. [PubMed] [Google Scholar]
- 51.Bauer, S., V. Groh, J. Wu, A. Steinle, J.H. Phillips, L.L. Lanier, and T. Spies. 1999. Activation of NK cells and T cells by NKG2D, a receptor for stress-inducible MICA. Science. 285:727–729. [DOI] [PubMed] [Google Scholar]
- 52.Diefenbach, A., A.M. Jamieson, S.D. Liu, N. Shastri, and D.H. Raulet. 2000. Ligands for the murine NKG2D receptor: expression by tumor cells and activation of NK cells and macrophages. Nat. Immunol. 1:119–126. [DOI] [PubMed] [Google Scholar]
- 53.Groh, V., R. Rhinehart, J. Randolph-Habecker, M.S. Topp, S.R. Riddell, and T. Spies. 2001. Costimulation of CD8αβ T cells by NKG2D via engagement by MIC induced on virus-infected cells. Nat. Immunol. 2:255–260. [DOI] [PubMed] [Google Scholar]
- 54.Das, H., V. Groh, C. Kuijl, M. Sugita, C.T. Morita, T. Spies, and J.F. Bukowski. 2001. MICA engagement by human Vγ2Vδ2 T cells enhances their antigen-dependent effector function. Immunity. 15:83–93. [DOI] [PubMed] [Google Scholar]
- 55.Kawano, T., J. Cui, Y. Koezuka, I. Toura, Y. Kaneko, H. Sato, E. Kondo, M. Harada, H. Koseki, T. Nakayama, et al. 1998. Natural killer-like nonspecific tumor cell lysis mediated by specific ligand-activated Vα14 NKT cells. Proc. Natl. Acad. Sci. USA. 95:5690–5693. [DOI] [PMC free article] [PubMed] [Google Scholar]
- 56.Smyth, M.J., K.Y. Thia, S.E. Street, E. Cretney, J.A. Trapani, M. Taniguchi, T. Kawano, S.B. Pelikan, N.Y. Crowe, and D.I. Godfrey. 2000. Differential tumor surveillance by natural killer (NK) and NKT cells. J. Exp. Med. 191:661–668. [DOI] [PMC free article] [PubMed] [Google Scholar]
- 57.Arase, H., N. Arase, Y. Kobayashi, Y. Nishimura, S. Yonehara, and K. Onoe. 1994. Cytotoxicity of fresh NK1.1+ T cell receptor α/β1 thymocytes against a CD4+8+ thymocyte population associated with intact Fas antigen expression on the target. J. Exp. Med. 180:423–432. [DOI] [PMC free article] [PubMed] [Google Scholar]
- 58.Kayagaki, N., A. Kawasaki, T. Ebata, H. Ohmoto, S. Ikeda, S. Inoue, K. Yoshino, K. Okumura, and H. Yagita. 1995. Metalloproteinase-mediated release of human Fas ligand. J. Exp. Med. 182:1777–1783. [DOI] [PMC free article] [PubMed] [Google Scholar]
- 59.Illes, Z., T. Kondo, J. Newcombe, N. Oka, T. Tabira, and T. Yamamura. 2000. Differential expression of NK T cell Vα24Jα Q invariant TCR chain in the lesions of multiple sclerosis and chronic inflammatory demyelinating polyneuropathy. J. Immunol. 164:4375–4381. [DOI] [PubMed] [Google Scholar]
- 60.Yamazaki, K., Y. Ohsawa, and H. Yoshie. 2001. Elevated proportion of natural killer T cells in periodontitis lesions: a common feature of chronic inflammatory diseases. Am. J. Pathol. 158:1391–1398. [DOI] [PMC free article] [PubMed] [Google Scholar]
- 61.Spada, F.M., F. Borriello, M. Sugita, G.F. Watts, Y. Koezuka, and S.A. Porcelli. 2000. Low expression level but potent antigen presenting function of CD1d on monocyte lineage cells. Eur. J. Immunol. 30:3468–3477. [DOI] [PubMed] [Google Scholar]
- 62.Exley, M., J. Garcia, S.B. Wilson, F. Spada, D. Gerdes, S.M.A. Tahir, K.T. Patton, R.S. Blumberg, S. Porcelli, A. Chott, and S.P. Balk. 2000. CD1d structure and regulation on human thymocytes, peripheral blood T cells, B cells and monocytes. Immunology. 100:37–47. [DOI] [PMC free article] [PubMed] [Google Scholar]