Abstract
The life history of isotype-switched B cells is unclear, in part, because of an inability to detect rare antigen-specific B cells at early times during the immune response. To address this issue, a small population of B cells carrying targeted antibody transgenes capable of class switching was monitored in immunized mice. After contacting helper T cells, the first switched B cells appeared in follicles rather than in the red pulp, as was expected. Later, some of the switched B cells transiently occupied the red pulp and marginal zone, whereas others persisted in germinal centers (GCs). Antigen-experienced IgM B cells were rarely found in GCs, indicating that these cells switched rapidly after entering GCs or did not persist in this environment.
Keywords: lymphocyte activation, marginal zone, T cells, transgenic mice, germinal centers
Introduction
IgG, IgA, and IgE antibodies participate in elimination of microbes from the host by activating complement and promoting phagocytosis. These antibodies are created when naive IgM+, IgD+ B cells undergo H chain isotype switch recombination, which involves a DNA deletion between switch regions upstream of the γ, α, or ɛ H chain constant exons (1). The accessibility of the recombinase to a particular switch region is correlated with germline transcription and splicing (2–5), whereas the recombination process itself is thought to be initiated by the activity of activation-induced cytidine deaminase (6, 7). Signals promoting germline transcription are regulated in vivo by cell interactions and secreted cytokines (8). Thus, although some switch recombination can occur in response to certain polyvalent antigens in a T cell–independent fashion, switching is greatly facilitated by cognate interactions with antigen-specific CD4 helper T cells (9).
In situ detection of antigen-specific B cells has revealed several aspects of CD4 T cell–dependent B cell activation and isotype switching. Naive IgM+, IgD+ B2 cells circulate through the B cell–rich follicles of secondary lymphoid tissues (10). After exposure to antigen, antigen-binding IgM+, IgD+ B cells migrate from random positions within the follicles to the border between the follicles and T cell–rich areas (11–13), where cognate interactions with antigen-specific CD4 T cells can occur (14). The B cells proliferate and foci of antibody-secreting plasmablasts, some of which contain isotype-switched antibodies, appear at the border between the T cell areas and the red pulp of the spleen, 6–8 d after immunization (11, 15). Shortly after the foci appear, clusters of isotype-switched B cells that stain with the PNA lectin appear in germinal centers (GCs;* reference 15) within the areas of the follicles occupied by follicular dendritic cells (16). B cells expressing B cell receptors (BCRs) consisting of the same germline VH and VL segments are present in the foci and GCs (17). However, those within the GCs contain somatic mutations in their BCRs, whereas those within the foci do not (18, 19). Because long-lived memory B cells contain somatic mutations (20), and because somatic mutations are thought to occur primarily in GCs (18, 21), it is thought that all memory B cells are derived from GCs.
These results have led to the current model in which antigen-specific B cells receive signals from CD4 helper T cells at the T cell–area follicle border, proliferate there and either migrate to the outer T cell area near the red pulp, differentiate into plasmablasts, and undergo isotype switching; or migrate to the GCs and undergo somatic mutation and isotype switching there. One limitation of this model is that the aspects related to isotype switching are based on studies in which rare antigen-specific B cells could only be detected after clonal expansion. Thus, critical events in the isotype switching process that occur before antigen-specific B cells undergo extensive proliferation could have been missed. This possibility is addressed here with a novel adoptive transfer system in which isotype switching by initially naive antigen-specific B cells can be monitored in situ before B cell clonal expansion.
Materials and Methods
Mice.
All transgenic mice were bred in a pathogen-free facility according to National Institutes of Health guidelines. The DO11.10 TCR transgenic B10.D2nSn/J mice (22) were obtained from Dr. T. Mitchell (National Jewish Medical Center, Denver, CO). 3-83 IgM/D transgenic B10.D2nSn/J mice (23) and 3-83 knockin homozygous (KIH) mice (24, 25) were produced at the National Jewish Medical Center. The OT-II TCR transgenic C57BL/6 mice (26) were provided by Dr. L. Lefrancois (University of Connecticut, Farmington, CT) and crossed to C57BL/6.PL mice. The anti–hen egg lysozyme (HEL) KIH mice were produced by crossing anti-HEL H chain knockin mice, generated in 129 embryonic stem cells by introducing the VDJ gene segment from the HyHEL10 antibody into the H chain locus in place of Jh1–4 (unpublished results), with anti-HEL L chain mice (27) until they were homozygous at the H chain and heterozygous at the L chain loci. Approximately 80% of the splenic B220+ cells from anti-HEL KIH mice expressed HEL-binding IgM at similar levels to the splenic B cells in HEL-Ig MD4 transgenic mice (28; unpublished data). B10.D2nSn/J, C57BL/6, and 129 × C57BL/6 F1 recipient mice were purchased from The Jackson Laboratory and maintained in a conventional facility.
Immunization.
An OVA-mim was produced by inserting three tandem OVA 323–339 epitopes and the 17-amino acid mimotope peptide in frame into the pIII protein of M13, and purified as described previously (29). Purified OVA-mim, containing 20 μg pIII protein, was injected intravenously. A chemical conjugate (OVA–DEL) between OVA (Sigma-Aldrich) and duck egg lysozyme (DEL; Worthington Biochemical Corporation) was prepared with glutaraldehyde and purified as described previously (14). 12.5 μg OVA–DEL was mixed with 25 μg LPS and injected intravenously.
Adoptive Transfer.
Lymph node and spleen cell suspensions from DO11.10 or OT-II TCR transgenic donors and 3-83 IgM/D, 3-83 KIH, or anti-HEL KIH transgenic donors were prepared for adoptive transfer as described previously (30). In some experiments, 3-83 IgM/D or 3-83 KIH cell suspensions were labeled with 5 μM carboxyfluorescein diacetate succinimidyl ester (CFSE; Molecular Probes) as described previously (31, 32).
Lymph node and/or spleen cells containing a mixture of 2.5 × 10⁶ TCR transgenic T cells and 7.5 × 10⁶ BCR transgenic B cells were injected into the tail veins of recipient mice. DO11.10 T cells and 3-83 KIH B cells were transferred into B10.D2 recipients. For analysis of early times after immunization (days 2 and 4), OT-II T cells and anti-HEL KIH B cells were transferred into C57BL/6 recipients. For analysis of later times (day 11), OT-II T cells and anti-HEL KIH B cells were transferred into 129 C57BL/6 F1 recipients. Because the anti-HEL KIH mice were on a mixed C57BL/6 and 129 background, use of the F1 recipients prevented rejection of the anti-HEL KIH B cells (which becomes prominent after day 4) due to minor histocompatibility antigen differences.
CD4 T cells were depleted by an intraperitoneal injection of 1 mg anti-CD4 mAb (GK1.5; American Type Culture Collection) 2 d before immunization.
ELISA.
Sera were titrated in 96-well plates (Costar) coated with 20 μg/ml S23 mAb specific for 3-83 Ig (unpublished data) and blocked with 1% BSA. Plate-bound Ig was revealed by incubating the wells sequentially with biotinylated anti-IgMa or anti-IgG2aa (both from BD Biosciences), horseradish peroxidase (HRP)–labeled streptavidin (Sigma-Aldrich), and the chromagen 2,2′-azido-bis (3-ethylbenz-thiazoline-6-sulfonic acid) (Sigma-Aldrich). The titer at half the maximal OD was calculated for each sample.
Flow Cytometry.
Explanted spleens were injected with, and minced in, a solution containing 400 U/ml collagenase (Boehringer). After a 15-min incubation at 37°C, 1 ml 100 mM EDTA was added for 5 min, followed by 8 ml 5 mM EDTA in EHAA (Biosource International). The tissue fragments were mashed, passed through a fine mesh, washed, and were resuspended in culture supernatant containing 24G2 mAb (American Type Culture Collection) plus 1% mouse serum (Sigma-Aldrich) and 1% rat serum (Sigma-Aldrich) to block Fc receptors.
The resulting cell suspensions were incubated with fluorochrome-labeled antibodies (from BD Biosciences unless otherwise indicated) to detect transferred TCR or BCR transgenic cells. DO11.10 or OT-II T cells were detected with PE-labeled anti-CD4 and FITC-labeled KJ1–26 (Caltag) or CyChrome-labeled anti-CD4, PE-labeled anti-Vα2, and FITC-labeled anti-Thy1.1, respectively. Suspensions containing 3-83 KIH B cells were incubated with FITC-labeled S23 or FITC-labeled anti-IgMa, and antibodies specific for endogenous cells (PE-labeled anti-Thy1.2, Gr-1, anti-IgMb, and F480; Caltag). The cells were fixed with 2% formaldehyde, permeabilized with 0.5% saponin (Sigma-Aldrich), and were incubated with biotinylated anti-IgMa or IgG2aa followed by PerCP-labeled streptavidin. The 3-83 KIH B cells were identified as FITC+, PerCP+, and PE− events.
3-83 KIH B cells were phenotyped by staining with allophycocyanin-labeled anti-B220, FITC-labeled S23, and PE-labeled antisyndecan; or PE-labeled anti-B220 and FITC-labeled GL-7, FITC-labeled anti-CD38, or FITC-labeled anti–I-Ad. The cells were fixed, permeabilized, and stained with PerCP-labeled anti-IgMa or IgG2aa as described in previous paragraphs.
The anti-HEL KIH B cells were detected with 50 μg/ml HEL (Sigma-Aldrich), allophycocyanin-labeled anti-B220, FITC-labeled GL7 or anti-CD38, and biotinylated anti-HEL (33), followed by PE-labeled streptavidin (Caltag). The cells were fixed, permeabilized, and stained with PerCP-labeled anti-IgMa or -IgG2aa as described in previous paragraphs.
Immunofluorescence.
6-μm cryosections were dehydrated in acetone and blocked with 1% H2O2, culture supernatant containing 24G2 mAb plus 1% mouse and 1% rat serum, and avidin–biotin-blocking reagents (Vector). When multiple antigens were detected with biotinylated Abs on the same section, the staining was done sequentially, with 1% H2O2 and avidin–biotin-blocking performed between each antigen. The DO11.10 T cells were detected with digoxygenin-labeled KJ1–26, followed by HRP-conjugated anti-digoxygenin (Boehringer) and TSA-direct Cy3-tyramide (NEN Life Science Products) according to the manufacturer's directions. OT-II T cells were detected with biotinylated anti-Thy1.1, followed by HRP-conjugated streptavidin (NEN Life Science Products) and TSA-direct Cy3-tyramide. The 3-83 and anti-HEL KIH B cells were detected with biotinylated anti-IgMa or -IgG2aa followed by HRP-conjugated streptavidin and TSA-direct Cy5-tyramide or TSA-indirect biotinyl-tyramide (NEN Life Science Products) and Cy5-labeled streptavidin (Zymed Laboratories). M13 bacteriophage was detected with biotinylated anti-phage Ab (Sigma-Aldrich) followed by HRP-labeled streptavidin (NEN Life Science Products), TSA-indirect biotinyl-tyramide (NEN Life Science Products), and Cy5-conjugated streptavidin (Zymed Laboratories). PNA+ cells were detected with biotinylated PNA (Vector) followed by HRP-labeled streptavidin and TSA-direct Cy3-tyramide. Endogenous B220+ B cells were detected with FITC-labeled anti-B220 mAb. Alternatively, endogenous B220+ B cells were revealed with PE-labeled anti-B220 and IgD+ cells were revealed with FITC-labeled anti-IgD mAb. Slides were analyzed with a confocal microscope.
Results
Adoptive Transfer Model to Follow B Cell Activation and Isotype Switching In Vivo.
To monitor early in vivo events in the cell biology of class switching, small populations of CD4 T and B cells from Ag receptor transgenic mice were transferred into histocompatible normal recipients, which were immunized with cognate antigen. CD4 T cells specific for chicken OVA peptide 323–339–I-Ad complexes were obtained from DO11.10 TCR transgenic B10.D2 mice (22), and were identified with the anti-clonotypic mAb, KJ1–26 (34). B cells were obtained from 3-83 KIH mice that express an IgMa BCR specific for the H-2Kk MHC class I molecule (35, 36) or a mimotope peptide identified from a random peptide library (29). The 3-83 KIH B cells were tracked with an anti-idiotypic mAb, S23, and mAbs specific for the IgMa or IgG2aa allotypic determinants present in 3-83 KIH Ig H chains but not in the Ig H chains of the B10.D2 recipient mice. A bacteriophage containing linked epitopes (OVA-mim) that could be recognized by both the DO11.10 T cells and 3-83 B cells was used as an immunogen. Purified OVA-mim was injected intravenously to mimic a blood-borne antigen, such as a virus, which would be composed of multiple copies of a coat protein containing a T and B cell epitope.
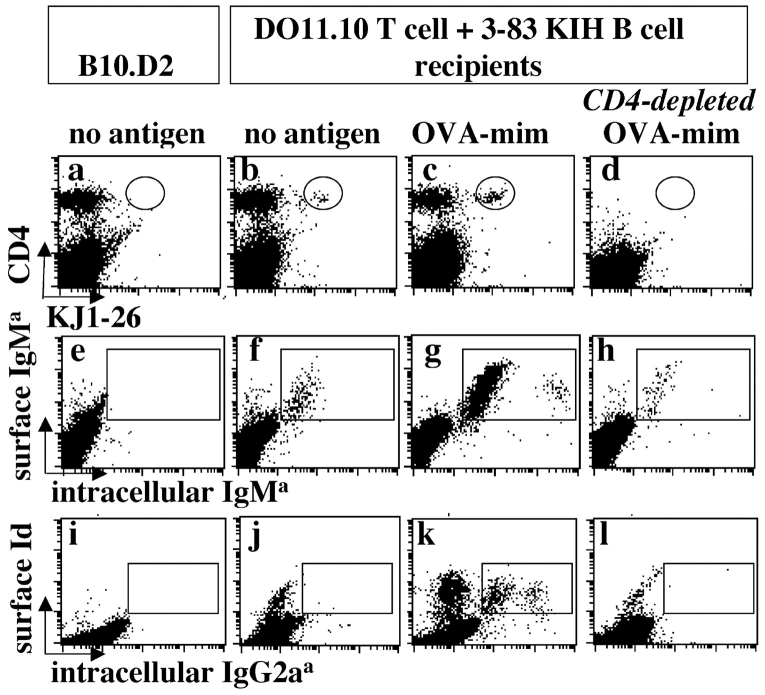
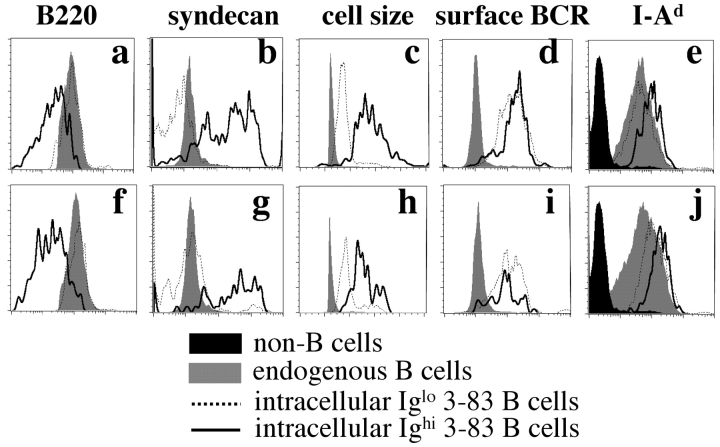
Flow cytometry revealed that the transferred B and T cells were activated after injection of OVA-mimotope bacteriophage. Small populations of DO11.10 T cells and 3-83 KIH IgM B cells, which were not present in untransferred animals (Fig. 1 , a and e), were detected in the spleens of recipient mice (Fig. 1, b and f) after transfer. 3-83 KIH IgG2a B cells were not detected in unimmunized recipient mice (Fig. 1 j). Injection of the recipient mice with OVA-mim resulted in a striking increase in the number of DO11.10 T cells and 3-83 KIH IgM B cells in the spleen 4 d later (Fig. 1, c and g), and was accompanied by the appearance of 3-83 KIH IgG2a B cells (Fig. 1 k). The antigen-stimulated populations of 3-83 KIH IgM and IgG2a B cells contained cells expressing either low or high levels of intracellular Ig (Fig. 1, g and k). The cells expressing high levels of IgM (Fig. 2 , a–e) or IgG2a (Fig. 2, f–j) were plasmablasts or plasma cells, as evidenced by their large size, low expression of B220, and high expression of syndecan.
Figure 1.
Detection of transgenic lymphocytes. Normal mice or recipients of DO11.10 T cell and 3-83 KIH B cells mice were left untreated or depleted of CD4 T cells. Spleen suspensions were analyzed by flow cytometry 4 d after immunization with OVA-mim. (a–d) CD4+, KJ1–26+, and DO11.10 T cells (circled region); (e and f) surface IgMa+, intracellular IgMa+ 3-83 KIH B cells (boxed region); or (i–l) surface idiotype+ (Id) and intracellular IgG2aa+ 3-83 KIH B cells (boxed) are shown in the dot plots.
Figure 2.
Phenotype of 3-83 KIH B cells. DO11.10 T cell and 3-83 KIH B cell recipients were immunized with OVA-mim. Spleen suspensions were analyzed by flow cytometry 4 d after immunization. Histogram plots for the indicated markers on B cells of recipient origin (gray histograms), non-B cells (black histograms), or Ighigh (solid line) or Iglow (dotted line) 3-83 KIH IgMa (a–e) and IgG2aa cells (f–j) are shown.
It was important to assess the T cell dependence of the 3-83 response to the OVA-mim because viruses and bacteria that display repetitive antigens induce both T cell–independent and –dependent B cell responses (9). In fact, OVA-mimotope bacteriophage can activate 3-83 B cells in the absence of T cells, perhaps owing to their epitope multivalency (37). As shown in Fig. 1, elimination of CD4 T cells, including the transferred DO11.10 T cells (Fig. 1 d), greatly diminished the expansion of 3-83 IgM B cells (Fig. 1 h), and completely inhibited the appearance of 3-83 IgG2a B cells (Fig. 1 l) in mice 4 d after injection with the OVA-mimotope bacteriophage, indicating that these responses were T cell–dependent.
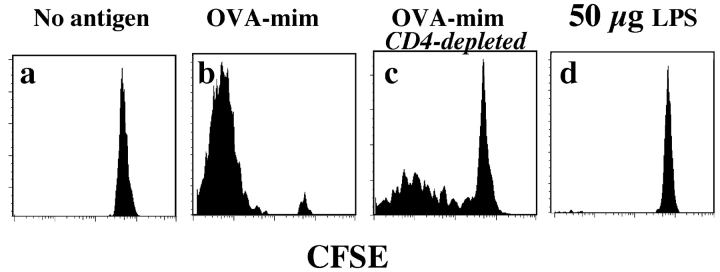
The T cell–independent component of the B cell response to OVA-mim was revealed with the more sensitive CFSE dye dilution assay. Naive 3-83 IgM/D B cells did not divide in unimmunized mice (Fig. 3 a), whereas virtually all of the 3-83 IgM/D B cells in recipients that contained DO11.10 T cells divided many times by day 4 after OVA-mim injection, as evidenced by nearly complete loss of CFSE (Fig. 3 b). In addition, a subset of the 3-83 IgM/D B cells divided in CD4 T cell–depleted recipients that were injected with OVA-mim. This proliferation was Ag-dependent and specific because it was not observed in mice 4 d after injection of wild-type bacteriophage (unpublished data) or LPS alone (Fig. 3 d). Thus, OVA-mim induced T cell–dependent clonal expansion and isotype switching to IgG2a, and like many natural antigens, also induced some T cell–independent B cell proliferation.
Figure 3.
Proliferation of 3-83 IgM B cells in CD4 T cell–depleted mice. Recipients of DO11.10 T cell and 3-83 IgM/D CFSE-labeled B cells were left untreated or depleted of CD4 T cells. CFSE levels in the transferred B220+, S23+ B cells in spleens were analyzed by flow cytometry 4 d after the indicated intravenous injection.
The Kinetics of Early B Cell Activation and Isotype Switching.
The transferred B cells underwent rapid isotype switching. As early as day 2 after injection of OVA-mim, the number of 3-83 IgM B cells in the spleen increased over the starting level, and 3-83 IgG2a B cells containing low levels of intracellular Ig were detected for the first time (Fig. 4 a). The expansion of 3-83 IgM and IgG2a B cells peaked on days 3 and 4 and declined thereafter. The 3-83 IgMhigh plasmablasts, which appeared on day 2 and peaked on day 3, became undetectable by day 6 (Fig. 4 b). The 3-83 IgG2ahigh plasmablasts did not begin to accumulate until day 3, and were undetectable by day 10 (Fig. 4 b). The appearance of these Ighigh plasmablasts in the spleen correlated with the presence of mimotope-specific IgM and IgG2a in the serum (Fig. 4 c). The persistence of antigen-specific IgG2a antibodies in the serum after the disappearance of the IgG2a plasmablasts was probably related to the long serum half-life of IgG2a (38), or the migration of plasma cells to other sites, such as bone marrow or gut (39).
Figure 4.
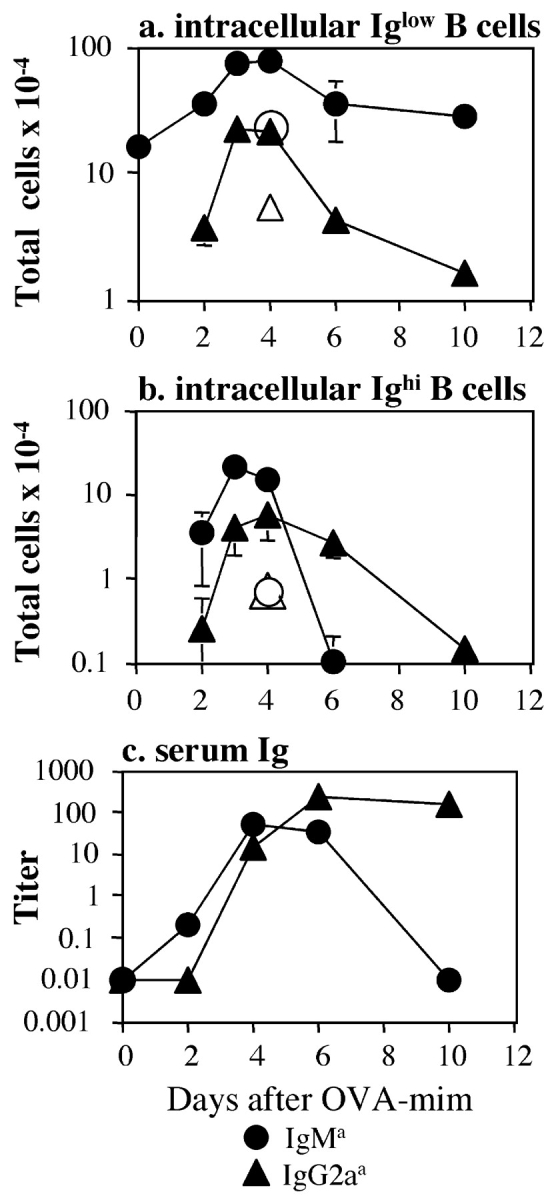
Kinetics of 3-83 B cell clonal expansion. (a and b) DO11.10 T cell and 3-83 KIH B cell recipients (shaded symbols) or 3-83 KIH B cell recipients alone (open symbols) were immunized with OVA-mim. At the indicated times after immunization, 3-83 KIH IgMa (circles) and IgG2aa (triangles) B cells in the spleen that expressed low (a) or high (b) levels of intracellular Ig were measured by flow cytometry. The total number of each B cell population was obtained by multiplying the frequency of the 3-83 B cell population by the total number of lymphocytes in the spleen. Each point represents the mean ± SEM from two to four mice. (c) Serum was collected from immunized recipients of DO11.10 T cells at the indicated times and analyzed for 3-83 Ig of the IgMa (circles) or IgG2aa (triangles) isotype by ELISA. Each point represents an individual mouse. The graph is representative of three independent experiments.
The majority of the 3-83 IgM B cell expansion and IgG2a switching was dependent on the DO11.10 T cells because 5–10-fold fewer 3-83 IgM and IgG2a B cells were generated in mice that received only 3-83 B cells (Fig. 4, a and b, open symbols). In addition, because 3-83 IgG2a B cells could not be detected in CD4 T cell–depleted mice injected with OVA-mim (Fig. 1 l), the appearance of small numbers of 3-83 IgG2a B cells in mice that received only 3-83 KIH B cells was likely due to the helper activity of endogenous bacteriophage-specific CD4 T cells.
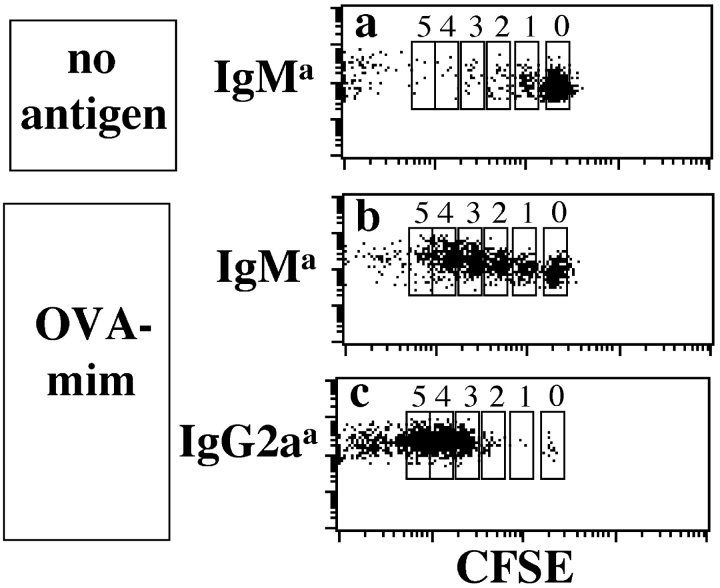
The cell division history of the early isotype-switched B cells was investigated because in vitro studies have shown that isotype switching correlates with cell division (40–42). As expected, the majority of naive 3-83 IgM cells in unimmunized recipients retained large amounts of CFSE (Fig. 5 a). 48 h after injection of OVA-mim, 98% of the 3-83 IgG2a B cells showed decreased levels of CFSE, indicative of three or more cell divisions (Fig. 5 c). This profile is consistent with the cell division time of 4–8 h reported for B cell centroblasts (43). In contrast, many of the 3-83 IgM B cells present at this time had undergone zero, one, or two divisions (Fig. 5 b). Therefore, 3-83 IgG2a B cells proliferated to a greater extent than the 3-83 IgM B cells, demonstrating an in vivo correlation between isotype switching and cell division.
Figure 5.
Proliferation of 3-83 B cells 2 d after immunization. Recipients of DO11.10 T cells and CFSE-dyed 3-83 KIH B cells were not treated or immunized with OVA-mim. Intracellular staining was used to detect 3-83 KIH IgMa and IgG2aa B cells in spleen suspensions prepared 48 h after immunization. The dot plots show the CFSE dye levels on indicated 3-83 KIH B cells populations. The data are representative of three independent experiments.
Antigen-specific IgG2a B Cells First Appear in Follicles.
In situ studies were performed to identify the location of isotype switching in the spleen using mAbs specific for the IgMa or IgG2aa allotypic determinants present in 3-83 KIH Ig H chains and a sensitive in situ immunofluorescence detection method (44). In naive recipients, scattered 3-83 IgM B cells and DO11.10 T cells were found in the B cell–rich follicles and periarteriolar lymphoid sheaths (PALS) of each splenic white pulp cord, respectively (Fig. 6 a). 1 d after injection of OVA-mim, the 3-83 B and DO11.10 T cells increased slightly in number, and interactions between some of these cells were observed (Fig. 6, d and inset p) at the border between the follicles and PALS, as expected (14). Consistent with the flow cytometry findings, 3-83 IgG2a B cells were not detected until 2 d after immunization (Fig. 6, b, e, and h, and inset q). These first switched cells were located in B cell follicles rather than PALS foci, as expected based on previous work (11, 15). The majority of the switched B cells were apparently not in contact with DO11.10 T cells. Thus, the earliest detected switched B cells, which had divided at least three times (Fig. 5), appeared to have already migrated away from DO11.10 T cells. Importantly, this T cell–dependent IgG2a switching appeared to occur before detectable GC formation in the follicles.
Figure 6.
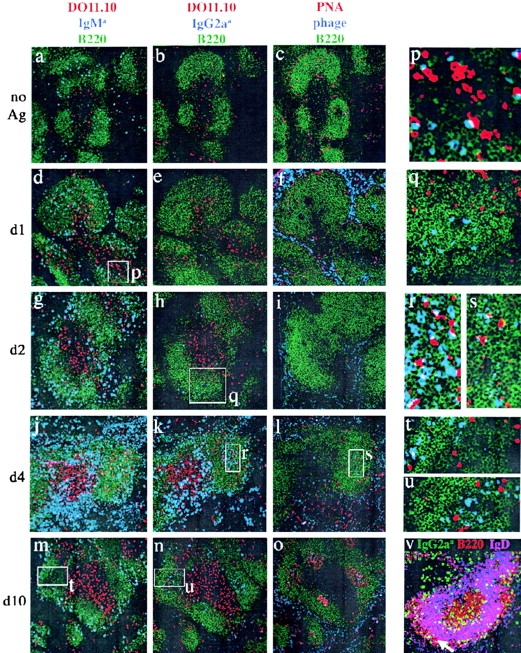
In situ localization of 3-83 B cells. Adjacent spleen sections from DO11.10 T cell and 3-83 KIH B cell recipient mice before immunization (a–c), or 1 d (d–f, and inset p), 2 d (g–i, and inset q), 4 d (j–l, close-ups r and s), or 10 d (m–o, insets t and u) after immunization with OVA-mim were stained and analyzed by confocal microscopy. B220 staining (green) identifies the B cell regions in a–u. The DO11.10 T cells appear red in a, b, d, e, g, h, j, k, m, n, p–r, t, and u. 3-83 KIH IgM cells appear blue in a, d, g, j, m, p, and t. 3-83 KIH IgG2a cells appear blue in b, e, h, k, n, q, r, and u. PNA appears red and bacteriophage blue in c, f, i, l, o, and s. In v, 3-83 KIH IgG2a cells appear green, cells that coexpress B220 and IgD appear purple, and cells that express B220 alone appear red. Arrow points to the marginal zone in v.
Antigen-specific B Cells Form Anatomically Distinct Populations of Plasmablasts, Pre-GC Cells, and Marginal Zone Cells.
Immunohistochemistry identified further heterogeneity of B cell phenotype and location as the immune response progressed. At the peak of clonal expansion on day 4, the 3-83 IgG2a B cells, and to a lesser extent the 3-83 IgM B cells, occupied three locations (Fig. 6, j–l). One population, located in the outer edges of the PALS near the red pulp, contained large amounts of Ig (as evidenced by intense staining with anti-Ig), and, thus, was probably the intracellular Ighigh population detected by flow cytometry. These cells were likely the equivalents of the PALS foci described in previous work (11, 15). Many of these plasmablasts expressed surface Ig and high levels of I-Ad (Fig. 2, d, e, i, and j) and were in apparent contact with the DO11.10 T cells present in the outer edges of the PALS (Fig. 6, j and k). A second population, which contained a lower amount of Ig, colocalized with antigen (Fig. 6, l and inset s) in the center of B cell follicles (Fig. 6, j, k, and inset r). Although these areas did not stain with the GC marker PNA, they may have been the antecedents of GC because they contained cells expressing CR1/2 (unpublished data) but not IgD (Fig. 6 v). DO11.10 T cells were observed in the pre-GC interacting with the 3-83 B cells (Fig. 6 r). A third population having a lower level of Ig was located in the marginal zone (Fig. 6 v). Therefore, by day 4 of the response, the progeny of the initial follicular B cells had migrated to the red pulp, pre-GC, and marginal zones.
3-83 IgG2a but Not 3-83 IgM B Cells Are Detected in GCs 10 d after Antigen Injection.
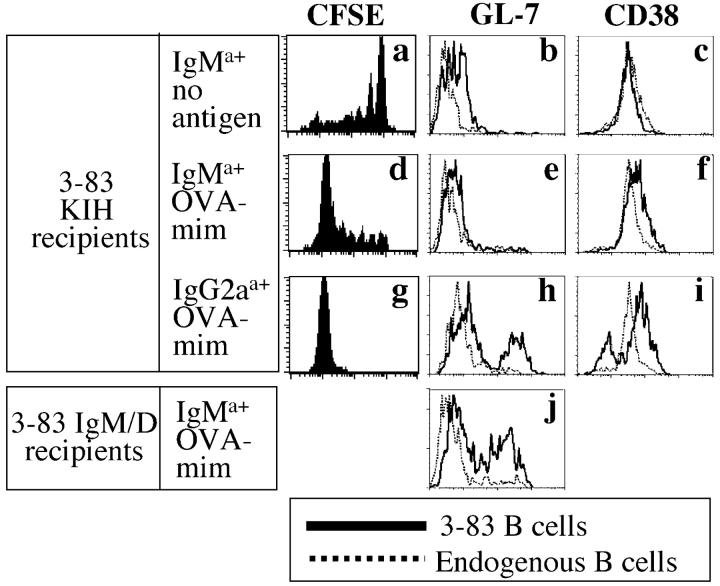
The presence of 3-83 KIH B cells in pre-GC on day 4 raised the possibility that 3-83 KIH B cells participated in the later GC reaction. This possibility was tested by immunohistochemistry and flow cytometry. By day 10, after injection of OVA-mim, GCs containing PNA+ 3-83 IgG2a B cells (Fig. 6, n, o, and u) were detected in the follicles. These B cells showed evidence of many cell divisions (Fig. 7 g) when compared with naive 3-83 IgM B cells (Fig. 7 a), and contained a population of CD38low and GL-7+ GC phenotype cells (Fig. 7, h and i). 3-83 IgM B cells that had not switched were also present at this time, but were absent from GCs and resided in the follicles and marginal zones (Fig. 6, m and t) along with some 3-83 IgG2a B cells (Fig. 6 n). These B cells were CD38high and GL-7− (Fig. 7, e and f), and, thus, resembled naive B cells (Fig. 7, b and c). However, they were not naive because they had divided many times (Fig. 7 d), and were likely to be in contact with antigen, which could still be detected in the red pulp and GCs (Fig. 6 o).
Figure 7.
Phenotype of 3-83 B cells on day 10. Recipients of DO11.10 T cells and 3-83 KIH B cells (a–i) or 3-83 IgM/D B cells (j) were not treated or injected with OVA-mim. In some cases (a, d, and g), the 3-83 KIH B cells were dyed with CFSE before transfer. Intracellular staining was used to detect IgMa and IgG2aa B cells in spleen suspensions prepared 10 d after immunization. The shaded histograms show the levels of CFSE, GL-7, or CD38 on the indicated 3-83 KIH or 3-83 IgM/D B cell populations. The dashed histograms show the staining on endogenous B220+ B cells in the same sample. The data are representative of two independent experiments.
One explanation for the absence of Ag-experienced 3-83 IgM cells from GC was that surface IgM does not produce the appropriate signals for B cell retention or survival in GCs (45–48). To test this possibility, recipients of DO11.10 T cells and 3-83 IgM/D transgenic B cells (35), which cannot undergo isotype switching because the 3-83 V DJH/Cμ/Cδ gene cassette is not integrated in the H chain locus, were immunized with OVA-mim. As shown in Fig. 7 j, a population of GL-7+, 3-83 IgM transgenic B cells was detected 10 d after immunization. The 3-83 IgM transgenic B cells could also be found in PNA+ GCs (unpublished data), demonstrating that 3-83 IgM-expressing B cells can indeed survive in GCs. Thus, although switched B cells normally dominate the GCs, the expression of a switched Ig is not necessary for survival in GCs, although it may provide a competitive advantage.
Anti-HEL B Cells Behave like 3-83 B Cells.
To assess if our results would be of predictive value in an independent system, transfer and immunization experiments were repeated using naive CD4 T cells from OT-II TCR transgenic mice, specific for chicken OVA 323–339–I-Ab complexes, naive B cells from anti-HEL KIH mice, and intravenous immunization with an OVA–DEL conjugate. DEL was used instead of HEL because the affinity of the transgenic BCR for DEL is much lower than for HEL (107 M−1 vs. 1010 M−1; reference 49), and, thus, more closely approximates the affinity of a naive BCR for its antigen. LPS was included as an adjuvant to ensure optimal T cell priming (50).
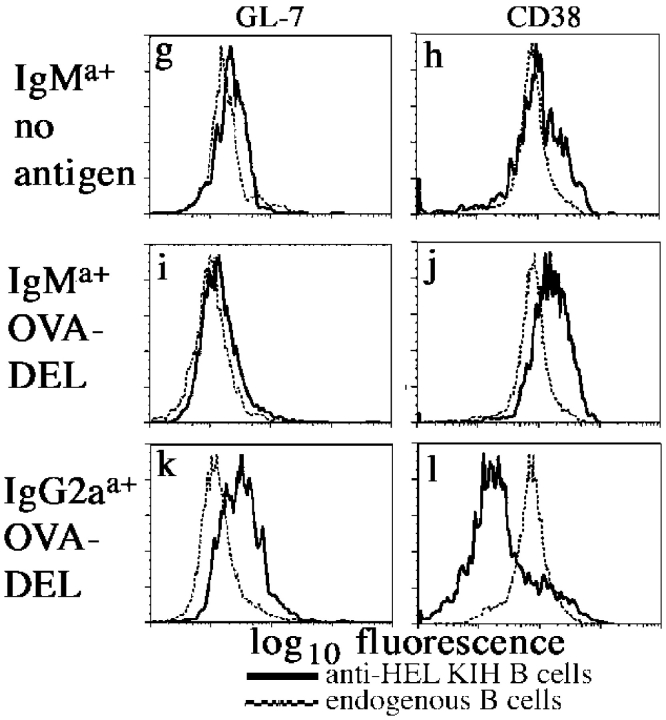
Anti-HEL KIH IgM B cells were found in the follicles and OT-II T cells in the PALS (Fig. 8 , a and b) of the spleens of recipient mice after adoptive transfer. As in the 3-83 model, interactions between OT-II T and anti-HEL KIH B cells were observed at the T-B border on day 1 (unpublished data), and anti-HEL KIH IgG2a B cells with low levels of intracellular Ig first appeared in the follicles of the spleen on day 2 after intravenous injection of OVA–DEL plus LPS (Fig. 8, c and d). 4 d after antigen injection, the anti-HEL KIH IgM and IgG2a B cells increased and formed the same populations of Ighigh plasmablasts in the red pulp, Iglow pre-GC cells in the center of follicles, and marginal zone cells (Fig. 8, e and f) as were observed for 3-83 KIH B cells. On day 11 after immunization, the anti-HEL KIH IgM B cells were GL7− and CD38high (Fig. 8, i and j) like naive anti-HEL KIH IgM B cells (Fig. 8, g and h), whereas the majority of the anti-HEL KIH IgG2a B cells in the day 11–immunized recipients were GL7+ and CD38low (Fig. 8, k and l). Therefore, as in the 3-83 model, anti-HEL KIH B cells first underwent isotype switching in the follicles, formed three anatomically distinct populations, and persisted at later times as GC phenotype IgG cells and non-GC phenotype IgM cells.
Figure 8.
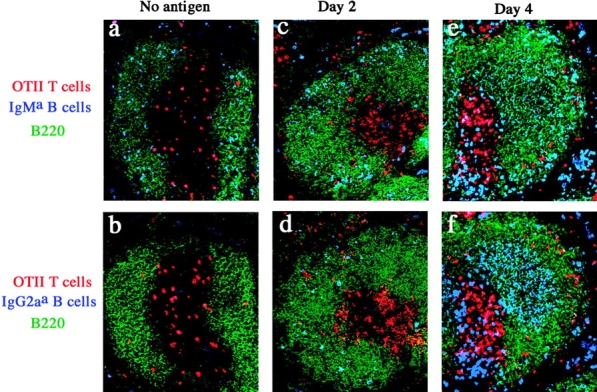
Response of anti-HEL KIH B cells is similar to 3-83 KIH B cells. (a–f) Adjacent spleen sections from recipients of OT-II T cells and anti-HEL KIH B cells before injection (a–b), or 2 d (c and d) or 4 d (e and f) after injection of OVA–DEL plus LPS were stained and analyzed by confocal microscopy. B220 staining (green) identifies the B cell regions. The OT-II T cells appear red. anti-HEL KIH IgM B cells appear blue in a, c, and e. anti-HEL KIH IgG2a B cells appear blue in b, d, and f. (g–l) Recipients of OT-II T cells and anti-HEL KIH B cells were left naive or injected with OVA–DEL plus LPS. Intracellular staining was used to detect IgMa and IgG2aa B cells in spleen suspensions prepared 11 d after immunization. The shaded histograms show the levels of GL-7 or CD38 on the indicated anti-HEL KIH B cell populations. The dashed histograms show the staining on endogenous B220+ B cells in the same sample.
Discussion
By elevating the frequency of naive antigen-specific B and T cells, we were able to track the genesis and fate of isotype-switched B cells early on during a primary T cell–dependent immune response. It could be argued that elevating the frequency of these cells introduces variables that are not representative of the physiological situation. Although adoptively transferred lymphocytes undergo the activation process more quickly than their endogenous counterparts, evidence suggests that the quality and sequence of the events in this process are similar. For example, endogenous (51) and adoptively transferred naive antigen-specific CD4 T cells (30) undergo the same process of clonal expansion, contraction, and memory cell generation, although these steps appear to occur more rapidly in the transferred population. Similarly, in both the endogenous anti-NP response described by Jacob et al. (15) and in the adoptive transfer model reported here, plasmablasts appeared before GC B cells. However, both events occurred a day or two more quickly in the adoptive transfer situation. This could be related to the elevated frequency of helper T cells because the tempo of the primary anti-DNP B cell response was increased in hosts that contained previously primed cognate T cells (11). Therefore, although the rate of B cell activation may be influenced by the frequency of helper T cells, there is no obvious reason to believe that the order in which events occur during this process would be changed.
The finding that antigen-specific isotype-switched B cells were first detected in the follicles departs from the prevailing view that isotype switching occurs first in foci of plasmablasts in the red pulp and medullary cords (15, 52), and later in the GCs (53, 54). Our results are consistent with a model in which IgM B cells, after receiving signals from helper T cells at the PALS–follicle border, migrate into follicles where they proliferate and undergo isotype switching. Isotype-switched B cells and unswitched IgM B cells then migrate to the red pulp, pre-GC, and marginal zones. Isotype-switched B cells in follicles may have been missed in previous studies of endogenous antigen-specific B cell populations because the frequency of these cells before clonal expansion is extremely low.
The first switched B cells did not appear to be interacting with antigen-specific T cells in the follicles. Because very few switched B cells appeared in mice that were not transferred with transgenic T cells, it is reasonable to suspect that critical signals for isotype switching were delivered earlier when IgM B cells interacted with antigen-specific T cells at the PALS–follicle border. Previous work has shown that T cell–dependent switching to the IgG2a isotype is defective in mice lacking the CD40 ligand (55) or the IFN-γ receptor (56). It is possible that the antigen-specific B cells received both of these signals from the interacting T cells at the PALS–follicle border and moved away into the follicle, already programmed to switch. This is plausible for the CD40 ligand because this molecule is induced on naive CD4 T cells within hours of TCR signaling (57). It is less clear how naive T cells could have provided IFN-γ so quickly. Naive DO11.10 and OT-II T cells, like other naive CD4 T cells, are very inefficient IFN-γ producers unless stimulated to differentiate into Th1 cells (50, 58). Another possibility is that antigen-specific B cells received the CD40 ligand signal from the interaction with the antigen-specific T cells, but switched in response to IFN-γ made by the B cells themselves (29), or from another source; e.g., NK cells (59).
The location of the antigen-specific Ighigh B cells in the outer PALS and red pulp suggests that they are the counterparts of the NP-specific Ab-secreting PALS foci described by Jacob et al. (15). Consistent with previous findings (60), all of the antigen-specific Ighigh B cells expressed surface Ig and MHC class II molecules. Thus, these cells did not lose molecules involved in antigen presentation, as has been reported for terminally differentiated plasma cells and myeloma cells (61, 62). Our finding, that the antigen-specific Ighigh B cells were often juxtaposed with antigen-specific T cells at the border between the PALS and red pulp, is consistent with the idea that they were presenting antigen to the T cells, and in return receiving signals to differentiate further.
The antigen-specific IgM and IgG2a B cells present in the marginal zone after immunization could have been derived from naive follicular B2 cells or marginal zone B cells because both populations are present in the spleens of unimmunized BCR transgenic donor mice (63). We favor the former possibility because 3-83 KIH B cells still accumulated in the marginal zones in immunized recipients of 3-83 KIH lymph node cells, which do not contain marginal zone cells (Fig. 6 v). Activated B2 cells may traffic to the marginal zone because antigen is retained there by marginal zone macrophages or because the B cells acquire expression of integrins that are required for retention in the marginal zone (64).
The antigen-specific IgM, and particularly, the antigen-specific IgG2a B cells present in the follicles on day 4 were located in areas where antigen was concentrated, presumably on follicular dendritic cells (16). The interactions between antigen-specific T cells and antigen-specific B cells that were observed in these regions may be evidence of the process whereby helper T cells provide sustaining signals to B cells in GC (16).
The total number of antigen-specific B cells present in the spleen fell dramatically by day 10 after immunization. The loss was partly explained by the disappearance of antigen-specific Ighigh plasmablasts, perhaps as a result of apoptosis or migration to the bone marrow (60, 65). Many of the surviving antigen-specific IgG2a cells expressed GC markers and were located in PNA+ GCs, whereas the surviving antigen-specific IgM cells lacked GC markers, and were located outside of GCs. This absence of IgM cells from the GCs was particularly striking because these B cells were 10 times more abundant than antigen-specific IgG2a B cells at this time. Because the antigen-specific IgM cells were capable of entering early GCs, as indicated by their presence on day 4 in the follicular dendritic cell–rich regions, their absence from PNA+ GCs on day 10 suggests an inability to persist in GC. The lack of persistence of antigen-specific IgM B cells in GCs is inconsistent with a previous paper that found PNA+ IgM B cells persisting throughout a primary response to sheep red blood cells (66). However, this work followed a polyclonal B cell response, and, thus, it is possible that a steady-state level of newly activated, transiently migrating B cell clones were continuously being recruited into the PNA+ IgM+ fraction.
Several explanations are possible for the failure of antigen-experienced IgM B cells to persist in PNA+ GCs. Subsequent engagement of surface IgG2a by antigen, but not IgM, may produce intracellular signals required for survival or retention in GCs (45–48). This does not appear to be the case because adoptively transferred 3-83 transgenic IgM B cells, and transgenic B cells in other models (67–69), can persist in GCs. Alternatively, the antigen-specific IgM cells that entered the follicular dendritic cell–rich regions may not have persisted because they underwent rapid isotype switching in this location, perhaps due to the abundance of antigen-specific T cells that were also present.
Finally, it is likely that some of the antigen-specific B cells present in the spleen 10 d after immunization were destined to enter the memory pool (70). The antigen-specific IgG2a B cells in the GCs are good candidates because it is thought that memory B cells are derived from the GC reaction. However, the antigen-specific IgM B cells that remained in the follicles and marginal zone are also candidates. The latter cells may correspond to the IgM memory population that survives in the marginal zone of rats for long periods of time after immunization (11, 71). Similarly, IgM B cells with a memory phenotype have been described in humans (72–74) and mice (75). Thus, it is possible that two populations of memory cells survive the early primary response: (a) switched B cells that pass through the GCs and (b) unswitched B cells that do not.
Acknowledgments
The authors thank Drs. D. Mueller, M. Shlomchik, M. McHeyzer-Williams, and N. Klinman for helpful suggestions and criticisms concerning this work, and J. Walter for technical assistance.
This work was supported in part by National Institutes of Health grants AI-27998, AI-39614, and AI-35296 to M. Jenkins and grant GM-44809 to D. Nemazee.
The present address of Valerie Kouskoff is Mount Sinai School of Medicine, Icahn Institute for Gene Therapy and Molecular Medicine, New York, NY 10029.
The present address of H. Lucy Tang is Tularik, 2 Corporate Dr., South San Francisco, CA 94080.
Footnotes
Abbreviations used in this paper: BCR, B cell receptor; CFSE, carboxyfluorescein diacetate succinimidyl ester; DEL, duck egg lysozyme; GC, germinal center; HEL, hen egg lysozyme; HRP, horseradish peroxidase; KIH, knockin homozygous; OVA-mim, OVA-mimotope–expressing bacteriophage; PALS, periarteriolar lymphoid sheaths.
References
- 1.Kinoshita, K., and T. Honjo. 2000. Unique and unprecedented recombination mechanisms in class switching. Curr. Opin. Immunol. 12:195–198. [DOI] [PubMed] [Google Scholar]
- 2.Stavnezer-Nordgren, J., and S. Sirlin. 1986. Specificity of immunoglobulin heavy chain switch correlates with activity of germline heavy chain genes prior to switching. EMBO J. 5:95–102. [DOI] [PMC free article] [PubMed] [Google Scholar]
- 3.Jung, S., K. Rajewsky, and A. Radbruch. 1993. Shutdown of class switch recombination by deletion of a switch region control element. Science. 259:984–987. [DOI] [PubMed] [Google Scholar]
- 4.Zhang, J., A. Bottaro, S. Li, V. Stewart, and F.W. Alt. 1993. A selective defect in IgG2b switching as a result of targeted mutation of the I gamma 2b promoter and exon. EMBO J. 12:3529–3537. [DOI] [PMC free article] [PubMed] [Google Scholar]
- 5.Xu, L., B. Gorham, S.C. Li, A. Bottaro, F.W. Alt, and P. Rothman. 1993. Replacement of germ-line epsilon promoter by gene targeting alters control of immunoglobulin heavy chain class switching. Proc. Natl. Acad. Sci. USA. 90:3705–3709. [DOI] [PMC free article] [PubMed] [Google Scholar]
- 6.Revy, P., T. Muto, Y. Levy, F. Geissmann, A. Plebani, O. Sanal, N. Catalan, M. Foryeille, R. Dufourcq-Labelouse, A. Gennery, et al. 2000. Activation-induced cytidine deaminase (AID) deficiency causes the autosomal recessive form of the Hyper-IgM syndrome (HIGM2). Cell. 102:565–575. [DOI] [PubMed] [Google Scholar]
- 7.Muramatsu, M., K. Kinoshita, S. Fagarasan, S. Yamada, Y. Shinkai, and T. Honjo. 2000. Class switch recombination and hypermutation require activation-induced cytidine deaminase (AID), a potential RNA editing enzyme. Cell. 102:553–563. [DOI] [PubMed] [Google Scholar]
- 8.Snapper, C.M., and J.J. Mond. 1993. Towards a comprehensive view of immunoglobulin class switching. Immunol. Today. 14:15–17. [DOI] [PubMed] [Google Scholar]
- 9.Mond, J.J., A. Lees, and C.M. Snapper. 1995. T cell-independent antigens type 2. Annu. Rev. Immunol. 13:655–692. [DOI] [PubMed] [Google Scholar]
- 10.Cyster, J.G. 1999. Chemokines and cell migration in secondary lymphoid organs. Science. 286:2098–2102. [DOI] [PubMed] [Google Scholar]
- 11.Liu, W.J., J. Zhang, P.J.L. Lane, E.Y.T. Chan, and I.C.M. MacLennan. 1991. Sites of specific B cell activation in primary and secondary responses to T cell-dependent and T cell-independent antigens. Eur. J. Immunol. 21:2951–2962. [DOI] [PubMed] [Google Scholar]
- 12.Cyster, J.G., S.B. Hartley, and C.C. Goodnow. 1994. Competition for follicular niches excludes self-reactive cells from the recirculating B-cell repertoire. Nature. 371:389–395. [DOI] [PubMed] [Google Scholar]
- 13.Fulcher, D.A., A.B. Lyons, S.L. Korn, M.C. Cook, C. Koleda, C. Parish, B. Fazekas de St. Groth, and A. Basten. 1996. The fate of self-reactive B cells depends primarily on the degree of antigen receptor engagement and availability of T cell help. J. Exp. Med. 183:2313–2328. [DOI] [PMC free article] [PubMed] [Google Scholar]
- 14.Garside, P., E. Ingulli, R.R. Merica, J.G. Johnson, R.J. Noelle, and M.K. Jenkins. 1998. Visualization of specific B and T lymphocyte interactions in the lymph node. Science. 281:96–99. [DOI] [PubMed] [Google Scholar]
- 15.Jacob, J., R. Kassir, and G. Kelsoe. 1991. In situ studies of the primary immune response to (4-hydroxy-3-nitrophenyl) acetyl. I. The architecture and dynamics of responding cell populations. J. Exp. Med. 173:1165–1175. [DOI] [PMC free article] [PubMed] [Google Scholar]
- 16.Kosco-Vilbois, M.H., J.Y. Bonnefoy, and Y. Chvatchko. 1997. The physiology of murine germinal center reactions. Immunol. Rev. 156:127–136. [DOI] [PubMed] [Google Scholar]
- 17.Jacob, J., and G. Kelsoe. 1992. In situ studies of the primary immune response to (4-hydroxy-3-nitrophenyl) acetyl. II. A common clonal origin for periateriolar lymphoid sheath-associated foci and germinal centers. J. Exp. Med. 176:679–687. [DOI] [PMC free article] [PubMed] [Google Scholar]
- 18.Jacob, J., G. Kelsoe, K. Rajewsky, and U. Weiss. 1991. Intraclonal generation of antibody mutants in germinal centres. Nature. 354:389–392. [DOI] [PubMed] [Google Scholar]
- 19.Berek, C., A. Berger, and M. Apel. 1991. Maturation of the immune response in germinal centers. Cell. 67:1121–1129. [DOI] [PubMed] [Google Scholar]
- 20.McHeyzer-Williams, M.G., M.J. McLean, P.A. Lalor, and G.J.V. Nossal. 1993. Antigen-driven B cell differentiation in vivo. J. Exp. Med. 178:295–307. [DOI] [PMC free article] [PubMed] [Google Scholar]
- 21.William, J., C. Euler, S. Christensen, and M. Shlomchik. 2002. Evolution of autoantibody responses via somatic hypermutation outside of germinal centers. Science. 297:2066–2070. [DOI] [PubMed] [Google Scholar]
- 22.Murphy, K.M., A.B. Heimberger, and D.Y. Loh. 1990. Induction by antigen of intrathymic apoptosis of CD4+ CD8+TCRlo thymocytes in vivo. Science. 250:1720–1723. [DOI] [PubMed] [Google Scholar]
- 23.Nemazee, D.A., and K. Burki. 1989. Clonal deletion of B lymphocytes in a transgenic mouse bearing anti-MHC class I antibody genes. Nature. 337:562–566. [DOI] [PubMed] [Google Scholar]
- 24.Pelanda, R., S. Schaal, R.M. Torres, and K. Rajewsky. 1996. A prematurely expressed Ig(kappa) transgene, but not V(kappa)J(kappa) gene segment targeted into the Ig(kappa) locus, can rescue B cell development in lambda5-deficient mice. Immunity. 5:229–239. [DOI] [PubMed] [Google Scholar]
- 25.Pelanda, R., S. Schwers, E. Sonoda, R.M. Torres, D. Nemazee, and K. Rajewsky. 1997. Receptor editing in a transgenic mouse model: site, efficiency, and role in B cell tolerance and antibody diversification. Immunity. 7:765–775. [DOI] [PubMed] [Google Scholar]
- 26.Barnden, M.J., J. Allison, W.R. Heath, and F.R. Carbone. 1998. Defective TCR expression in transgenic mice constructed using cDNA-based alpha- and beta-chain genes under the control of heterologous regulatory elements. Immunol. Cell Biol. 76:34–40. [DOI] [PubMed] [Google Scholar]
- 27.Casellas, R., T. Shih, M. Kleinewietfeld, J. Rakonjac, D. Nemazee, K. Rajewsky, and M. Nussenzweig. 2001. Contribution of receptor editing to the antibody repertoire. Science. 291:1503–1505. [DOI] [PubMed] [Google Scholar]
- 28.Goodnow, C.C., J. Crosbie, S. Adelstein, T.B. Lavoie, S.J. Smith-Gill, R.A. Brink, H. Pritchard-Briscoe, J.S. Wotherspoon, R.H. Loblay, K. Raphael, et al. 1988. Altered immunoglobulin expression and functional silencing of self-reactive B lymphocytes in transgenic mice. Nature. 334:676–682. [DOI] [PubMed] [Google Scholar]
- 29.Kouskoff, V., S. Famiglietti, G. Lacaud, P. Lang, J.E. Rider, B.K. Kay, J.C. Cambier, and D. Nemazee. 1998. Antigens varying in affinity for the B cell receptor induce differential B lymphocyte responses. J. Exp. Med. 188:1453–1464. [DOI] [PMC free article] [PubMed] [Google Scholar]
- 30.Kearney, E.R., K.A. Pape, D.Y. Loh, and M.K. Jenkins. 1994. Visualization of peptide-specific T cell immunity and peripheral tolerance induction in vivo. Immunity. 1:327–339. [DOI] [PubMed] [Google Scholar]
- 31.Lyons, A.B., and C.R. Parish. 1994. Determination of lymphocyte division by flow cytometry. J. Immunol. Methods. 171:131–137. [DOI] [PubMed] [Google Scholar]
- 32.Merica, R., A. Khoruts, K.A. Pape, R.L. Reinhardt, and M.K. Jenkins. 2000. Antigen-experienced CD4 T cells display a reduced capacity for clonal expansion in vivo that is imposed by factors present in the immune host. J. Immunol. 164:4551–4557. [DOI] [PubMed] [Google Scholar]
- 33.Mariuzza, R., D. Jankovic, G. Boulot, A. Amit, P. Saludjian, A.L. Guern, J. Mazie, and R. Poljak. 1983. Preliminary crystallographic study of the complex between the Fab fragment of a monoclonal anti-lysozyme antibody and its antigen. J. Mol. Biol. 170:1055–1058. [DOI] [PubMed] [Google Scholar]
- 34.Haskins, K., R. Kubo, J. White, M. Pigeon, J. Kappler, and P. Marrack. 1983. The major histocompatibility complex–restricted antigen receptor on T cells. I. Isolation with a monoclonal antibody. J. Exp. Med. 157:1149–1169. [DOI] [PMC free article] [PubMed] [Google Scholar]
- 35.Russell, D.M., Z. Dembic, G. Morahan, J.F. Miller, K. Burki, and D. Nemazee. 1991. Peripheral deletion of self-reactive B cells. Nature. 354:308–311. [DOI] [PMC free article] [PubMed] [Google Scholar]
- 36.Kouskoff, V., G. Lacaud, K. Pape, M. Retter, and D. Nemazee. 2000. B cell receptor expression level determines the fate of developing B lymphocytes: receptor editing versus selection. Proc. Natl. Acad. Sci. USA. 97:7435–7439. [DOI] [PMC free article] [PubMed] [Google Scholar]
- 37.Kouskoff, V., G. Lacaud, and D. Nemazee. 2000. T cell-independent rescue of B lymphocytes from peripheral immune tolerance. Science. 287:2501–2503. [DOI] [PMC free article] [PubMed] [Google Scholar]
- 38.Harris, L.J., S.B. Larson, and A. McPherson. 1999. Comparison of intact antibody structures and the implications for effector function. Adv. Immunol. 72:191–208. [DOI] [PubMed] [Google Scholar]
- 39.Manz, R., S. Arce, G. Cassese, A. Hauser, F. Hiepe, and A. Radbruch. 2002. Humoral immunity and long-lived plasma cells. Curr. Opin. Immunol. 14:517–521. [DOI] [PubMed] [Google Scholar]
- 40.Bird, J.J., D.R. Brown, A.C. Mullen, N.H. Moskowitz, M.A. Mahowald, J.R. Sider, T.F. Gajewski, C.R. Wang, and S.L. Reiner. 1998. Helper T cell differentiation is controlled by the cell cycle. Immunity. 9:229–237. [DOI] [PubMed] [Google Scholar]
- 41.Hodgkin, P.D., J.H. Lee, and A.B. Lyons. 1996. B cell differentiation and isotype switching is related to division cycle number. J. Exp. Med. 184:277–281. [DOI] [PMC free article] [PubMed] [Google Scholar]
- 42.Hasbold, J., A.V. Gett, J.S. Rush, E. Deenick, D. Avery, J. Jun, and P.D. Hodgkin. 1999. Quantitative analysis of lymphocyte differentiation and proliferation in vitro using carboxyfluorescein diacetate succinimidyl ester. Immunol. Cell Biol. 77:516–522. [DOI] [PubMed] [Google Scholar]
- 43.Zhang, J., I. MacLennan, Y. Liu, and P. Lane. 1988. Is rapid proliferation in B centroblasts linked to somatic mutation in memory B cell clones? Immunol. Lett. 18:297–299. [DOI] [PubMed] [Google Scholar]
- 44.Roth, K.A., K. Adler, and M.N. Bobrow. 1999. Enhanced tyramide signal amplification immunohistochemical detection. J. Histochem. Cytochem. 47:1644D–1645D. [PubMed] [Google Scholar]
- 45.Kaisho, T., F. Schwenk, and K. Rajewsky. 1997. The roles of gamma 1 heavy chain membrane expression and cytoplasmic tail in IgG1 responses. Science. 276:412–415. [DOI] [PubMed] [Google Scholar]
- 46.Achatz, G., L. Nitschke, and M.C. Lamers. 1997. Effect of transmembrane and cytoplasmic domains of IgE on the IgE response. Science. 276:409–411. [DOI] [PubMed] [Google Scholar]
- 47.Weiser, P., R. Muller, U. Braun, and M. Reth. 1997. Endosomal targeting by the cytoplasmic tail of membrane immunoglobulin. Science. 276:407–409. [DOI] [PubMed] [Google Scholar]
- 48.Pogue, S.L., and C.C. Goodnow. 2000. Gene dose-dependent maturation and receptor editing of B cells expressing immunoglobulin (Ig)G1 or IgM/IgG1 tail antigen receptors. J. Exp. Med. 191:1031–1044. [DOI] [PMC free article] [PubMed] [Google Scholar]
- 49.Lavoie, T., W. Drohan, and S. Smith-Gill. 1992. Experimental analysis by site-directed mutagenesis of somatic mutation effects on affinity and fine specificity in antibodies specific for lysozyme. J. Immunol. 148:503–516. [PubMed] [Google Scholar]
- 50.Pape, K.A., A. Khoruts, A. Mondino, and M.K. Jenkins. 1997. Inflammatory cytokines enhance the in vivo clonal expansion and differentiation of antigen-activated CD4+ T cells. J. Immunol. 159:591–598. [PubMed] [Google Scholar]
- 51.McHeyzer-Williams, M.G., and M.M. Davis. 1995. Antigen-specific development of primary and memory T cells in vivo. Science. 268:106–111. [DOI] [PubMed] [Google Scholar]
- 52.Toellner, K.M., S.A. Luther, D.M. Sze, R.K. Choy, D.R. Taylor, I.C. MacLennan, and H. Acha-Orbea. 1998. T helper 1 (Th1) and Th2 characteristics start to develop during T cell priming and are associated with an immediate ability to induce immunoglobulin class switching. J. Exp. Med. 187:1193–1204. [DOI] [PMC free article] [PubMed] [Google Scholar]
- 53.Kraal, G., I.L. Weissman, and E.C. Butcher. 1982. Germinal centre B cells: antigen specificity and changes in heavy chain class expression. Nature. 298:377–379. [DOI] [PubMed] [Google Scholar]
- 54.Liu, Y.J., F. Malisan, O. de Bouteiller, C. Guret, S. Lebecque, J. Banchereau, F.C. Mills, E.E. Max, and H. Martinez-Valdez. 1996. Within germinal centers, isotype switching of immunoglobulin genes occurs after the onset of somatic mutation. Immunity. 4:241–250. [DOI] [PubMed] [Google Scholar]
- 55.Xu, J., T.M. Foy, J.D. Laman, E.A. Elliott, J.J. Dunn, T.J. Waldschmidt, J. Elsemore, R.J. Noelle, and R.A. Flavell. 1994. Mice deficient for the CD40 ligand. Immunity. 1:423–431. [DOI] [PubMed] [Google Scholar]
- 56.Huang, S., W. Hendriks, A. Althage, S. Hemmi, H. Bluethmann, R. Kamijo, J. Vilcek, R.M. Zinkernagel, and M. Aguet. 1993. Immune response in mice that lack the interferon-gamma receptor. Science. 259:1742–1745. [DOI] [PubMed] [Google Scholar]
- 57.Laman, J.D., E. Claassen, and R.J. Noelle. 1996. Functions of CD40 and its ligand, gp39 (CD40L). Crit. Rev. Immunol. 16:59–108. [DOI] [PubMed] [Google Scholar]
- 58.Mosmann, T.R., and R.L. Coffman. 1989. Th1 and Th2 cells: different patterns of lymphokine secretion lead to different functional properties. Annu. Rev. Immunol. 7:145–173. [DOI] [PubMed] [Google Scholar]
- 59.Biron, C.A., K.B. Nguyen, G.C. Pien, L.P. Cousens, and T.P. Salazar-Mather. 1999. Natural killer cells in antiviral defense: function and regulation by innate cytokines. Annu. Rev. Immunol. 17:189–220. [DOI] [PubMed] [Google Scholar]
- 60.Smith, K.G., T.D. Hewitson, G.J. Nossal, and D.M. Tarlinton. 1996. The phenotype and fate of the antibody-forming cells of the splenic foci. Eur. J. Immunol. 26:444–448. [DOI] [PubMed] [Google Scholar]
- 61.Manz, R.A., A. Thiel, and A. Radbruch. 1997. Lifetime of plasma cells in the bone marrow. Nature. 388:133–134. [DOI] [PubMed] [Google Scholar]
- 62.Halper, J., S.M. Fu, C.Y. Wang, R. Winchester, and H.G. Kunkel. 1978. Patterns of expression of human “Ia-like” antigens during the terminal stages of B cell development. J. Immunol. 120:1480–1484. [PubMed] [Google Scholar]
- 63.Martin, F., and J. Kearney. 2002. Marginal-zone B cells. Nat. Rev. Immunol. 2:323–335. [DOI] [PubMed] [Google Scholar]
- 64.Lu, T., and J. Cyster. 2002. Integrin-mediated long-term B cell retention in the splenic marginal zone. Science. 297:409–412. [DOI] [PubMed] [Google Scholar]
- 65.Slifka, M.K., R. Antia, J.K. Whitmire, and R. Ahmed. 1998. Humoral immunity due to long-lived plasma cells. Immunity. 8:363–372. [DOI] [PubMed] [Google Scholar]
- 66.Shinall, S.M., M. Gonzalez-Fernandez, R.J. Noelle, and T.J. Waldschmidt. 2000. Identification of murine germinal center B cell subsets defined by the expression of surface isotypes and differentiation antigens. J. Immunol. 164:5729–5738. [DOI] [PubMed] [Google Scholar]
- 67.Hannum, L.G., A.M. Haberman, S.M. Anderson, and M.J. Shlomchik. 2000. Germinal center initiation, variable gene region hypermutation, and mutant B cell selection without detectable immune complexes on follicular dendritic cells. J. Exp. Med. 192:931–942. [DOI] [PMC free article] [PubMed] [Google Scholar]
- 68.Fischer, M.B., S. Goerg, L. Shen, A.P. Prodeus, C.C. Goodnow, G. Kelsoe, and M.C. Carroll. 1998. Dependence of germinal center B cells on expression of CD21/CD35 for survival. Science. 280:582–585. [DOI] [PubMed] [Google Scholar]
- 69.Shokat, K.M., and C.C. Goodnow. 1995. Antigen-induced B-cell death and elimination during germinal-centre immune responses. Nature. 375:334–338. [DOI] [PubMed] [Google Scholar]
- 70.Han, S., B. Zheng, Y. Takahashi, and G. Kelsoe. 1997. Distinctive characteristics of germinal center B cells. Semin. Immunol. 9:255–260. [DOI] [PubMed] [Google Scholar]
- 71.Liu, Y.J., S. Oldfield, and I.C. MacLennan. 1988. Memory B cells in T cell-dependent antibody responses colonize the splenic marginal zones. Eur. J. Immunol. 18:355–362. [DOI] [PubMed] [Google Scholar]
- 72.Klein, U., R. Kuppers, and K. Rajewsky. 1997. Evidence for a large compartment of IgM-expressing memory B cells in humans. Blood. 89:1288–1298. [PubMed] [Google Scholar]
- 73.Pascual, V., Y.J. Liu, A. Magalski, O. de Bouteiller, J. Banchereau, and J.D. Capra. 1994. Analysis of somatic mutation in five B cell subsets of human tonsil. J. Exp. Med. 180:329–339. [DOI] [PMC free article] [PubMed] [Google Scholar]
- 74.van Es, J.H., F.H. Meyling, and T. Logtenberg. 1992. High frequency of somatically mutated IgM molecules in the human adult blood B cell repertoire. Eur. J. Immunol. 22:2761–2764. [DOI] [PubMed] [Google Scholar]
- 75.White, H., and D. Gray. 2000. Analysis of immunoglobulin (Ig) isotype diversity and IgM/D memory in the response to phenyl-oxazolone. J. Exp. Med. 191:2209–2220. [DOI] [PMC free article] [PubMed] [Google Scholar]


