Abstract
A mass spectrometry-based method is described for simultaneous identification and quantitation of individual proteins and for determining changes in the levels of modifications at specific sites on individual proteins. Accurate quantitation is achieved through the use of whole-cell stable isotope labeling. This approach was applied to the detection of abundance differences of proteins present in wild-type versus mutant cell populations and to the identification of in vivo phosphorylation sites in the PAK-related yeast Ste20 protein kinase that depend specifically on the G1 cyclin Cln2. The present method is general and affords a quantitative description of cellular differences at the level of protein expression and modification, thus providing information that is critical to the understanding of complex biological phenomena.
The ongoing accumulation of vast collections of DNA sequence data has catalyzed the development of novel approaches for profiling the expression of genes at the mRNA level. These methods, while extraordinarily powerful, do not provide direct information on changes, either in the levels of proteins or their states of modification. The development of analogous high throughput methods for directly monitoring protein levels, while increasingly desirable for biological investigations in the postgenome era (1–3), presents a formidable analytical challenge. Although recent advances in the use of mass spectrometry (MS) in conjunction with protein/DNA-sequence database search-algorithms allow for the identification of proteins with unprecedented speed (4–7), it remains difficult to obtain accurate quantitative information concerning the levels of the identified proteins and the levels of site-specific modifications within individual protein molecules. In the absence of appropriate antibodies, quantitation is usually achieved by autoradiography after metabolic radiolabeling, fluorography, or the use of protein stains. These procedures depend on complete separation of the proteins of interest by techniques such as high-resolution two-dimensional electrophoresis (8, 9). There remains a pressing need for easier, more reliable means to rapidly profile protein levels. Here we describe a general method for accurately comparing levels of individual proteins present in cell pools that differ in some respect from one another (e.g., the presence of a mutated gene) and for accurately determining changes in the levels of modifications (e.g., phosphorylation) at specific sites on the individual proteins. The procedure can be applied to mixtures of proteins, obviating the need for complete separation.
MATERIALS AND METHODS
Matrix-Assisted Laser Desorption/Ionization Mass Spectrometric (MALDI-MS) Tryptic Maps.
MALDI-MS (10) tryptic maps of protein gel-bands were obtained as follows. Individual protein bands were excised, destained, washed, and digested with modified trypsin (Boehringer Mannheim), and the resulting peptides were extracted with acetonitrile. After vacuum drying, each sample was redissolved in 5 μl of acetonitrile/0.1% aqueous trifluoroacetic acid 1:2 (vol/vol). A portion (0.5 μl) of this sample solution was loaded onto the MALDI-MS sample plate together with 0.5 μl of matrix solution (2, 5-dihydroxybenzoic acid). MALDI-MS measurements were obtained by using a delayed extraction time-of-flight mass spectrometer (Model STR, PerSeptive Biosystems, Framingham, MA) operated in reflector mode.
Data Processing.‡ Protein identification using MALDI-MS tryptic map data was performed with the algorithm profound (11), which applies a Bayesian probability algorithm to search protein/DNA databases for the optimum match to the experimental data.
Protein identification using liquid chromatography (LC)–electrospray ionization (ESI)–tandem mass spectrometry (MS/MS) data was performed with the algorithm pepfrag (12), which matches the experimentally determined mass of an individual tryptic peptide together with its MS/MS fragmentation spectrum with an individual peptide inferred from protein/DNA databases.
Standard Quantitation Curve for Abl-SH2.
Aliquots of unlabeled Abl-SH2 (13) were prepared in concentrations of, respectively, 0.1, 0.25, 0.5, 1.0, 1.5, 2.0, and 2.5 pmol/μl. For each concentration, equal volumes of unlabeled and uniformly 15N-labeled protein (≈1.5 pmol/μl) protein were mixed, and 10-μl aliquots of the resulting samples were subjected to SDS/PAGE (4–20% gradient Tris-glycine gel, NOVEX, San Diego.) After visualization with copper stain (Bio-Rad), bands containing Abl-SH2 were excised, destained, washed, and digested in gels with modified trypsin. The resulting tryptic peptides were extracted and vacuum dried and were redissolved in 7 μl of acetonitrile/0.1% aqueous trifluoroacetic acid [1:1 (vol/vol)]. Aliquots (0.7 μl) of sample solution were loaded onto the MALDI-MS sample plate together with 0.7 μl of matrix solution (60 g/liter) of 2,5-dihydroxybenzoic acid in acetonitrile/water [1:2 (vol/vol)]. The precision of the peak intensity ratio measurement was determined by repeating the above experiment seven times with 1.0 pmol/μl unlabeled protein and 1.5 pmol/μl labeled protein, yielding a relative standard deviation of ±4.8%.
Stable Isotope Labeling.
Glucose-free-labeled and uniformly 15N-labeled (>96%) rich cell growth media (Bio-Express-1000, Cambridge Isotope Laboratory, Andover, MA) were supplemented with unlabeled tryptophan. Galactose was added to the medium to 0.3%. Cells were grown overnight to mid-log phase (OD660 ≤ 1.0) at 30°C with shaking.
Ste20 Expression.
Plasmid pYGEX-STE20 (B3553), which expresses glutathione S-transferase (GST)-Ste20 from the GAL1 promoter, was previously described (14). GST-ste20 phosphorylation (P)-site mutants were amplified via PCR from the pVTU-STE20-based constructs by using an internal oligo upstream of the BamHI site and a 3′ oligo that hybridized outside of the multiple cloning site of the plasmid. The 3′ oligo added an SpeI site, and PCR products were cleaved with BamHI and SpeI and were transferred to B3553 cut with BamHI and XbaI to create wild-type (wt) and mutant STE20 alleles. GST-Ste20trunc fusion proteins for MS analysis were made as follows. Cells [strain BOY491 (cln2−) or BOY493 (GALI::CLN2, referred to here as CLN2+) were transformed with a plasmid expressing GAL1p∷GST-Ste20 and were grown in SCGal-Ura overnight, to an optical density between 0.8 and 1.0. Cells were pelleted, were washed in 50 mM Tris⋅HCl (pH 7.5), 100 mM NaCl, and 5 mM EDTA, and were broken with glass beads in TNET (50 mM Tris⋅HCl, pH 7.5/250 mM NaCl/5 mM EDTA/0.08% Triton X-100, plus protease inhibitors). Clarified extract was incubated with glutathione agarose for 1 hr at 4°C with rotation. The agarose was pelleted and washed three times with TNET, and the protein was eluted either with an equal volume of 2× SDS/PAGE sample buffer or with 5 mM glutathione prepared in 50 mM Tris⋅HCl (pH 8.0). Samples eluted with glutathione were concentrated by using Microcon-30 microconcentrators (Millipore). A mutant full length STE20 was constructed containing alanine substitutions for 12 S/TP phosphorylation sites: Thr203, Thr218, Ser269, Ser418, Thr423, Ser492, Ser502, Thr512, Ser517, Ser547, Ser562, and Thr573. All of these except Thr203, Thr218, Ser269, and Ser492 were identified to be phosphorylated by MS. These latter four are candidate sites for Cdc28 phosphorylation (S/TP flanked by basic residues), three being in the N-terminal region of Ste20 for which the MS coverage was less complete. One additional site (T555) was determined to be Cln2-Cdc28-dependent late in the analysis, and so the 13-site mutant including T555A was tested only for complementation of the mating-factor sensitivity defect of a Ste20 null and for resistance when GAL1∷CLN2 also was expressed.
Two-Dimensional Separation of Yeast Proteins.
Proteins obtained from whole yeast cell extracts were fractionated by HPLC, and the resulting fractions were subjected to SDS/PAGE analysis. The HPLC column was 10 × 100 mm, C4 silica gel (Brownlee Prep-10 Butyl, 20 μm, 300 Å, Perkin–Elmer). Mobile phase A was 67% formic acid/33% water; mobile phase B was 67% formic acid/33% acetonitrile. The flow-rate was 1 ml/min. B concentration gradient was 0–5 min, 0%; 5–10 min, 0–30%; 10–110 min, 30–100%; 110–120 min, 100%. A total of 57 fractions (2 ml) were collected. The first HPLC sample was 1 ml of 14N-labeled extract (CLN2+) plus 1 ml of 15N-labeled extract (cln2−). The second sample was 1 ml of 14N-labeled extract (cln2−) plus 1 ml of 15N-labeled extract (CLN2+). After HPLC, the proteins were trichloroacetic acid-precipitated from each 2-ml fraction. SDS/PAGE sample buffer was added, and each fraction was run on a separate lane of an 8–16% gradient tris-glycine gel (NOVEX) and was stained with colloidal Coomassie brilliant blue (NOVEX).
MS of Phosphorylated Ste20.
After copper staining, the Ste20trunc band (≈80 kDa) was cut out, destained, washed, and digested in-gel with trypsin, and the tryptic peptides were extracted. Ten percent of the sample was used for MALDI-MS analysis, and the other ninety percent was used for LC-ESI-MS and LC-ESI-MS/MS analysis. HPLC separations were made with a C8 silica gel column [Inertsil C8 (150 × 0.7 mm, 5 μm, 300 Å) GL Science, Tokyo]. The eluent from the HPLC column was connected directly to the ESI source. Mobile phase A was acetonitrile/aqueous 0.1% trifluoroacetic acid [2: 98 (vol/vol)], and mobile phase B was acetonitrile/aqueous 0.07% trifluoroacetic acid (95: 5). A linear gradient program was run from 0 to 60% B over a period of 60 min (flow-rate 20 μl/min). LC-MS and LC-MS/MS analysis was performed with an ESI ion trap mass spectrometer (LCQ, Finnigan-MAT, San Jose, CA) operated in a mode that alternated single MS scans (m/z 400–2,000) with MS/MS scans (data-dependent scan mode in which the most intense ion peak in the previous MS scan was isolated and subjected to collision-induced dissociation).
ESI-MS Analysis to Quantitate Site-Specific Changes in Phosphorylation of Ste20.
HPLC was performed by using a precolumn splitter and a 50- × 0.2-mm column (Magicms, C18, 200 Å, 5 μm, Michrom BioResources) at a flow-rate of ≈3 μl/min. The eluent was directed to the ESI ion trap mass spectrometer operated in single-stage MS profile mode over the range of m/z 400–2,000. Mobile phase A was methanol/aqueous 1.0% acetic acid (5:95), and mobile phase B was methanol/aqueous 1.0% acetic acid (85:15). A linear gradient program was carried out from 0–60% B for 30 min.
RESULTS AND DISCUSSION
Quantitation of Changes in Protein Expression.
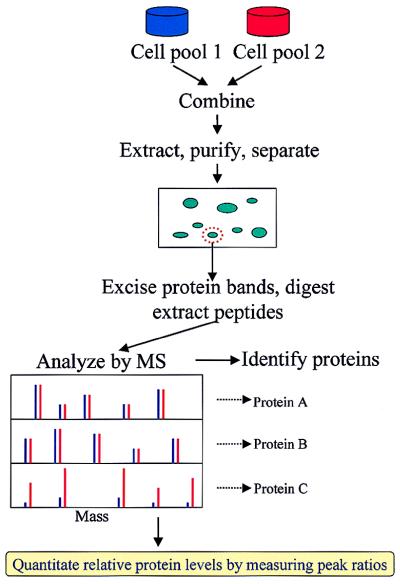
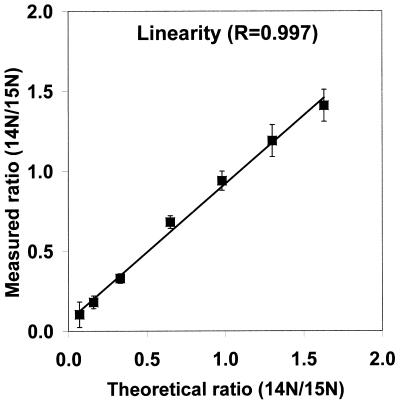
The basis of the present method is the application of the venerable technique of stable isotope labeling (15) in a new context (Fig. 1). One pool of cells (e.g., the wild type) is grown on medium containing the natural abundance of the isotopes of nitrogen, i.e., 14N (99.6%) and 15N (0.4%), while a second pool (e.g., a mutant) is grown on the same medium enriched in 15N (>96%). After an appropriate growing period, the cell pools are combined, and the proteins of interest are extracted and partially separated (e.g., by PAGE). Gel spots of interest are excised and are subjected to digestion by a protease with high specificity (e.g., trypsin), and the resulting peptide fragments are extracted from the gel and analyzed by MS. MS analysis is used both to identify the proteins in the gel spots (4–7) and to determine their relative abundance in the two cell pools. It is important to note that, up to the point of the MS measurement, none of the manipulations discriminates between a protein that contains the natural abundance of nitrogen from the same protein enriched in 15N. Thus, the ratios of the original amounts of proteins from the two cell pools are strictly maintained in the peptide fragments subjected to MS analysis. The MS measurement readily differentiates between peptides originating from the two pools because incorporation of a high abundance of 15N shifts the mass of any given peptide upwards—leading to a pair of peaks from each peptide. The ratios between the intensities of the lower and upper mass components of these pairs of peaks provide an accurate measure of the relative abundance of the peptides (and hence the proteins) in the original cell pools because the MS intensity response to a given peptide is independent of the isotopic composition of the nitrogen atoms (15). By using known ratios of unlabeled and 15N-labeled Abl-SH2 protein, the experimentally determined intensity ratio was found to be linear (r = 0.997) over an abundance ratio of >10:1 (Fig. 2).
Figure 1.
Method for quantitating differential protein expression. For illustration, proteins that remain unchanged in the two cell pools are assumed to be present in equal abundance. (In practice, proteins that remain unchanged in the two cell pools may not be present in equal abundance, and the ratios of the peptide peaks will be a constant value that is not equal to one.)
Figure 2.
The measured ratio of unlabeled (14N) to labeled (15N) recombinantly expressed Abl-SH2 versus the calculated ratio showing the linearity of the method.
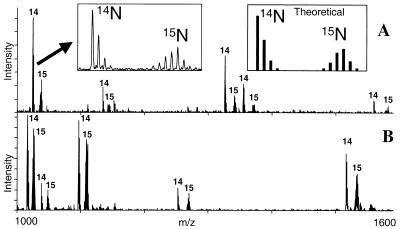
We initially applied the method by scoring the levels of high abundance proteins derived from two pools of Saccharomyces cerevisiae cells that differ only in their ability to express the G1 cyclin CLN2. CLN2 is important in regulating the G1-S transition in budding yeast (16), but the effect of its expression on the levels of specific proteins and their modifications is largely unknown. cln1 cln2 yeast without or with a GAL1∷CLN2 overexpression cassette, such that both populations were proliferating but only one was expressing CLN2 (cln2− and CLN2+, respectively, hereafter), were grown in either 14N or 15N medium, and the abundances of a selection of individual proteins from the two conditions were compared. Fig. 3 shows two examples of MALDI mass spectra of tryptic peptides, each originating from a single protein taken from several hundred that were separated by a combination of reversed-phase HPLC and SDS/PAGE. The pairs of peptide peaks arising from the unlabeled (cln2−) and labeled protein (CLN2+) are readily discerned. The sets of masses of the lower mass components of each pair (i.e., sets of tryptic peptides masses from the unlabeled proteins) were used to identify the proteins from the S. cerevisiae database with the protein identification algorithm profound (11). In this way, the upper spectrum (Fig. 3) was found to originate from elongation factor 1α whereas the lower spectrum originated from triosephosphate isomerase. The profound probability score for elongation factor 1α was 1.00, readily discriminating against the second ranked choice, Clb5 (P = 9.0−20). The probability score for triosephosphate isomerase was 1.00 whereas the second ranked choice was the ORF YDL100c (P = 1.0−16). For each protein analyzed, the ratio of the abundance of the identified protein in the two cell pools was obtained from the intensity ratios of the pair of peaks in the corresponding spectrum of tryptic peptides. To obtain these intensity ratios, the sums of the intensities of the isotopically resolved components of the unlabeled peptide were compared with the corresponding sums from the 15N-labeled peptides. The multiple pairs of peaks within a spectrum provide multiple measurements of the relative abundance for each identified protein.
Figure 3.
Examples of MALDI-MS spectra of tryptic peptides obtained from proteins derived from two pools of S. cerevisiae that differ only in their ability to express the G1 cyclin CLN2. (A) Elongation factor 1α; (B) Triosephosphate isomerase. The numbers “14” and “15” denote peaks originating from unlabeled (cln2−) and 15N-labeled (CLN2+) tryptic peptides. The ratios of the intensities of the pairs of unlabeled to labeled peaks were used to quantitate the relative levels of the proteins in the two cell pools. (Left Inset) Detail shows a pair of peaks from a single tryptic peptide. The lower mass cluster of peaks corresponds to isotopically resolved components of the unlabeled peptide whereas the upper mass cluster corresponds to the isotopic components of the 15N labeled peptide. Tests of the goodness of fit of the theoretical isotope distribution (Right Inset) to the experimental distribution (Left Inset) revealed that the level of incorporated 15N label was 93 ± 1%. The peak intensity for the unlabeled peptide was determined by integrating the intensities of each component in the lower isotopic cluster whereas that for the labeled peptide was determined by integrating the intensity of each component in the upper isotopic cluster.
Measurement of 42 high abundance yeast proteins revealed that that these ratios fall into two categories (Table 1). The first category, which includes the majority of the proteins studied, yields intensity ratios that are the same to within the relative experimental error (±10%) of the measurement. We normalize the average of this category of intensity ratios to 1.00 on the assumption that they arise from proteins whose relative abundance does not change in the two cell pools. Elongation factor 1α (Fig. 3A) falls into this first category (see Table 1 for additional examples). The second category arises from proteins whose relative abundance differs in a statistically significant manner (SD > 3) from the first category. Triosephosphate isomerase (Fig. 3B) falls into this second category because its unlabeled-to-labeled peak ratio was determined to be 0.58 (Table 1). Only two other proteins of the 42 sampled [a putative peroxisomal membrane protein, ORF YLR109w (ratio 0.67) and S-adenosylmethionine synthetase 2 (ratio 0.70)] were observed to fall into this second category. To control for the occurrence of systematic errors in the measurement, we performed a second experiment wherein the stable isotope labeling was reversed—i.e., the cln2− cell pool was labeled with enriched 15N, and the CLN2+ pool was labeled with 14N. The normalized intensity ratios from the cln2−(15N) + CLN2+(14N) cell pools were found to be in agreement with those from cln2−(14N) + CLN2+(15N) pools to within the statistical uncertainty of the measurement (Table 1).
Table 1.
Relative abundance of a selection of proteins in the cln2− versus CLN2+ cell pools determined from the ratio of labeled (14N) versus unlabeled (15N) peptide mass spectrometric peak intensities
| Molecular mass, kDa
|
cln2− (14N)
|
cln2− (15N)
|
|||
|---|---|---|---|---|---|
| Meas* | Calc† | Gene‡§ | Protein name | CLN2+(15N) | CLN2+(14N) |
| 23 | 21.6 | tsa1 | Thiol-specific antioxidant protein | 0.89 | 0.80 |
| 27 | 26.7 | tpi1 | Triosephosphate isomerase | 0.58 | 0.59 |
| 29 | 27.5 | gmp1 | Phosphoglycetate mutase 1 | 1.08 | 1.14 |
| 34 | 34.8 | bel1 | Guanine nucleotide binding protein | 1.10 | 1.08 |
| 37 | 35.6 | tdh3 | Glyceraldehyde 3-phosphate dehydrogenase 3 | 1.12 | 1.04 |
| 45 | 44.7 | pak1 | Phosphoglycerate kinase | 0.98 | 1.09 |
| 49 | 46.7 | eno2 | 2-phosphoglycerate dehydratase | 0.98 | 0.94 |
| 51 | 49.9 | tef1 | Elongation factor 1α | 1.00 | 0.84 |
| 60 | 54.5 | cdc19 | Pyruvate kinase 1 | 1.12 | 0.97 |
| 90 | 93.3 | eft1 | Elongation factor 2 | 0.91 | 1.00 |
| 110 | 111 | kgd1 | α-ketoglutarate dehydrogenase | 0.96 | 1.11 |
| 120 | 116 | yef3 | Elongation factor 3 | 0.86 | 1.00 |
SDS/PAGE molecular mass.
Calculated molecular mass.
Yeast Protein Database gene name (25).
Additional examples of proteins (by gene name) that were identified from the two cell pools together with their abundance ratios (cln2−/CLN2+) in parentheses: ilv5 (0.93); grs1 (0.97); acs2 (0.99); por1 (1.06); pfk2 (0.95); cdc48 (0.90); gdh1 (1.06); pet9 (1.09); pdc1 (1.00); YLR109w (0.67); fba1 (1.18); asn2 (0.97); cys4 (1.05); idh1 (1.10); rpl5 (0.99); efb1 (0.96); YKL056c (1.14); tif51a (0.94); rps5 (1.16); act1 (1.12); hxk2 (1.11); pgi1 (1.19); ssa1 (0.95); fas1 (0.99); hsc82 (0.84); hom6 (0.96); rpp0 (1.03); rnr2 (0.91); bmh1 (0.91); bmh1 (0.91); sam2 (0.70).
Although the biological implications of these findings remain to be elucidated, the results demonstrate that relatively subtle changes (>20%) in the abundance of proteins can be readily discerned. The technique also can be applied to the detection of changes in the levels of protein components of incompletely separated mixtures, provided that individual peptides in the MALDI-MS peptide map can be unambiguously assigned to specific proteins. Thus, for example, two 75-kDa proteins, glycyl-tRNA synthetase and acetyl CoA synthetase 2, were identified [by using the algorithm profound (11), which automatically identifies proteins present as binary mixtures], and their abundance changes were determined from a single gel band. In separate experiments, we confirmed these identifications by subjecting a portion of the same sample from the 75-kDa band to LC-ESI-MS and LC-ESI-MS/MS analysis using an ion trap mass spectrometer (12, 17). The MS/MS experiment identifies proteins from the fragmentation patterns of individual peptides by using the search algorithm pepfrag (12) whereas the corresponding MS experiment is used to obtain the intensity ratio for quantitation. This combined LC-MS and LC-MS/MS approach should allow for the quantitative analysis of complex mixtures of proteins.
Quantitation of Changes in Site-Specific Modifications in Proteins.
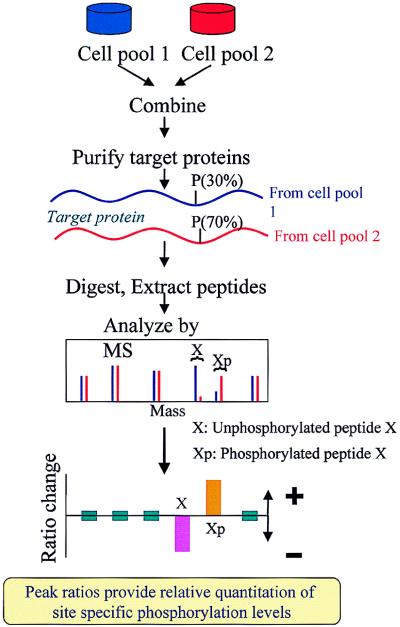
Quantitation of changes in site-specific modifications in proteins (e.g., phosphorylation) presents an even greater analytical challenge than does the determination of changes in gross protein level. Fig. 4 illustrates how such alterations can be accurately gauged through the use of stable isotope labeling. As before, the two cell pools of interest are grown on unlabeled versus labeled media, and, after a defined period of time, the pools are combined. The protein(s) of interest are purified, are subjected to trypsin digestion, and are analyzed by MS. Peptides from the two cell pools that either remain unmodified or do not undergo a change in the level of modification yield pairs of peaks with a fixed ratio of intensities—a ratio that can be used to normalize the amounts of the protein from the two cell pools. By contrast, peptides that undergo a change in their level of modification yield pairs of MS peaks with intensity ratios that reflect these changes (Fig. 4). To test this strategy in practice, we studied phosphorylation of the PAK-related Ste20 protein kinase in yeast.
Figure 4.
Method for site-specific quantitation of changes in the level of phosphorylation on proteins. For illustration, peptides that remain unchanged in the two cell pools are assumed to be present in equal abundance, and the level of phosphorylation of peptide A is assumed to change from 30% (pool 1) to 70% (pool 2)—leading to a decrease in the measured intensity ratio of unphosphorylated peptide X and an increase for phosphorylated peptide Xp.
Recently, evidence was presented that the Cln2-Cdc28 cyclin-dependent kinase inhibits the mating factor signal transduction pathway by interfering with the function of Ste20 and that this inhibition correlates with Cln2-dependent in vivo phosphorylation of Ste20 (18–20). We used MALDI-MS and LC-ESI-MS/MS analysis of unlabeled full length Ste20 as well as a truncated form spanning residues 496–939 (Ste20trunc) to identify 13 sites that were phosphorylated in vivo [i.e., Ser418, (Ser422 or Thr423), Ser502, three sites in a tryptic peptide spanning residues 506–530, Ser547, (Ser551, Thr552, or Thr555), Ser562, Thr573, Ser585, Thr773, and (Ser861 or Thr863)]. (Note that P-site ambiguities arise because MS/MS analysis does not always provide information on each amino acid residue in the peptide sequence.) Here, we apply the method illustrated in Fig. 4 to specifically identify Cln2-dependent in vivo phosphorylation sites in Ste20 and use the data to test the hypothesis that Cln2-dependent phosphorylation of Ste20 brings about inhibition of the mating factor transduction pathway.
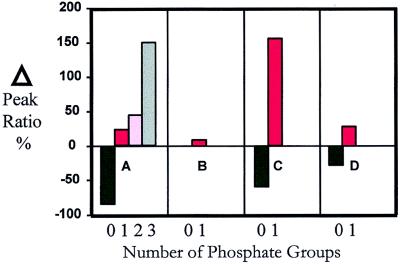
The experiment was carried out by monitoring differences in phosphorylation of Ste20trunc in CLN2+ versus cln2− cell pools. Fractions from the two cell pools containing Ste20trunc were mixed and subjected to SDS/PAGE. The band containing the mixture of labeled and unlabeled Ste20trunc was excised and digested with trypsin, and the resulting peptides were extracted and subjected to LC-ESI-MS and MALDI-MS analysis. Measurement of the intensity ratios of the isotopically labeled (cln2−) versus unlabeled (CLN2+) phosphopeptides showed that at least four sites exhibit large increases in phosphorylation in the CLN2+ cell pool (Fig. 5). These Cln2-dependent sites appear to be consensus cyclin-dependent S/T-P sites, consistent with direct phosphorylation of Ste20 by Cln2-Cdc28 (21). We determined by using MS/MS analysis that the Ste20 peptide 544SKTSPIISTAHTPQQVAQSPK564 was phosphorylated at Ser547, Ser562, and (Thr551, Ser552, or Thr555). The first two sites are within SP motifs (italicized) whereas the third site was constrained to a 5-residue stretch that contains a TP motif (italicized). Fig. 5A shows the change of the intensity ratio of the unphosphorylated peptide as well as the change observed for the singly, doubly, and triply phosphorylated Ste20 peptide obtained from CLN2+ versus cln2− cells. The intensity ratio for the unphosphorylated peptide decreased by 84 ± 5% whereas that for the singly, doubly, and triply phosphorylated sites increased by 24 ± 12%, 44 ± 14%, and >150%, respectively, showing that phosphorylation is enhanced at all three sites in the CLN2+ versus the cln2− mutant cells. By contrast, the Ste20 phosphopeptide 583SLSKELNEK591 (phosphorylated on Ser585) undergoes no significant ratio change (9 ± 13%) (Fig. 5B), demonstrating that phosphorylation at Ser585 is not Cln2-dependent—in accord with the absence of a proline-directed kinase phosphorylation motif. Cln2-dependent phosphorylation also was observed in the peptide 565APAQETVTTPTSKPAQAR582 (Fig. 5C) and to a lesser extent in the peptide 772TTMVGTPYWMAPEVVSR788 (Fig. 5D). Using MS/MS analysis, we found the former to be phosphorylated on Thr573 (a TP motif) whereas the latter peptide was phosphorylated on Thr773 [and not Thr777Pro778, as previously reported (21)]. These data demonstrate that the present method can precisely discern site-specific changes in the degree of phosphorylation of a protein.
Figure 5.
Percentage change of the normalized peak intensity ratio for four different Ste20trunc peptides that undergo phosphorylation.
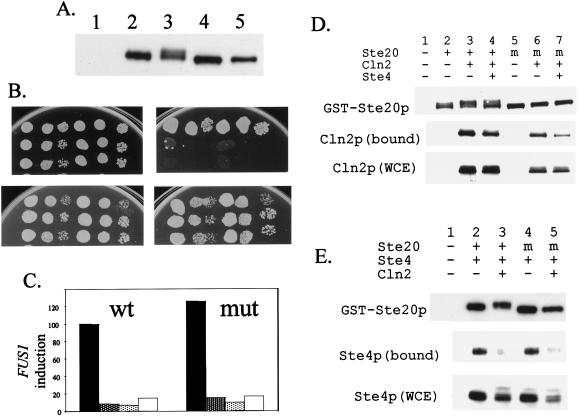
Consistent with our epistatic mapping of the site of Cln2 inhibition of the mating factor pathway to the point of action of Ste20 (18–20), we found (Fig. 6D) that Cln2 interacts in vivo with Ste20. Ste20 is known to interact with Ste4, the β-subunit of the G protein activated by mating factor signaling, and Cln2 overexpression strongly interfered with this interaction (Fig. 6E). Intriguingly, simultaneous elimination of 12 candidate Cdc28 phosphorylation sites in Ste20 (see Materials and Methods), including sites that were both Cln2-dependent and Cln2-independent, had little effect on the ability of Cln2 to interact with Ste20 (Fig. 6D), nor did it block the ability of CLN2 overexpression to eliminate Ste20-Ste4 interaction (Fig. 6E). We did observe a partial (≈60%) displacement of Cln2 from the 12-site mutant Ste20 as a consequence of Ste4 overproduction; this displacement was much less effective with wild-type phosphorylated Ste20. These results suggest the possibility that Ste20 phosphorylation may contribute to its negative regulation by Cln2 without being essential for it. Indeed, the 12-site mutant Ste20 functioned normally in the mating-factor pathway, and, in such cells, the mating factor pathway was normally inactivated by CLN2 overexpression (Fig. 6 B and C). The 12-site-mutant Ste20 also was able to trigger haploid invasive growth (data not shown). These data suggest that Cln2-dependent phosphorylation of Ste20 may be a byproduct of interaction between Cln2 and Ste20 or that it may regulate a process that we have not yet assayed. It is also possible that there are additional Cln2-dependent Ste20 phosphorylation sites that we have failed to detect, although the 12-site mutant eliminates the Cln2-dependent gel mobility shift of Ste20 described previously (Fig. 6A and refs. 18–20). Nevertheless, the present method allowed us to dissect the Cln2-dependent Ste20 phosphorylation in unprecedented detail and provided us with high-quality information to test our hypothesis concerning its role in the mating factor pathway.
Figure 6.
Analysis of function and interaction of Ste20 (wt and P-site mutant), Ste4, and Cln2. (A) Effect of CLN2 overexpression on Ste20p mobility with and without P-site mutations. A wt strain was transformed with a vector control (lane 1), with wt STE20 (lanes 2 and 3), or the 12-site P mutant (lanes 4 and 5), as well as with a plasmid encoding the CLN2 gene expressed from the GAL1 promoter (lanes 3 and 5). (B) The ste20 P-site mutant confers sensitivity to pheromone-induced growth arrest, which is repressed by GAL1∷CLN2. Serial dilutions of strain BOY491 (CLN+ ste20∷TRP1 GAL1∷CLN2) transformed with a vector control (row 1), wt STE20 (row 2), or the 12-site P-site mutant (row 3). Two separate transformants were tested. The plates used were SCDex (Top Left), SCDex with 0.3 μM α factor (Top Right), SCGal (Lower Left), or SCGal with 0.3 μM α factor (Lower Right). (C) Relative levels of α factor-induced FUS1 transcription (20) for wt STE20 and the 12-site P-site mutant. Transformants in strain BOY491 were grown in the presence (dark gray and white bars) or absence (black and light gray bars) of galactose. α factor (0.5 μM) was added (black and dark gray bars) before preparation of RNA and Northern blot analysis. The columns indicate the relative levels of FUS1 transcript detected, as compared with that observed for wt STE20 induced with pheromone. TCM1 was used as a loading control. (D) Cln2 coprecipitates with Ste20, and Ste4 expression reduces this association. The strain 2198–11C (CLN+) was transformed with either a vector control (lane 1) or with plasmids encoding wt GST-Ste20 (lanes 2 through 4) or 12-site mutant GST-ste20 (lanes 5 through 7). Transformants also contained either vector controls or plasmids overexpressing myc-tagged Cln2 and/or Ste4 from the GAL1 promoter, as indicated. The Ste20 protein was precipitated with glutathione agarose, and aliquots were analyzed by Western blotting to determine the level of Ste20 (A) or Cln2 (B) present. An aliquot of the whole cell extract also was analyzed to determine the relative level of Cln2. (E) Effect of CLN2 overexpression on Ste4/Ste20 association. The strain 2198–11C (CLN+, lanes 1, 2, and 4) or 2198–3A (CLN+ GAL1p∷CLN2, lanes 3 and 5) was transformed with either a vector control (lane 1) or with plasmids encoding wt GST-Ste20 (lanes 2 and 3) or the 12-site GST-ste20 mutant (lanes 4 and 5). Transformants also contained either a vector control or a plasmid overexpressing HA-tagged Ste4, as indicated. The Ste20 protein was precipitated with glutathione agarose, and aliquots were analyzed by Western blotting to determine the relative levels of Ste20 or Ste4 present. An aliquot of the whole cell extract (WCE) also was analyzed to determine the relative levels of Ste4.
CONCLUSIONS
We have demonstrated a general method for simultaneous identification and quantitation of proteins as well as for determining site-specific changes in the level of modification of proteins. Relatively small changes (>20%) can be reliably discerned from picomole to subpicomole amounts of gel-separated proteins as well as from simple protein mixtures. The procedure should be applicable to any cell system that can be grown on isotopically enriched media. Alternative stable isotopes could be used in the present context, including 13C, 18O, and 2H. However, we note that the enzymatic effects of 2H substitution (22) are generally assumed to be large in comparison with 15N substitution (23). We envisage that proteome-wide investigations will usually be performed after purifying/concentrating subpopulations of proteins of interest (by subcellular fractionation, affinity enrichment, phosphoprotein enrichment, etc.), followed by examination of all of the major components within this population. The effective quantitation of protein expression levels by using the method demonstrated here permits a detailed understanding of the interaction of gene expression with external factors in producing phenotypes. In combination with, and as an extension of genomic transcriptional expression mapping (24), the quantitative description of the protein phenotype provides opportunities for understanding the molecular basis of physiological and pathological processes.
Acknowledgments
This work was supported by National Institutes of Health Grants RR00862 (to B.T.C.), GM47021 (to D.C.), and GM49716 (to F.R.C.).
ABBREVIATIONS
- MALDI
matrix-assisted laser desorption/ionization
- MS
mass spectrometry
- ESI
electrospray ionization
- MS/MS
tandem mass spectrometry
- wt
wild type
- P-site mutant
phosphorylation site mutant
- LC
liquid chromatography
- GST
glutathione S-transferase
Footnotes
This paper was submitted directly (Track II) to the Proceedings Office.
References
- 1.Lander E S. Science. 1996;274:536–539. doi: 10.1126/science.274.5287.536. [DOI] [PubMed] [Google Scholar]
- 2.Anderson N L, Anderson N G. Electrophoresis. 1998;19:1853–1861. doi: 10.1002/elps.1150191103. [DOI] [PubMed] [Google Scholar]
- 3.Haynes P A, Gygi S P, Figeys D, Aebersold R. Electrophoresis. 1998;19:1862–1871. doi: 10.1002/elps.1150191104. [DOI] [PubMed] [Google Scholar]
- 4.Henzel W J, Billeci T M, Stults J T, Wong S C, Grimley C, Watanabe C. Proc Natl Acad Sci USA. 1993;90:5011–5015. doi: 10.1073/pnas.90.11.5011. [DOI] [PMC free article] [PubMed] [Google Scholar]
- 5.Wilm M, Shevchenko A, Houthaeve T, Breit S, Schweigerer L, Fotsis T, Mann M. Nature (London) 1996;379:466–469. doi: 10.1038/379466a0. [DOI] [PubMed] [Google Scholar]
- 6.Shevchenko A, Jensen O N, Podtelejnikov A V, Sagliocco F, Wilm M, Vorm O, Mortensen P, Shevchenko A, Boucherie H, Mann M. Proc Natl Acad Sci USA. 1996;931:14440–14445. doi: 10.1073/pnas.93.25.14440. [DOI] [PMC free article] [PubMed] [Google Scholar]
- 7.Yates J R., III Electrophoresis. 1998;19:893–900. doi: 10.1002/elps.1150190604. [DOI] [PubMed] [Google Scholar]
- 8.Garrels J I, Futcher B, Kobayashi R, Latter G I, Schwender B, Volpe T, Warner J R, McLaughlin C S. Electrophoresis. 1994;15:1466–1486. doi: 10.1002/elps.11501501210. [DOI] [PubMed] [Google Scholar]
- 9.Anderson N L, Taylor J, Hofmann J P, Esquer-Blasco R, Swift S, Anderson N G. Toxicol Pathol. 1996;24:72–76. doi: 10.1177/019262339602400110. [DOI] [PubMed] [Google Scholar]
- 10.Beavis R C, Chait B T. Methods Enzymol. 1996;270:519–551. doi: 10.1016/s0076-6879(96)70024-1. [DOI] [PubMed] [Google Scholar]
- 11.Fenyo D, Zhang W, Chait B T, Beavis R C. Anal Chem. 1996;68:721A–726A. [Google Scholar]
- 12.Fenyo D, Qin J, Chait B T. Electrophoresis. 1998;19:998–1005. doi: 10.1002/elps.1150190615. [DOI] [PubMed] [Google Scholar]
- 13.Gosser Y Q, Zheng J, Overduin M, Mayer B J, Cowburn D. Structure (London) 1995;3:1075–1086. doi: 10.1016/s0969-2126(01)00243-x. [DOI] [PubMed] [Google Scholar]
- 14.Roberts R L, Mosch H U, Fink G R. Cell. 1997;89:1055–1065. doi: 10.1016/s0092-8674(00)80293-7. [DOI] [PubMed] [Google Scholar]
- 15.de Leenheer A P, Thienpont L M. Mass Spectrom Rev. 1992;11:249–307. [Google Scholar]
- 16.Cross F R. Curr Opin Cell Biol. 1995;6:790–797. doi: 10.1016/0955-0674(95)80062-x. [DOI] [PubMed] [Google Scholar]
- 17.Arnott D, Henzel W J, Stults J T. Electrophoresis. 1998;19:968–980. doi: 10.1002/elps.1150190612. [DOI] [PubMed] [Google Scholar]
- 18.Oehlen L J W M, Cross F R. Genes Dev. 1994;8:1058–1070. doi: 10.1101/gad.8.9.1058. [DOI] [PubMed] [Google Scholar]
- 19.Oehlen L J W M, Cross F R. J Biol Chem. 1998;273:25089–25097. doi: 10.1074/jbc.273.39.25089. [DOI] [PubMed] [Google Scholar]
- 20.Wu C, Leeuw T, Leberer E, Thomas D Y, Whiteway M. J Biol Chem. 1998;273:28107–38115. doi: 10.1074/jbc.273.43.28107. [DOI] [PubMed] [Google Scholar]
- 21.Wu C, Whiteway M, Thomas D Y, Leberer E. J Biol Chem. 1995;270:15984–15992. doi: 10.1074/jbc.270.27.15984. [DOI] [PubMed] [Google Scholar]
- 22.Katz J J, Crespi H L. Science. 1966;151:1187–1194. doi: 10.1126/science.151.3715.1187. [DOI] [PubMed] [Google Scholar]
- 23.Scheuring J, Schramm V L. Biochemistry. 1997;36:4526–4534. doi: 10.1021/bi962841h. [DOI] [PubMed] [Google Scholar]
- 24.Forozan F, Karhu R, Kononen J, Kallioniemi A, Kallioniemi O P. Trends Genet. 1997;13:405–409. doi: 10.1016/s0168-9525(97)01244-4. [DOI] [PubMed] [Google Scholar]
- 25.Garrels J I. Nucleic Acids Res. 1996;24:46–49. doi: 10.1093/nar/24.1.46. [DOI] [PMC free article] [PubMed] [Google Scholar]


