

Abstract
During maturation, dendritic cells (DCs) regulate their capacity to process and present major histocompatibility complex (MHC) II–restricted antigens. Here we show that presentation of exogenous antigens by MHC I is also subject to developmental control, but in a fashion strikingly distinct from MHC II. Immature mouse bone marrow–derived DCs internalize soluble ovalbumin and sequester the antigen intracellularly until they receive an appropriate signal that induces cross presentation. At that time, peptides are generated in a proteasome-dependent fashion and used to form peptide–MHC I complexes that appear at the plasma membrane. Unlike MHC II, these events do not involve a marked redistribution of preexisting MHC I molecules from intracellular compartments to the DC surface. Moreover, out of nine stimuli well known to induce the phenotypic maturation of DCs and to promote MHC II presentation, only two (CD40 ligation, disruption of cell–cell contacts) activated cross presentation on MHC I. In contrast, formation of peptide–MHC I complexes from endogenous cytosolic antigens occurs even in unstimulated, immature DCs. Thus, the MHC I and MHC II pathways of antigen presentation are differentially regulated during DC maturation.
Keywords: dendritic cells, cross presentation, MHC class I, MHC class II, ovalbumin
Introduction
While MHC II molecules associate with peptides derived from exogenous antigens internalized by endocytosis, MHC I molecules are classically thought to present immunogenic peptides of endogenous origin (1). However, exogenous antigens can also enter the MHC I pathway of APCs by a process called “cross presentation” (2). Functionally, cross presentation is thought to be crucial for priming CD8-dependent responses against tumor cells or pathogens which are not directly expressed by APCs (3). Cell biologically, the mechanism of cross presentation is of interest because it appears to involve overcoming a normally impenetrable topology barrier. Internalized antigen in the lumen of endocytic vesicles must egress into the cytosol where it can become a substrate for proteasome-dependent peptide generation.
Among APCs, DCs are the most efficient at initiating antigen-specific immune responses, inducing differentiation of both naive CD4+ and CD8+ T cells (4). They are also adept at cross presentation (5, 6). In their immature state, DCs reside in peripheral tissues where they detect and capture incoming pathogens. DCs then begin a maturation process characterized by a series of dramatic phenotypic and functional changes (7). Maturation is triggered by various inflammatory mediators and microbial products, all of which produce DCs with common cell surface phenotype including dramatic increases in MHC II and costimulatory molecule expression. In contrast, the cytokines that mature DCs secrete can vary markedly. Different stimuli thus produce qualitatively different states of maturation, facilitating the DC's ability to polarize T cell responses (8).
The cell biology of DC maturation is a subject of intense interest with considerable progress having been made charting the regulation of the MHC II pathway (7, 9). In immature DCs, newly synthesized MHC II accumulates in late endosomal and lysosomal compartments. Upon receipt of a maturation signal, these MHC II molecules become more efficiently loaded with peptide (10, 11) and are then transferred to the cell surface (12, 13). Newly synthesized MHC II now also avoids lysosomes on route to the plasma membrane (14).
In contrast, little is known about how maturing DCs modulate the function of MHC I. In some DC populations, the maturation-induced increase in MHC I surface expression is thought to reflect increased synthesis and posttranslational stability (15, 16). In Langherans cells, on the other hand, at least some MHC I may accumulate in lysosomal compartments (17), suggesting that increased cell surface expression may in part reflect the recruitment of MHC I sequestered in lysosomes.
It is well established that DCs cross present exogenous antigen after uptake by phagocytosis or Fc receptor-mediated endocytosis (6, 18, 19). However, which if any aspects of this process are controlled by maturation remain unclear. Recent data do support the possibility that DCs regulate cross presentation at least in some fashion. In vivo, interaction between APCs and T-helper cells via CD40–CD40L has been suggested to activate APCs to become fully competent for CD8+ T cell priming (20–22). In vitro, TCR binding to MHC II has also been reported to induce MHC I cross presentation by DCs (23). Furthermore, ubiquitinated proteins appear transiently in aggresome-like structures upon induction of DC maturation (24). These “DALIs” may sequester endogenous proteins to allow more efficient processing of exogenous proteins.
Here, we show that cross presentation is subject to developmental regulation in DCs. Most interestingly, the presentation of exogenous antigen on MHC I is activated by only a subset of the signals which activate MHC II–dependent presentation, indicating that the two pathways have unexpectedly distinct patterns of regulation.
Materials and Methods
Mouse DC Culture.
B6D2F1 and C57BL/6J mice were purchased from The Jackson Laboratory. Bone marrow–derived DCs were prepared as described previously (14). At day 4, the cultures contained many aggregates of immature DCs loosely attached to the monolayer. To mature the DCs, we either disaggregated DC clusters by gentle pipetting and added LPS (10 ng/ml, Escherichia coli type 0111.B4; Sigma-Aldrich), added CpG DNA (TCCATGACGTTCCTGACGTT, 10 nM), bacteria (0.5 μl/ml MAX Efficiency DH5 α competent cells; Invitrogen), poly IC (20 μg/ml; Sigma-Aldrich), TNFα (10 ng/ml; PeproTech), IFN-γ (10 ng/ml; PeproTech), anti-CD40 mAb (HM40–3, 10 μg/ml; BD Biosciences), CD4+ T cell hybridoma DO.11.10 (1 T cell:1 DC ratio).
MHC Class I–restricted Antigen Presentation Assays.
OVA (grade VI; Sigma-Aldrich or Worthington), BSA (fraction V; Sigma-Aldrich) at 1 mg/ml was added to immature DCs for 2 h. Presentation of OVA epitope 257–264 in a H-2Kb background was monitored using purified CD8+ T cells from OT.1 TCR transgenic mice provided by Kim Bottomly (Yale Medical School, New Haven, CT). 2 × 10⁵ DCs minus or plus a maturation stimulus were cultured with 1 × 10⁵ OT.1 T cells in 96-well microtiter plates in RPMI 1640–5% FCS. In some cases, the 96-well plates were coated with anti-CD28 Ab (10 μg/ml; BD Biosciences) overnight at 4°C. The DCs were fixed in 1% paraformaldehyde for 30 min on ice. CD8+ T cells were purified from spleen and lymph node suspensions by negative selection using CD8+ cell isolation kit (Miltenyi Biotec). T cell responses were monitored at 24 h by measuring IL-2 accumulation in the supernatant by ELISA (BD Biosciences). Data are from triplicate cultures.
MHC Class II–restricted Antigen Presentation Assays.
Presentation of OVA epitope 323–339 in an I-Ad background was monitored using the CD4+ T cell hybridoma DO.11.10 (obtained from Philippa Marrack, National Jewish Hospital, Denver, CO). 105 DCs that were exposed to OVA or BSA were applied to 2 × 10⁵ CD4+ T cells in 96-well microtiter plates. T cell responses were monitored as described above.
Separation of CD11c-positive DCs from CD11c-negative Cells.
DCs were incubated with magnetic micro-beads conjugated to anti–mouse CD11c mAb (clone N418; Miltenyi Biotec) for 15 min at 4°C. CD11c-positive DCs were then separated by passing cells over a MACS MS+ column held in a VarioMACS magnetic separator (Miltenyi Biotec).
Antibodies and Immunofluorescence.
Immunofluorescence patterns were visualized with confocal microscopy as described (14). MHC II proteins were detected using TIB 120, a rat mAb, MHC I H-2Kb using P8, a rabbit polyclonal Ab (gift of Hidde Ploegh, Harvard Medical School, Boston, MA), Lamp-2 using GL2A7, a rat mAb (14), ER-resident KDEL proteins using anti-KDEL, a mouse mAb (StressGen Biotechnologies), the Golgi apparatus using anti-GM130, a mouse mAb (BD Transduction Laboratories), and OVA using a rabbit polyclonal Ab (Sigma-Aldrich). All secondary Abs were purchased from Jackson ImmunoResearch Laboratories.
Flow Cytometry Assays.
Cells were stained for 30 min on ice with either FITC or PE anti-MHC II I-Ab (AF6–120.1), PE anti-MHC I H2-Kb (AF6–88.5), PE anti-CD86 (GL1), Cychrome anti-CD11c (HL3), FITC anti-H2-Kb/OVA complex (25.D1.16; gift of Dr. Ronald Germain, National Institutes of Health, Bethesda, MD) washed, and then evaluated on a FACSCalibur™ (Becton Dickinson). All Abs including isotype controls were purchased from BD Biosciences.
Western Blot.
DCs were lysed in TBS-1% Triton. Proteins were separated on a 5–15% acrylamide Ready Gel (Bio-Rad Laboratories) under reducing conditions, transferred to nitrocellulose and detected with 216 F, a rabbit anti-MHC I heavy chain (HC)* Ab (gift of Hidde Ploegh), and HRP-goat anti-rabbit IgG Ab (Sigma-Aldrich). Blots were visualized using Super Signal West Pico (Pierce Chemical Co.).
Immunoprecipitation and Surface Biotinylation.
1.5 × 10⁷ cells were pulsed-labeled for 10 min with 1.5 ml of 3 mCi of 35S Protein Labeling Mix (NEN Life Science Products) in MEM without methionine/cysteine (ICN Biomedicals) + 10% dialyzed FBS (GIBCO BRL) and chased for various times in DC growth medium with a fivefold excess of unlabeled methionine and cysteine. Cells were then washed in cold PBS and incubated with 1.5 mg/ml of EZ-Link Sulfo-NHS-LC-LC-biotin (Pierce Chemical Co.) for 30 min on ice. The reaction was stop by adding 100 mM final glycine pH 8.0 and washing the cells in PBS-100 mM glycine. Cells were lysed in 1 ml lysis buffer (TBS-0.5% Triton, 20 mM glycine, and protease inhibitor cocktail [Roche]). Lysates were precleared with protein A sepharose (Zymed Laboratories). 100 μl aliquots were denatured by adding 2% final SDS at 100°C and then diluted into 1 ml lysis buffer. Proteins were immunoprecipitated using “Winken,” a rabbit anti–mouse H-2Kb cytoplasmic tail Ab bound to protein A sepharose, then washed in lysis buffer (total MHC I). The remaining 900 μl of lysate were immunoprecipitated with P8 Ab by the same protocole. Samples were eluted from beads in 100 μl SDS buffer (20 mM Tris HCl, pH 7.4, 100 mM NaCl, 10 mM glycine, 2% SDS) and boiled. 20 μl were analyzed directly (total HC–β2M complexes). The remaining 80 μl were diluted into 1 ml lysis buffer and biotinylated proteins were immunoprecipitated with Ultralink immobilized NeutrAvidin™ biotin-binding protein (Pierce Chemical Co.), then washed in 0.1% SDS-lysis buffer (surface biotinylated HC-β2M complexes). Proteins were separated on a 5–15% acrylamide Ready Gel under reducing conditions.
Retrovirus Generation and Transduction.
A fragment of OVA (obtained from Terry Potter, National Jewish Hospital, Denver, CO) containing nucleotides 63 to 1161 was amplified by PCR and subcloned into the pCMV/myc/cyto vector (Invitrogen) using the SalI and NotI sites. The resulting fusion construct was cloned by PCR into LZRS-pBMN using EcoRI sites. This viral vector was transfected into ΦNX-ecotropic cells, and virus was collected and used to infect DC progenitors (12).
Cell Fractionation.
Cells were homogenized in sucrose buffer (0.2 M sucrose, 10 mM imidazole, pH 7, 2 mM EDTA, protease inhibitor cocktail) by 20–30 passes in ball-bearing homogenizer (14). Postnuclear supernatants were centrifuged at 50,000 g for 30 min to separate cytosolic and membrane/vesicle fractions. OVA and cathepsin L (Cat L) were detected by Western blot using “Samson” an anti-OVA Ab raised in rabbit by immunization with OVA and a rabbit Ab to Cat L (gift of Ann Erickson, University of North Carolina, Chapel Hill, NC), respectively.
Results
Surface MHC I Expression Is Increased during Maturation of Mouse Bone Marrow–derived DCs.
We first investigated whether maturation of mouse bone marrow-derived DCs was accompanied by an increase in cell surface expression of MHC I as observed previously for human DCs (16, 17) and the D1 mouse DC-like cell line (15). CD11c+ DCs were enriched (>95%) and then activated using LPS. After a lag of ∼7 h, MHC I began to increase such that by 30 h its expression was 7-fold higher than in immature DCs. MHC II and CD86 expression began to increase shortly after LPS addition, reaching levels 12-fold and >30-fold higher (respectively) at 30 h (Fig. 1 A).
Figure 1.
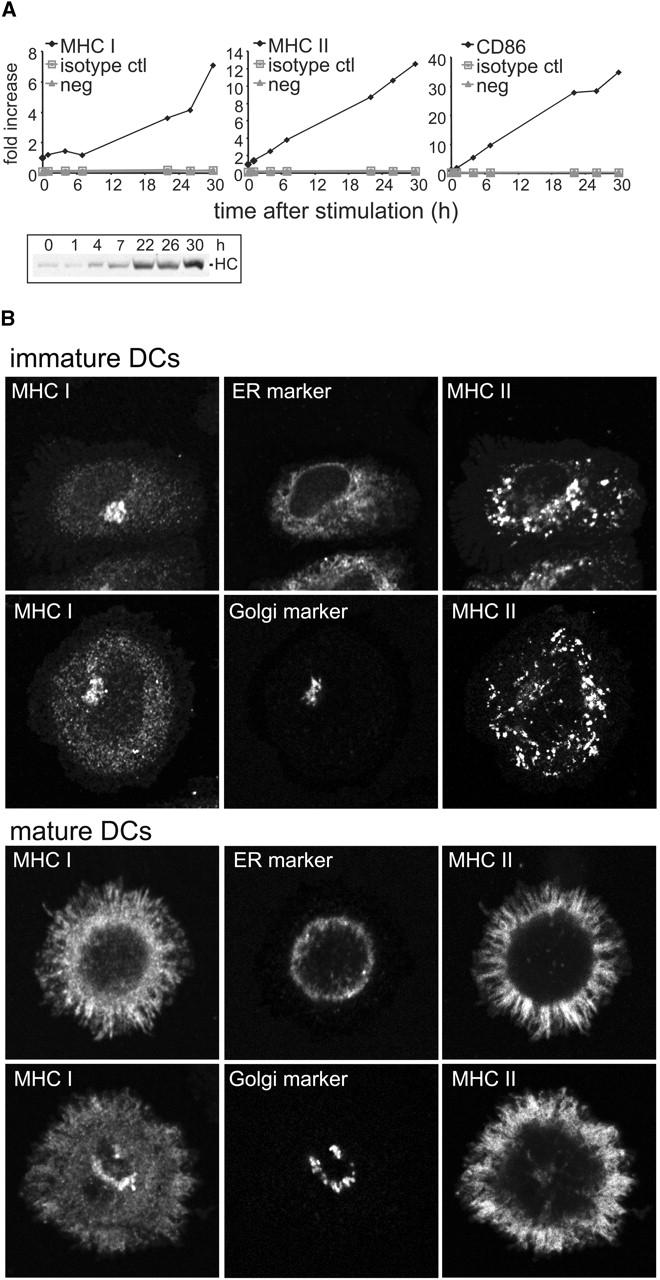

MHC I surface expression is up-regulated during DC maturation. (A) Immature CD11c-positive DCs from day 4 C57BL/6J cultures were purified using magnetic beads conjugated to anti-CD11c mAb. DCs were then replated and activated by addition of LPS. At various times, cells were harvested and the cell surface expression of MHC I H-2Kb, MHC II I-Ab, and CD86 was monitored by flow cytometry. Y-axis values represent the fold increase in surface expression of the different markers. The values were obtained by dividing the median fluorescence index (MFI) at the indicated time points by the MFI at time = 0. For the controls (nonstained cells and isotype control-stained cells), the values were obtained by dividing the MFI at the indicated time points by the MFI measured with the specific Ab at time = 0. In parallel, part of the cell samples were used for monitoring the expression of total MHC I HC by Western blot. One representative experiment out of four is shown. (B) Immature and mature (activated for 24 h by addition of LPS and cluster disruption) DCs were fixed, permeabilized, and stained using P8 (anti-HC-β2M complex), TIB 120 (anti-MHC II) and either anti-KDEL (ER-resident KDEL proteins) or anti-GM130 (Golgi marker), and analyzed by confocal microscopy. (C) Immature and mature (activated for 20 h by addition of LPS and cluster disruption) CD11c-positive DCs were purified, radiolabeled with 35S-methionine/cysteine, and chased in unlabeled medium. At the indicated times, cells were subject to surface biotinylation at 0°C. The resulting lysates were split into three unequal aliquots, two of which were used for immunoprecipitation of total HC and the assembled HC-β2M complex. Cell surface MHC I was determined by NeutrAvidin pull-down of immunoprecipitated HC-β2M complexes. Autoradiograms of one experiment (of two) are shown. Data from this experiment were quantified by digital scanning and plotted graphically as arbitrary units.
Because a portion of the MHC II is recruited from a preexisting lysosomal pool, we asked if DCs also contained an intracellular pool of MHC I. Using an Ab to the HC-β2M complex, intracellular MHC I staining was weak in immature DCs, exhibiting a fine punctate nearly reticular pattern reminiscent of the ER; some MHC I also accumulated in the perinuclear region (Fig. 1 B). The MHC I pattern did not, however, precisely overlap with that obtained using an Ab to all KDEL-containing ER content proteins (ER marker). The perinuclear pattern was similar to the staining obtained with an Ab to GM130, a marker for cisternal Golgi elements (Golgi marker), but was distinct from the MHC II-positive lysosomal structures characteristic of immature DCs. Similar MHC I staining was observed in MHC II-negative cells (e.g., macrophages or DC progenitors) present in the cultures (unpublished data). Thus, the MHC I pattern was not specific for DCs and may reflect the distribution of all newly synthesized plasma membrane proteins which often appear to accumulate in the Golgi region en route to the surface.
The pattern changed dramatically after maturation (Fig. 1 B). In mature DCs, most of the MHC I now appeared together with MHC II at the plasma membrane (top row). A fraction of the MHC I did remain intracellularly in a Golgi-like pattern (bottom row).
Thus, HC-β2M complexes do not appear to be sequestered in intracellular compartments in immature DCs. However, we could not eliminate the possibility that the cells contained a pool of unassembled MHC I since available Abs to mouse MHC I do not recognize free HC by immunofluorescence. To address this possibility, we monitored the expression of total HC by Western blot (Fig. 1 A, inset). After LPS addition, the increase in total HC increased at a rate very similar to the rate of increase of MHC I at the cell surface suggesting that the increased surface expression could be accounted for by new protein synthesis.
We next determined the kinetics of appearance of MHC I at the surface by pulse-chase radiolabeling followed by cell surface biotinylation. The radiolabeling itself probably stimulated DCs to mature because the 35S methionine/cysteine mix produced in bacteria contains agents such as LPS. Since the entire experiment lasted <4 h, however, any alteration of MHC I traffic should be minimal (e.g., the amounts of total and surface MHC I were found not to change at times <7 h after LPS treatment [Fig. 1 A]).
During the initial 15 min pulse, immunoprecipitation of total HC from whole cell lysates indicated that mature DCs synthesized ∼2.6-fold more HC than did immature DCs (Fig. 1 C, top row, t = 0) despite the fact that both DC types exhibited comparable amounts of overall protein synthesis (unpublished data). Although slightly more unstable in immature DCs, quantitation revealed that the HC was turned over at comparable rates in mature and immature cells (Fig. 1 C, right, top panel).
The formation of intact HC-β2M complexes (measured by immunoprecipitation with an Ab that detects only the complex) was also ∼2.6-fold higher in mature as compared with immature DCs (Fig. 1 C, middle panel, t = 0). Moreover by 15 min of chase, the fraction of total HC that had assembled into HC-β2M complexes was the same in both samples. Thus, assembly was at best only slightly more efficient in mature DCs, suggesting that maturation did not dramatically regulate the efficiency of HC-β2M complex formation. As found for total HC, HC-β2M complexes were lost at comparable rates (Fig. 1 C, middle, right panel). Note also that the apparent decrease in mobility of HC in immature DCs reflected a slight gel distortion.
Most importantly, the intact HC-β2M complexes were delivered to the plasma membrane with nearly the same kinetics (Fig. 1 C, bottom panel). As expected from the differential rates of synthesis, the absolute amounts of MHC I reaching the surface (and becoming accessible to biotinylation) were different. However, in both immature and mature DCs, plasma membrane arrival was began after a 15 min lag and was maximal by 60 min. Quantitation of these data suggested that immature DCs actually transported a slightly greater fraction (∼30% more) of newly synthesized MHC I to the surface. MHC I was somewhat less stable at the cell surface of immature DCs, presumably reflecting the immature DC's greater capacity for endocytosis, as found for MHC II (14, 25).
Taken together, these data indicate that the enhanced surface expression of MHC I in maturing DCs reflected new protein synthesis rather than assembly and recruitment of previously synthesized molecules.
Cross Presentation of Soluble OVA Follows the Classical MHC I Pathway.
Although mature DCs are known to stimulate CD8+ T cells better than immature DCs (16, 18, 19, 26), it is unknown if the formation of peptide–MHC I complexes from exogenous antigen is subject to regulation. To address this question, immature DCs were pulsed with soluble OVA for 2 h, washed, and stimulated by adding LPS. After dispersal of cell clusters by pipetting, the DCs were chased for up to 24 h. The DCs were then fixed and cultured with OT.1 CD8+ T cells specific for the H-2Kb/OVA complex. After being pulsed with >0.5/ml of OVA, DCs efficiently activated OT.1 T cells, with an optimal response at 7 h after inducing DC maturation (Fig. 2 A), as previously observed in D1 cells (6). Presentation was also >95% inhibited by the proteasome inhibitors lactacystin and epoxomicin, and in DCs isolated from TAP1−/− mice (unpublished data). Thus, presentation of exogenous soluble OVA by MHC I follows the classical MHC I pathway (5, 27, 28).
Figure 2.
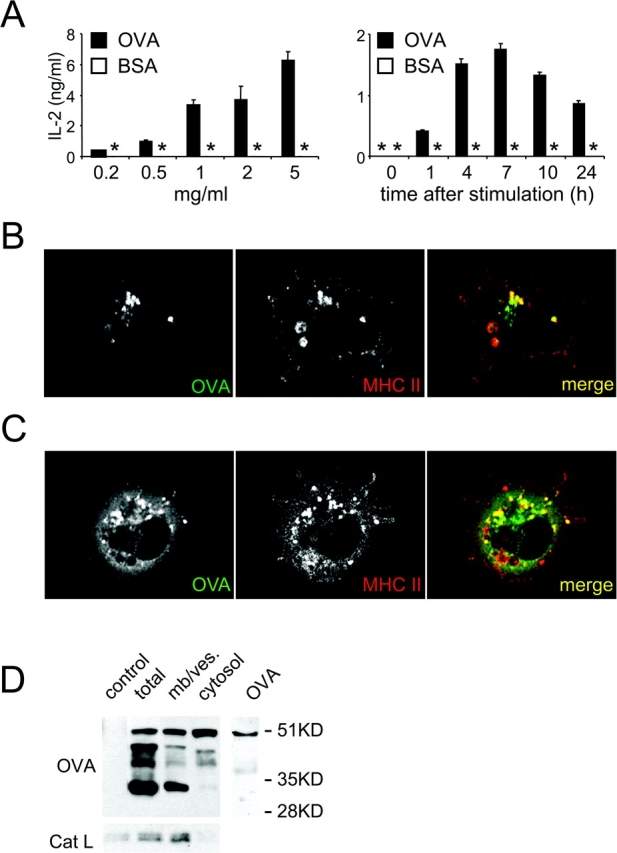
Cross presentation of soluble OVA follows the classical MHC I pathway (A) Left panel: immature B6D2F1 DCs were pulsed with indicated concentrations of OVA (or BSA as a control) for 2 h, washed, activated by LPS addition and cluster disruption. After a 7 h chase, the cells were fixed and cultured with OT.1 CD8+ T cells. Right panel: after a 2 h pulse with OVA 1 mg/ml (or BSA as a control), immature DCs were washed, stimulated by LPS addition and cluster disruption, chased for the indicated times, then fixed and added to OT.1 T cells. T cell responses were monitored by measuring IL-2 secretion. (B and C) Immature DCs were pulsed with FITC-OVA (5 mg/ml) for 30 min, washed, transferred to coverslips after disrupting DC clusters and incubated at 37°C for 30 min to allow cell attachment. DCs were then fixed, permeabilized, and stained using a rabbit anti-OVA Ab, and TIB 120 (anti-MHC II), and analyzed by confocal microscopy. (D) DCs were pulsed with OVA (5mg/ml) for 30 min, washed, and chased for 30 min after stimulation by LPS addition and cluster disruption. CD11c-positive DCs were purified using magnetic beads conjugated to anti-CD11c mAb. After homogenization, cytosolic and membrane/vesicle fractions were separated by ultracentrifugation, and probed for OVA and Cat L by Western blot. One representative experiment out of three is shown.
We also confirmed that exogenous OVA was transported to the cytosol, consistent with its reliance on the classical pathway for MHC I presentation (5, 6). DC cultures were pulsed with FITC-OVA for 30 min, washed, transferred to coverslips, and incubated for 30 min at 37°C to allow attachment. While OVA was always found in MHC II-positive lysosomes (Fig. 2, B and C), many MHC II-positive cells (∼75%) also exhibited a diffuse cytosolic-like staining (Fig. 2 C). Appearance of OVA in the cystosol occurred rapidly, within 30 min after internalization and receipt of the maturation stimulus, but long before the cells achieved a mature phenotype.
OVA transport to the cytosol was also demonstrated by subcellular fractionation. DC cultures were pulsed with OVA as above and chased for 30 min after stimulation by LPS and cluster disaggregation. After CD11c-positive DC homogenization, cytosol was separated from membranes and vesicles, and OVA detected by Western blot (Fig. 2 D). In total cell homogenates, four major bands were detected (51 kD, ∼45 kD, ∼39 kD, and ∼33 kD), with the 51 kD species corresponding to undigested OVA (right lane). The 51 and 33 kD bands were predominant in the membrane/vesicle fraction, presumably reflecting OVA and OVA fragments in endosomes and lysosomes. In the cytosol fraction, a clear 51 kD OVA was also detected, along with a small amount of the 45 and 39 kD band. To determine if the cytosolic OVA reflected the rupture of OVA-containing lysosomes during homogenization, the fractions were also probed for Cat L, a soluble content protein of lysosomes. Little if any Cat L was detected in the cytosol fraction indicating that there was little lysosomal rupture (Fig. 2 D).
CD11c-negative Cells Internalize and Transport Soluble OVA Into the Cytosol but Do Not Exhibit Cross Presentation.
FITC-OVA was also internalized by ∼60% of the CD11c-negative, MHC II-negative cells (e.g., progenitors or macrophages) that contaminate all DC cultures (Fig. 3 A). Surprisingly, in up to 75% of these cells, OVA was detected in the cytosol (Fig. 3, B and C), although the pattern of OVA fragments detected differed from those seen in DCs (Fig. 2 D). Thus, egress of OVA or OVA fragments to the cytosol did not appear to be a unique property of CD11c-positive DCs.
Figure 3.
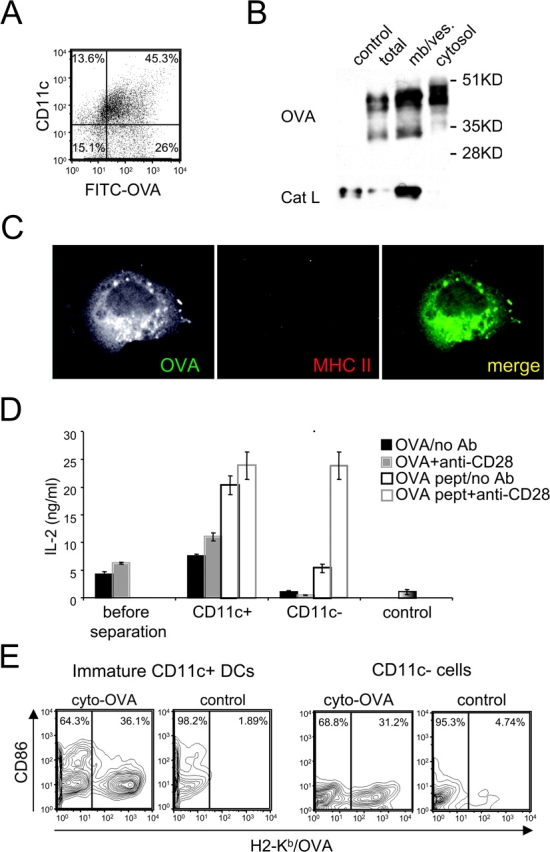
CD11c-negative cells internalize and transport soluble OVA into the cytosol but do not exhibit cross presentation. (A) Immature B6D2F1 DC cultures were pulsed with FITC-OVA (5 mg/ml) for 30 min, then washed. FITC-OVA uptake and cell surface expression of CD11c were monitored by flow cytometry. (B) DC cultures were pulsed with OVA (5 mg/ml) for 30 min, washed, and chased for 30 min. CD11c-negative cells were separated from DCs using magnetic beads conjugated to anti-CD11c mAb. After homogenization of CD11c-negative cells, cytosolic and membrane/vesicle fractions were separated by ultracentrifugation, and probed for OVA and Cat L by Western blot. (C) DC cultures were pulsed with FITC-OVA (5 mg/ml) for 30 min, then washed. Cells were transferred on coverslips and incubated at 37°C for 30 min to allow their attachment. Cells were then fixed, permeabilized, and stained using a rabbit anti-OVA Ab, and TIB 120 (anti-MHC II), and analyzed by confocal microscopy. (D) DC cultures were pulsed with 1 mg/ml of OVA for 2 h, washed, activated with LPS and cluster disruption, and chased for 7 h. After fixation, CD11c-positive DCs were separated from CD11c-negative cells as in B. Mixed cultures before separation of OVA-pulsed cells (or BSA-pulsed cells as a control), CD11c-positive and CD11c-negative fractions (>95%) were then cultured with OT.1 T cells in the presence or absence of anti-CD28 mAb. T cell activation was monitored at 24 h by measuring IL-2 production. ND indicates “not done.” (E) Day 2 DC cultures were infected using a recombinant retrovirus encoding a cytoplasmic OVA construct. Cell surface expression of OVA/H2-Kb complexes (x-axis) and CD86 (y-axis) was monitored by flow cytometry on CD11c-negative and CD11c-positive cells at day 4. As a control noninfected cells were used. One representative experiment out of three is shown.
We next asked if the CD11c-negative cells were capable of cross presentation. The cultures were pulsed with OVA for 2 h, washed, stimulated by LPS and cluster disruption, and chased for 7 h. After fixation, CD11c-positive and CD11c-negative populations were isolated. Only the CD11c-positive fractions activated OT.1 T cells when exposed to OVA (Fig. 3 D). In marked contrast, no activation was seen with the CD11c-negative fraction, either in the presence or absence of anti-CD28. CD11c-negative cells were capable of presenting OVA peptide to OT.1 T cells particularly in the presence of anti-CD28. Thus, despite being able to internalize OVA and transport OVA (or OVA fragments) to the cytosol, the CD11c-negative population was unable to mediate cross presentation.
CD11c-negative Cells and Immature CD11c-positive DCs Can Form OVA Peptide–MHC I Complexes from Endogenously Expressed OVA.
These results suggested that there are additional steps downstream of antigen egress that were important elements of the cross presentation pathway; such elements might be missing in CD11c-negative cells. It was thus of interest to determine if the CD11c-negative cells could form MHC I-peptide complexes from endogenously expressed OVA. Using a recombinant retrovirus encoding a cytoplasmic OVA construct, day 2 cultures were infected to insert the construct into proliferating precursor cell populations (12). CD11c-positive and –negative cells were assayed by FACS® using the 25D1.1.16 mAb specific for OVA peptide/H2-Kb complex (29). As shown in Fig. 3 E, significant reactivity was found on both populations, indicating that both cell populations were capable of generating the peptide–MHC I complex from endogenous OVA. Thus, despite their inability to cross present internalized OVA that had reached the cytosol, the CD11c-negative cells could process and present endogenous antigen on MHC I. Importantly, the CD11c-positive DCs used for these experiments were of the immature (CD86-low) phenotype, as the cultures were not treated with LPS before isolation. Thus, the OVA peptide–MHC I complex was generated even in immature DCs, indicating that the endogenous pathway was not dependent on DC maturation.
Cross Presentation of Exogenous OVA Is Differentially Regulated by DC Maturation.
Because peptide–MHC I complexes could form from endogenous OVA in immature DCs, we next asked if cross presentation by DCs is similarly independent of DC maturation. Cultures were pulsed with OVA for 2 h and washed carefully to avoid disruption of cell clusters, itself a potential maturation stimulus (14). After a 7 h chase, the cells were then fixed to prevent maturation and cultured with OT.1 CD8+ T cells. As shown in Fig. 4 A (left panel), the unstimulated DCs were unable to cross present OVA, suggesting that DC maturation was in fact required to activate cross presentation. This was in marked contrast to DCs subjected to dispersal of the cell clusters by repeated pipetting and addition of LPS before the 7 h culture period. These “LPS-treated and cluster disrupted” DCs were efficient at cross presentation despite expressing no more MHC I than unstimulated cells (Fig. 4 B); presentation of preprocessed OVA peptide was similar in all cases (Fig. 4 A, right panel). In fact, cluster disruption alone was found to be a potent stimulus of cross presentation while LPS alone (in the absence of cluster disruption) was almost totally ineffective (Fig. 4 A, left panel).
Figure 4.
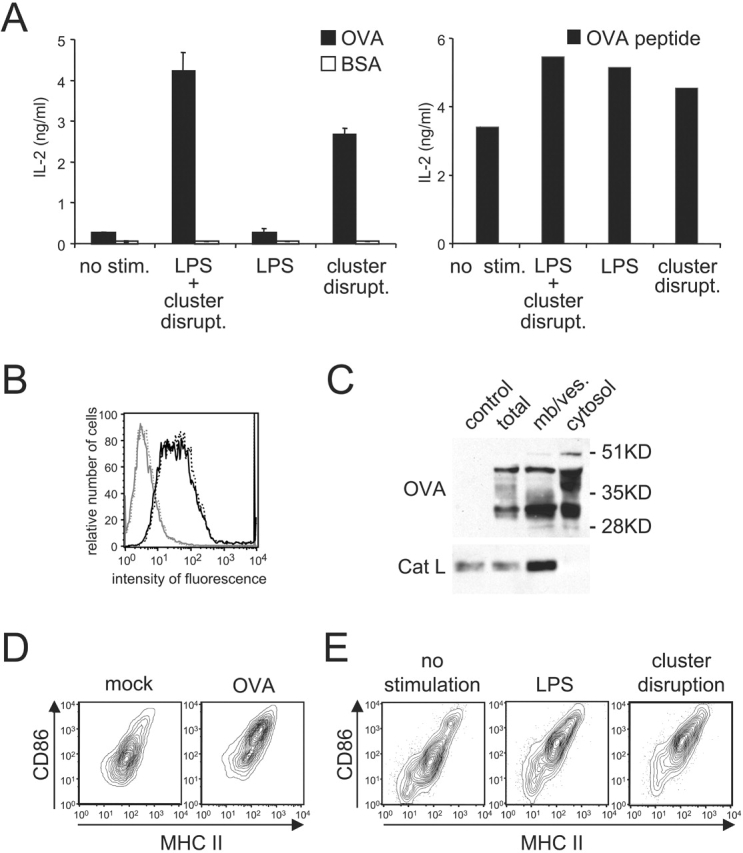
Cross presentation of soluble OVA is differentially regulated by DC maturation. (A) Left panel: immature B6D2F1 DCs were pulsed with OVA or BSA (1 mg/ml) for 2h in 24 well-plates where the cells were originally plated, washed carefully to avoid disruption of cell clusters (by adding media slowly along the wall of each well and then aspirating gently media at the same spot, repeatedly), and chased for 7 h with or without stimulation before fixation and culture with OT.1 T cells. Right panel: OVA-pulsed cells and T cells were cultured in the presence of OVA peptide. T cell responses were monitored at 24 h by measuring IL-2 release. (B) After the pulse-chase, MHC I H-2Kb surface expression was evaluated by flow cytometry on the CD11c-positive population of “LPS-treated and cluster disrupted” (solid black line) or unstimulated OVA-pulsed cells (dashed black line). The solid and dashed gray lines depict staining with an isotype control on stimulated and unstimulated cells, respectively. On the x-axis, the fluorescence intensity is given, whereas the y-axis depicts the relative cell number. (C) DCs were pulsed with OVA (5 mg/ml) for 30 min, washed, and chased for 30 min. CD11c-positive cells purified using magnetic beads conjugated to anti-CD11c mAb. After homogenization, cytosolic and membrane/vesicle fractions were separated, and probed for OVA and Cat L by Western blot. (D) After 7 h in culture, maturation state of “unstimulated” 2 h OVA-pulsed DCs (i.e., not treated with added LPS and not subjected to cluster disruption) and “mock-treated” DCs was examined by measuring surface expression of MHC II (x-axis) and CD86 (y-axis) by flow cytometry on the CD11c-positive population. (E) The capacity of the stimuli LPS and “cluster disruption” to trigger DC maturation was monitored on the CD11c-positive population of unpulsed cultures activated for 7 h as described above. One representative experiment out of three is shown.
The inability of clustered DCs to mediate cross presentation did not appear to reflect an inability to transfer internalized OVA from endocytic compartments to the cytosol. As found for cells treated by cluster disruption and LPS (Fig. 2), intact OVA and OVA fragments were found in the cytosolic fraction of the unstimulated DCs remaining in clusters after exposure to antigen (Fig. 4 C). Appearance in the cytosol fraction was temperature-dependent, however, as incubation of DC clusters with OVA at 0°C before cell fractionation did not result in soluble or cytosolic OVA (unpublished data).
Similarly, “unstimulated,” 2 h OVA-pulsed DCs (i.e., cells not treated with added LPS and not subjected to cluster disruption) also exhibited increased surface expression of both CD86 and MHC II (Fig. 4 D). This effect was attributable to OVA since “mock-treated” cells failed to increase CD86 and MHC II levels unless LPS was added or the clusters were dispersed before the 7 h culture (Fig. 4 E).
These results suggested that exposure to OVA alone triggered at least some features of DC maturation. We assayed various commercial sources of OVA for LPS and found that all contained significant amounts of this contaminant. Attempts to remove the contaminating LPS (e.g., by affinity chromatography using Kuttsuclean [11]) were not successful. While these results were initially bothersome, they allowed an important conclusion, namely that not all maturation stimuli were capable of activating cross presentation.
To examine this suggestion in greater detail, we tested various stimuli known to induce DC maturation and MHC II–restricted presentation for their capacity to promote cross presentation. OVA-pulsed DCs were cultured for 7 h in the presence of each stimulus. Relative to “LPS and cluster disruption” treatment, none of the stimuli tested were able to promote cross presentation (Fig. 5 A). This was despite the fact that all triggered phenotypic DC maturation as indicated by increased expression of MHC II and CD86 (Fig. 5 B) as well as MHC II presentation (see below).
Figure 5.
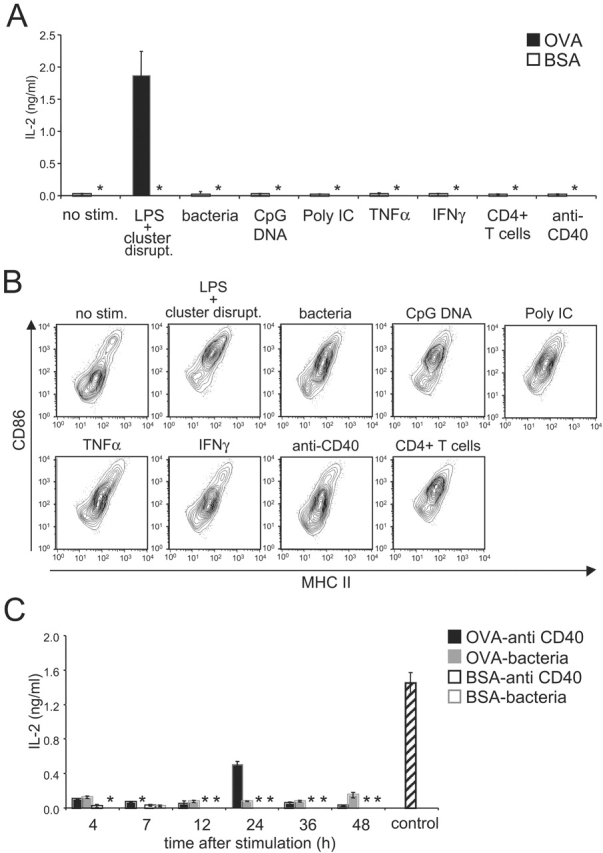
Not all maturation stimuli induce cross presentation. (A) Immature B6D2F1 DCs were pulsed with OVA (1mg/ml) or BSA as a control for 2 h, washed, activated by addition of the indicated stimuli, and chased for 7 h before fixation and culture with OT.1 T cells. T cell responses were monitored at 24 h by measuring IL-2 release. (B) Maturation was monitored at the level of cell surface MHC II (x-axis) and CD86 (y-axis) by flow cytometry on the CD11c-positive population of unpulsed day 4 cultures activated with the indicated stimuli for 7 h. (C) The procedure was the same as described in panel A except that the DC cultures were chased for the indicated periods after stimulation with anti-CD40 Ab or bacteria. As a control, OVA-pulsed DCs stimulated for 7 h by addition of LPS and by cluster disruption were used. Results are representative of three experiments. (*) indicates below level of detection.
Since there was some variability in the extent to which these agents stimulated phenotypic maturation, we asked if the ability to induce cross presentation was time dependent. OVA-pulsed DCs were therefore treated for 24 h with each agent (unpublished data), at which time the anti-CD40 Ab was also found to produce DCs capable of stimulating OT.1 T cells. As shown in Fig. 5 C, DCs stimulated by bacteria for up to 48 h were still unable to activate OT.1 T cells. In contrast, after 24 h of stimulation with anti-CD40 Ab, DCs cross presented OVA and activated T cells, although to a somewhat lesser extent than DCs matured by cluster disruption (Fig. 5 C, control). Therefore, only “cluster disruption” and anti-CD40 Ab, were capable of inducing cross presentation, albeit with different efficiencies.
Cross Presentation of OVA Internalized Before DC Activation.
Internalized antigens can be sequestered by immature DCs for extended periods (at least 60 h) before being processed and loaded onto MHC II upon maturation (11). We next determined if immature DCs could also sequester antigens for cross presentation. OVA-pulsed DCs were chased for up to 48 h without further stimulation. At various times of chase, the DCs were “cluster disrupted,” and then incubated in presence of LPS for an additional 7 h before fixation and assay using OT.1 T cells. The DCs were capable of cross presenting OVA that had been internalized at least up to 48 h before receiving the activation stimulus (Fig. 6 A). While the amount of cross presentation decreased with time, at 24 and 48 h, significant OT.1 T cell responses were observed corresponding respectively to 45 and 25% of the amount of presentation exhibited by DCs activated and assayed immediately after exposure to OVA.
Figure 6.
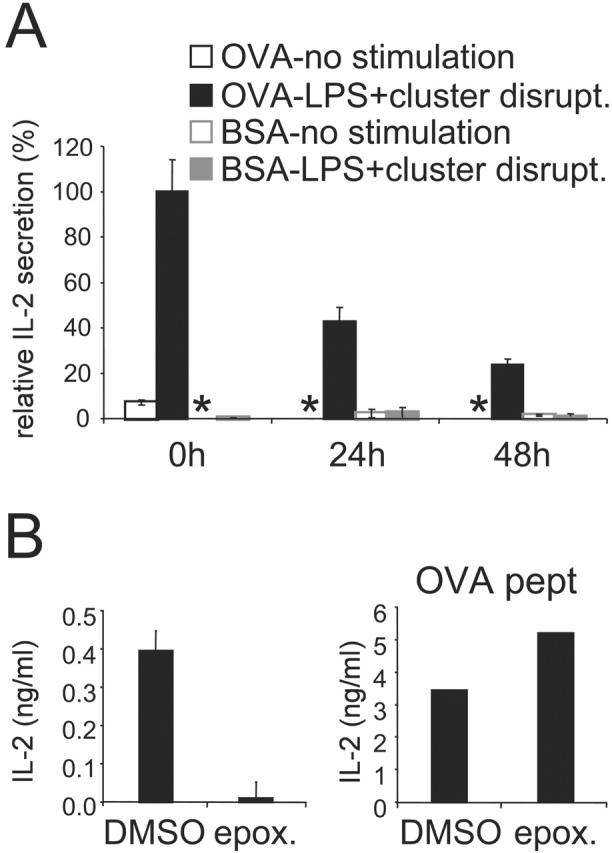
Cross presentation of OVA internalized prior DC activation. (A) Immature B6D2F1 DC were pulsed with OVA or BSA as a control (1 mg/ml) for 2 h, washed, and chased for 0 to 48 h before activation for 7 h with LPS and cluster disruption. Cells were then fixed and added to OT.1 T cells. (B) After a 24 h chase and 30 min before activation, epoxomicin 1 μM final was added to the cells and was also present during the 7 h stimulation period. As a control we used DMSO in which the drug was stocked. Cells were then fixed and added to OT.1 T cells. Right panel: OVA-pulsed cells and T cells were cultured in presence of OVA peptide. At 24 h, as marker of T cell activation IL-2 secretion was measured. One representative experiment out of three is shown, and the values represent the mean of triplicate wells. (*) indicates below level of detection.
These results suggested that an intracellular pool of OVA is sequestered in endosomes or in the cytosol, or that a pool of OVA peptide–MHC I complexes is retained intracellularly (possibly in the ER), until the appropriate stimulus is given to trigger cross presentation. To help distinguish between these possibilities, we examined the role of the proteasome in presentation of previously internalized OVA. After a 24 h chase and 30 min before DC stimulation, epoxomicin was added. In the presence of the drug, cross presentation was completely inhibited, although there was no effect on the presentation of OVA peptide (Fig. 6 B). This suggested that proteasome activity was required to generate OVA peptides even 24 h after antigen internalization. Thus, unstimulated DCs appear to keep an intracellular pool of antigen sequestered, controlling cross presentation at least in part by controlling access to the proteasome.
Presentation of OVA by MHC I and MHC II Is Differentially Regulated.
The results presented thus far have indicated that various stimuli known to promote DC maturation and enhance MHC II presentation were unable to activate cross presentation. This suggests that although presentation of exogenous antigens on both MHC I and MHC II are subject to regulation, the two pathways are regulated differentially. As procedures used to measure MHC II presentation by bone marrow–derived DCs typically (and perhaps inadvertently) also involve a cluster disruption step, it was critical to determine directly if cluster disruption might also be required for presentation on MHC II. As OVA has both MHC I– and MHC II–restricted epitopes, we were able to monitor its presentation on both pathways in parallel.
OVA-pulsed DCs from B6D2F1 mice were cultured with OT.1 CD8+ T cells or the DO.11.10 CD4+ T cell hybridoma (specific for I-Ad /OVA complexes). As shown in Fig. 7, DCs stimulated with LPS alone or LPS together with cluster disruption exhibited comparable abilities to activate DO.11.10 CD4+ T cells. Thus, cluster disruption was not required for MHC II presentation. As mentioned earlier, our OVA contained detectable levels of endotoxins which induced DC maturation (unpublished data). These results for MHC II presentation contrast dramatically with those for MHC I cross presentation, as cross presentation of the same antigen under the same conditions was dependent on disrupting DC clusters before T cell assay (Fig. 4 A).
Figure 7.
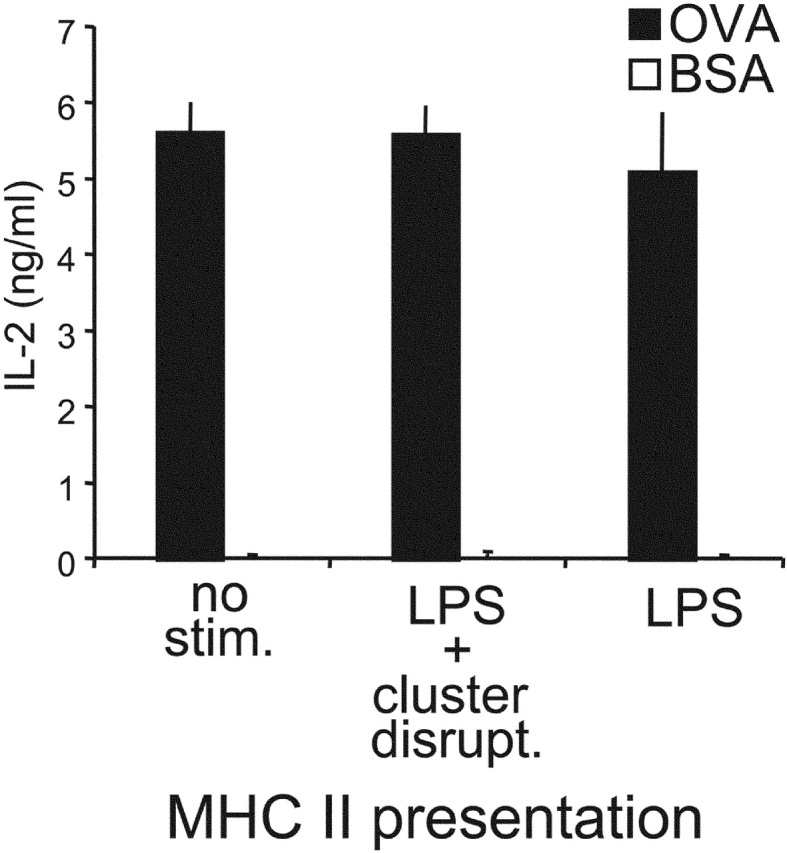
Presentation of OVA by MHC I and MHC II is differentially regulated during DC maturation. Immature B6D2F1 DCs were pulsed with OVA 1mg/ml (or BSA as a control) for 2 h, washed, activated or not by addition of the indicated stimuli, and chased for 7 h before fixation and culture with CD4+ DO.11.10 T cells (specific for I-Ad/OVA). T cell responses were monitored at 24 h by measuring IL-2 release. One representative experiment out of >5 is shown.
Discussion
We have shown that presentation of exogenous antigens by MHC I, like presentation by MHC II, is subject to developmental regulation in mouse bone marrow–derived DCs. Although immature DCs are capable of accumulating extracellular antigen intended for cross presentation, presentation will not occur until the cells are activated to mature. Rather unexpectedly, we also found that the signals required for activating the MHC I and MHC II pathways are at least in part distinct. An array of microbial products, cytokines, and physical stimuli all activated the processing and presentation of exogenous antigen on MHC II molecules, but only a subset of these also facilitated MHC I cross presentation of the same antigen. At a minimum, this finding indicates that the exogenous MHC I and MHC II pathways in bone marrow–derived DCs are differentially regulated during DC maturation.
Several lines of evidence now indicate that DC maturation itself is not a homogenous process leading to a single species of mature, immunostimulatory cell. In the case of MHC II responses, different stimuli produce mature DCs that vary markedly in their cytokine release profiles and thus in their functional properties. Maturation induced by LPS or dsRNA produces DCs that secrete IL-12 and IFN-γ thus polarizing CD4+ T cell responses to yield Th1 cells. TNFα-matured DCs, on the other hand, produce neither IL-12 nor IFN-γ, and induce CD4+ T cells to produce both Th1 and Th2 cells (8, 16). Both types of DCs, however, are phenotypically mature and virtually indistinguishable on the basis of surface markers (e.g., high MHC II, high costimulatory molecules). As yet unspecified signals may produce “partially mature” DC populations found in lymph nodes which process and present antigens on their MHC II but express low costimulatory molecules, a phenotype which may induce T cell tolerance rather than immunity (30, 31).
Out of the nine stimuli tested, all known to induce phenotypic DC maturation and to promote MHC II presentation, only two (cluster disruption and anti-CD40 Ab) also activated MHC I cross presentation. That additional signals might be needed to activate MHC I cross presentation by DCs was first suggested by studies showing that the generation of CTL immunity is CD4+ T helper dependent (32). In vivo, anti-CD40 Ab can replace CD4+ T cells suggesting that CD40–CD40L interaction programs APCs to activate naive CD8+ T cells (20–22). However, the nature of this phenomenon at the cellular level, or the identity of the APCs involved, has remained unknown. Our in vitro experiments showed that anti-CD40 Ab induced phenotypic DC maturation but also activated those aspects of the maturation pathway that enabled cross presentation. Conceivably, anti-CD40 Ab acts similarly in vivo. The requirement for CD4+ T cells in triggering CTL responses in vivo may also reflect the ligation of CD40 on DCs by CD40L on the T cells. In vitro, the CD40L-negative CD4+ T cell hybridoma DO.11.10 was unable to activate cross presentation. The hybridoma did, however, trigger phenotypic DC maturation indicating that T cells also have CD40L-independent effects on immature DCs.
More effective at inducing cross presentation was the “disruption” of the DC clusters by gentle pipetting. Although this stimulus is well known to induce DC maturation and MHC II presentation in vitro (14, 33), we do not understand its mechanism. Cluster disruption may act by briefly damaging the DC plasma membrane, inducing a stress response (34). More likely, however, is a signal generated by disrupting cell–cell adhesion. Indeed, DC clusters are stabilized by E-cadherin–mediated interactions with the addition of anti-E-cadherin Ab actually opposing the induction of maturation (35). While it is unlikely that disruption of homotypic interactions between immature DCs is relevant in peripheral tissues, but E-cadherin–mediated adhesion events seem likely to play an important role in maintaining DC residence in epithelia (36). Conceivably, “cluster disruption” in vitro mimics DC migration from the epidermis in vivo.
Cross presentation is far more efficient in DCs than in other cell types. Thus, it is likely that one or more of these steps is specific to or amplified in DCs. These might also be the steps subject to regulation. The initial release of internalized antigen from endosomes to the cytosol although is a candidate, does not appear to be sufficient to allow cross presentation as OVA was detected in the cytosol of unstimulated DCs unable to cross present. Moreover, we found that many CD11c-negative cells in our cultures also seemed to have OVA in the cytosol yet were unable to mediate cross presentation. This result suggests that there are additional steps downstream of antigen egress that are important elements of the cross presentation pathway in DCs and that may be regulated during maturation.
DCs and CD11c-negative cells expressing OVA can both process and present peptides derived from endogenous OVA on MHC I, although they are unable to cross present peptides derived from exogenous OVA. Thus, these cells must possess the machinery for peptide processing and loading onto MHC I, e.g., functional proteasomes, transporter associated with antigen processing (TAP1/2), and ER chaperone proteins assisting MHC I assembly and peptide loading (1). This result suggests that the inability of the cells to cross present lies between the antigen egress and proteasome steps.
As virtually all nucleated cells present peptides derived from endogenous proteins on MHC I to avoid killing by NK cells, we suspect that the endogenous pathway is not subject to the type of maturation-dependent regulation seen for cross presentation. If so, then it must be that DCs regulate only those components of the cross presentation pathway that are not common to the endogenous pathway. Alternatively, DCs possess mechanisms to selectively favor one pathway over the other, perhaps (as suggested above) by down-regulating the production of endogenous MHC I ligands that may compete with trace amounts of exogenous ligands internalized by endocytosis (24).
Acknowledgments
We are grateful to the members of the Mellman/Warren laboratory for their valuable advice, and Julia Unternaehrer and Jan Fredrik Simons for their critical reading of the manuscript.
L. Delamarre was supported by a fellowship from the Association pour la Recherche contre le Cancer. This work was supported by the NIH (R37-AI34098) and by the Ludwig Institute for Cancer Research.
Footnotes
Abbreviation used in this paper: HC, heavy chain.
References
- 1.Rock, K.L., I.A. York, T. Saric, and A.L. Goldberg. 2002. Protein degradation and the generation of MHC class I-presented peptides. Adv. Immunol. 80:1–70. [DOI] [PubMed] [Google Scholar]
- 2.Yewdell, J.W., C.C. Norbury, and J.R. Bennink. 1999. Mechanisms of exogenous antigen presentation by MHC class I molecules in vitro and in vivo: implications for generating CD8+ T cell responses to infectious agents, tumors, transplants, and vaccines. Adv. Immunol. 73:1–77. [DOI] [PubMed] [Google Scholar]
- 3.Sigal, L.J., S. Crotty, R. Andino, and K.L. Rock. 1999. Cytotoxic T-cell immunity to virus-infected non-haematopoietic cells requires presentation of exogenous antigen. Nature. 398:77–80. [DOI] [PubMed] [Google Scholar]
- 4.Banchereau, J., and R.M. Steinman. 1998. Dendritic cells and the control of immunity. Nature. 392:245–252. [DOI] [PubMed] [Google Scholar]
- 5.Norbury, C.C., B.J. Chambers, A.R. Prescott, H.G. Ljunggren, and C. Watts. 1997. Constitutive macropinocytosis allows TAP-dependent major histocompatibility complex class I presentation of exogenous soluble antigen by bone marrow-derived dendritic cells. Eur. J. Immunol. 27:280–288. [DOI] [PubMed] [Google Scholar]
- 6.Rodriguez, A., A. Regnault, M. Kleijmeer, P. Ricciardi-Castagnoli, and S. Amigorena. 1999. Selective transport of internalized antigens to the cytosol for MHC class I presentation in dendritic cells. Nat. Cell Biol. 1:362–368. [DOI] [PubMed] [Google Scholar]
- 7.Mellman, I., and R.M. Steinman. 2001. Dendritic cells: specialized and regulated antigen processing machines. Cell. 106:255–258. [DOI] [PubMed] [Google Scholar]
- 8.Kalinski, P., C.M. Hilkens, E.A. Wierenga, and M.L. Kapsenberg. 1999. T-cell priming by type-1 and type-2 polarized dendritic cells: the concept of a third signal. Immunol. Today. 20:561–567. [DOI] [PubMed] [Google Scholar]
- 9.Watts, C., and S. Amigorena. 2000. Antigen traffic pathways in dendritic cells. Traffic. 1:312–317. [DOI] [PubMed] [Google Scholar]
- 10.Trombetta, E.S., M. Ebersold, W. Garrett, M. Pypaert, and I. Mellman. 2003. Activation of lysosomal function during dendritic cell maturation. Science. 299:1400–1403. [DOI] [PubMed] [Google Scholar]
- 11.Inaba, K., S. Turley, T. Iyoda, F. Yamaide, S. Shimoyama, C. Reis e Sousa, R.N. Germain, I. Mellman, and R.M. Steinman. 2000. The formation of immunogenic major histocompatibility complex class II- peptide ligands in lysosomal compartments of dendritic cells is regulated by inflammatory stimuli. J. Exp. Med. 191:927–936. [DOI] [PMC free article] [PubMed] [Google Scholar]
- 12.Chow, A., D. Toomre, W. Garrett, and I. Mellman. 2002. Dendritic cell maturation triggers retrograde MHC class II transport from lysosomes to the plasma membrane. Nature. 418:988–994. [DOI] [PubMed] [Google Scholar]
- 13.Boes, M., J. Cerny, R. Massol, M. Op den Brouw, T. Kirchhausen, J. Chen, and H.L. Ploegh. 2002. T-cell engagement of dendritic cells rapidly rearranges MHC class II transport. Nature. 418:983–988. [DOI] [PubMed] [Google Scholar]
- 14.Pierre, P., S.J. Turley, E. Gatti, M. Hull, J. Meltzer, A. Mirza, K. Inaba, R.M. Steinman, and I. Mellman. 1997. Developmental regulation of MHC class II transport in mouse dendritic cells. Nature. 388:787–792. [DOI] [PubMed] [Google Scholar]
- 15.Rescigno, M., S. Citterio, C. Thery, M. Rittig, D. Medaglini, G. Pozzi, S. Amigorena, and P. Ricciardi-Castagnoli. 1998. Bacteria-induced neo-biosynthesis, stabilization, and surface expression of functional class I molecules in mouse dendritic cells. Proc. Natl. Acad. Sci. USA. 95:5229–5234. [DOI] [PMC free article] [PubMed] [Google Scholar]
- 16.Cella, M., M. Salio, Y. Sakakibara, H. Langen, I. Julkunen, and A. Lanzavecchia. 1999. Maturation, activation, and protection of dendritic cells induced by double-stranded RNA. J. Exp. Med. 189:821–829. [DOI] [PMC free article] [PubMed] [Google Scholar]
- 17.MacAry, P.A., M. Lindsay, M.A. Scott, J.I. Craig, J.P. Luzio, and P.J. Lehner. 2001. Mobilization of MHC class I molecules from late endosomes to the cell surface following activation of CD34-derived human Langerhans cells. Proc. Natl. Acad. Sci. USA. 98:3982–3987. [DOI] [PMC free article] [PubMed] [Google Scholar]
- 18.Albert, M.L., B. Sauter, and N. Bhardwaj. 1998. Dendritic cells acquire antigen from apoptotic cells and induce class I-restricted CTLs. Nature. 392:86–89. [DOI] [PubMed] [Google Scholar]
- 19.Regnault, A., D. Lankar, V. Lacabanne, A. Rodriguez, C. Thery, M. Rescigno, T. Saito, S. Verbeek, C. Bonnerot, P. Ricciardi-Castagnoli, and S. Amigorena. 1999. Fcgamma receptor-mediated induction of dendritic cell maturation and major histocompatibility complex class I-restricted antigen presentation after immune complex internalization. J. Exp. Med. 189:371–380. [DOI] [PMC free article] [PubMed] [Google Scholar]
- 20.Bennett, S.R., F.R. Carbone, F. Karamalis, R.A. Flavell, J.F. Miller, and W.R. Heath. 1998. Help for cytotoxic-T-cell responses is mediated by CD40 signalling. Nature. 393:478–480. [DOI] [PubMed] [Google Scholar]
- 21.Ridge, J.P., F. Di Rosa, and P. Matzinger. 1998. A conditioned dendritic cell can be a temporal bridge between a CD4+ T- helper and a T-killer cell. Nature. 393:474–478. [DOI] [PubMed] [Google Scholar]
- 22.Schoenberger, S.P., R.E. Toes, E.I. van der Voort, R. Offringa, and C.J. Melief. 1998. T-cell help for cytotoxic T lymphocytes is mediated by CD40-CD40L interactions. Nature. 393:480–483. [DOI] [PubMed] [Google Scholar]
- 23.Machy, P., K. Serre, M. Baillet, and L. Leserman. 2002. Induction of MHC class I presentation of exogenous antigen by dendritic cells is controlled by CD4+ T cells engaging class II molecules in cholesterol-rich domains. J. Immunol. 168:1172–1180. [DOI] [PubMed] [Google Scholar]
- 24.Lelouard, H., E. Gatti, F. Cappello, O. Gresser, V. Camosseto, and P. Pierre. 2002. Transient aggregation of ubiquitinated proteins during dendritic cell maturation. Nature. 417:177–182. [DOI] [PubMed] [Google Scholar]
- 25.Cella, M., A. Engering, V. Pinet, J. Pieters, and A. Lanzavecchia. 1997. Inflammatory stimuli induce accumulation of MHC class II complexes on dendritic cells. Nature. 388:782–787. [DOI] [PubMed] [Google Scholar]
- 26.Sauter, B., M.L. Albert, L. Francisco, M. Larsson, S. Somersan, and N. Bhardwaj. 2000. Consequences of cell death: exposure to necrotic tumor cells, but not primary tissue cells or apoptotic cells, induces the maturation of immunostimulatory dendritic cells. J. Exp. Med. 191:423–434. [DOI] [PMC free article] [PubMed] [Google Scholar]
- 27.Brossart, P., and M.J. Bevan. 1997. Presentation of exogenous protein antigens on major histocompatibility complex class I molecules by dendritic cells: pathway of presentation and regulation by cytokines. Blood. 90:1594–1599. [PMC free article] [PubMed] [Google Scholar]
- 28.Reis e Sousa, C., and R.N. Germain. 1995. Major histocompatibility complex class I presentation of peptides derived from soluble exogenous antigen by a subset of cells engaged in phagocytosis. J. Exp. Med. 182:841–851. [DOI] [PMC free article] [PubMed] [Google Scholar]
- 29.Porgador, A., J.W. Yewdell, Y. Deng, J.R. Bennink, and R.N. Germain. 1997. Localization, quantitation, and in situ detection of specific peptide-MHC class I complexes using a monoclonal antibody. Immunity. 6:715–726. [DOI] [PubMed] [Google Scholar]
- 30.Inaba, K., S. Turley, F. Yamaide, T. Iyoda, K. Mahnke, M. Inaba, M. Pack, M. Subklewe, B. Sauter, D. Sheff, et al. 1998. Efficient presentation of phagocytosed cellular fragments on the major histocompatibility complex class II products of dendritic cells. J. Exp. Med. 188:2163–2173. [DOI] [PMC free article] [PubMed] [Google Scholar]
- 31.Hawiger, D., K. Inaba, Y. Dorsett, M. Guo, K. Mahnke, M. Rivera, J.V. Ravetch, R.M. Steinman, and M.C. Nussenzweig. 2001. Dendritic cells induce peripheral T cell unresponsiveness under steady state conditions in vivo. J. Exp. Med. 194:769–779. [DOI] [PMC free article] [PubMed] [Google Scholar]
- 32.Heath, W.R., and F.R. Carbone. 2001. Cross-presentation, dendritic cells, tolerance and immunity. Annu. Rev. Immunol. 19:47–64. [DOI] [PubMed] [Google Scholar]
- 33.Gallucci, S., M. Lolkema, and P. Matzinger. 1999. Natural adjuvants: endogenous activators of dendritic cells. Nat. Med. 5:1249–1255. [DOI] [PubMed] [Google Scholar]
- 34.Grembowicz, K.P., D. Sprague, and P.L. McNeil. 1999. Temporary disruption of the plasma membrane is required for c-fos expression in response to mechanical stress. Mol. Biol. Cell. 10:1247–1257. [DOI] [PMC free article] [PubMed] [Google Scholar]
- 35.Riedl, E., J. Stockl, O. Majdic, C. Scheinecker, W. Knapp, and H. Strobl. 2000. Ligation of E-cadherin on in vitro-generated immature Langerhans-type dendritic cells inhibits their maturation. Blood. 96:4276–4284. [PubMed] [Google Scholar]
- 36.Tang, A., M. Amagai, L.G. Granger, J.R. Stanley, and M.C. Udey. 1993. Adhesion of epidermal Langerhans cells to keratinocytes mediated by E-cadherin. Nature. 361:82–85. [DOI] [PubMed] [Google Scholar]