To the editor:
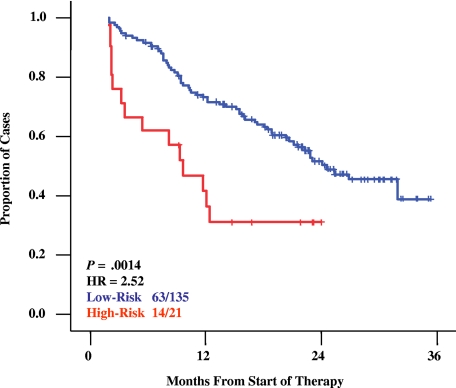
We recently described a tumor gene expression model capable of identifying multiple myeloma (MM) patients at high risk for short survival after high-dose therapy (HDT) that is also independent of standard high-risk variables.1 This model was also recently shown to be able to identify high risk in newly diagnosed MM treated with HDT at the Mayo clinic.2 It is unclear if this model is specific for newly diagnosed patients treated with HDT regimens that use stem-cell rescue. Therefore, we evaluated its utility using data on 156 relapsed myeloma patients enrolled in the APEX phase 3 clinical trial that compared single-agent bortezomib (B) to high-dose dexamethasone (HD).3,4 First, we reconstructed the U133Plus2.0-derived 17-gene model1 using U133AB data on 144 newly diagnosed cases. Correlation of the resultant risk scores was high (r = 0.89; P < .001), indicating the model was not platform dependent. As shown in Figure 1, the model identified a high-risk group within the APEX trial with significantly shorter survival times (Figure 1, P = .001, hazard ratio [HR] = 2.5). The high-risk model also successfully identified high risk in patients treated with either B or HD monotherapy (B: P = .049, HR = 2.3; HD: P = .017, HR = 2.5). These data strongly suggest that outcome-related gene expression patterns are similar in relapsed and newly diagnosed MM patients and appear to be independent of the specific therapeutic modality, suggesting that they identify patients who are generally insensitive to currently used drugs or drug combinations. Two important implications follow from these observations. First, as varied gene expression patterns often represent distinct underlying biologic states of normal5 and transformed tissues,6–7 it seems likely that the high-risk signature is related to a biologic phenotype of drug resistance and/or rapid relapse in multiple myeloma. It is important to note that the similar proportions of high risk in newly diagnosed disease and this relapse cohort are puzzling as we have observed an increase in the proportion of high-risk cases in serial studies diagnostic and relapse samples (REF 1). We believe that this may be attributable to the significant early mortality of newly diagnosed high-risk disease and that the high risk in the relapse cohort is derived from disease that shifted from low to high risk during disease evolution. As such, it is unlikely that this form of high-risk disease is well represented in current phase 3 trials. Prospective recognition of this signature should offer the opportunity for new clinical trial design with deeper translational and correlative studies to characterize the most relevant molecular pathways determining this aggressive clinical phenotype with the hope of identifying new therapeutic opportunities. Second, while some hurdles remain to routine clinical implementation of a molecular-based high-risk stratification, this work highlights that a specific subset of myeloma patients continues to receive minimal benefit from current therapies. A practical method to identify such patients should notably improve patient care. For patients predicted to have a favorable outcome, efforts to minimize toxicities might be indicated while those predicted to have poor outcome, regardless of the current therapy used, might be considered for early administration of experimental regimens.
Figure 1.
Kaplan Meier survival analysis of overall survival in the APEX dataset. A 16-gene model derived from U133A/B data was applied to 156 relapsed myeloma patients treated in the APEX trial. The model identified 13.5% and 86.5% as high-risk and low risk, respectively. Overall survival estimates of one-year actuarial probabilities are 74% for low-risk disease (blue) versus 32% for high-risk (red; P = .001; HR = 2.52).
Authorship
Conflict-of-interest disclosure: The authors declare no competing financial interests.
This work was supported by National Institutes of Health grants CA55819 (J.D.S., F.Z., B.B.) and CA97513 (J.D.S.) and by the Lebow Fund to Cure Myeloma and the Nancy and Stephen Grand Philanthropic Foundation.
Correspondence: Fenghuang Zhan, Myeloma Institute for Research and Therapy, University of Arkansas for Medical Sciences, 4301 W Markham, Little Rock, AR 72205; e-mail: zhanfenghuang@uams.edu; or Barbara Bryant, Millennium Pharmaceuticals, 40 Lansdowne St, Cambridge, MA 02139; e-mail: Barb.Bryant@mpi.com.
References
- 1.Shaughnessy JD, Jr, Zhan F, Burington BE, et al. A validated gene expression model of high-risk multiple myeloma is defined by deregulated expression of genes mapping to chromosome 1. Blood. 2007;109:2276–2284. doi: 10.1182/blood-2006-07-038430. [DOI] [PubMed] [Google Scholar]
- 2.Chng WJ, Kuehl WM, Bergsagel PL, Fonseca R. Translocation t(4;14) retains prognostic significance even in the setting of high-risk molecular signature. Leukemia. 2007 Nov 29; doi: 10.1038/sj.leu.2404934. [Epub ahead of print] [DOI] [PubMed] [Google Scholar]
- 3.Mulligan G, Mitsiades C, Bryant B, et al. Gene expression profiling and correlation with outcome in clinical trials of the proteasome inhibitor bortezomib. Blood. 2007;109:3177–3188. doi: 10.1182/blood-2006-09-044974. [DOI] [PubMed] [Google Scholar]
- 4.Richardson PG, Sonneveld P, Schuster MW, et al. Bortezomib or high-dose dexamethasone for relapsed multiple myeloma. N Engl J Med. 2005;352:2487–2498. doi: 10.1056/NEJMoa043445. [DOI] [PubMed] [Google Scholar]
- 5.Shaffer AL, Rosenwald A, Hurt EM, et al. Signatures of the immune response. Immunity. 2001;15:375–385. doi: 10.1016/s1074-7613(01)00194-7. [DOI] [PubMed] [Google Scholar]
- 6.Ferrando AA, Neuberg DS, Staunton J, et al. Gene expression signatures define novel oncogenic pathways in T cell acute lymphoblastic leukemia. Cancer Cell. 2002;1:75–87. doi: 10.1016/s1535-6108(02)00018-1. [DOI] [PubMed] [Google Scholar]
- 7.Ross ME, Mahfouz R, Onciu M, et al. Gene expression profiling of pediatric acute myelogenous leukemia. Blood. 2004;104:3679–3687. doi: 10.1182/blood-2004-03-1154. [DOI] [PubMed] [Google Scholar]


