

Abstract
Accumulation of chemically altered proteins is a noted characteristic of biological aging, and increasing evidence suggests a variety of deleterious cellular developments associated with senescence. Concomitantly, the “aging” of protein deposits associated with numerous neurological disorders may involve covalent modifications of their constituents. However, the link between disease-related protein aggregation and chemical alterations of its molecular constituents has yet to be established. The present study of amyloidogenic α-synuclein protein points to a decisive change in the biophysical behavior of growing protein aggregates with progressive photo-activity in the visible range of the electromagnetic spectrum. I hypothesize that the photo-activity induced by filament formation is governed by the same mechanism as seen for the intrinsic chromophore of 4-(p-hydroxybenzylidene)-5-imidazolinone-type in the family of green fluorescent proteins. This type of the covalent alterations is initiated concurrently with amyloid elongation and involves a complex multi-step process of chain cyclization, amino acid dehydration, and aerial oxidation. Given that different stages in filament formation yield distinct optical characteristics, the photo-activity induced by amyloidogenesis may have application in molecular biology by enabling in vivo visualization of protein aggregation and its impact on cellular function.
Keywords: α-synuclein, amyloidal diseases, chemical modification, fluorescence, filament formation, intrinsic chromophore
Biological aging is a fundamental process that results in a progressive decline in cellular function over time and constitutes the major risk factor with respect to the development of cancer, neurodegenerative, cardiovascular, and other human diseases. A certain dichotomy currently exists with respect to contemporary views of biological aging, and it remains uncertain whether aging is a developmental process that is ultimately controlled by a genetic program involving a limited number of genes or rather represents an accumulation of stochastic events that damage the soma and thereby cause a physiological decline of the organism. The latter perspective accentuates the role of chemical alteration of proteins in functional determinism recognized by biology.
A large variety of cellular malfunctions might trigger detrimental modifications of proteins in vivo and cause a decline of physiological activities and the proliferation of “negative” functions. For instance, impairment of mitochondrial oxidative metabolism and an imbalance in the production of cellular peroxidases result in elevated levels of reactive oxygen species (ROS) that may exceed the antioxidant capacity of the cell, thereby contributing to the etiology of age-related abnormalities. In fact, under normal cellular conditions, only a small fraction of the total consumed oxygen is expected to be reduced to ROS to form hydroperoxide with subsequent degradation to water (Stadtman 1992; Berlett and Stadtman 1997; Squier and Bigelow 2000; Stadtman and Levine 2000; Shringarpure and Davies 2002). Yet, hydroperoxide generates the highly reactive hydroxyls that nonspecifically react with a wide range of amino acids yielding aldehydes and ketones (Levine et al. 1994; Squier and Bigelow 2000; Stadtman and Levine 2000; Shringarpure and Davies 2002). Reactive species generated following lipid peroxidation can also react with proteins to yield carbonyls (Levine et al. 1994). Altogether, evaluation of the age-related increase in carbonyl content of proteins isolated from a broad range of tissues reveals that almost 50% of the total protein might be oxidized in aged humans (Stadtman 1992). Further, oxidative stress provokes the nitration of intracellular proteins through the formation of peroxynitrite from nitric oxide and hydroxyl ions (Squier and Bigelow 2000; Aulak et al. 2004; Koeck et al. 2004). To this end, tyrosine nitrosylation is known to interfere with intracellular signaling pathways by preventing the phosphorylation of tyrosines (Hanafy et al. 2001), whereas within structural proteins (e.g., actin and neurofilaments) nitrotyrosines affect protein polymerization and disrupt cytoskeletal elements (Crow et al. 1997; Eiserich et al. 1999). Chemical damage such as deamidation of N and Q residues is common in proteins, and the age-related deamidation of N residues to a mixture of iso-aspartate and aspartate weakens protein stability and affects enzymatic activity (Gafni 1997). Cyclic imides formed by D and E side chains lead to isomerization, enantiomerization, and peptide bond cleavage (Means and Feeney 1971; Gafni 1997). Deamidated material has been detected in insulin amyloids (Nilsson and Dobson 2003), and minor deamidation (<5%) of amylin-derived peptides was sufficient to initiate protein aggregation (Nilsson et al. 2002).
Altogether, the detrimental modifications of protein molecules in vivo suggest an imbalance of ROS production, impairment of the antioxidant defense system, and malfunction of the cellular mechanism of protein turnover. This progressive metabolic failure might initiate various folding disorders and encourage disease-specific protein–protein interactions. Note that protein aggregates in the form of fibrous deposits constitute the primary pathological hallmarks of various neurodegenerative diseases (e.g., Alzheimer's, Parkinson's, prion diseases, multiple system atrophy, etc.) that usually emerge in late adulthood. Whether the chemical stabilization of growing protein aggregates (e.g., proto-fibers) is likely to require for accretion of insoluble aggregates (e.g., fibers) that, in turn, causes cell degeneration remains to be investigated.
Over the last decade, several model systems have emerged for studies of neurological disorders associated with excessive protein filament formation in the brain. One example is α-synuclein (αS) that belongs to a gene family of the closely related α-, β-, and γ-synucleins (Lavedan 1998). In the brain, only α- and β-synucleins are expressed, and they are enriched at presynaptic terminals in songbirds, rats, and humans. The biological function of synucleins in mammals remains unknown. Mounting evidence indicates, however, that αS is the actual building block of the fibrillary component of Lewy bodies and neuritis that are found in the brains of Parkinson's disease (PD) patients (Spillantini and Goedert 2000). Furthermore, this protein was found in a distinct type of pathological structures in related disorders such as multiple system atrophy (Galvin et al. 1999; Spillantini and Goedert 2000), Hallervorden-Spatz syndrome (Arawaka et al. 1998), and sporadic and familial forms of Alzheimer's disease (Nussbaum and Ellis 2003; Bennett 2005). The involvement of the synucleins in the etiology of a large number of human amyloidal diseases makes them an important subject of intensive investigation and potential targets for pharmaceutical and therapeutic intervention. Here a new emphasis is placed on the αS aggregation to elucidate the progression of protein chemical modification and its impact on filament protein polymerization. Overall, biophysical assessment of the αS aggregation revealed unique photo-physical features of αS amyloids that are similar to those of chromoproteins of the green fluorescent protein (GFP) family. These findings provide insights into the molecular mechanism of amyloidal diseases and suggest a new approach for imaging protein aggregation and aging in vivo.
Results
The primary sequence of human αS is comprised of 140 amino acid residues that can be divided into three distinct domains (Fig. 1). The positively charged residues are located mainly in the N-terminal region (residues 1–60), whereas the negatively charged residues cluster in the C-terminal part of the protein (residues 96–140). Both positively and negatively charged regions are separated by a hydrophobic domain (residues 61–95), providing thereby an amphiphilic triblock polypeptide. The N-terminal domain assimilates three disease-causing mutation sites (A30P, E46, and A53T) and covers the majority of the six imperfect repeats of KTKEGV that approach α-helical conformation in phospholipid membranes (Ulmer et al. 2005; Beyer 2006). The highly hydrophobic central region is essential for αS aggregation and forms the core of amyloid fibrils (Giasson et al. 2001; Du et al. 2003). The acidic C-terminal part regulates amyloid aggregation and locates on the fibril surface (Hoyer et al. 2004). Residues 109–140 are organized as a tandem repeat of 16 residues that constitutes specific binding sites for Ca2+, Cu2+, and other ions (Hoyer et al. 2004). Further, the C-terminal portion of the αS appears to be rather rigid, as seen in its relative resistance to extensive proteolytic degradation (Hoyer et al. 2002, 2004; de Laureto et al. 2006). Overall, αS belongs to a family of natively unfolded proteins that are characterized by a high net charge and low hydropathy.
Figure 1.

(A) Schematic presentation of human α-synuclein. The central most hydrophobic domain, N-, and C-terminal regions are shown in gray, red, and green, respectively. (B) Ab initio protein structure prediction with the HMMSTR/Rosetta algorithm (http://www.bioinfo.rpi.edu/~bystrc/hmmstr/server.php). Arrows identify the location of a single W residue incorporated into the protein by site-directed mutagenesis. (C) Diagram shows the imperfect repeats of KTKEGV (dashed), the autosomal mutations A30P, E46, and A53T (yellow), the tripeptide GYQ that represents a potential site for an intrinsic chromophore (gray). The single mutations of F94 and Y125 are underlined.
A wide variety of factors facilitate the formation of αS amyloids in vitro, indicating a high propensity of this sequence for intermolecular interactions. Filament formation can be caused by mono- and polyvalent ions, elevation of temperature, small amines and synthetic macromolecules, oxidative and nitrative stresses, and many other environmental insults (Uversky et al. 2001b; Hoyer et al. 2002; Goers et al. 2003 a,b; Norris et al. 2003; Rochet et al. 2004; Bennett 2005; Uversky et al. 2005; Du et al. 2006). Interestingly, the time required for αS fibril formation in physiological buffers varies from 90 to 300 h without major impact on the amyloid growth phase (Hoyer et al. 2002; Goers et al. 2003b) but with significant variation of the duration of the lag phase. Furthermore, the shaking arrangements and solvent viscosities both affect the rate of aggregation in a nonmonotonic manner (Munishkina et al. 2004). All this raises a serious question about the role of random diffusion on disease-related protein aggregation and amyloid growth.
Protein aggregation
The αS aggregation reactions were initiated by incubation of a freshly prepared monomeric protein solution (70–300 μM) at 37°C with constant stirring. Aliquots were withdrawn at different time points and diluted to appropriate concentrations for biophysical characterization. To elucidate the role of the C-terminal and central hydrophobic regions in filament formation, the fluorescent analogs of αS, F94W, and Y125W, with a single aromatic residue (F or Y) substituted by W residue were used (Fig. 1). This mapping strategy allowed one (1) to engage a variety of spectroscopic techniques in studies of protein aggregation as well as (2) to recognize the specific structural shifts required for αS amyloid fibril growth and stability.
Initially, the kinetics of the aggregation process were monitored by binding of the amyloid-specific dye thioflavin T (TfT), which is a sensitive probe for protein filament formation (Nilsson 2004). As expected, TfT fluorescence changed abruptly after several days of incubation, indicating growth of αS amyloids (Hoyer et al. 2002; Goers et al. 2003b; Hoyer et al. 2004). In general, the TfT binding curves (Fig. 2, dashed line) can be reduced to three distinct stages: (I) The lag phase without obvious structural changes, (II) the transition per se as indicated by the sudden increase in TfT fluorescence, and (III) the post-transition stage where the dye fluorescence leveled off, indicating that the aggregation reaction had reached an apparent equilibrium state (i.e., steady-state stage). Although TfT-experiments with wild-type proteins and its F94W or Y125W variants have produced essentially similar results, the intrinsic W fluorescence pointed to gradual structural changes at an early stage of the aggregation reaction, i.e., during the lag phase of TfT-kinetic curves (Fig. 2, solid line). In the case of Y125W mutant, a threefold increase in W fluorescence intensity was observed after 10 h of reaction followed by another 20-fold increase prior to the amyloid growth phase. In fact, both spectral parameters—emission intensity (Fig. 2A) and peak position (Fig. 2B)—indicated the multi-step structural shift during the lag phase of aggregation, i.e., before formation of the amyloidal binding sites recognized by the TfT-dye. Experiments with F94W mutant reproduced the first increase in W emission intensity, whereas the second transition apparently did not occur (data are not shown). Thus, it appears that the first stage in αS aggregation involves a major conformational rearrangement, whereas the second transition is restricted to a small domain surrounding W125, i.e., residing within the C-terminal portion of the αS protein.
Figure 2.

Aggregation kinetics of αS(Y125W) variant as probed by the W fluorescence intensity (A) and the position of the W emission spectrum (B). The excitation was set at 295 nm and the spectra were recorded over the 310–450 nm range for 6 μM protein probes. The kinetics profile monitored by TfT binding is also shown for comparison (dashed line). Incubation conditions: 70 μM protein in PBS (pH 7.4) at 37°C.
To visualize the molecular forms accumulated during the aggregation, transmission electron microscopy images of protein solutions were collected at different times over the entire reaction trace (Fig. 3). During the lag phase (<100 h), all samples were dominated by spheroid particles of ∼30 nm in diameter (panel A). Given the monomeric protein size of ∼3 nm (Uversky et al. 2001a), these spheroids might contain up to 10 αS molecules. Temperature-induced aggregation encouraged the spheroids to merge and, in some cases, one-dimensional aggregates comprised from merged sheroids are clearly visible. At the steady-state phase (>200 h), amyloids with a width of 4–9 nm and length of >100 nm constitute the major population among the protein aggregates (panel B). Further aging of the protein solution (>300 h) led to the formation of an extensive network of mature tightly packed amyloids and the number of spheroidal colonies decreased dramatically (panel C).
Figure 3.

Negatively stained transmission electron micrographs of αS aggregates after 30 (A), 200 (B), and 400 (C) h of reaction. Aggregates accumulated in the presence of PVP-8 (D), PVP-58 (E), or polylysine-83 (F) after 300 h of reactions are also shown. Incubation conditions: 70 μM protein in 150 mM NaCl/25 mM Tris-HCl (pH 7.4) at 37°C. Polymer concentration was 1 g/L. Bar scales 100 nm.
Photo-physical behavior of mature αS amyloids
To elucidate the structural pathways leading to proteinacious fibrils, the electronic spectra of αS solutions were monitored at various stages of aggregation reaction. The most striking discovery involved the steady-state stage of amyloidal aggregation. In particular, UV-VIS spectroscopy revealed that the aged αS protein (e.g., 300 h of reaction) produces a major absorbance/excitation peak at 280 nm (associated with aromatic residues in the protein) together with the second peak at 380 nm and a small shoulder at 450 nm of unknown origin (Fig. 4A). Importantly, all three electronic states are able to produce greenish fluorescence in the 500 nm range. Quantum yield of the amyloidal emission depends strongly on solvent conditions and rises with increasing ionic strength of the solution (inset). Below, the electronic states associated with the excitation bands at 280, 380, and 450 nm will be referred to as the A-, B-, and C-forms, respectively.
Figure 4.

Photo-activity of mature α-synuclein amyloids. (A) Fluorescence excitation spectra of αS in 150 mM NaCl/25 mM Tris-HCl (1), PBS (2), and 25 mM Tris (3). (Inset) Fluorescence emission spectra with excitation at 450 nm. (B) Normalized fluorescence emission spectra of mature αS amyloids with excitation at 280, 350, 380, and 450 nm (left to right). (Inset) Alterations in emission intensity (green) and peak position (red). Aggregation reactions were carried out on 150 μM protein at 37°C for 300 h. Spectra were recorded for 6 μM protein probe.
Amyloid emission varies considerably with excitation wavelength, indicating the presence of distinct fluorescent forms (Fig. 4B). For instance, the excitation of the A-forms provided a strong emission at 350 nm with a small shoulder at 450 nm, whereas the B-forms yielded fluorescence near 480 nm, and allows for almost 10-fold attenuation in emission efficiency (inset). Finally, the C-forms became fluorescent upon irradiation with blue light, with a maximum emission at 520 nm. Variation of the excitation conditions from 280 nm to 450 nm yields a set of distinct emission bands in the range of 300–600 nm and allows for an adjustment in the emission efficiency by two orders of magnitude (inset). Importantly, emission heterogeneity of the αS solutions suggests diverse molecular architectures that present in the ensemble of mature amyloids.
Spectroscopic examination of F94W and Y125W proteins provided further insight into the mechanism of photo-activity induced by filament formation. In this case, the maturation of amyloids was also accompanied by the appearance of a new emission band in the visible range. In fact, both samples exhibited spectacular transformation of a fluorescence emission at 350 nm (associated with intrinsic W fluorescence) to blue fluorescence centered at 480 nm (Fig. 5A). Absorbance/excitation spectra showed peaks at 280 nm and 380 nm together with the featured peak at 450 nm. It appears that there is a mutual inter-conversion between A-, B-, and C-forms, given that the decreasing peaks at 280 and 380 nm are followed by the growing absorbance at 450 nm. Furthermore, there is a striking correlation between the excitation peak at 450 nm and emission at 480 nm, as well as between excitation peak at 380 nm and emission band at 520 nm. Indeed, these spectral sets are nearly mirror images of one another, and in some cases the emission arises from contributions from distinct chromophore units as judged from absorbance. These data suggest that during the αS amyloid formation a chemical modification of the polypeptide is likely to occur, producing new fluorescent moieties (new light emitters) that have distinct electronic structures.
Figure 5.

(A) Fluorescence excitation (λ < 450 nm) and emission (λ > 450 nm) spectra of wild-type αS protein (green) and its fluorescent analogs F94W (red) and Y125W (gray). Reactions were carried out by incubating the 150 μM sample in PBS (pH 7.4) at 37°C for 570 h. The emission difference between Y125W and F94W samples is shown by open circles. Each spectrum is normalized to the maximum intensity. (B) Effect of aggregation on the population of B- (1) and C- (2, 3) forms. The B-form (1) was generated with 150 μM wild-type protein, while the C-form was accumulated employing 150 μM (2) or 300 μM (3) F94W samples. (Inset) Fluorescence excitation (left) and emission (right) spectra of F94W after 470 h and 670 h of maturation (bottom to top). All spectra were recorded for 6 μM protein probe.
Generally speaking, the amyloidal emission can be initiated either by direct activation of the A-, B-, and C-forms or by means of fluorescence resonance electronic energy transfer (FRET) among the relevant molecular forms. Note that the absorbance spectrum of the B-form (λmax = 380 nm) overlaps well with the emission spectrum of W residues (λmax = 350 nm), thereby enabling FRET between aromatic residues of A-forms as donors and B-forms as acceptors. The experiments with the Y125W mutant provided strong support for this notion. The kinetic profile of Y125W polymerization reveals almost a 20-fold increase in W emission at the beginning of the amyloid growth and later a rapid decrease while the amyloids grow (Fig. 2). Given that W residues emit the light at the range from 350 to 370 nm, the decreasing W125 fluorescence most likely reflects the FRET between W125 and the growing population of the B-form, yielding an absorbance at 380 nm. Thus, the chemical modification of the aggregating proteins occurs concurrently with amyloid elongation, involves aromatic residues of the polypeptide, and may be required for stabilization of the growing protein aggregate.
Correlations with filament formation
The kinetic aspects of photo-activity induced by the filament formation were studied by monitoring optical parameters of the αS proteins over the entire course of the aggregation reaction (Fig. 5B). Experiments with wild-type protein showed the accumulation of B-forms (λabs = 380 nm) after 100 h of reaction (curve 1), i.e., concomitantly with accretion of amyloidal binding sites. Fluorescent analogs revealed a growing population of the C-forms at later stages of filament formation. In fact, the characteristic excitation peak at 450 nm slowly rose after 200 h of incubation, and an increase in protein concentration promoted this transformation (curves 2 and 3). Furthermore, the C-form appears to be important for stability of protein aggregates, given that αS samples with a higher concentration of C-forms exhibit high tolerance to harsh experimental conditions (Fig. 6A).
Figure 6.

(A) Fluorescence emission spectra of αS amyloids grown at protein concentration of 175 μM (1, 3) and 300 μM (2, 4). Spectra were recorded before (1, 2) and after (3, 4) the exposure of the αS amyloids to pH 11.0 for 24 h. (B) Fluorescence excitation spectra of αS amyloids grown at 70 μM without (1) and in the presence of PVP-8 (2), PVP-58 (3), and polylysine-83 (4). The emission spectra are shown in the inset. Morphologies of protein aggregates are displayed in Fig. 3. All aggregation reactions were carried out in PBS (pH 7.4) at 37°C for 300 h. Polymer concentration was 1 g/L. Spectra were recorded for 6 μM probe. The excitation was set at 450 nm.
To localize the potential sites for protein modification, the aggregation reactions were performed under conditions that allow controlling the final morphology of the protein solution by the presence of synthetic polymers. This issue has been investigated in significant detail, and speculations have been raised that polycations promote αS oligomerization through the formation of specific complexes with the C-terminal region of the protein, whereas neutral polymers enhance amyloid formation due to the excluded volume effects (Goers et al. 2003b; Munishkina et al. 2004). In the present study, the aggregation reactions were carried out in the presence of polylysines of 22 kDa and 83 kDa, while the poly(vinyl pyrrolidone) (PVP) polymers of 8 kDa and 53 kDa were chosen as neutral initiators of the aggregation reaction. The transmission electron microscopy (TEM) images (Fig. 3D–F) were collected after the completion of the amyloid growth, as indicated by the TfT binding curves. Altogether, the small neutral polymers (e.g., PVP-8) stabilized small spheroidal αS aggregates and, in fact, inhibited filament formation (panel D). The large polymer molecules enhanced αS oligomerization and networking (panels E and F). Importantly, the morphology of protein solutions was clearly different, yielding colonies of spheroids (panel D), branched amyloids with trapped spheroids (panel E), or long amyloidal aggregates with a twist in the direction of propagation (panel F). Despite these significant morphological differences, all samples, however, had rather similar photo-physical behavior. They produced two fluorescence excitation peaks at 280 nm and 380 nm with a single major emission peak at 520 nm, similar to the amyloids grown without polymers (Fig. 6B). Thus, the residues engaged in the formation of the photo-active site are located away from the molecular interfaces essential for protein oligomerization. Given that the C-terminal region of αS is located on the outer amyloidal surface, it seems likely that the C terminus provides a prime location for the photo-active site associated with amyloid emission.
Altogether, this study suggests a number of important hypotheses, which stress on causes of photo-activity induced by amyloidogenesis. First, the formation of αS amyloid entails chemical alterations of the aromatic residues (λabs = 280 nm) to the relevant forms that provide absorbance at 380 nm. Notably, the electronic spectra of mature αS amyloids exhibit a large red shift of >100 nm from that of aromatic residues as compared to a ∼30-nm red shift in proteins with oxidized or dimerized tyrosines (Means and Feeney 1971; Conway et al. 2001; Krishnan et al. 2003; Malencik and Anderson 2003). Second, the chemical modification of polypeptide occurs at early stages of amyloid formation concurrently with amyloid elongation and leads to the formation of new light emitters. Third, the chromophore structure changes continuously over the entire course of filament formation. This process involves the expansion of conjugated double bonds along the surrounding residues providing the red shift of the electronic spectrum (λabs = 450 nm). Fourth, the formation of the photo-active site in αS involves the C-terminal region, which contains the phosphorylation site S129. Fifth, the high stability of the C-form accumulated in concentrated samples points to the role for longitudinal fibril interfaces in chemical modification of αS amyloids and stabilization of insoluble protein aggregates. Whether this phenomenon involves intermolecular bridging or reflects the formation of the distinct environment required for chemical modifications to proceed is a topic of our ongoing investigation.
Discussion
It is generally assumed that the polypeptides present in amyloid fibers differ solely in conformation from their soluble, native counterparts. This view, however, requires further revision, since small amounts of chemically altered proteins are difficult to detect. I demonstrate that maturation of protein amyloids lead to the occurrence of a new emission band in the visible range of the electromagnetic spectrum. This phenomenon points to the formation of the intrinsic chromophore within the protein aggregates, with involvement of the aromatic residues (tyrosine and tryptophan) of the protein. The filament formation proceeds with concomitant conversion of chemically altered side chains, and the overall amyloid emission represents a fluorescent timeline of the aggregation reaction: “Young” protein produces UV fluorescence, while the “aged” amyloid protein yields emissions in the visible range. Fluorescent analogs of amyloidal proteins offer an easy tool to manipulate the optical properties of the growing protein aggregates. Altering the location of a single W probe along the protein sequence allows both shifting the amyloidal excitation/emission conditions over a wide spectral range and controlling quantum yield of amyloidal emission. For instance, the emission spectrum of matured αS(Y125W) variant exhibits a 40-nm blue shift and 100-fold enhancement of amyloid emission when compared to wild-type protein. Indeed, fluorescent analogs of amyloidogenic proteins could eventually constitute a new class of noninvasive markers for protein localization and relative age of protein aggregation, offering new implements for biological imaging. Given that macro-crowding effects in vivo significantly accelerate amyloid formation (Munishkina et al. 2004), this approach might become a useful tool for imaging the protein deposition in living cells in real-time experiments.
Mechanism of chromophore formation
To provide some clues as to the origin of the photo-activity induced by protein aggregation, it is helpful to address the family of green fluorescent proteins (GFP) that are widely used in cell imaging as reporter-proteins for monitoring gene expression in eukaryotic and prokaryotic cells (Tsien 1998; Guerrero and Isacoff 2001; Miyawaki et al. 2003). In particular, the GFP-like proteins have the unique ability to form internal chromophores (usually one per chain) by self-catalyzed modification of the protein chain without participation of any external cofactors except oxygen (Tsien 1998; Zimmer 2002). The chromophore formation involves a series of chemical events (e.g., chain cyclization, amino acid dehydration, and aerial oxidation) that occur concomitant with protein folding and lead to creation of 4-(p-hydroxybenzylidene)-5-imidazolinone (Niwa et al. 1996, Tsien 1998). In fact, several chemical reactions occur in proteins, albeit they are difficult to detect (Beyer 2006; Chiarugi and Buricchi 2007). Many of them have in common the involvement of a G residue, a unique amino acid with respect to conformational variability in phi/psi space. The formation of 4-(p-hydroxybenzylidene)-5-imidazolinone in wild-type GFP involves a nucleophilic attack of a G67 amide on the carbonyl group of S65 residue, followed by conjugation of Cα–Cβ bond of Y66 residue and dehydrogenation of its aromatic ring (Tsien 1998; Zimmer 2002). This multi-step chemical reaction results in a system of conjugated double bonds that are capable of absorbing and emitting visible light. Altogether, the intrinsic chromophore consists of an imidazolone ring structure and the light emitter is the singlet excited state of its phenolate anion. The chromophore emission is highly dependent on the microenvironment and molecular dynamics. The inhibition of isomerization of the exo-methylene double bond of the chromophore accounts for efficient light emission of native GFPs, whereas the internal rotations, which distort the coplanarity of the chromophore (e.g., under the denaturing conditions), result in significant loss of GFPs fluorescence (Niwa et al. 1996, Chirico et al. 2003). The detailed scheme of this covalent modification includes a number of intermediate forms that are subject to FRET (Verkhusha et al. 2004). Chromophore emission can be tuned by modification of its local environment, providing a large diversity of fluorescent proteins (Chudakov et al. 2003). Noteworthy, this type of photo-activity induced by protein folding relies largely on the presence of a tripeptide of a XYG-type with residue X being S, R, Q, H, K, N, or D (Chudakov et al. 2003).
I report a novel class of biological molecules that produce visible emission during the formation of super-molecular amyloidal structures. More specifically, I hypothesize that during the αS aggregation new intrinsic chromophores are formed and populated over the course of amyloid maturation. Indeed, the spectroscopic trends of chromophore development in GFP-like proteins strongly resemble that measured for mature αS amyloids. The most notable similarities involve (1) the excitation peak at 380 nm associated with the dehydrogenation of the Y residue, i.e., a major aromatic part of the developing chromophore, (2) the red shift of the protein emission (from 350 to 540 nm) due to the augmentation of the conjugated double bonds through the protein structure, (3) the impact of folding conditions on chromophore optical properties, and finally (4) the amplification of chromophore emission via FRET between relevant fluorescent forms.
The C terminus accounts for chromophore formation in αS proteins
Analysis of the αS sequence revealed three residues (G132–Y133–Q134) within the C-terminal domain that represent the reverse version of the active tripeptide in GFP-like chromoproteins (Chudakov et al. 2003) and might provide a potential site for the chromophore formation in αS amyloids. In fact, the GYQ tripeptide presents in all known products of alternative αS splicing and are missed in less amyloidogenic β- or γ-synucleins (Biere et al. 2000; Beyer 2006). The formation of 4-(p-hydroxybenzylidene)-5-imidazolinone in αS proteins could involve covalent bonding between the Q134 amide and the carbonyl group of G132 residue, followed by conjugation of the Cα–Cβ bond of Y133 residue caused by the dehydration and aerial oxidation (Fig. 7). Cis-trans isomerization of multiple prolines within the C-terminal domain would facilitate the initial step in chromophore formation (i.e., cyclization) by populating configurations with proximal reacting groups. Furthermore, the C-terminal residues 109–140 have the apparent ability to organize a tandem repeat of 16 residues providing binding sites for multivalent ions (Hoyer et al. 2004). This conformational arrangement brings multiple K residues to close proximity of GYQ carbonyl groups. The hydrogen bond network among these groups may also contribute to chromophore formation. Note that pathological forms of αS in Lewy bodies include specific truncations at Y133 and D135, at D-115, D-119, and N-122 (Anderson et al. 2006). Finally, high local concentration of aromatic Y residues (125, 133, and 136) assures multiple FRET from the Y125 or Y136 to the developing chromophore at Y133 by means of the so-called “antenna effect” (Guillet 1985). One should not rule out the possibility, however, that the protein aggregation might encourage the interactions between the positively charged N-terminal part of the proteins and the negatively charged C-terminal domain. In this case, the modification might involve formation of intra- or intermolecular covalent dimers by tyrosines with the involvement of Y39.
Figure 7.

Mechanism proposed for the formation of an intrinsic chromophore in human α-synuclein comprising the tripeptide GYQ (residues 132–134). The residues proceeding and following the GYQ fragment are denoted as Rn and Rn+4. The formation of the putative chromophore results in the formation of conjugated double bonds and stabilizes the H-bonds between the amine of the G residue and the carbonyls of the Q residue.
To specifically test this hypothesis, several mutants of αS protein were generated by site-directed mutagenesis to explore the role of aromatic residues (Y133V) and local flexibility (G132V or G132L) in chromophore formation. The proteins lacking G132 or Y133 residues formed fibrils to the same extent as the wild-type protein, but they lost the ability to yield “greenish” amyloidal emission at 520 nm. Hence, both G132 and Y133 residues are important for the formation of new light emitters within the mature αS amyloids. Whether this type of photo-activity is associated with the biological function of the protein or presents a by-product of protein aging requires further investigation. It is clear, however, that this process occurs concurrently with amyloid elongation and promotes accumulation of insoluble protein aggregates.
Materials and Methods
Expression and purification of α-synuclein and its fluorescent analogs
The recombinant plasmid pT7-7, encoding αS, was kindly provided by the laboratory of Dr. Peter T. Lansbury, Jr. (Harvard Medical School, Cambridge, MA). Mutants F94W and Y125W were constructed using the QuikChange method (Stratagene). In particular, forward and reverse mutagenic primer pairs were designed with nucleotide changes converting F94 or Y125 residue into the tryptophan codons. The mutations were verified by DNA sequence analysis. Escherichia coli BL21(DE3) was transfected with appropriate plasmids, and the cells were grown in LB media in the presence of ampicillin (100 g/L). Protein expression was induced with 1 mM isopropyl-1-thio-β-D-galactopyranoside. Cells were cultured at 37°C for 4 h and harvested by centrifugation at 8000g. The cell pellet was collected by centrifugation at 4500g, resuspended in lysis buffer containing 10 mM Tris-HCl (pH 8), 1 mM EDTA, 1 mM phenylmethylsulfonyl fluoride, 1 mM dithiothreitol, freeze-thawed three times, and sonicated. DNA was removed by precipitation with streptomycin sulfate, as follows. First, the cell suspension was boiled for 20 min and centrifuged at 22,000g. Second, streptomycin sulfate was added to the supernatant to a final concentration of 10 g/L, and the mixture was stirred for 15 min at 4°C. After centrifugation at 22,000g, the supernatant was collected, and ammonium sulfate was added to a final concentration of 361 g/L for protein extraction. The solution was stirred for 30 min at 4°C and centrifuged at 22,000g. The precipitate was resuspended in 25 mM Tris-HCl (pH 8.0), dialyzed against water at 4°C and lyophilized for storage. The purity of each sample was >97% according to electrospray ionization-mass spectrometry and analytical HPLC. Mutants G132V, G132L, and Y133V were generated employing essentially similar approach.
Chemicals and solutions
Samples were prepared by dissolving lyophilized proteins in sterile H2O/NaOH (pH 11.0) for 20 min on ice, followed by neutralization with an appropriate buffer (pH 7.4) for 30 min. The solutions were centrifuged at 50,000g for 10 min to pellet any insoluble material. Protein concentration was estimated by spectroscopic means using a Cary 300BIO UV-VIS spectrophotometer. The molar extinction coefficient at 280 nm was calculated based on the composition of aromatic residues using the values of 5960, 11,460, and 9970 M−1cm−1 for the wild-type protein, F94W, and Y125W, respectively. Ultrapure, spectroscopic grade phosphate-buffered saline (PBS) was purchased from BioSource, and Tris and NaCl were purchased from Fluka. The amyloid-specific dye thioflavin T was purchased from Sigma and used as received.
Aggregation studies
Time course changes accompanying αS aggregation were performed by sampling aliquots of aggregation reactions at different time points. The reactions were initiated by incubation of 500 mL of freshly prepared monomeric protein solution (70–300 μM) at 37 ± 0.05°C with constant stirring at 300 rpm (controlled by an Eppendorf Thermomixer R). Three reaction buffers were used: 150 mM NaCl/25 mM Tris-HCl (pH 7.4), 25 mM Tris (pH 7.4), and PBS (pH 7.4). Aliquots (20 μL) were withdrawn from the reactions and diluted to a concentration of 6 μM for biophysical characterization. In several cases, sodium azide (0.02%) was added to the protein incubations to avoid potential contaminations. This, however, showed no effect on recovered experimental parameters.
Steady-state fluorescence measurements
Fluorescence emission spectra were obtained for 6 μM protein samples on a QuantaMaster QM-4/2003SE spectrofluorometer (PTI) using the FeliX32 software (data interval of 1 nm, scan speed of 20 nm/min, both excitation and emission bandwidths of 5 nm). Measurements were carried out using 4.5-mL quartz cuvettes (NSG Precise Cell Ins.) with a 1-cm light path. Emission was measured in the ratio mode and corrected for the appropriate solvent blanks as well as for wavelength-dependent bias of the optics and detection system. The emission spectrum (averaged over four scans) was characterized by fluorescence intensity integrated over the relevant range (as stated in the text)
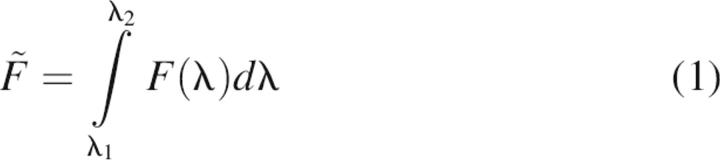 |
and by the position of the intensity maximum, 〈λ max〉, calculated as an intensity-weighted average emission wavelength:
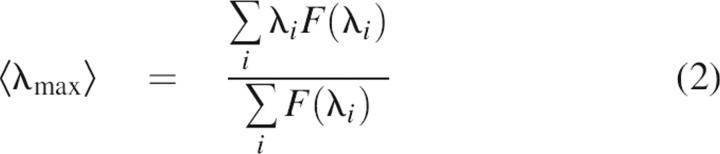 |
Here F(λι) is the fluorescence intensity measured at the emission wavelength λι. This approach avoids the effects by spectral shifts and allows monitoring the conformational diversity of the protein ensemble with a single W residue presenting a single protein chain. To compare kinetic curves accumulated in different buffers, the spectral parameters were normalized to that of monomeric solution at zero time of the reaction.
Thioflavin T binding assay
The amyloid-specific dye thioflavin T was used to monitor the formation of protein amyloids during the aggregation reaction. Stock solutions of TfT (2.4 mM) were prepared in 50% DMF (v/v) in water. Aliquots (25 μL) were added to 2 mL of 6 μM protein to yield a protein/TfT ratio of 1:5. The excitation was set at 450 nm and the fluorescence emission spectra were recorded from 470 to 600 nm. Kinetic traces were generated from time traces of TfT fluorescence intensity integrated over the range of 470–550 nm and normalized to that of free dye:
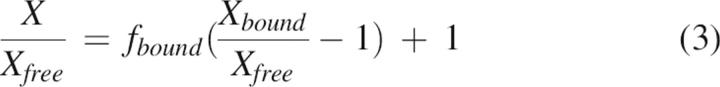 |
In Equation 3 the TfT intensity measured at a given time of reaction is denoted as X, and X bound and X free are the values of intensity of the bound and free TfT molecules, respectively. Quantum yields of free and bound TfT molecules were determined using dye solutions without protein and by titration of TfT solutions with several protein concentrations. Assuming a two-state model, the X parameter is proportional to the fraction of dye molecules that are bound to the protein aggregate.
Transmission electron microscopy
An aliquot was withdrawn from the incubation mixture and placed onto 200-mesh copper grids coated in formvar and carbon (Ted Pella, Inc.). The adsorption continued for 2 min, after which the grids were rinsed with a few drops of filtered aqueous 2% uranyl acetate (Ted Pella, Inc.), blotted with filter paper, and air-dried. The samples were examined with a Hitachi 7600 transmission electron microscope at an accelerating voltage of 60–80 kV under magnification ranging from 20,000 to 70,000. Initially, the grids were scanned at low magnification for biological material, and then five to 10 images were taken of samples at different magnifications. A background image was taken for each grid to note the difference in staining and coat abnormalities. The imaging procedure was repeated after several hours and days of storage to estimate the effects of preparation on the quality of the image (Nilsson 2004). All negatives were scanned with a DuoScan T2500 scanner (Agfa) at 1200 dots per inch. For printing, images were flattened using a high-pass filter with a radius of 250 pixels and subsequently adjusted for contrast/brightness using Adobe Photoshop. Representative images of dominant morphology were chosen for presentation. The bar scale in each final figure is 100 nm.
Acknowledgments
I thank Dr. Luis E. Dettin for experimental assistance with transmission electron microscopy imaging and Ms. Caitlin M. MacCarthy for help with data acquisition. I appreciate insightful discussions provided by Dr. Jack G. Chirikjian and Dr. Angela M. Gronenborn.
Footnotes
Reprint requests to: Olga Tcherkasskaya, Department of Biochemistry and Molecular Biology, Georgetown University School of Medicine, 3900 Reservoir Rd. NW, Basic Science Bldg. 347, Washington, DC, 20057 USA; e-mail: ovt@georgetown.edu; fax: (202) 687-7186.
Abbreviations: αS, α-synuclein; GFP, green fluorescent protein; ROS, reactive oxygen species; TEM, transmission electron microscopy; TfT, thioflavin T.
Article published online ahead of print. Article and publication date are at http://www.proteinscience.org/cgi/doi/10.1110/ps.062578307.
References
- Anderson J.P., Walker, D.E., Goldstein, J.M., de Laat, R., Banducci, K., Caccavello, R.J., Barbour, R., Huang, J., Kling, K., Lee, M., et al. 2006. Phosphorylation of Ser-129 is the dominant pathological modification of α-synuclein in familial and sporadic Lewy body disease. J. Biol. Chem. 281: 29739–29752. [DOI] [PubMed] [Google Scholar]
- Arawaka S., Saito, Y., Murayama, S., and Mori, H. 1998. Lewy body in neurodegeneration with brain iron accumulation type 1 is immunoreactive for α-synuclein. Neurology 51: 887–889. [DOI] [PubMed] [Google Scholar]
- Aulak K.S., Koeck, T., Crabb, J.W., and Stuehr, D.J. 2004. Dynamics of protein nitration in cells and mitochondria. Am. J. Physiol. Heart Circ. Physiol. 286: H30–H38. [DOI] [PubMed] [Google Scholar]
- Bennett M.C. 2005. The role of α-synuclein in neurodegenerative diseases. Pharmacol. Ther. 105: 311–331. [DOI] [PubMed] [Google Scholar]
- Berlett B.S. and Stadtman, E.R. 1997. Protein oxidation in aging, disease, and oxidative stress. J. Biol. Chem. 272: 20313–20316. [DOI] [PubMed] [Google Scholar]
- Beyer K. 2006. α-Synuclein structure, posttranslational modification and alternative splicing as aggregation enhancers. Acta Neuropathol. (Berl.) 112: 237–251. [DOI] [PubMed] [Google Scholar]
- Biere A.L., Wood, S.J., Wypych, J., Steavenson, S., Jiang, Y., Anafi, D., Jacobsen, F.W., Jarosinski, M.A., Wu, G.M., Louis, J.C., et al. 2000. Parkinson's disease-associated α-synuclein is more fibrillogenic than β- and γ-synuclein and cannot cross-seed its homologs. J. Biol. Chem. 275: 34574–34579. [DOI] [PubMed] [Google Scholar]
- Chiarugi P. and Buricchi, F. 2007. Protein tyrosine phosphorylation and reversible oxidation: Two cross-talking posttranslation modifications. Antioxid. Redox Signal. 9: 1–24. [DOI] [PubMed] [Google Scholar]
- Chirico G., Cannone, F., and Diaspro, A. 2003. Single molecule photodynamics by means of one- and two-photon approach. J. Phys. D Appl. Phys. 36: 1682–1688. [Google Scholar]
- Chudakov D.M., Feofanov, A.V., Mudrik, N.N., Lukyanov, S., and Lukyanov, K.A. 2003. Chromophore environment provides clue to “kindling fluorescent protein” riddle. J. Biol. Chem. 278: 7215–7219. [DOI] [PubMed] [Google Scholar]
- Conway K.A., Rochet, J.C., Bieganski, R.M., and Lansbury Jr, P.T. 2001. Kinetic stabilization of the α-synuclein protofibril by a dopamine-α-synuclein adduct. Science 294: 1346–1349. [DOI] [PubMed] [Google Scholar]
- Crow J.P., Ye, Y.Z., Strong, M., Kirk, M., Barnes, S., and Beckman, J.S. 1997. Superoxide dismutase catalyzes nitration of tyrosine by peroxynitrite in the rod and head domains of neurofilament-L. J. Neurochem. 69: 1945–1953. [DOI] [PubMed] [Google Scholar]
- de Laureto P.P., Tosatto, L., Frare, E., Marin, O., Uversky, V.N., and Fontana, A. 2006. Conformational properties of the SDS-bound state of α-synuclein probed by limited proteolysis: Unexpected rigidity of the acidic C-terminal tail. Biochemistry 45: 11523–11531. [DOI] [PubMed] [Google Scholar]
- Du H.N., Tang, L., Luo, X.Y., Li, H.T., Hu, J., Zhou, J.W., and Hu, H.Y. 2003. A peptide motif consisting of glycine, alanine, and valine is required for the fibrillization and cytotoxicity of human α-synuclein. Biochemistry 42: 8870–8878. [DOI] [PubMed] [Google Scholar]
- Du H.N., Li, H.T., Zhang, F., Lin, X.J., Shi, J.H., Shi, Y.H., Ji, L.N., Hu, J., Lin, D.H., and Hu, H.Y. 2006. Acceleration of α-synuclein aggregation by homologous peptides. FEBS Lett. 580: 3657–3664. [DOI] [PubMed] [Google Scholar]
- Eiserich J.P., Estevez, A.G., Bamberg, T.V., Ye, Y.Z., Chumley, P.H., Beckman, J.S., and Freeman, B.A. 1999. Microtubule dysfunction by post-translational nitrotyrosination of α-tubulin: A nitric oxide-dependent mechanism of cellular injury. Proc. Natl. Acad. Sci. 96: 6365–6370. [DOI] [PMC free article] [PubMed] [Google Scholar]
- Gafni A. 1997. Structural modifications of proteins during aging. J. Am. Geriatr. Soc. 45: 871–880. [DOI] [PubMed] [Google Scholar]
- Galvin J.E., Lee, V.M., Schmidt, M.L., Tu, P.H., Iwatsubo, T., and Trojanowski, J.Q. 1999. Pathobiology of the Lewy body. Adv. Neurol. 80: 313–324. [PubMed] [Google Scholar]
- Giasson B.I., Murray, I.V., Trojanowski, J.Q., and Lee, V.M. 2001. A hydrophobic stretch of 12 amino acid residues in the middle of α-synuclein is essential for filament assembly. J. Biol. Chem. 276: 2380–2386. [DOI] [PubMed] [Google Scholar]
- Goers J., Manning-Bog, A.B., McCormack, A.L., Millett, I.S., Doniach, S., Di Monte, D.A., Uversky, V.N., and Fink, A.L. 2003a. Nuclear localization of α-synuclein and its interaction with histones. Biochemistry 42: 8465–8471. [DOI] [PubMed] [Google Scholar]
- Goers J., Uversky, V.N., and Fink, A.L. 2003b. Polycation-induced oligomerization and accelerated fibrillation of human α-synuclein in vitro. Protein Sci. 12: 702–707. [DOI] [PMC free article] [PubMed] [Google Scholar]
- Guerrero G. and Isacoff, E.Y. 2001. Genetically encoded optical sensors of neuronal activity and cellular function. Curr. Opin. Neurobiol. 5: 601–607. [DOI] [PubMed] [Google Scholar]
- Guillet J.E. 1985. Polymer photophysics and photochemistry: An introduction to the study of photoprocesses in macromolecules. Cambridge University Press, New York.
- Hanafy K.A., Krumenacker, J.S., and Murad, F. 2001. NO, nitrotyrosine, and cyclic GMP in signal transduction. Med. Sci. Monit. 7: 801–819. [PubMed] [Google Scholar]
- Hoyer W., Antony, T., Cherny, D., Heim, G., Jovin, T.M., and Subramaniam, V. 2002. Dependence of α-synuclein aggregate morphology on solution conditions. J. Mol. Biol. 322: 383–393. [DOI] [PubMed] [Google Scholar]
- Hoyer W., Cherny, D., Subramaniam, V., and Jovin, T.M. 2004. Impact of the acidic C-terminal region comprising amino acids 109–140 on α-synuclein aggregation in vitro. Biochemistry 43: 16233–16242 and references therein. [DOI] [PubMed] [Google Scholar]
- Koeck T., Fu, X., Hazen, S.L., Crabb, J.W., Stuehr, D.J., and Aulak, K.S. 2004. Rapid and selective oxygen-regulated protein tyrosine denitration and nitration in mitochondria. J. Biol. Chem. 279: 27257–27262. [DOI] [PubMed] [Google Scholar]
- Krishnan S., Chi, E.Y., Wood, S.J., Kendrick, B.S., Li, C., Garzon-Rodriguez, W., Wypych, J., Randolph, T.W., Narhi, L.O., Biere, A.L., et al. 2003. Oxidative dimer formation is the critical rate-limiting step for Parkinson's disease α-synuclein fibrillogenesis. Biochemistry 42: 829–837. [DOI] [PubMed] [Google Scholar]
- Lavedan C. 1998. The synuclein family. Genome Res. 8: 871–880. [DOI] [PubMed] [Google Scholar]
- Levine R.L., Williams, J.A., Stadtman, E.R., and Shacter, E. 1994. Carbonyl assays for determination of oxidatively modified proteins. Methods Enzymol. 233: 346–357. [DOI] [PubMed] [Google Scholar]
- Malencik D.A. and Anderson, S.R. 2003. Dityrosine as a product of oxidative stress and fluorescent probe. Amino Acids 25: 233–247. [DOI] [PubMed] [Google Scholar]
- Means G.E. and Feeney, R.E. 1971. Chemical modification of proteins. Holden Day Inc, San Francisco.
- Miyawaki A., Nagai, T., and Mizuno, H. 2003. Mechanisms of protein fluorophore formation and engineering. Curr. Opin. Chem. Biol. 5: 557–562. [DOI] [PubMed] [Google Scholar]
- Munishkina L.A., Cooper, E.M., Uversky, V.N., and Fink, A.L. 2004. The effect of macromolecular crowding on protein aggregation and amyloid fibril formation. J. Mol. Recognit. 17: 456–464. [DOI] [PubMed] [Google Scholar]
- Nilsson M.R. 2004. Techniques to study amyloid fibril formation in vitro. Methods 34: 151–160. [DOI] [PubMed] [Google Scholar]
- Nilsson M.R. and Dobson, C.M. 2003. Chemical modification of insulin in amyloid fibrils. Protein Sci. 12: 2637–2641. [DOI] [PMC free article] [PubMed] [Google Scholar]
- Nilsson M.R., Driscoll, M., and Raleigh, D.P. 2002. Low levels of asparagine deamidation can have a dramatic effect on aggregation of amyloidogenic peptides: Implications for the study of amyloid formation. Protein Sci. 11: 342–349. [DOI] [PMC free article] [PubMed] [Google Scholar]
- Niwa H., Inouye, S., Hirano, T., Matsuno, T., Kojima, S., Kubota, M., Ohashi, M., and Tsuji, F.I. 1996. Chemical nature of the light emitter of the Aequorea green fluorescent protein. Proc. Natl. Acad. Sci. 93: 13617–13622. [DOI] [PMC free article] [PubMed] [Google Scholar]
- Norris E.H., Giasson, B.I., Ischiropoulos, H., and Lee, V.M. 2003. Effects of oxidative and nitrative challenges on α-synuclein fibrillogenesis involve distinct mechanisms of protein modifications. J. Biol. Chem. 278: 27230–27240. [DOI] [PubMed] [Google Scholar]
- Nussbaum R.L. and Ellis, C.E. 2003. Alzheimer's disease and Parkinson's disease. N. Engl. J. Med. 348: 1356–1364. [DOI] [PubMed] [Google Scholar]
- Rochet J.C., Outeiro, T.F., Conway, K.A., Ding, T.T., Volles, M.J., Lashuel, H.A., Bieganski, R.M., Lindquist, S.L., and Lansbury, P.T. 2004. Interactions among α-synuclein, dopamine, and biomembranes: Some clues for understanding neurodegeneration in Parkinson's disease. J. Mol. Neurosci. 23: 23–34. [DOI] [PubMed] [Google Scholar]
- Shringarpure R. and Davies, K.J. 2002. Protein turnover by the proteasome in aging and disease. Free Radic. Biol. Med. 32: 1084–1089. [DOI] [PubMed] [Google Scholar]
- Spillantini M.G. and Goedert, M. 2000. The α-synucleinopathies: Parkinson's disease, dementia with Lewy bodies, and multiple system atrophy. Ann. N.Y. Acad. Sci. 920: 16–27. [DOI] [PubMed] [Google Scholar]
- Squier T.C. and Bigelow, D.J. 2000. Protein oxidation and age-dependent alterations in calcium homeostasis. Front. Biosci. 5: 504–526. [DOI] [PubMed] [Google Scholar]
- Stadtman E.R. 1992. Protein oxidation and aging. Science 257: 1220–1224. [DOI] [PubMed] [Google Scholar]
- Stadtman E.R. and Levine, R.L. 2000. Protein oxidation. Ann. N.Y. Acad. Sci. 899: 191–208. [DOI] [PubMed] [Google Scholar]
- Tsien R.Y. 1998. The green fluorescent protein. Annu. Rev. Biochem. 67: 509–544. [DOI] [PubMed] [Google Scholar]
- Ulmer T.S., Bax, A., Cole, N.B., and Nussbaum, R.L. 2005. Structure and dynamics of micelle-bound human α-synuclein. J. Biol. Chem. 280: 9595–9603. [DOI] [PubMed] [Google Scholar]
- Uversky V.N., Li, J., and Fink, A.L. 2001a. Evidence for a partially folded intermediate in α-synuclein fibril formation. J. Biol. Chem. 276: 10737–10744. [DOI] [PubMed] [Google Scholar]
- Uversky V.N., Li, J., and Fink, A.L. 2001b. Pesticides directly accelerate the rate of α-synuclein fibril formation: a possible factor in Parkinson's disease. FEBS Lett. 500: 105–108. [DOI] [PubMed] [Google Scholar]
- Uversky V.N., Yamin, G., Munishkina, L.A., Karymov, M.A., Millett, I.S., Doniach, S., Lyubchenko, Y.L., and Fink, A.L. 2005. Effects of nitration on the structure and aggregation of α-synuclein. Brain Res. Mol. Brain Res. 134: 84–102. [DOI] [PubMed] [Google Scholar]
- Verkhusha V.V., Chudakov, D.M., Gurskaya, N.G., Lukyanov, S., and Lukyanov, K.A. 2004. Common pathway for the red chromophore formation in fluorescent proteins and chromoproteins. Chem. Biol. 11: 845–854. [DOI] [PubMed] [Google Scholar]
- Zimmer M. 2002. Green fluorescent protein (GFP): Applications, structure, and related photophysical behavior. Chem. Rev. 102: 759–781. [DOI] [PubMed] [Google Scholar]