

Abstract
We developed a series of statistical potentials to recognize the native protein from decoys, particularly when using only a reduced representation in which each side chain is treated as a single Cβ atom. Beginning with a highly successful all-atom statistical potential, the Discrete Optimized Protein Energy function (DOPE), we considered the implications of including additional information in the all-atom statistical potential and subsequently reducing to the Cβ representation. One of the potentials includes interaction energies conditional on backbone geometries. A second potential separates sequence local from sequence nonlocal interactions and introduces a novel reference state for the sequence local interactions. The resultant potentials perform better than the original DOPE statistical potential in decoy identification. Moreover, even upon passing to a reduced Cβ representation, these statistical potentials outscore the original (all-atom) DOPE potential in identifying native states for sets of decoys. Interestingly, the backbone-dependent statistical potential is shown to retain nearly all of the information content of the all-atom representation in the Cβ representation. In addition, these new statistical potentials are combined with existing potentials to model hydrogen bonding, torsion energies, and solvation energies to produce even better performing potentials. The ability of the Cβ statistical potentials to accurately represent protein interactions bodes well for computational efficiency in protein folding calculations using reduced backbone representations, while the extensions to DOPE illustrate general principles for improving knowledge-based potentials.
Keywords: protein folding, statistical potentials, reduced models, decoy sets
An accurate free energy or scoring function to describe protein interactions is central to many problems in computational protein science (Anfinsen 1972, 1973; Pokala and Handel 2001; Taylor et al. 2002; Schueler-Furman et al. 2005; Colubri et al. 2006). One important goal of the scoring function is to recognize differences between native and nonnative protein structures. The two dominant classes of scoring functions are provided by physical force fields and statistical potentials. Whereas physical force fields are generally defined as the sum of conventional contributions to interaction energies, statistical potentials determine energies from the observed frequencies of occurrence in known protein structures.
Several physical force fields are widely used in the literature (Brooks et al. 1983; Jorgensen and Tiradorives 1988; Garcia and Sanbonmatsu 2002; Fujitsuka et al. 2004). All typically choose the nonbonded interaction energy for a pair of atoms as the sum of contributions from electrostatic and van der Waals interactions, while bond length, bond angle, torsion angle, and improper torsion angle energy functions are used to describe local energetic contributions. However, in order for a physical force field to properly describe the free energy of a protein, these physical force fields must be combined with dynamics simulations to include entropic contributions. Given the large number of possible protein conformations, this entropic calculation can be computationally prohibitive and, thus, is often neglected when screening a set of decoys for the native protein structure (Feig and Brooks 2002; Fujitsuka et al. 2004). Some indications that all compact protein structures have comparable entropies suggest that even without an entropic calculation, physical force fields may still be useful for recognizing native states of proteins (Feig and Brooks 2002). Unfortunately, it is not yet clear which physical force fields best represent reality, because simulations of small peptides have demonstrated that these force fields produce strikingly different dynamic and equilibrium properties (Garcia and Sanbonmatsu 2002; Hu et al. 2003; Mu et al. 2003; Zaman et al. 2003; Yoda et al. 2004) due to differences in the torsional energies, the most difficult interactions to model (Garcia and Sanbonmatsu 2002; Zaman et al. 2003).
Statistical potentials have proven to be extremely useful in protein folding simulations (Hubner et al. 2006) and structure predictions (Bowie et al. 1991; Sun 1993; O'Donoghue and Nilges 1997; Chiu and Goldstein 2000; Tobi and Elber 2000; Tobi et al. 2000; Colubri et al. 2006). For a given interaction, the free energy is obtained from observed frequencies in a database of protein structures. Thus, statistical potentials are commonly designated as knowledge-based or empirical potentials. Statistical potentials have an extensive history (Hendlich et al. 1990; Casari and Sippl 1992; Sippl 1993; Sun 1993; Bauer and Beyer 1994; Park and Levitt 1996; Bennaim 1997; Gilis and Rooman 1997; O'Donoghue and Nilges 1997; Samudrala and Moult 1998; Miyazawa and Jernigan 1999; Simons et al. 1999; Gatchell et al. 2000; Zhang and Kim 2000; Lu and Skolnick 2001; Melo et al. 2002; Betancourt 2003; Buchete et al. 2004; Mukherjee et al. 2005; Fang and Shortle 2006; Shen and Sali 2006).
A major limitation of statistical potentials lies in their usual neglect of important nonadditive many-body interactions for computational practicality and due to limited experimental data (Bennaim 1997; Shen and Sali 2006). For example, a certain degree of accuracy is lost by assuming that the free energy is decomposable in a pairwise additive form. Furthermore, because the relationship between statistical potentials and the basic principles of statistical mechanics are somewhat unclear (Finkelstein et al. 1995; Bennaim 1997; Skolnick et al. 1997), some researchers prefer to derive statistical potentials using probability theory alone (Samudrala and Moult 1998; Simons et al. 1999; Shen and Sali 2006; Solis and Rackovsky 2006). Regardless of whether statistical potentials are introduced based on the principles of statistical mechanics or as purely probabilistic constructions, the defining relations are generally the same.
The use of a statistical potential offers several practical and theoretical benefits. For instance, some errors associated with neglecting many-body interactions can be diminished by carefully using conditional probabilities that implicitly reproduce many-body effects while maintaining the computational convenience of formal pairwise additivity. The exploitation of this technique to improve the recognition of native states represents a main focus of this article. In principle, given a sufficiently rich training set of protein structures and computational resources, statistical potentials could be extended to include explicit many-body contributions and thereby enhance accuracy. Because of insufficient data and the computational complexity associated with many-body interactions, this is not a currently tractable goal, and we focus on the use of conditional two-body interactions.
Recently, Shen and Sali (2006) developed the Discrete Optimized Protein Energy function, DOPE, a statistical potential whose distinguishing feature is its physically reasonable treatment of the reference state probability distribution function used in defining the free energy. DOPE performs as well or better than all previous all-atom energy functions in its ability to accurately identify the native structure in a decoy set of incorrect protein structures (Eramian et al. 2006; Shen and Sali 2006). Moreover, DOPE has also been shown to be useful in applications (Colubri et al. 2006; Eramian et al. 2006). In particular, the protein structure prediction algorithm of Sosnick, Freed, and coworkers uses a reduced Cβ version of DOPE wherein terms involving side-chain atoms beyond the Cβ-carbon are ignored (Colubri et al. 2006). Because of DOPE's success with decoy sets and its physically appealing reference state, this statistical potential provides the starting point for our current studies. Furthermore, because recent work has demonstrated the superiority of DOPE over the leading energy functions, (Eramian et al. 2006; Shen and Sali 2006), it suffices to compare our statistical potentials to DOPE as a benchmark.
As mentioned above, Sosnick, Freed, and coworkers (Colubri et al. 2006) used a reduced form of DOPE, DOPE-Cβ, in their protein structure prediction algorithm. This reduced form employs a representation in which the side chains (other than glycines) are represented with a single Cβ atom by simply ignoring all terms involving the non-Cβ side-chain atoms. This reduced potential is able to retain a correlation of R ∼ 0.80–0.90 with respect to the all-atom version of the statistical potential. In addition, the final structures generated using the reduced statistical potential have an appropriate density and chain geometry that permits side chains to be readily added in a backbone-dependent manner using SCWRL (Canutescu et al. 2003; Colubri et al. 2006).
Importantly, the folding of the reduced Cβ model greatly diminishes the computational time as no time is spent searching through the side-chain configuration space during the folding algorithm. Nevertheless, it is moderately successful in predicting the structure of small proteins of various topologies given advanced, but coarse-grained, knowledge of the protein's local structure. Undoubtedly, the algorithm's performance can be improved by building more accurate Cβ statistical potentials, a goal that provides the motivation for the present work. We begin this process by constructing optimized reduced statistical potentials to recognize the native structures of proteins.
Reduced representations have been used with varying success in the past (Sun 1993; Gilis and Rooman 1997; Zhang and Kim 2000; Melo et al. 2002; Betancourt 2003; Buchete et al. 2004; Fujitsuka et al. 2004; Kolinski and Skolnick 2004; Rohl et al. 2004; Mukherjee et al. 2005; Chen et al. 2006; Colubri et al. 2006). In order to minimize the loss of information encountered by passing to this reduced representation, our new statistical potentials introduce explicit dependence upon backbone geometry and primary sequence separation, respectively. Such dependences have previously been utilized at both residue and atomic resolution (Zhang and Kim 2000; Melo et al. 2002; Rohl et al. 2004; Fang and Shortle 2006). By introducing this type of additional information, even after the reduction to a Cβ representation, our new energy functions outperform the all-atom DOPE in their ability to recognize the native structures of multiple proteins from libraries of decoy structures.
Theory
Pairwise additive statistical potentials
The goal of a statistical potential is to use empirical information compiled from a database of known protein structures in order to derive a scoring function that correlates well with the free energy of the protein. Most treatments of statistical potentials are derived either from the statistical mechanical Boltzmann distribution or, less directly, through probability theory. Although the statistical mechanical approach is simpler, the approximations introduced for computational practicality have motivated questions regarding the scientific validity of statistical potentials. The probability theory approach is appealing because it makes no direct reference to a particular statistical distribution.
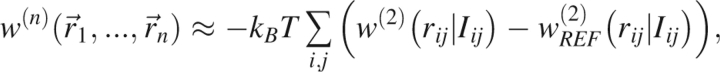
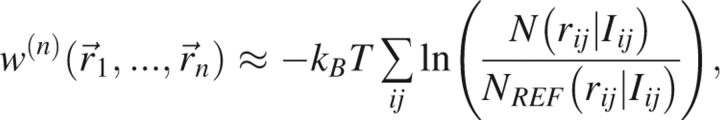
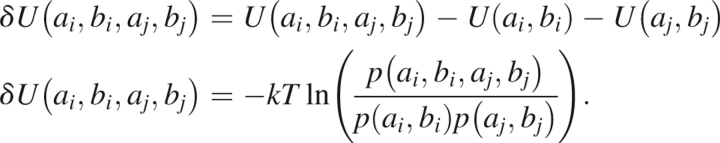
A careful treatment of the statistical mechanical approach is included in the Appendix. For the present purposes, we simply assume that the statistical potential is decomposable into a pairwise additive form,
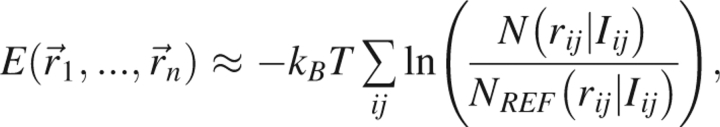 |
where n is the number of atoms used in the calculation, N (rij|Iij) is the number of observations in the database, NREF (rij|Iij) is the number of observations that are expected in the completely noninteracting reference system that defines the zero of free energy, and Iij is the added information that is specified (e.g., atom types, residue types, sequence separation, etc.). This form of the potential is generally only an approximation, and the consequences associated with this approximation are discussed in the Appendix.
The equation for the energy E requires three choices in order to construct the statistical potential. The first choice concerns which n atoms are used in calculating the energy. Here, n is either taken to be all heavy atoms in the protein (all-atom representation) or all backbone heavy atoms together with the β-carbon (Cβ representation). The second choice is associated with the added information Iij. This added information can encode many-body effects to lessen the severity of the pairwise additive assumption, thereby rendering the Cβ representation more accurate. The information term chosen here always contains at least the amino acid and atom identities. Finally, the third decision concerns the reference state used to define the zero of free energy. The treatment of these issues largely determines the success of the statistical potential.
Discrete Optimized Protein Energy function (DOPE)
DOPE is a statistical potential that has recently been designed by Shen and Sali (2006). DOPE performs as well or better than existing statistical potentials and force fields in recognizing the native state of proteins from decoy sets (Eramian et al. 2006; Shen and Sali 2006). DOPE has also performed favorably in applications to protein structure prediction. The information term in DOPE implies that the statistical potential distinguishes the amino acid identity and atomic identity of both interacting particles. These dependences are rendered more explicit through the notation,
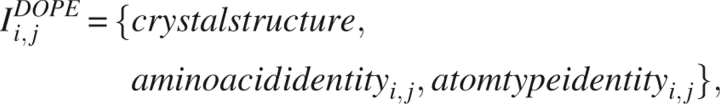 |
where i, j are labels specifying the two interacting atoms, and where the notation also designates the use of a library of high resolution X-ray structures.
The reference state defined by DOPE supposes that in the absence of nonbonded interactions, atoms are distributed spherically and uniformly, independent of their identity. The radius of this sphere is related to the radius of gyration of the native protein by 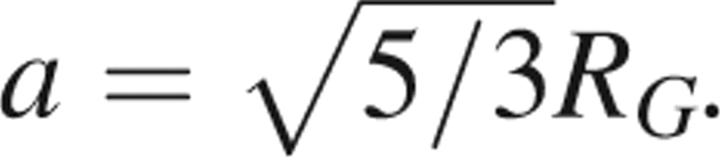 . This model is analytically tractable, and a detailed discussion of this reference state is included in the Appendix. Figure 1 displays the radial probability distribution for a sphere of radius a = 24 Å. DOPE provides the interaction “energy score” of two atoms through the equation
Figure 1.

Reference state used by DOPE for the case where the reference sphere has radius a = 24 Å and the cutoff distance for computing nonbonded interactions is assumed to be at least 48 Å. In actual applications, it is likely that a significantly shorter cutoff distance is used. Then, this function must be normalized differently as the longer distance information is irrelevant (see Appendix).
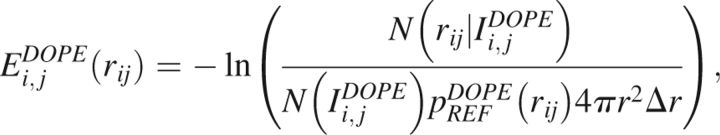 |
where N(rij|I i,j DOPE) is the number of times in the training set that two atoms consistent with the information term are separated by a distance rij, N(I i,j DOPE) is the total number of atom pairs consistent with the information term (within the cutoff distance), P RF DOPE(r) is the reference probability density developed in the Appendix, Δr is the bin size, and energy units are selected such that kT = 1. All proteins in the training set are assumed to be under the same conditions. The total energy score of the protein is the sum of E i,j DOPE(r i,j) over all pairs i,j.
Inclusion of additional information
The primary goal of this article is to improve both all-atom and Cβ representations of statistical potentials by incorporating several new dependences, and thereby illustrate general principles for improving knowledge-based potentials. Because DOPE has outperformed other statistical potentials in numerous tests and has already incorporated a physically appealing reference state for nonbonded interactions, DOPE is the natural point of departure for our studies. The reduced Cβ representation is of particular interest in view of the successful use of the Cβ version of DOPE in the prediction of native structures (Colubri et al. 2006).
We introduce two new information terms into DOPE. First, a dependence on distance in primary sequence is introduced to incorporate the influence of local geometric constraints. The resulting modified statistical potential is called DOPENN (NN ⇒ NearestNeighbor). Second, a dependence on local backbone geometry is introduced though the explicit dependence on the backbone geometry, as defined by the Ramachandran basin (RB) (Ramachandran et al. 1963) in which the ϕ,ψ dihedral angles reside. This modification is termed DOPE-Back.
The RB specifies the local structure of the protein backbone and correlates with the secondary structure of the protein. For applications to structure prediction, it is advantageous to define DOPE-Back in terms of the RB instead of the secondary structure directly. β-Sheets are composed of residues in the polyproline II conformation as well as authentic β conformers. Hence, the separation of sheets into two RB adds additional specificity. Also, Sosnick, Freed, and coworkers have recently shown that the Monte Carlo search efficiency is greatly improved when the RBs are fixed during the course of the simulation (“intrabasin folding”) (Colubri et al. 2006). As the DOPE-Back terms are conditional on each residue's RB, an intrabasin simulation wherein all the RBs are fixed does not sample any discontinuities in the energy surface due to a change in RB. However, since it is possible to change the secondary structure without changing the RB, discontinuities would become an issue if DOPE-Back were to be formulated by specifying the secondary structure. The RBs used here are defined as in Figure 2A and are chosen in this manner for reasons to be discussed later.
Figure 2.
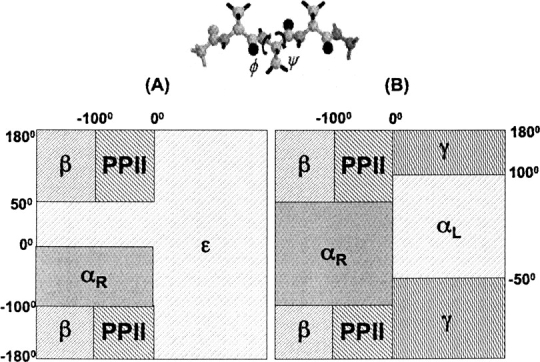
(A) The four-basin system used to define DOPE-Back. The basins called β and PPII are very common in β-sheet structures. The αR basin contains helical geometries. The basin termed ɛ comprises the rest of the Ramachandran map. (B) The more conventional five-basin Ramachandran map. The ɛ-basin from A is the union of γ and αL basins as well as the portion of αR basin that corresponds to turn geometries.
Previous work has included both a dependence on sequence distance and backbone dependencies in some form (Zhang and Kim 2000; Melo et al. 2002; Rohl et al. 2004; Fang and Shortle 2006). However, the importance of the reference state has been understressed and most often has been chosen in a rather unphysical fashion. Thus, these potentials can be improved by introducing a more physically meaningful reference state. Here, these modifications are introduced systematically into the same starting potential (DOPE) to assess the relative strengths and weaknesses of each modification.
Dependence on local backbone geometry: DOPE-Back
The first modification of DOPE, “DOPE-Back,” involves the inclusion of a dependence upon the local backbone geometry through a specific dependence on the RB occupied by the residues containing each of the two interacting atoms. This modification is designed to recognize the fact that atoms interact differently depending on whether they are located in helical structures or sheets.
 |
Preliminary calculations also suggest that a backbone-dependent statistical potential performs well in the Cβ representation. More specifically, an analysis of probability distributions for side-chain dihedral angles from the Protein Data Bank (PDB) (Kouranov et al. 2006) indicates that to a very good approximation, side-chain conformations are independent of the identity and conformation of the neighboring resides. Nearest neighbors exert a stronger influence on the protein backbone than on the side chains. However, there are nontrivial dependences of the side-chain conformations on the amino acid identity and on the backbone conformation of the residue in question. Consequently, by specifying the amino acid identity and backbone conformation of a residue, most of the information that determines the side-chain geometry is incorporated in the statistical potential. Hence, it is likely that a Cβ representation would retain most of the relevant information about the side chain.
The RBs of the DOPE-Back statistical potential are defined using the four-basin system represented in Figure 2A. The αR, β, and PPII basins are strongly populated by most amino acids. The αR basin describes residues in helical geometries, while the β and PPII basins are prevalent for residues in β-strands. The final basin, ɛ, is actually a combination of several distinct energy minima. A version of DOPE-Back has been devised using the more conventional basin definitions represented in Figure 2B. However, the definitions presented in Figure 2A are preferable for DOPE-Back due to limited statistics for the αL and γ basins, as well as the prominence of more authentic helical geometries in the smaller αR basin used in Figure 2A.
Because the RB occupancy does not enter into the description of the reference noninteracting system, the only difference between the DOPE-Back and DOPE statistical potentials is that the former contains a specification of the RB of the residue in addition to the amino acid and atom identities. The DOPE-Back energy score is correspondingly given by
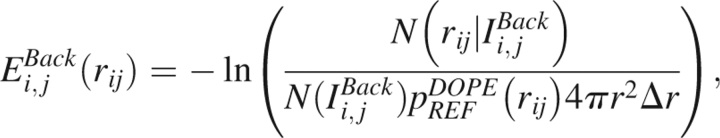 |
in units where kT = 1, and X-ray structures for all proteins in the training set are assumed to be taken under the same conditions.
Pairwise additive atomic interaction “energy scores” are used to evaluate the helix–helix (EH–H), helix–strand (EH–S), strand–strand (ES–S), and unstructured (Eɛ) interaction energy scores by summing over all consistent atom-pairs. The strand–strand energy consists of the sum of the β-β, β-PPII, and PPII-PPII energies. Given the approximation that energies are assumed to be pairwise additive, it is not obvious how to weight these various interactions. The complete DOPE-Back interaction energy score is, therefore, defined to be a linear combination of these four energy scores.
where we allow for the possibility of unequal coefficients {λ} to compensate for the truncation at pair interactions. The coefficients {λ} are eventually chosen to optimize the ability of the statistical potential to identify the native structure of the protein.
Dependence on distances in primary sequence: DOPENN
The second modified potential is designed to recognize the fact that proximate amino acids in primary sequence have geometrically constrained interatomic separations. Therefore, the complete statistical potential is expressed as the sum of sequence local contributions that reflect the geometric constraints and sequence nonlocal contributions that omit the geometrically biased local interactions. The information term of DOPENN is therefore given by
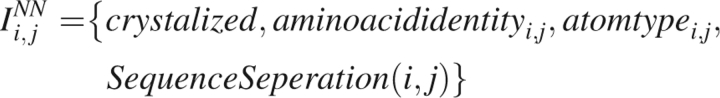 |
where the sequence separation is defined on the residue level (i.e., atoms on the same residue have vanishing sequence separation).
The distance in primary sequence necessary to render interactions truly “nonlocal” and independent of local geometric constraints is not obvious. We therefore generate separate local potentials to describe i,i ± 1 interactions (DOPE-N1 ⇒ Neighbors 1), i,i ± 2 interactions (DOPE-N2 ⇒ Neighbors 2), i,i ± 3 interactions (DOPE-N3 ⇒ Neighbors 3), and i,i ± 4 interactions (DOPE-N4 ⇒ Neighbors 4). These energies are not symmetric in amino acid or atom identities due to the directionality of the polypeptide backbone that distinguishes i,i+j and i,i−j interactions. Likewise, we determine a corresponding set of nonlocal potentials that only include interactions of residues separated in sequence by at least one other amino acid (DOPE-N ≥ 2), by at least two other amino acids (DOPE-N ≥ 3), by at least three other amino acids (DOPE-N ≥ 4), and by at least four other amino acids (DOPE-N ≥ 5).
The local and nonlocal contributions are used to produce four distinct versions of DOPENN by combining each of the four nonbonded potentials with the remaining, missing local terms, again with adjustable coefficients,
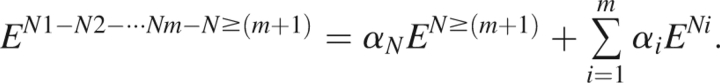 |
The nomenclature DOPE-N1-N2-···-Nm-N ≥ (m + 1) indicates that the sequence nonlocal term includes interactions of all atoms separated in sequence by at least m other residues, and, consequently, there are m local energy functions. The statistical potentials DOPE-N1-N ≥ 2 and DOPE-N1-N2-N ≥ 3 are found to perform best in recognizing the native state. Hence, these two statistical potentials are designated as DOPENN in the Results and Discussion section. Supplemental online material presents a detailed discussion of the performance of the local terms, each nonbonded term, and other versions of DOPENN.
Just as the local contributions in DOPENN are separated from the nonlocal ones because the former are geometrically constrained, the spherical reference state used in DOPE is insufficient to describe the sequence local interactions in the noninteracting reference system. The reference state is thus defined to respect all bond lengths and bond angles, as well as the rigidity of the peptide bond (i.e., a constant torsion angle ω) and excluded volume constraints. This probability density of this reference state for local interactions cannot be evaluated analytically. In fact, the simpler problem in polymer physics of finding the probability density of two atoms separated by a small number of bonds (and ignoring excluded volume constraints) lacks a closed form analytic solution.
Therefore, based on previous work that developed a statistical coil model for the unfolded state of proteins, a numerical technique is adopted to determine the reference state probability distributions (Jha et al. 2005a). This unfolded state model describes the conformation of a given residue as depending only on the torsion angles of its nearest neighbors and on excluded volume constraints. Because this unfolded state model respects bond lengths, bond angles, the rigidity of the peptide plane, and excluded volume constraints while not including long range interactions, the model is ideal for determining the probability density for the local reference states. The details of this model are reviewed in the Appendix. By first generating an unfolded ensemble for ubiquitin (an arbitrary choice) and then by averaging over amino acid identity, the reference state probability distributions are computed. This average over the amino acid identity effectively removes the residue-dependent biases in the Ramachandran map, although small biases may persist.
Figure 3 displays the reference state probability densities obtained for two Cα atoms in the following local potentials: (A) DOPE-N1, (B) DOPE-N2, (C) DOPE-N3, and (D) DOPE-N4. The distribution function for each reference state is contrasted against the spherical reference state obtained by choosing the maxima of the distributions to be equal (Fig. 3) to better demonstrate the dramatic differences necessitating the treatment of local terms separately. Due to the constraints of local backbone geometry, two atoms that are separated by a small distance in primary sequence are not distributed uniformly throughout a sphere, even when the two atoms are noninteracting. The reference state for the nonlocal portion of the statistical potential is the same as that used in DOPE. We therefore arrive at the expression for the DOPENN energy score,
Figure 3.

Reference states used in (A) DOPE-N1, (B) DOPE-N2, (C) DOPE-N3, and (D) DOPE-N4. Superimposed on these reference states is the DOPE-like spherical reference state obtained by matching the maxima of the distributions. The inequivalence between these distributions emphasizes the utility of the new local reference states introduced by DOPENN.
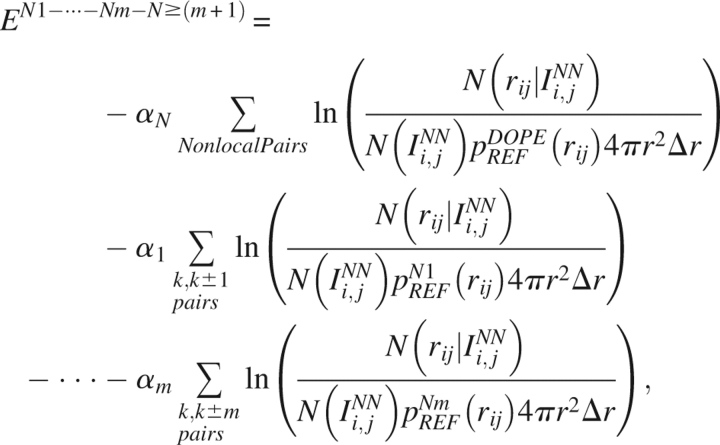 |
where k is the residue index and i,j are the atom indices.
Results and Discussion
The statistical potentials introduced here are tested using decoy sets. Various methods have been used to generate these decoy sets of protein conformations, and we consider the ability of these statistical potentials to recognize the most native-like structure. Validated statistical potentials are used in protein structure prediction (Bowie et al. 1991; Sun 1993; O'Donoghue and Nilges 1997; Chiu and Goldstein 2000; Tobi and Elber 2000; Tobi et al. 2000; Colubri et al. 2006), structure refinement (Topf et al. 2006), and protein–protein docking (Shen et al. 2005). Our tests employ a wide range of decoy sets because the performance of a statistical potential depends on both the statistical potential and the decoy set. For example, if all decoys have near ideal torsion angles but the native structure is the only structure with reasonable tertiary contacts, then scoring only with torsion potentials such as TSP would perform very poorly, while at the opposite extreme, if all decoys have very poor torsion angles, then TSP would perform exceedingly well. However, although we strive to avoid bias, the optimum coefficients depend on the metric chosen. Hence, it is important to parameterize potentials tailored for specific applications.
Performance of all-atom statistical potentials
In this section, we compare DOPE, DOPE-Back, DOPE-N1-N ≥ 2, and DOPE-N1-N2-N ≥ 3. The all-atom statistical potential DOPE outperforms all previously developed statistical potentials in native structure recognition (Shen and Sali 2006). DOPE-Back is a modification of DOPE that treats atomic interactions differently depending on their backbone Ramachandran conformations. DOPE-N1-N ≥ 2 is an alternative modification that consists of a sequence local contribution between nearest neighbor residues in sequence and a DOPE-like sequence nonlocal contribution for all other atom–atom pairwise interactions. Lastly, DOPE-N1-N2-N ≥ 3 contains two local portions to describe sequence nearest neighbor and next nearest neighbor interactions and a DOPE-like nonlocal statistical potential.
As expected, the inclusion of the extra information into DOPE dramatically alters the energy score assigned to pair interactions. Figure 4 compares the energy score for two arginine α-carbons from DOPENN and DOPE-Back, with those from DOPE as a function of interatomic distance. Figure 4A demonstrates that the i,i + 1 energy score is restricted to a very narrow range of separations that are dictated by purely geometric constraints. Due to the appropriately defined reference state, when the geometric constraint is satisfied, the energy score vanishes. Energy scores for the other local interaction contributions are more complex. The DOPE and DOPE-N1-N ≥ 2 energy curves in Figure 4B are perfectly superimposed for distances in excess of 4 Å, but DOPE has an extra minimum at the distance corresponding to the i,i + 1 interactions. This minimum in the DOPE curve is clearly an artifact when applied to a pair of nonbonded atoms. DOPE-N1-N ≥ 2 corrects for this bias, and the new global minimum in the nonbonded portion is located between 5 and 6 Å where DOPE only contains a local minimum. Figure 4C displays energy scores obtained from DOPE-Back. As expected, the helix–helix interaction curve differs from the beta–beta interaction curve. The beta–helix curve is devoid of stabilization since the interaction score is strictly positive. Figure 4C implies that within the context of this statistical potential, the interaction of two arginine Cα is stabilizing when both are either in helices or in sheets but not when one is in each type of structure.
Figure 4.

The DOPE, DOPENN, and DOPE-Back statistical potentials all yield strikingly different interaction energies. (A) Local interaction energies for DOPENN, (B) nonlocal interaction energies for DOPENN compared with DOPE, (C) interaction energies of DOPE-Back compared with DOPE. All interactions are between two arginine α-carbons.
Table 1 summarizes the performance of these statistical potentials for all 306 protein decoy sets. The new modifications described here improve DOPE in the ability to properly identify native structures of proteins. Whereas DOPE correctly identifies 126 of the native structures from the 306 decoy sets, DOPE-Back, DOPE-N1-N ≥ 2, and DOPE-N1-N2-N ≥ 3 correctly recognizes 146, 178, and 157 native structures, respectively. In terms of the native structure recognition ranking, all three modifications improve DOPE's percentile ranking of 27.2%. DOPE-Back, DOPE-N1-N ≥ 2, and DOPE-N1-N2-N ≥ 3 produce rankings of 13.8%, 18.7%, and 21.8%, respectively. However, the quality of the predictions and Z-scores depends on the modification in question. The Z-score measures how many standard deviations occur between the native structure's energy score and the average decoy's energy. Compared with DOPE, DOPE-N1-N ≥ 2 improves the Z-score from 1.84 DOPE to 1.88 and the predicted root-mean-square deviation (RMSD) from 2.74 to 2.67 Å; however, DOPE-Back and DOPE-N1-N2-N ≥ 3 produce poorer Z-scores of 1.68 and 1.45, respectively, and poorer RMSD predictions of 3.94 and 4.30 Å. The poorer average prediction of DOPE-Back reflects the fact that DOPE does not fare well for the most native-like decoy sets where incorrect predictions tend to contribute small numbers to the average, whereas DOPE-Back performs poorly on highly nonnative decoys where incorrect predictions contribute harshly to the average.
Table 1.
Performance of all-atom statistical potentials for all 306 decoy sets

The RMSD-energy score correlation coefficient from DOPE is 0.36, while after modification, DOPE-Back, DOPE-N1-N ≥ 2, and DOPE-N1-N2-N ≥ 3 yield correlations of 0.15, 0.30, and 0.20. Two things should be noted about the correlation coefficient. First, although a strong correlation is likely to be useful in applications, there is no physical reason why the RMSD and energy score should be correlated over a large range of RMSDs. Second, none of these statistical potentials really presents a “good” correlation. Moreover, the energy coefficients used in compiling Table 1 are chosen primarily to optimize the success rate. Alternative optimizations of Z-scores or correlation coefficient are included in the Electronic supplemental material.
Performance of Cβ energy functions
We now proceed to investigate the performance of the statistical potentials in their reduced Cβ representations by comparing DOPE-Cβ, DOPE-Cβ-Back, DOPE-Cβ-N1-N ≥ 2, and DOPE-Cβ-N1-N2-N ≥ 3, which are obtained from the corresponding all-atom statistical potentials by omitting contributions from atoms in side groups other than the Cβ atoms. Table 2 describes the performance of these Cβ statistical potentials for the 306 decoy sets. As with the all-atom statistical potentials, the modifications described here improve DOPE-Cβ in properly identifying native structures of proteins. DOPE-Cβ correctly assigns 100 of the native structures from the 306 protein decoys sets, while DOPE-Cβ-Back, DOPE-Cβ-N1-N ≥ 2, and DOPE-Cβ-N1-N2-N ≥ 3 correctly identify 147, 133, and 140 native structures, respectively. Similarly, DOPE-Cβ produces an average ranking of 37.0%, while DOPE-Cβ-Back, DOPE-Cβ-N1-N ≥ 2, and DOPE-Cβ-N1-N2-N ≥ 3 produce rankings of 15.3%, 26.8%, and 23.1%. The average RMSD of the lowest energy structure is improved by DOPE-Cβ-Back but is worsened by DOPENN-Cβ. The quality of the Z-scores also is improved by all modifications. DOPE-Cβ has a Z-score of 0.89, whereas DOPE-Cβ-N1-N ≥ 2, DOPE-Cβ-N1-N2-N ≥ 3, and DOPE-Cβ-Back produce Z-scores of 1.32, 1.45, and 1.84, respectively.
Table 2.
Performance of reduced β-carbon statistical potentials for all 306 decoy sets

As with the all-atom potentials, the correlation coefficient is worsened by the modifications. The correlation coefficient of DOPE-Cβ is 0.36, and after modification, DOPE-Cβ-Back, DOPE-Cβ-N1-N ≥ 2, and DOPE-Cβ-N1-N2-N ≥ 3 yield correlations of 0.20, 0.31, and 0.22. Table 2 is compiled using coefficients chosen primarily to optimize the success rate, while optimizations in terms of Z-scores and correlation coefficients are included as Supplemental material.
The first commendable point about these Cβ reduced potentials is that the success rate for all three of the modified potentials exceeds that for the all-atom statistical potential DOPE. Even more interesting is the ability of DOPE-Cβ-Back to reproduce the results of the all-atom DOPE-Back. Figure 5 quantifies how effectively DOPE and DOPE-Back reduce to their Cβ representations by plotting the probability distributions for the correlation coefficients between the all-atom and reduced potentials over all 306 decoy sets. The average correlation coefficient (R value) between the energy scores of DOPE-Back and DOPE-Cβ-Back across the entire training set is 0.85, with 43% of the decoy sets having a correlation coefficient higher than 0.90. The correlation coefficient between DOPE and DOPE-Cβ is 0.82, with 19% of the protein decoys having a correlation above 0.90. The origin of the dramatic difference in “percentage above 0.9” with only a small difference in the average correlation is apparent from Figure 5. The DOPE-Back distribution peaks strongly at high correlations, yet exhibits a few very poor correlations that bring the average significantly down. The DOPE distribution has a lower maximum but is not as disperse.
Figure 5.

Probability distributions of the correlation coefficient between DOPE and DOPE-Cβ vs. DOPE-Back and DOPE-Cβ-Back over all 306 decoy sets. To illustrate the geometric meaning of particular correlation coefficients, correlations between all-atom and reduced β-carbon DOPE-Back statistical potentials are taken from the Baker decoy set for the proteins 1ubx, 1ail, and 1bq9.
Figure 5 also exhibits the DOPE-Cβ-Back energy score against the DOPE-Back energy score for several decoy sets, and remarkably, the correlation coefficient between these energy functions in the optimal case is 0.993. However, despite this optimal performance, this situation represents the maximum of the probability distribution, and 19% of decoy sets display correlation coefficients above 0.97. As suggested in the Materials and Methods section, it appears that in many cases, once the Ramachandran conformation and amino acid identity of a residue are specified, essentially all of the side-chain information is effectively incorporated for these decoys that have good side-chain packing. Undoubtedly, the all-atom potentials would outperform their Cβ counterparts, for decoy sets with poor packing.
Performance of hybrid energy functions
We next consider the combination of these new statistical potentials with other energy functions that include effects that are not explicitly contained in the DOPE-like statistical potentials. The three effects considered are hydrogen bonding, backbone conformational preferences, and solvation energies. As discussed in the Materials and Methods section, hydrogen bonding is modeled using Kortemme, Morozov, and Baker's orientation-dependent—hydrogen-bonding energy function (KMBhbond). Torsional conformational preferences are described using the Torsion Statistical Potential (TSP) developed by Jha et al. (2005b). Finally, two possible energy functions are used to describe solvation energies. The Ooi-Scheraga solvent accessible surface area (SASA) potential (Ooi et al. 1987) is used in conjunction with all-atom statistical potentials, while a very simple Environmental Statistical Potential (ESP) is considered for use with Cβ representations.
Table 3 compares the reduced Cβ-representation statistical potentials obtained by combining one of our new statistical potentials with the three other energy functions. In all cases, the hybrid energy functions perform better than their nonhybrid counterparts. This behavior is expected because relevant additional information is included in these hybrid energy functions, and the optimization process ensures that the new hybrid energy functions cannot do worse than the original statistical potentials. The DOPE-Cβ, DOPE-Cβ-Back, DOPE-Cβ−N1-N ≥ 2, and DOPE-Cβ−N1-N2-N ≥ 3 hybrid statistical potentials exhibit success rates of 172, 184, 170, and 179; average native rankings of 22.2%, 18.1%, 23.1%, and 21.4%; average RMSD predictions of 3.46, 2.98, 3.28, and 3.23; Z-scores of 2.65, 2.48, 2.20, and 2.41; and correlation coefficients of 0.22, 0.20, 0.27, and 0.22, respectively.
Table 3.
Performance of reduced β-carbon hybrid statistical potentials for all 306 decoy sets

Table 4 compares the all-atom statistical potentials obtained by combining one of our new statistical potentials with the three other all-atom energy functions. Again, all the hybrid statistical potentials are superior to their nonhybrid counterparts. The DOPE, DOPE-Back, DOPE-N1-N ≥ 2, and DOPE-N1-N2-N ≥ 3 hybrid statistical potentials exhibit success rates of 192, 198, 202, and 209; average native rankings of 15.2%, 11.7%, 13.8%, and 15.0%; average RMSD predictions of 2.48, 2.14, 2.03, and 2.02; Z-scores of 2.88, 2.42, 2.98, and 2.71; and correlation coefficients of 0.37, 0.31, 0.39, and 0.35.
Table 4.
Performance of all-atom hybrid statistical potentials on all 306 decoy sets

The exclusion of NMR structures in the assessment of the statistical potential further highlights the success of these hybrid statistical potentials. If NMR structures are not included in the test, the best, reduced statistical potential correctly identifies 178 of the 249 native structures, and the best all-atom statistical potential recognizes 195 of the 249 native structures. Electronic supplemental material presents a more detailed comparison of how the statistical potentials perform for subsets of the 306 decoy sets.
The reduced hybrid energy functions can be used for protein folding simulations with the clOOPS protein folding software. However, a second optimization of coefficients almost certainly is necessary because potentials that are optimized for identifying native structures may not be the best for guiding folding starting from the unfolded state. The all-atom hybrid energy functions cannot be used for Cβ level folding simulations but can be applied in the final step after the side groups are introduced.
Conclusions and further work
We have produced three new statistical potentials that perform better than one of the best statistical potentials available, DOPE, demonstrating superb ability to discriminate between native structures and nonnative structures. Furthermore, once these statistical potentials are combined with energy functions designed to describe hydrogen bonding, torsion energies, and solvation energies, the resultant hybrid energy functions perform extraordinarily well in their recognition of native structures in decoy sets.
Of particular interest is our development of reduced Cβ-representation statistical potentials. These statistical potentials perform much better than the other reduced statistical potential in correctly identifying native structures from decoy sets, and even perform better than the all-atom DOPE statistical potential. Strikingly, the backbone-dependent statistical potential is able to retain nearly all of the information obtained from the all-atom potential in its Cβ-representation. The ability of Cβ statistical potentials to perform at the level of high-quality all-atom statistical potentials will facilitate significant simplifications in computational protein science. These statistical potentials are currently being optimized for applications to protein structure prediction and refinement. The all-atom statistical potentials developed here are also in the process of being optimized for use as a screening tool in these applications.
Materials and Methods
Generation of statistical potentials
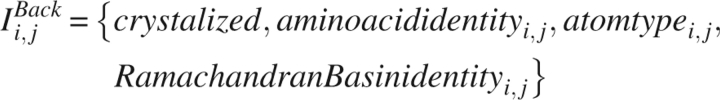
All three statistical potentials described in the Theory section (DOPE, DOPE-Back, and DOPENN) are derived using statistics from protein crystal structures deposited in the Protein Data Bank (PDB) (Kouranov et al. 2006). Because certain protein families are overrepresented in the PDB due to specific biological interest, a subset is chosen from the PDB consisting of 1441 crystal structures with <25% sequence homology, resolution below 2.2 Å, and R-factors <0.3. These 1441 structures are used to compute a series of pair distributions for all types of pairs of heavy atoms in the protein. In addition to the residue and atom type specification of DOPE, DOPENN treats atom pairs differently depending on their separation in primary sequence, while DOPE-Back distinguishes atom pairs with regard to the RB occupied by the given amino acid.
The number densities obtained from the PDB are normalized with respect to the noninteracting reference states developed in the Theory and Appendix sections. DOPE, DOPE-Back, and the nonlocal term of DOPENN are constructed assuming that the atoms in the noninteracting system are uniformly distributed throughout a sphere. Statistics are compiled by grouping empirical distances into 30 bins each having a width of 0.5 Å. The lower bound for these distances is 0 Å, and the upper bound is 15 Å. Because a cutoff distance of 15 Å is used, an additive constant is included that ensures that the energy score vanishes at the cutoff distance.
DOPENN uses separate local interaction energy scores to describe residues separated by small distances in primary sequence. Unlike the DOPE reference state, which assumes a random distribution inside a sphere, the reference states for these local interactions respect the geometric constraints induced by the polymer nature of the chain at short distances. The unbiased probability distributions for the reference state DOPENN are determined by compiling the statistics from an unfolded ensemble of 16,000 ubiquitin structures that are generated with a statistical coil model of the unfolded state (Jha et al. 2005a). An average over all residues in ubiquitin is performed to remove any residue dependence. Because the reference state for the local contributions to DOPENN is averaged over amino acid identity, the local interaction energy scores in DOPENN inherently correspond to those of a reduced representation and can be used with only the β-carbons of the side chains. Figure 3 contrasts these reference state probability densities for the sequence local interaction energy scores with the uniform density approximation of DOPE. The reference state distribution for DOPE-N1 is rather narrow, consistent with stringent nearest neighbor geometric constraints. As expected, the reference distributions broaden with increased sequence separation. Statistics are compiled by grouping empirical distances into 30 bins, but the width of the bins, the lower bound for these distances, and the upper bound for these distances vary with the local term because of their differing spatial ranges. The N1 term calculates distances in the range [0.7 Å, 8.8 Å], the N2 term calculates distances in the range [1.3 Å, 12.1 Å], the N3 term lies in the range [1.6 Å, 15.7 Å], and the N4 term has distances in the range [2.5 Å, 19 Å].
Other energy functions
The Results and Discussion section also discusses statistical potentials that are devised by combining the statistical potentials developed here with earlier energy functions that focus on specific physical properties. We also introduce a very simple ESP that is tailored for application within the reduced Cβ representation. The three additional energy functions describe hydrogen bonding (KMBhbond) (Kortemme et al. 2003), torsion energies (TSP) (Jha et al. 2005b), and energies associated with the SASA (Ooi et al. 1987).
KMBhbond is a statistical potential for hydrogen bonding that depends on the distance between the geometric centers of the N-H bond vector, the C=O bond vector, the bond angle between the N-H bond vector and the hydrogen bond, the bond angle between the C=O bond vector and the hydrogen bond, and the dihedral angle about the acceptor-acceptor base bond. The three angles describe the relative orientation of the bond vectors in the hydrogen bond. We use a modified form in which the contribution associated with rotation about the torsion angle is omitted because our tests indicate that this modification improves the performance with decoys sets.
The TSP has been developed (Jha et al. 2005b) using high-resolution crystal structures contained in the PDB. The energy score assigned to the backbone Ramachandran conformation of a residue depends on the chemical identity of the residue as well as the chemical identity of the neighboring residues. The noninteracting reference system is defined as the state in which the backbone torsional angles are uniformly distributed. The energy score associated with the backbone torsion angles of residue i is thus given by
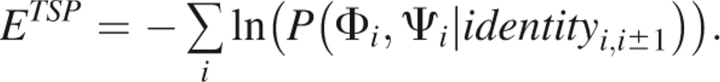 |
The Ooi-Scheraga solvent-accessible surface area (SASA) potential is of the form
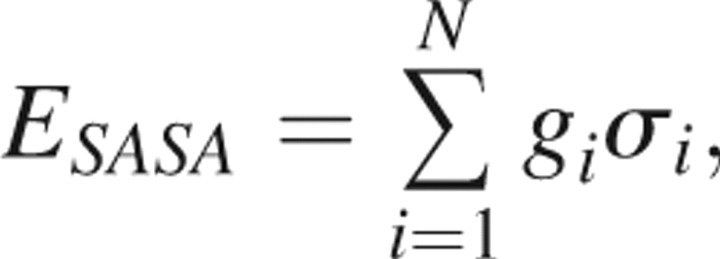 |
where σi is the accessible surface area of a hypersurface bisecting the first solvent shell surrounding protein atom i and gi is an empirical (free energy) parameter dependent on atom type. Because the side chain is important in defining the exposed surface area, this energy function is only applied within an all-atom representation. As an alternate for use with reduced Cβ representations, we employ a simpler ESP that assigns each residue with an environmental energy score that is a function of the size of the protein and the number of α-carbons contained within an 8.5 Å sphere centered on the residue's α-carbon (Fernandez et al. 2002). Explicitly, this energy score is of the form
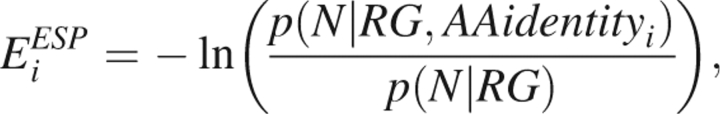 |
where N is the number of α-carbons in an 8.5 Å sphere centered on the residue's α-carbon (ignoring the two sequential nearest neighbors), RG is the radius of gyration of the protein, AAidentity is the amino acid identity of the residue, p(N|RG) defines the reference state as the number of α-carbons in an 8.5 Å sphere independent amino acid identity, and the total energy score is the sum over all residues i in the protein.
Decoy sets
The various energy functions are tested using a series of decoy sets, each of which is a collection of protein structures consisting of the native structure and many alternate structures for a given amino acid sequence. We consider a total of 306 protein decoys sets from a variety of sources to minimize biases associated with various collections of decoy sets. These biases arise because the performance of a statistical potential for a given decoy set is determined not only by the statistical potential but also by the decoy set. The “Zhou” decoy set includes 96 standard decoy sets with known X-ray crystal structures (Zhang et al. 2004). The “Baker” decoy set is generated with the Rosetta algorithm (Simons et al. 1997) and includes over 75,000 members for 41 proteins whose structures have been determined with either X-ray crystallography or NMR. Finally we test all decoys that Zhou has removed from the original collections of decoy sets (Zhang et al. 2004) because these decoys consist of NMR structures or of sets of hemoglobin and immunoglobulin threading decoys. These decoy sets are termed “NMR” and “Threading,” respectively.
Five metrics are employed to evaluate the performance of our statistical potentials on the decoy sets. The first metric is simply the success rate of identifying the native conformation as the lowest energy structure. The second metric is the average percentile ranking of the native structure in the decoy set (the average fraction of structures with energies lower than that of the native). The third metric is the average RMSD of the lowest energy structure. The fourth metric, called the Z-score, is a statistical measure that quantifies the number of standard deviations σ between the native energy ENat and the mean μ of the energy distribution,
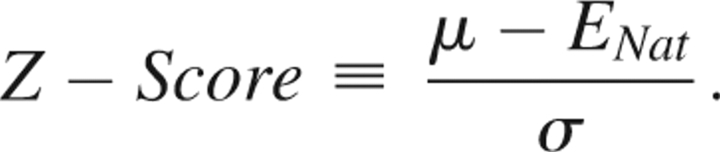 |
The Z-score is defined with the opposite sign than conventional, so that a large positive Z-score is considered ideal. The final metric is the correlation coefficient between the RMSD of the structure from the native and the energy score of the decoys. In general, the correlation coefficient between two variables, x and y, is given by
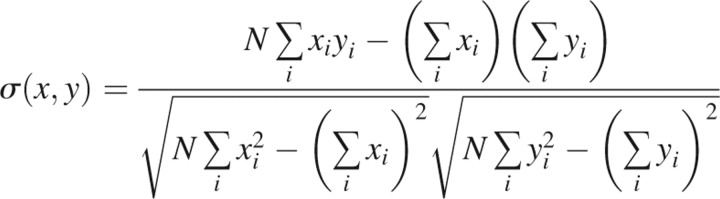 |
where N is the number of data points in the sum. The correlation coefficient takes values in the range [−1,1], with −1 being perfect anti-correlation and 1 being perfect correlation. A high correlation coefficient may be an advantageous metric for folding or for refining structures since a high correlation suggests that a decreased energy score is likely to produce a reduction in the RMSD. However, it is not physically clear that a high correlation should exist between RMSD and energy score over the large range of RMSD found in decoy sets.
Optimizing coefficients
All the statistical potentials considered here are comprised of a linear sum of up to four simpler contributions with adjustable weights. The coefficients in each sum are found through optimization on the decoy sets. The quality of each set of coefficients is gauged by independently optimizing the success rate, the Z-score, and the correlation coefficient. To empirically determine which set of coefficients produces the most balanced statistical potential, these three sets are compared when considering all three metrics simultaneously. Our primary emphasis is placed on optimizing the success rate, but alternates based on stressing other metrics are included in the Electronic supplemental material.
The optimization process proceeds in a two-step manner. First, a simulated annealing algorithm is performed in coefficient space. The output of the annealing routine is then further optimized with L-BFGS-B constrained quasi-Newton optimization (Byrd et al. 1995; Zhu et al. 1997). This second step is not performed for the success rate optimization because the success rate is a discrete function to which derivative based techniques are inapplicable.
Implementation
All of the statistical potentials discussed in this paper are implemented in the protein folding simulation package clOOPS (Colubri et al. 2006). The software is open source (http://protlib.uchicago.edu). The source code is written in C++. Only a reduced Cβ-energy function may be used for simulation in clOOPS, but the all-atom statistical potentials may be used for analyzing the output of these trajectories. A much more detailed discussion of this software and its performance are discussed elsewhere (Colubri et al. 2006).
Acknowledgments
This work is supported by grants from the NIH (T.R.S. GM55694) and NSF (K.F.F. CHE-0416017). J.E.F. thanks Professors David Angulo and Gregor von Laszewski for useful discussions and support from NSF Grant No. 0353989. We also thank Dr. Min-yi Shen for critically reviewing the manuscript and Professor David Shortle for useful discussions. This research is supported in part by the National Science Foundation through TeraGrid resources by NCSA and SDSC (T.R.S. MCB050042P) (K.F.F. CHE050067T). J.E.F. is a University of Chicago Beckman Scholar and acknowledges the Arnold and Mabel Beckman Foundation for funding. A.K.J. acknowledges the support of Burroughs Wellcome Fund Interfaces 1001774.
Appendix
Basic theory of statistical potentials
Here, we develop the statistical mechanical approach to statistical potentials and carefully note where approximations are necessary. The n-body correlation function is defined by
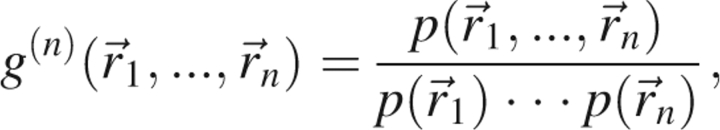 |
where  is the probability density that the n atoms have positions
  and
and  is the probability density that the jth atom has position
  . If the atoms were noninteracting, the n-body probability density would separate into a product of single body terms, and the function g (n) would equal unity for all positions . Thus, as its name suggests, the n-body correlation function measures the extent of correlation between the n atoms.
The potential of mean force w (n) is defined in terms of the n-body correlation function through
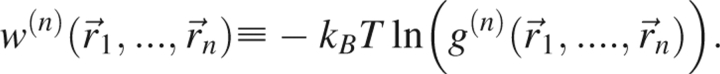 |
If an isolated system consists of N atoms (which includes both solvent and protein atoms), then the gradient of the potential of mean force, , represents the average force on atom j when the positions of atoms n + 1,…,N have been averaged over all microstates consistent with the ensemble. Therefore,
  , where U is the potential energy of the system, but in general, when n < N,
  .
.
The ground state of the protein with n atoms by definition maximizes the probability density function, . Using the definition of the potential of mean force,
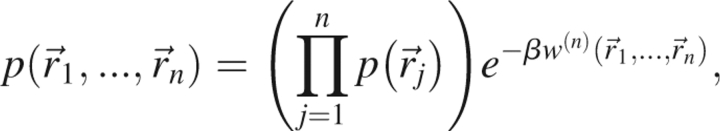 |
and ignoring constant factors that are independent of protein structure, the ground state of a given protein corresponds to the minimum of  .
.
In principle, could be calculated directly from the probability densities evaluated from a library of protein structures. This procedure is well defined provided that all protein structures used are obtained under the same conditions. Hence, most statistical potentials restrict consideration to crystallized protein structures. Because of the restriction to crystal structures, the resultant statistical potentials may have limitations in evaluating protein structures found by other experimental techniques.
In practice, using as a scoring function is impossible. There is insufficient data to determine the full n-body joint distribution function. Computational tractability and data sparseness generally dictate invoking the assumption that the potential of mean force is pairwise additive. The errors associated with this approximation can be reduced in two manners. First, additional information can be appended in an attempt to restore a portion of the information lost by ignoring many-body interactions. Techniques for introducing the added information include allowing the statistical potential to treat atoms differently depending on their context in the sequence (e.g., α-carbons are distinguished from β-carbons or, e.g., β-carbonsAlanine are distinct from β-carbonsValine) or environment (buried versus exposed). Some effort has been devoted to determining the optimal number of distinct atom types for use when building an all-atom statistical potential (Solis and Rackovsky 2000, 2006; Kuznetsov and Rackovsky 2002; Mintseris and Weng 2004).
Second, it is crucial to introduce a reference state to define the free energy of the noninteracting system, a feature necessitated by the neglect of many-body correlations. After introducing these improvements, the potential of mean force takes the form
 |
where the sum is over all atom pairs, w (2) depends only on the interparticle distances rij, and where the notation Iij designates the added information that is discussed more fully later.
By definition w (2) depends only on the pair distribution function and upon constant terms that are ignored since they produce an additive constant that is unimportant for ranking protein structures. The potential of mean force is represented as
 |
where N(rij|Iij) is the number of observations in the database and NREF(rij|Iij) is the number of observations that are expected in the completely noninteracting reference system that defines the zero of free energy. It is sometimes desirable to use reduced representations in which certain protein atoms are excluded in the energy calculation. This approximation therefore loses some information concerning the omitted atoms and thus can also be improved by introducing additional information and carefully choosing reference states that may depend both on the interparticle distance and on the additional information.
The foregoing approximations require three choices in order to construct a statistical potential. The first choice concerns the level of representation to be used; the second is associated with the type of added information; and the third concerns the reference state used to define the zero of free energy. These choices largely determine the success of the statistical potential. Statistical potentials could also be designed to include many-body interactions or to reproduce particular experimental data, but these approaches are not pursued further here.
Reference state probability distribution used in DOPE, DOPE-Back, and nonlocal components of DOPENN
The reference state considered by DOPE is reviewed because this reference state forms the basis for those used in several of the statistical potentials developed here (Shen and Sali 2006). DOPE defines the reference state as one in which the particles are distributed uniformly throughout a sphere whose radius, a, is related to the radius of gyration RG of the protein by . This simple, yet reasonable model permits the analytical determination of the reference state probability distribution. The treatment of the problem presented here mirrors that of Shen and Sali (2006) and is reproduced here to motivate our choices regarding reference states. The equivalent problem has also been addressed elsewhere (Deltheli 1919; Hammersley 1950; Lord 1954; Smith 1977; Tu and Fischbach 2002; Garcia-Pelayo 2005).
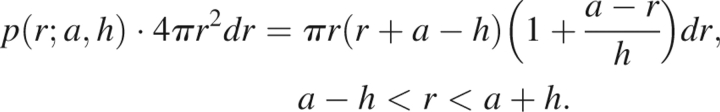
Let the first particle be located at the position hẑ, where hẑ is a unit vector along the Z-axis. The probability that the second particle is located at a distance between r and r + dr is proportional to the volume of the infinitesimal shell of inner radius r and thickness dr centered at hẑ that is contained within the reference sphere of radius a. Since this probability depends on h, this is called the partial probability function, and the reference state probability distribution is found by integrating over all possible values of h. If r < a − h, then the shell of radius r centered at hẑ is completely contained within the reference sphere of radius a. The partial probability function in this case is simply given by
 |
When a − h < r < a + h, the shell of radius r centered at hẑ intersects the reference sphere, and only the portion of the shell is contained within the reference sphere and contributes to the partial probability function. In this situation, the partial probability function is given by
 |
The final case arises when r > a + h, whereupon the entire shell of radius r is located outside of the reference sphere, giving
 |
The reference state probability distribution pDOPE (r, a) is obtained by integrating the partial probability function over all possible values of h,
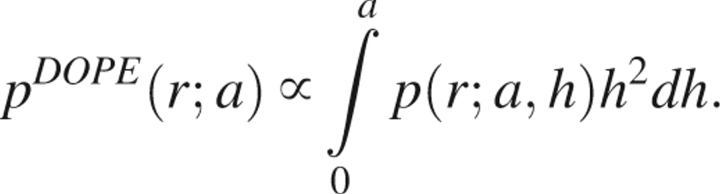 |
Because the reference state probability distribution is designed to determine the probability distribution in the absence of all interactions, pDOPE (r; a) is unit normalized. Suppose that a nonbonded cutoff c is used when compiling statistics from crystal structures. Since all computed distances lie in the range between zero and c, the normalization of the reference state must also be over this range,
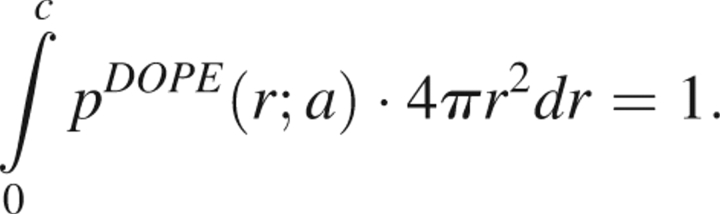 |
If c > 2a, then because the reference state probability distribution vanishes when 2a < r < c, we may rewrite this in the more convenient form
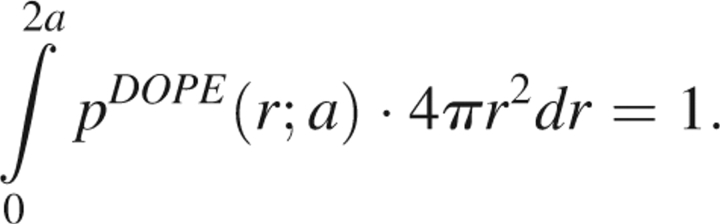 |
Upon performing the necessary integrals, we compute the probability of finding two atoms separated by a distance in the range of r and r + dr in the reference state as,
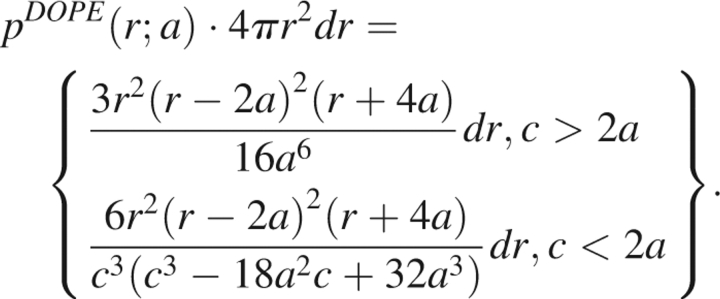 |
Figure 1 displays the probability distribution for two particles to be located between a distance of r and r + dr for c > 2a and a = 24 as a function of r.
The training set used to determine DOPE spans a wide range of protein sizes. The total probability density used for the reference state is then computed as a weighted average over the various sized proteins in the training set,
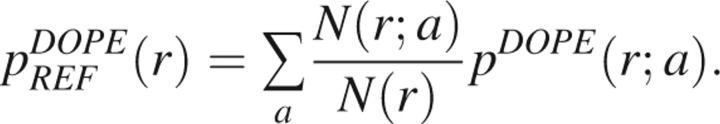 |
Reference states for local interaction terms of DOPENN
Due to local geometric constraints, the assumption of a random distribution within a sphere poorly describes the reference state for interactions between residues close in primary sequence. In previous work, we have developed a statistical coil model that reproduces both the random-coil scaling of the radius of gyration and the residual dipolar couplings experimentally observed in partially aligned chemically denatured unfolded states. Because this unfolded ensemble retains the polymeric nature of the protein backbone and satisfies excluded volume constraints, this model is used to determine the reference state probability distributions for the local terms of DOPENN.
We model the unfolded state as an ensemble of structures, consistent with excluded volume constraints and the intrinsic backbone preferences of the protein. Previous work has shown that these preferences depend on the amino acid identity as well as on the identity and backbone conformations of the flanking residues (Jha et al. 2005b). We encode this information in our unfolded ensemble through an energy function that depends on the identity and conformation of the nearest neighbors. Ideally, this energy function would depend on the identity and conformation of both neighbors simultaneously, but due to statistical limitations, the energy function is constructed using dimer statistics for each neighbor separately.
The simplest Ramachandran energy depends only on single residues and has the form
 |
where ai is the amino acid identity and bi is the Ramachandran bin occupied by the residue. As mentioned above, neighbor effects contribute a coupling term to this energy.
 |
Here, we assume that the backbone conformations of only the nearest neighbors are coupled in the unfolded state. The energy of the protein conformation is then
 |
An unfolded ensemble is generated through a Monte Carlo simulation using this energy function. The move set for this simulation is trimer insertion from a restricted coil library of residues outside of, and not adjacent to, regular secondary structure (helix, sheet, and hydrogen bonded turn). This initial ensemble is then “nudged” in order to relieve steric clashes. “Nudging” consists of varying torsion angles within a window while minimizing an excluded volume potential consisting of a hard sphere interaction between backbone heavy atoms and side-chain β-carbons and a soft sphere potential between the side-chain centers of mass (with soft-sphere radius, such that 90% of the accessible side-chain volume is contained within the sphere). After this minimization protocol, side chains are inserted using SCWRL (Canutescu et al. 2003), and hydrogen atoms are inserted using REDUCE (Word et al. 1999).
In previous work, this unfolded ensemble is shown to reproduce both local and global aspects of the chemically denatured state for several experimentally studied systems (Jha et al. 2005a). In particular, this model predicts random-coil scaling of the radius of gyration and accurately recapitulates experimental residual dipolar coupling data. A Web server has been created that allows users to calculate unfolded ensembles for arbitrary protein sequences (http://unfolded.uchicago.edu).
Footnotes
Supplemental material: see www.proteinscience.org
Reprint requests to: Tobin R. Sosnick, Department of Biochemistry and Molecular Biology, The University of Chicago, Chicago, IL 60637, USA; e-mail: trsosnic@uchicago.edu; fax: (773) 702-0439; or Karl F. Freed, The James Franck Institute, The University of Chicago, Chicago, IL 60637, USA; e-mail: freed@uchicago.edu; fax: (773) 702-5863.
Article and publication are at http://www.proteinscience.org/cgi/doi/10.1110/ps.072939707.
References
- Anfinsen C.B. 1972. Formation and stabilization of protein structure. Biochem. J. 128: 737–749. [DOI] [PMC free article] [PubMed] [Google Scholar]
- Anfinsen C.B. 1973. Principles that govern folding of protein chains. Science 181: 223–230. [DOI] [PubMed] [Google Scholar]
- Bauer A. and Beyer, A. 1994. An improved pair potential to recognize native protein folds. Proteins 18: 254–261. [DOI] [PubMed] [Google Scholar]
- Bennaim A. 1997. Statistical potentials extracted from protein structures: Are these meaningful potentials? J. Chem. Phys. 107: 3698–3706. [Google Scholar]
- Betancourt M.R. 2003. A reduced protein model with accurate native-structure identification ability. Proteins 53: 889–907. [DOI] [PubMed] [Google Scholar]
- Bowie J.U., Luthy, R., and Eisenberg, D. 1991. A method to identify protein sequences that fold into a known three-dimensional structure. Science 253: 164–170. [DOI] [PubMed] [Google Scholar]
- Brooks B.R., Bruccoleri, R.E., Olafson, B.D., States, D.J., Swaminathan, S., and Karplus, M. 1983. Charmm—a program for macromolecular energy, minimization, and dynamics calculations. J. Comput. Chem. 4: 187–217. [Google Scholar]
- Buchete N.V., Straub, J.E., and Thirumalai, D. 2004. Orientational potentials extracted from protein structures improve native fold recognition. Protein Sci. 13: 862–874. [DOI] [PMC free article] [PubMed] [Google Scholar]
- Byrd R.H., Lu, P.H., Nocedal, J., and Zhu, C.Y. 1995. A limited memory algorithm for bound constrained optimization. Siam J. Sci. Comput. 16: 1190–1208. [Google Scholar]
- Canutescu A.A., Shelenkov, A.A., and Dunbrack Jr, R.L. 2003. A graph-theory algorithm for rapid protein side-chain prediction. Protein Sci. 12: 2001–2014. [DOI] [PMC free article] [PubMed] [Google Scholar]
- Casari G. and Sippl, M.J. 1992. Structure-derived hydrophobic potential—hydrophobic potential derived from X-ray structures of globular-proteins is able to identify native folds. J. Mol. Biol. 224: 725–732. [DOI] [PubMed] [Google Scholar]
- Chen N.Y., Su, Z.Y., and Mou, C.Y. 2006. Effective potentials for folding proteins. Phys. Rev. Lett. 96: 078103. doi: 10.1103/PhysRevLett.96.078103. [DOI] [PubMed] [Google Scholar]
- Chiu T.L. and Goldstein, R.A. 2000. How to generate improved potentials for protein tertiary structure prediction: A lattice model study. Proteins 41: 157–163. [DOI] [PubMed] [Google Scholar]
- Colubri A., Jha, A.K., Shen, M.Y., Sali, A., Berry, R.S., Sosnick, T.R., and Freed, K.F. 2006. Minimalist representations and the importance of nearest neighbor effects in protein folding simulations. J. Mol. Biol. 363: 535–557. [DOI] [PubMed] [Google Scholar]
- Deltheli R. 1919. Sur la théorie des probabilités géométriques. Ann. Fac. Sci. Univ. Toulouse 11: 1–65. [Google Scholar]
- Eramian D., Shen, M.Y., Devos, D., Melo, F., Sali, A., and Marti-Renom, M.A. 2006. A composite score for predicting errors in protein structure models. Protein Sci. 15: 1653–1666. [DOI] [PMC free article] [PubMed] [Google Scholar]
- Fang Q.J. and Shortle, D. 2006. Protein refolding in silico with atom-based statistical potentials and conformational search using a simple genetic algorithm. J. Mol. Biol. 359: 1456–1467. [DOI] [PubMed] [Google Scholar]
- Feig M. and Brooks, C.L. 2002. Evaluating CASP4 predictions with physical energy functions. Proteins 49: 232–245. [DOI] [PubMed] [Google Scholar]
- Fernandez A., Sosnick, T.R., and Colubri, A. 2002. Dynamics of hydrogen bond desolvation in protein folding. J. Mol. Biol. 321: 659–675. [DOI] [PubMed] [Google Scholar]
- Finkelstein A.V., Badretdinov, A.Y., and Gutin, A.M. 1995. Why do protein architectures have Boltzmann-like statistics? Proteins 23: 142–150. [DOI] [PubMed] [Google Scholar]
- Fujitsuka Y., Takada, S., Luthey-Schulten, Z.A., and Wolynes, P.G. 2004. Optimizing physical energy functions for protein folding. Proteins 54: 88–103. [DOI] [PubMed] [Google Scholar]
- Garcia A.E. and Sanbonmatsu, K.Y. 2002. α-Helical stabilization by side-chain shielding of backbone hydrogen bonds. Proc. Natl. Acad. Sci. 99: 2782–2787. [DOI] [PMC free article] [PubMed] [Google Scholar]
- Garcia-Pelayo R. 2005. Distribution of distance in the spheroid. J. Phys. A Math. Gen. 38: 3475–3482. [Google Scholar]
- Gatchell D.W., Dennis, S., and Vajda, S. 2000. Discrimination of near-native protein structures from misfolded models by empirical free energy functions. Proteins 41: 518–534. [PubMed] [Google Scholar]
- Gilis D. and Rooman, M. 1997. Predicting protein stability changes upon mutation using database-derived potentials: Solvent accessibility determines the importance of local versus nonlocal interactions along the sequence. J. Mol. Biol. 272: 276–290. [DOI] [PubMed] [Google Scholar]
- Hammersley J.M. 1950. The distribution of distance in a hypersphere. Ann. Math. Stat. 21: 447–452. [Google Scholar]
- Hendlich M., Lackner, P., Weitckus, S., Floeckner, H., Froschauer, R., Gottsbacher, K., Casari, G., and Sippl, M.J. 1990. Identification of native protein folds amongst a large number of incorrect models—the calculation of low-energy conformations from potentials of mean force. J. Mol. Biol. 216: 167–180. [DOI] [PubMed] [Google Scholar]
- Hu H., Elstner, M., and Hermans, J. 2003. Comparison of a QM/MM force field and molecular mechanics force fields in simulations of alanine and glycine “dipeptides” (Ace-Ala-Nme and Ace-Gly-Nme) in water in relation to the problem of modeling the unfolded peptide backbone in solution. Proteins 50: 451–463. [DOI] [PubMed] [Google Scholar]
- Hubner I.A., Deeds, E.J., and Shakhnovich, E.I. 2006. Understanding ensemble protein folding at atomic detail. Proc. Natl. Acad. Sci. 103: 17747–17752. [DOI] [PMC free article] [PubMed] [Google Scholar]
- Jha A.K., Colubri, A., Freed, K.F., and Sosnick, T.R. 2005a. Statistical coil model of the unfolded state: Resolving the reconciliation problem. Proc. Natl. Acad. Sci. 102: 13099–13104. [DOI] [PMC free article] [PubMed] [Google Scholar]
- Jha A.K., Colubri, A., Zaman, M.H., Koide, S., Sosnick, T.R., and Freed, K.F. 2005b. Helix, sheet, and polyproline II frequencies and strong nearest neighbor effects in a restricted coil library. Biochemistry 44: 9691–9702. [DOI] [PubMed] [Google Scholar]
- Jorgensen W.L. and Tiradorives, J. 1988. The Opls potential functions for proteins—energy minimizations for crystals of cyclic-peptides and crambin. J. Am. Chem. Soc. 110: 1657–1666. [DOI] [PubMed] [Google Scholar]
- Kolinski A. and Skolnick, J. 2004. Reduced models of proteins and their applications. Polym. 45: 511–524. [Google Scholar]
- Kortemme T., Morozov, A.V., and Baker, D. 2003. An orientation-dependent hydrogen bonding potential improves prediction of specificity and structure for proteins and protein-protein complexes. J. Mol. Biol. 326: 1239–1259. [DOI] [PubMed] [Google Scholar]
- Kouranov A., Xie, L., De la Cruz, J., Chen, L., Westbrook, J., Bourne, P.E., and Berman, H.M. 2006. The RCSB PDB information portal for structural genomics. Nucleic Acids Res. 34: D302–D305. doi: 10.1093/nar/gkjl20. [DOI] [PMC free article] [PubMed] [Google Scholar]
- Kuznetsov I.B. and Rackovsky, S. 2002. Discriminative ability with respect to amino acid types: Assessing the performance of knowledge-based potentials without threading. Proteins 49: 266–284. [DOI] [PubMed] [Google Scholar]
- Lord R.D. 1954. The distribution of distance in a hypersphere. Ann. Math. Stat. 25: 794–798. [Google Scholar]
- Lu H. and Skolnick, J. 2001. A distance-dependent atomic knowledge-based potential for improved protein structure selection. Proteins 44: 223–232. [DOI] [PubMed] [Google Scholar]
- Melo F., Sanchez, R., and Sali, A. 2002. Statistical potentials for fold assessment. Protein Sci. 11: 430–448. [DOI] [PMC free article] [PubMed] [Google Scholar]
- Mintseris J. and Weng, Z. 2004. Optimizing protein representations with information theory. Genome Inform. 15: 160–169. [PubMed] [Google Scholar]
- Miyazawa S. and Jernigan, R.L. 1999. An empirical energy potential with a reference state for protein fold and sequence recognition. Proteins 36: 357–369. [PubMed] [Google Scholar]
- Mu Y.G., Kosov, D.S., and Stock, G. 2003. Conformational dynamics of trialanine in water. 2. Comparison of AMBER, CHARMM, GROMOS, and OPLS force fields to NMR and infrared experiments. J. Phys. Chem. B 107: 5064–5073. [Google Scholar]
- Mukherjee A., Bhimalapuram, P., and Bagchi, B. 2005. Orientation-dependent potential of mean force for protein folding. J. Chem. Phys. 123: 014901. doi: 10.1063/1.1940058. [DOI] [PubMed] [Google Scholar]
- O'Donoghue S.I. and Nilges, M. 1997. Tertiary structure prediction using mean-force potentials and internal energy functions: Successful prediction for coiled-coil geometries. Fold. Des. 2: 447–452. [DOI] [PubMed] [Google Scholar]
- Ooi T., Oobatake, M., Nemethy, G., and Scheraga, H.A. 1987. Accessible surface-areas as a measure of the thermodynamic parameters of hydration of peptides. Proc. Natl. Acad. Sci. 84: 3086–3090. [DOI] [PMC free article] [PubMed] [Google Scholar]
- Park B. and Levitt, M. 1996. Energy functions that discriminate X-ray and near-native folds from well-constructed decoys. J. Mol. Biol. 258: 367–392. [DOI] [PubMed] [Google Scholar]
- Pokala N. and Handel, T.M. 2001. Protein design—where we were, where we are, where we're going. J. Struct. Biol. 134: 269–281. [DOI] [PubMed] [Google Scholar]
- Ramachandran G.N., Ramakrishnan, C., and Sasisekharan, V. 1963. Stereochemistry of polypeptide chain configurations. J. Mol. Biol. 7: 95–99. [DOI] [PubMed] [Google Scholar]
- Rohl C.A., Strauss, C.E.M., Misura, K.M.S., and Baker, D. 2004. Protein structure prediction using Rosetta. Methods Enzymol. 383: 66–93. [DOI] [PubMed] [Google Scholar]
- Samudrala R. and Moult, J. 1998. An all-atom distance-dependent conditional probability discriminatory function for protein structure prediction. J. Mol. Biol. 275: 895–916. [DOI] [PubMed] [Google Scholar]
- Schueler-Furman O., Wang, C., Bradley, P., Misura, K., and Baker, D. 2005. Progress on modeling of protein structures and interactions. Science 310: 638–642. [DOI] [PubMed] [Google Scholar]
- Shen M.Y. and Sali, A. 2006. Statistical potential for assessment and prediction of protein structures. Protein Sci. 15: 2507–2524. [DOI] [PMC free article] [PubMed] [Google Scholar]
- Shen M.Y., Davis, F.P., and Sali, A. 2005. The optimal size of a globular protein domain: A simple sphere-packing model. Chem. Phys. Lett. 405: 224–228. [Google Scholar]
- Simons K.T., Kooperberg, C., Huang, E., and Baker, D. 1997. Assembly of protein tertiary structures from fragments with similar local sequences using simulated annealing and Bayesian scoring functions. J. Mol. Biol. 268: 209–225. [DOI] [PubMed] [Google Scholar]
- Simons K.T., Ruczinski, I., Kooperberg, C., Fox, B.A., Bystroff, C., and Baker, D. 1999. Improved recognition of native-like protein structures using a combination of sequence-dependent and sequence-independent features of proteins. Proteins 34: 82–95. [DOI] [PubMed] [Google Scholar]
- Sippl M.J. 1993. Boltzmann principle, knowledge-based mean fields and protein-folding—an approach to the computational determination of protein structures. J. Comput. Aided Mol. Des. 7: 473–501. [DOI] [PubMed] [Google Scholar]
- Skolnick J., Jaroszewski, L., Kolinski, A., and Godzik, A. 1997. Derivation and testing of pair potentials for protein folding. When is the quasichemical approximation correct? Protein Sci. 6: 676–688. [DOI] [PMC free article] [PubMed] [Google Scholar]
- Smith M.J.D. 1977. Distance distributions and trip behavior in defined regions. Geogr. Anal. 9: 332–345. [Google Scholar]
- Solis A.D. and Rackovsky, S. 2000. Optimized representations and maximal information in proteins. Proteins 38: 149–164. [PubMed] [Google Scholar]
- Solis A.D. and Rackovsky, S. 2006. Improvement of statistical potentials and threading score functions using information maximization. Proteins 62: 892–908. [DOI] [PubMed] [Google Scholar]
- Sun S.J. 1993. Reduced representation model of protein-structure prediction—statistical potential and genetic algorithms. Protein Sci. 2: 762–785. [DOI] [PMC free article] [PubMed] [Google Scholar]
- Taylor R.D., Jewsbury, P.J., and Essex, J.W. 2002. A review of protein-small molecule docking methods. J. Comput. Aided Mol. Des. 16: 151–166. [DOI] [PubMed] [Google Scholar]
- Tobi D. and Elber, R. 2000. Distance-dependent, pair potential for protein folding: Results from linear optimization. Proteins 41: 40–46. [PubMed] [Google Scholar]
- Tobi D., Shafran, G., Linial, N., and Elber, R. 2000. On the design and analysis of protein folding potentials. Proteins 40: 71–85. [DOI] [PubMed] [Google Scholar]
- Topf M., Baker, M.L., Marti-Renom, M.A., Chiu, W., and Sali, A. 2006. Refinement of protein structures by iterative comparative modeling and cryoEM density fitting. J. Mol. Biol. 357: 1655–1668. [DOI] [PubMed] [Google Scholar]
- Tu S.J. and Fischbach, E. 2002. Random distance distribution for spherical objects: General theory and applications to physics. J. Phys. A Math. Gen. 35: 6557–6570. [Google Scholar]
- Word J.M., Lovell, S.C., Richardson, J.S., and Richardson, D.C. 1999. Asparagine and glutamine: Using hydrogen atom contacts in the choice of side-chain amide orientation. J. Mol. Biol. 285: 1735–1747. [DOI] [PubMed] [Google Scholar]
- Yoda T., Sugita, Y., and Okamoto, Y. 2004. Comparisons of force fields for proteins by generalized-ensemble simulations. Chem. Phys. Lett. 386: 460–467. [Google Scholar]
- Zaman M.H., Shen, M.Y., Berry, R.S., Freed, K.F., and Sosnick, T.R. 2003. Investigations into sequence and conformational dependence of backbone entropy, interbasin dynamics and the flory isolated-pair hypothesis for peptides. J. Mol. Biol. 331: 693–711. [DOI] [PubMed] [Google Scholar]
- Zhang C. and Kim, S.H. 2000. Environment-dependent residue contact energies for proteins. Proc. Natl. Acad. Sci. 97: 2550–2555. [DOI] [PMC free article] [PubMed] [Google Scholar]
- Zhang C., Liu, S., Zhou, H., and Zhou, Y. 2004. An accurate, residue-level, pair potential of mean force for folding and binding based on the distance-scaled, ideal-gas reference state. Protein Sci. 13: 400–411. [DOI] [PMC free article] [PubMed] [Google Scholar]
- Zhu C.Y., Byrd, R.H., Lu, P.H., and Nocedal, J. 1997. Algorithm 778: L-BFGS-B: Fortran subroutines for large-scale bound-constrained optimization. ACM Trans. Math. Softw. 23: 550–560. [Google Scholar]