

Abstract
Fibrillar inclusions are a characteristic feature of the neuropathology found in the α-synucleinopathies such as Parkinson's disease, dementia with Lewy bodies, and multiple system atrophy. Familial forms of α-synucleinopathies have also been linked with missense mutations or gene multiplications that result in higher protein expression levels. In order to form these fibrils, the protein, α-synuclein (α-syn), must undergo a process of self-assembly in which its native state is converted from a disordered conformer into a β-sheet-dominated form. Here, we have developed a novel polypeptide property calculator to locate and quantify relative propensities for β-strand structure in the sequence of α-syn. The output of the algorithm, in the form of a simple x-y plot, was found to correlate very well with the location of the β-sheet core in α-syn fibrils. In particular, the plot features three peaks, the largest of which is completely absent for the nonfibrillogenic protein, β-syn. We also report similar significant correlations for the Alzheimer's disease-related proteins, Aβ and tau. A substantial region of α-syn is also of converting from its disordered conformation into a long amphipathic α-helical protein. We have developed the aforementioned algorithm to locate and quantify the α-helical hydrophobic moment in the amino acid sequence of α-syn. As before, the output of the algorithm, in the form of a simple x-y plot, was found to correlate very well with the location of α-helical structure in membrane bilayer-associated α-syn.
Keywords: α-synuclein, β-strand propensity, Alzheimer's disease, Parkinson's disease, algorithm, amyloid fibril
Ageing-related neurodegenerative conditions including Parkinson's disease (PD) and Alzheimer's disease (AD) are the most common causes of motor dysfunction and dementia, respectively (Goedert 2001). Neuropathological observations at post-mortem invariably reveal the presence of extracellular and intracellular proteinaceous deposits, as well as nerve cell degeneration (Alzheimer 1907; Lewy 1912). In all cases, the deposits have a significant fibrillar component which has been isolated and characterized (Eanes and Glenner 1968; Serpell et al. 2000; Berriman et al. 2003). The fibrillar component of Lewy bodies and Lewy neurites is composed of α-synuclein (α-syn) (Baba et al. 1998; Spillantini et al. 1998a). The fibrillar component of AD senile plaques is composed of Aβ peptides (Glenner and Wong 1984) while that of neurofibrillary tangles is composed of tau (Brion et al. 1985; Goedert et al. 1988).
Proteins in general are able to undergo intermolecular associations and aggregation, subject to a destabilization of the natively globular fold (Colon and Kelly 1991; Booth et al. 1997; Perutz 1997). The main effect of many missense mutations identified in cases of familial amyloidoses is likely to be a reduction in stability of tertiary or quarternary structure (Siepen and Westhead 2002). The wild-type protein in a destabilizing environment can also lead to aggregation (Colon and Kelly 1991; Booth et al. 1997; Zurdo et al. 2001). However, in the case of the natively unfolded proteins (or chemically unfolded proteins) (Guijarro et al. 1998; McParland et al. 2000), destabilization of the native state is no longer the rate-limiting step so that self-assembly of the protein in vitro may be estimated from physicochemical properties of its amino acid side chains (Lopez De La Paz et al. 2002; Tjernberg et al. 2002; Chiti et al. 2003). Recombinant DNA techniques and in vitro aggregation assays can be employed to analyze the relationship of the sequence properties to aggregation. Fibril assembly of α-syn, Aβ, and tau proteins involves a conformational change from “random coil” to β-sheet structure (Glenner et al. 1974; Watson et al. 1998; Serpell et al. 2000; von Bergen et al. 2001).
Here, we have designed a novel algorithm to measure a derivative of β-strand propensity which we refer to as “β-strand contiguity” (β-SC) by a simple treatment of Chou and Fasman's secondary structure preference numbers (Chou and Fasman 1974a). This was expected to locate “fibrillogenic hotspots” within a protein's sequence. Specifically, peaks in the β-SC plots were found to correlate well the location of amyloid fibril cores in α-syn, Aβ, and tau (Wischik et al. 1988; Petkova et al. 2002; Heise et al. 2005). Although the calculations were not designed to predict the absolute rate of fibril assembly very likely they will have a significant bearing on the thermodynamics of fibril assembly. Furthermore, we suggest that the peaks of β-SC plots may represent good pharmacological targets for inhibitors of fibril assembly for α-syn, Aβ, and tau, with possible therapeutic consequences for neurodegeneration.
In the presence of phospholipids or surfactants, α-syn has also been found to undergo a significant change from “random coil” to a long amphipathic α-helical form, lying parallel to the surface of the phospholipid membrane bilayer or surfactant micelle (Eliezer et al. 2001; Jao et al. 2004). Our program, has been adapted to also measure α-helical amphipathicity (α-HA) by applying a calculation of the hydrophobic moment of a projected α-helix, similar to that used previously by Eisenberg et al. (1982). The α-HA plots correlate very well with experimental data for α-syn and β-syn.
Results
The program's algorithm, which can use any scale of amino acid properties such as secondary structure preference numbers or hydrophobicities, is named “SALSA” (simple algorithm for sliding averages). SALSA calculates an average β-strand propensity score of a peptide window using Chou and Fasman β-strand preference numbers (Chou and Fasman 1974a). The algorithm samples the full length of the protein's sequence by sliding a window along, one residue at a time. The x-y plots are a compilation of these scores which are plotted as a y-coordinate against the amino acid sequence which is along the x-axis. We refer to this novel measure of β-strand propensity as “β-strand contiguity” (β-SC).
SALSA β-strand contiguity
α-Synuclein
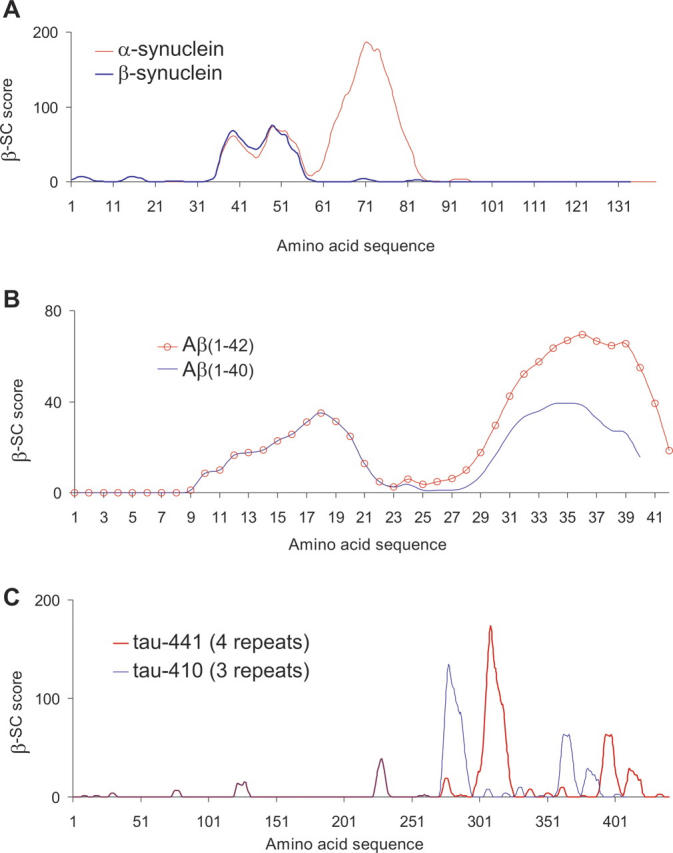
The β-SC plot for α-syn has three main peaks, spanning residues 32–89 (see Fig. 1A), with the dominant peak (III) covering residues 58–89.
Figure 1.

β-strand contiguity plots for the human protein sequences of (A) α-synuclein, (B) Aβ(1–40), and (C) tau-441.
Aβ(1–40)
The β-SC plot for Aβ(1–40) has two relatively small peaks (as compared with α-syn's prominent peak) which span residues 8–40 and are separated by a significant dip over residues 23–27 (Fig. 1B). The two peaks are comparable in size to one another.
Tau
In Figure 1C, the β-SC plot for the sequence of the longest isoform of tau with 441 amino acids (abbreviated to “tau-441”) is shown. The four largest peaks are labeled I-V. The most prominent peak (III) is comparable in size to α-syn's most prominent peak (III).
SALSA β-strand contiguity of homologous proteins
One of the most promising utilities of the SALSA β-SC algorithm is for making direct comparisons of different protein sequences. This is illustrated in the sections below in which the SALSA β-SC plot of α-syn is directly compared with that of β-syn. This is followed by a comparison of Aβ(1–42) with Aβ(1–40), and finally four-repeat tau is compared with three-repeat tau.
α-Synuclein vs. β-synuclein
The β-SC plot of β-syn is similar to that of α-syn up to and including peaks I and II (Fig. 2A). However, peak III is entirely absent from β-syn.
Figure 2.
Comparison of β-strand contiguity plots for human protein sequences of (A) α-synuclein (red) and β-synuclein (blue); (B) Aβ(1–42) (red circles) and Aβ(1–40) (blue); (C) four-repeat tau-441 (red) and three-repeat tau-410 (blue).
Aβ(1–40) vs. Aβ(1–42)
Both β-SC plots for Aβ(1–40) and Aβ(1–42) have two small peaks spanning residues 9–40 and 9–42, respectively. Both peaks are approximately equivalent in size for Aβ(1–40). However, in the case of Aβ(1–42), the carboxy-terminal peak (II) is larger (Fig. 2B).
Four-repeat tau vs. three-repeat tau
For all six isoforms of tau that are expressed in the human central nervous system, the β-SC plots are nearly identical. The only difference is in the size of the prominent peak (III), which is larger in isoforms with three-repeats. The absence of the extra repeat is responsible for the reduced size of the prominent peak in three-repeat tau (3R-tau) (Fig. 2C). Peak III spans residues 296–326 in four-repeat tau (4R-tau) (tau-441) or 272–296 for 3R-tau (tau-410), covering most of the fourth or third repeat of the microtubule binding region, respectively.
SALSA α-helical amphipathicity
α-Synuclein
The α-HA plot of α-syn produces one long continuous peak, covering ∼95 residues from the N-terminal end (Fig. 3A). Although the peak is uninterrupted, there is a distinctive dip at around residue 40. In Figure 3B, the location of the peak is indicated along a linear representation of the protein, immediately above the actual amino acid sequence. Below the sequence, we have highlighted one predicted and eight experimentally observed locations of α-helical structure.
Figure 3.

(A) α-Helical amphipathicity plot for the protein sequence of human α-synuclein. (B) A color-coded representation of the secondary structure over the amino-acid sequence is shown to illustrate α-helical regions for comparison with the α-HA plot. From the top, α-HA plot; the sequence-based prediction of Davidson et al. (1998); structural data of Eliezer et al. (2001); Bussell and Eliezer (2003); Chandra et al. (2003); Jao et al. (2004); Bisaglia et al. (2005); Bussell et al. (2005); Ulmer et al. (2005). Amphipathic α-helical regions (blue). Possible α-helical region predicted/visible dip (pale blue). Undefined break in α-helical structure/no SALSA α-HA peaks (white). Hairpin linker/turn (yellow). Extended/“random coil”/greater flexibility (light green).
α-Synuclein vs. β-synuclein
The α-HA plot of β-syn is shown in Figure 4, overlapping that of α-syn. The peaks in the plots over residues 1–50 are very similar between the two synucleins (as expected from their high sequence homology). Both plots display a similar dip at around residue 40. While α-syn's α-HA peak terminates at around residue 95, β-syn's peak terminates upstream of this at around residue 82.
Figure 4.

Comparison of α-helical amphipathicity plots for human α-synuclein (red circles) and β-synuclein (blue circles).
Discussion
SALSA β-strand contiguity algorithm
In order to examine the correlation of the amino acid sequence of α-syn, Aβ, and tau with their fibrillar forms, we have compared experimental data from the literature with the outputs of our algorithm. In the first of two parts, we show there to be a good correlation between experimental data on the location of the β-sheet core in preformed fibrils and peaks in the algorithm's graphical output (“β-SC plots”).
In the second part, we make direct comparisons of the β-SC plot for each protein with that of a similar protein and discuss the significance of the differences between these plots with observed fibrillogenicities and pathogenicities.
SALSA β-strand contiguity compared with structural data of β-sheet fibrils
SALSA β-strand contiguity (β-SC) samples every region of a protein's sequence for local β-strand propensity. Without incorporating computations of any other physicochemical property, the algorithm and its plotting tool show a surprisingly good correlation with published structures of amyloid and amyloid-like fibrils of α-syn, Aβ, and tau.
α-Synuclein
The location of SALSA β-SC peaks in α-syn (Fig. 1A) correlate well with the location of regions identified as forming β-sheet structure in fibrils, as deduced both from direct and indirect structural analyses.
Solid-state NMR experiments on amyloid-like fibrils formed from α-syn have shown that the β-sheet core extends from residue 22 to ∼105 (Heise et al. 2005). Indirect methods included hydrogen–deuterium exchange, which found the region ∼39–101 to be most protected in α-syn fibrils (Del Mar et al. 2005). Similarly, electron paramagnetic resonance of site-directed spin-labeled α-syn showed that, upon fibril assembly, intermolecular distances were reduced over the central residues from ∼34 –∼101. Thus, these ∼60–70 residues are implicated in the fibril core (Der-Sarkissian et al. 2003). Finally, proteinase K digestion experiments showed residues 31–109 to be resistant, implicating these 79 amino acids in the core of α-syn fibrils (Miake et al. 2002).
While peak III of the β-SC plot ends at residue 89, with another very small peak visible at residues 90–97, the experimental data find that the β-sheet core can extend to between ∼101 and 109. Although the significance of these discrepancies is presently unclear, we hypothesize that the β-SC plot may represent a statistical average of a heterogenous population of α-syn fibrils. The existence of structural heterogeneity in α-syn fibril populations has been demonstrated (Heise et al. 2005). It is further noted that in vitro aggregation assays using the 18-residue peptide, α-syn(61–78), have found it to be highly amyloidogenic, while the peptide, α-syn(79–95), was not (El-Agnaf et al. 1998a).
Another reason that the β-sheet core may extend beyond that predicted by the β-SC algorithm may be due to further stabilizing π–π interactions that could occur through the phenylalanine residue at position 94.
SALSA β-strand contiguity compared with structural data of β-sheet fibrils
Aβ(1–40)
The location of peaks in the β-SC plot of Aβ(1–40) correlates well with regions that have been shown to occupy the β-sheet core in amyloid fibrils of Aβ(1–40), as compared with experimental data from direct and indirect structural analyses.
Solid-state NMR has been used to produce high-resolution structural data for fibrils of Aβ(1–40) and has shown that residues 1–9 remain disordered, while residues 12–39 are predominantly β-sheet (Balbach et al. 2002). In another study, energy minimization modeling, constrained by experimental data (from NMR, EM, and fiber diffraction), concluded that the N-terminal region, approximately covering the first 10 amino acids, is disordered, while residues 12–24 and 30–40 adopt a β-sheet conformation and residues 25–29 contain a bend (Petkova et al. 2002). The β-SC plot only predicts the location of β-strands and is not designed to predict bends or other secondary structural motifs. However, it is noted that the location of this bend correlates well with the location of the dip between the two β-SC peaks. Other techniques, such as solution NMR, site-directed spin labeling, and limited proteolysis, have also been used to obtain structural information on Aβ(1–40) fibrils. In hydrogen–deuterium exchange measured by NMR of Aβ(1–40) fibrils, residues 1–15 and 37–40 were not protected and were therefore unlikely to be part of the β-sheet core, remaining unstructured instead (Whittemore et al. 2005). Residues 25 and 26 could also exchange backbone amide protons and were potentially part of a turn. Site-directed spin labeling of Aβ(1–40), as well as Aβ(1–42), showed that upon fibril assembly regions that remained highly mobile, and therefore not likely to form part of the β-sheet core, included the N-terminal region covering the first 10–11 amino acids, residues ∼23–29, and C-terminal residues from ∼39 (Torok et al. 2002). Experiments in which Aβ(1–40) fibrils had been subjected to limited proteolysis showed N-terminal residues, up to between ∼12 and 16, to be fully exposed. The remainder of the protein was protected from the solvent, implicating this region in the β-sheet core of the fibrils (Kheterpal et al. 2001). Some cleavage also occurred at Lys28–Gly29, but it was not considered to be sufficient evidence for increased accessibility of this bond. Another indirect structural assay is scanning proline mutagenesis (Williams et al. 2004). This works on the premise that if fibril assembly of Aβ(1–40) is insensitive to a particular proline mutation, then that residue is not likely to form part of the β-sheet core of the fibril. Regions insensitive to proline mutation included residues 1–14 and 37–40. Residues 22, 23, 29, and 30 were also insensitive to proline mutations, leading to the conclusion that these residues may occupy two turns between three β-strands. Collectively, these findings correlate well with β-SC peaks, except for observations that showed the C-terminal β-strand ending prior to residue 40 (Balbach et al. 2002; Torok et al. 2002; Williams et al. 2004).
There is currently no direct structural data available for Aβ(1–42) fibrils. However, quenched hydrogen–deuterium exchange NMR has recently been performed and has indicated that residues 18–26 and 31–42 may form the β-sheet core (Lührs et al. 2005). It has been suggested that β-sheets in Aβ(1–42) fibrils are C-terminally shifted from their location in Aβ(1–40) fibrils and also from the peaks of SALSA β-SC plots. This discrepancy may be a consequence of the fact that the β-SC algorithm does not make any predictions of tertiary or intraprotein folding associations. For example, the salt bridge between Asp23 and Lys28 may influence the location of the turn and thus the precise location of the β-strands within the resulting hairpin. However, we also consider that this discrepancy may reflect a degree of heterogeneity in the structure and assembly of Aβ fibrils, such that the precise location of β-strands will vary. This is further supported by results of site-directed spin labeling experiments with Aβ(1–42), which showed different β-strand positions (mentioned above) (Torok et al. 2002). We hypothesize that (as with α-syn) the location of peaks in β-SC plots represents a statistical average of heterogeneous fibril populations, rather than a rigid structural model. NMR data for the existence of structural heterogeneity or polymorphism in amyloid fibrils have previously been reported for Aβ(1–40) (Petkova et al. 2005).
SALSA β-strand contiguity compared with structural data of β-sheet fibrils
Tau
The minimal protease-resistant region of AD paired helical filaments was reported to be an ∼90–100 amino acid fragment, at residues ∼255–∼350, which is largely overlapping with the microtubule-binding repeat (MTBR) region (Wischik et al. 1988; Crowther et al. 1989; Jakes et al. 1991; Novak et al. 1993). The prominent peak in the β-SC plots for 3R-tau and 4R-tau, which is about 30 residues long, coincides with the center of this fragment. Electron paramagnetic spin resonance studies of tau assembly showed that, when fibrils had assembled, residues 301–320 were at the core of the fibril (Margittai and Langen 2004, 2006). Fibril assembly assays of full-length tau compared with a number of C-terminally truncated fragments demonstrated that the ability to aggregate only began to be impeded when the truncation included the C terminus from residue 321. Fibril assembly was drastically reduced by a truncation up to 314, and abolished altogether by a truncation up to 292 (Abraha et al. 2000). Therefore, while protease sensitivity experiments implicate a large region within the C terminus, spin-labeling experiments of full-length tau and in vitro aggregation assays with C-terminally truncated tau implicate a smaller region, the location of which appears to correlate more precisely with the location of the prominent peak (III) in the β-SC plot.
SALSA β-strand contiguity of similar proteins and relative pathogenicities
The algorithm allows direct comparison of different protein sequences and has been used to compare α-syn with β-syn, Aβ(1–42) with Aβ(1–40), and three-repeat tau with four-repeat tau. In the following sections, we discuss how the relative differences of their β-SC plots correlate with experimental data, as well as with observed pathogenic propensities. Each pairing of proteins is highly homologous to one another and, as a consequence, their β-SC plots display near identical features (i.e., most peaks are in the same places and are the same sizes). However, in each case, we find that, where the sequences do differ, it is specifically the size of the prominent β-SC peak that differs. Furthermore, the relative differences appear to correlate well with the relative fibrillogenicities in vitro and pathogenicities in vivo.
α-Synuclein vs. β-synuclein
The β-SC plots of α-syn and β-syn overlap for the N-terminal regions covering peaks I and II (Fig. 2A). However, peak III is absent from β-syn, which coincides with the difference at residues 71 and 72 and, most notably, the absence of the β-strand-favorable amino acids found in α-syn at residues 73–83. Peak III, which is the largest of the three peaks, locates to the region reported to dominate the fibrillogenic capacity of α-syn (Han et al. 1995; Iwai et al. 1995; El-Agnaf et al. 1998a,b; Bodles et al. 2000, 2001; Giasson et al. 2001; Du et al. 2003). β-Syn is reproducibly nonfibrillogenic (Goedert 2001) and is absent from Lewy bodies (Spillantini et al. 1997). Thus far, no mutations in β-syn have been linked to familial PD. The difference between the two β-SC plots complements the difference between the fibrillogenic properties of α- and β-syn and their relationship to PD.
SALSA β-strand contiguity of similar proteins and relative pathogenicities
Aβ(1–40) vs. Aβ(1–42)
β-SC plots for Aβ(1–40) and Aβ(1–42) have two small peaks spanning residues 9–40 and 9–42, respectively. Both peaks are approximately equivalent in size for Aβ(1–40). However, in the case of Aβ(1–42), the C-terminal peak (II) is larger (Fig. 2B).
Aβ(1–42) is more fibrillogenic than Aβ(1–40) in vitro (Jarrett et al. 1993; Murakami et al. 2002), which correlates well with the comparison of their β-SC plots. Thus, it appears that the addition of isoleucine and alanine at the carboxyl terminus of Aβ(1–42) enhances the fibrillogenicity of the surrounding residues. In agreement with this, it is noticed that the highest MβP for any peptide window in Aβ(1–42) (within the range of 4–20 residues) is scored by 38VVIA42. The relationship of fibrillogenicity to disease is supported by the observation that Aβ(1–42) is more toxic than Aβ(1–40) in cell culture (Davis-Salinas et al. 1995; Murakami et al. 2002). Also, the increased ratio of Aβ(1–42) to Aβ(1–40) has been associated with an increased risk for AD (Younkin 1995), although an increase in levels of either peptide is a risk factor in itself (Gregory and Halliday 2005). In neuropathological studies, cerebrovascular deposits were found to have a higher ratio of Aβ(1–42) to Aβ(1–40) (Roher et al. 1993), as well as a higher ratio of Aβ(1–40) to Aβ(1–42) (Joachim et al. 1988; Prelli et al. 1988; Suzuki et al. 1994; Alonzo et al. 1998; McCarron et al. 2000; Fryer et al. 2003; Ingelsson et al. 2004).
Therefore, the intrinsic fibrillogenicity of these two peptides correlates with the propensity for fibril assembly in vitro, which may correlate with in vivo aggregation and ultimately with the age-of-onset or severity of disease. As with the synucleins in the previous section, a strong argument can be made for a direct relationship between amino acid sequence, fibrillogenicity, and the progression of a sporadic neurodegenerative condition. We suggest, therefore, that the β-SC algorithm can provide insight into fibril assembly of Aβ in AD.
SALSA β-strand contiguity of similar proteins and relative pathogenicities
Four-repeat tau vs. three-repeat tau
An increased ratio of 4R-tau to 3R-tau has been associated with cases of frontotemporal dementia and Parkinsonism linked to chromosome 17 (FTDP-17) (Clark et al. 1998; Hong et al. 1998; Hutton et al. 1998; Spillantini et al. 1998b; Goedert et al. 1999; Hasegawa et al. 1999; Spillantini et al. 2000; Iseki et al. 2001; Miyamoto et al. 2001; Grover et al. 2002; Yoshida et al. 2002; Connell et al. 2005). About half of the known mutations in tau influence the splicing of tau pre-mRNA, mostly resulting in a higher ratio of 4R- to 3R-tau, but occasionally resulting in a lower ratio (Goedert and Spillantini 2006; van Swieten et al. 2007). A complete understanding of how this ratio influences the onset of a tauopathy is currently lacking. In some tauopathies, tau inclusions are composed mainly of either 4R-tau or 3R-tau (Buée-Scherrer et al. 1996; Bronner et al. 2005). The β-SC plots suggest that in both proteins the fibrillogenic propensities are concentrated in peak III. Comparison of these peaks suggests that 4R-tau may have a higher propensity for fibril assembly than 3R-tau.
SALSA β-SC plots are not relevant for globular proteins
Linding and colleagues have shown that the “β-aggregation” tendency of globular proteins is almost threefold higher than that of natively unfolded proteins (Linding et al. 2004). This was measured using their algorithm (called TANGO) which identifies aggregation-nucleating regions in a protein. It is to be expected that the sequences of globular proteins, which have a higher proportion of hydrophobic residues (and β-strand-favorable residues) than natively unfolded proteins, will score higher. It is also the case that the SALSA β-SC of globular proteins will be significantly higher, as the algorithm will find more peptide windows with higher MβP scores in the sequences of globular proteins than in natively unfolded proteins. Thus, we emphasize that SALSA β-SC is designed to calculate the propensity for fibril assembly of natively unfolded proteins only. SALSA β-SC does not calculate the propensity for nonfibrillar forms of aggregation either.
Differences between SALSA β-SC and other aggregation algorithms
Several aggregation algorithms have been produced by other research groups, often including a graphical format (Fernandez-Escamilla et al. 2004; Linding et al. 2004; Sánchez de Groot et al. 2005; Tartaglia et al. 2005; Thompson et al. 2006). Such outputs highlight regions in protein sequences with higher thermodynamic propensities for aggregation and are often correlated with the aggregation rate in vitro. In at least one of these algorithms, peaks of the graphs indicate where in the sequence a protein's aggregation propensity is most likely to be sensitive to mutations (Pawar et al. 2005). The β-SC plots are unique in that the algorithm employs only a single physicochemical property of amino acids (β-strand propensity). Thus, these plots are not intended to predict the Rate of protein aggregation. The experimentally observed rates of fibril assembly by recombinant human α-syn, as well as α-syn, β-syn, γ1-syn, and γ2-syn from Fugu rubripes, have been found to correlate with other physicochemical properties, including electrostatic charge repulsion, hydrophilicity, and secondary structural propensities (Yoshida et al. 2006). Similar correlations have also been observed for a number of other proteins (Chiti et al. 2002, 2003). SALSA measures an intrinsic structural propensity and is therefore insensitive to the environment (i.e., pH, temperature, salt concentrations). Extrinsic factors are taken into account by some of the algorithms that predict aggregation rates and aggregation propensities (Fernandez-Escamilla et al. 2004; Pawar et al. 2005; Tartaglia et al. 2005). Although we do observe some degree of overlap with the graphical outputs of these algorithms, SALSA β-SC is the only algorithm that is specialized to amyloid fibrillar aggregation and not to other forms of protein aggregation, and this may be part of the reason for the difference in the various outputs.
Glycine, glutamine, asparagine, low sequence complexity, and aromatic residues
A potential source of inaccuracy in the correlation of β-SC plots with β-sheet fibrils is the use of Chou and Fasman (1974a) β-strand preference numbers. It is very likely that there will be some differences between the propensity for β-strand structure in native proteins (from which the Chou and Fasman [1974a] preference numbers were derived) and in amyloid fibrils. An example of this is for the residue, glycine, which has a very low Chou and Fasman (1974a) β-strand preference number but, as demonstrated by spider silk proteins, is readily able to form amyloid-like β-sheet assemblies (Kenney et al. 2002). Similarly, glutamine and asparagine, which are also found to form β-sheet assemblies, are not predicted to do so by SALSA β-SC (Nelson et al. 2005). We hypothesize that our algorithm might be adapted to account for these types of self-assembly by incorporating a calculation for the degree of sequence complexity (Kenney et al. 2002). Another example is the potential for π–π stacking by certain aromatic residue side chains that enhance β-sheet propensity to a greater extent when occurring in the context of amyloid fibril structure than in native structure. Therefore, this might not be adequately quantified by the Chou and Fasman (1974a) numbers alone (Gazit 2002; Makin et al. 2005).
SALSA α-helical amphipathicity compared with structural data of membrane-associated α-synuclein
α-Synuclein
Membrane binding by α-syn coincides with a conformational change to an α-helical-dominated form. Edmundson helical wheels (Schiffer and Edmundson 1967) of canary α-syn show the α-helical amphipathic distribution of amino acids resides within the ∼100 amino-terminal residues (Davidson et al. 1998). By alignment with human α-syn (which has very few differences from canary α-syn), this corresponds to amino acids 1–93. By the method of Segrest et al. (1992), three potential helix breakers were identified within this region, thus predicting the formation of five separate α-helices at residues 1–15, 17–37, 39–48, 50–60, and 61–93.
The structure of the α-helical region has been studied by solution NMR, using the lipid mimetic, sodium dodecyl sulphate (SDS) (Eliezer et al. 2001). In most studies, only a single break in the α-helical region has been found, either at residue 40 (Bisaglia et al. 2005) or between residues 42 and 44 (Bussell and Eliezer 2003; Chandra et al. 2003). Some backbone flexibility has also been reported for residues 1–8, 34, and 80–85 (Bussell et al. 2005). A site-directed spin-labeling study of α-syn in small unilamellar vesicles supported the existence of a single, long α-helix without any breaks (Jao et al. 2004). A titration of SDS to α-syn found that residues 3–37 and 45–92 became α-helical (Ulmer et al. 2005). In all studies, the C-terminal end of α-syn (∼residues 100–140) remained unfolded.
Here, we show that, by comparison with experimental data, the α-HA plot of α-syn can map the α-helical regions of α-syn very well (Fig. 3). In Figure 3B, the location of the α-HA peaks is annotated along the amino acid sequence and compared with similar, annotated representations of one sequence-based prediction and eight experimentally observed locations of α-helical structure (as described above). Furthermore, the position of a break in the α-helix appears to correlate well with the position of a distinctive dip in the α-HA peak. We hypothesize that this may be indicative, not necessarily of the precise location of a permanent break, but of a region with a higher propensity for a break, such that, under certain conditions or constraints, the α-helix may remain unbroken, break, or fluctuate between the two states. This hypothesized variability is supported by the fact that different research groups have located the break to slightly different positions.
SALSA α-helical amphipathicity
α-Synuclein vs. β-synuclein
The residue-by-residue conformational data set for β-syn in the presence of SDS micelles has recently been published (in the form NMR Cα 2° shifts) (Sung and Eliezer 2006). An α-helical conformation was found covering residues ∼1–85. This correlates well with the α-HA plot of β-syn. The α-helical structure was reported to be interrupted at around residues 43 and 44, which correlates with the location of a dip in the α-HA peak of β-syn and coincides with the position of the dip in the α-HA peak of α-syn.
The good correlation of calculated α-HA with observed α-helical structure demonstrates that the location of the membrane-associated α-helical region can be deduced from the primary structure alone. Application of the algorithm allows the direct comparison of different sequences, as has been demonstrated by comparison of α-syn with β-syn. The algorithm uses a similar calculation of hydrophobic moment as that used by another algorithm (called “MOMENT”; http://nihserver.mbi.ucla.edu/moment/), but produces an output that compares more favorably with experimentally observed data. This is likely to be due to the method by which SALSA samples and collates scores from a larger number of peptide windows.
SALSA α-helical amphipathicity algorithm
SALSA α-helical amphipathicity (α-HA) uses the same mechanism as SALSA β-SC for sampling and collating data into a plot, but instead of using β-strand propensity scores, the algorithm measures the hydrophobic moment of a protein's sequence. A number of structural studies have been performed on α-syn in the context of phospholipid bilayers or surfactant micelles (Eliezer et al. 2001; Bussell and Eliezer 2003; Chandra et al. 2003; Jao et al. 2004; Bisaglia et al. 2005; Bussell et al. 2005; Ulmer et al. 2005) and these have been directly compared with SALSA α-HA plots. As with the comparisons of β-SC plots with experimentally observed β-sheet fibrils, a high level of correlation is seen between α-HA plots and experimental data of α-syn in its α-helical form. This provides us with a powerful bioinformatic tool with which to further probe the conformational character and function of α-syn.
Conclusion
The SALSA algorithm displays a highly favorable comparison between latent β-strand propensity in the form of β-SC peaks and the observed location of β-sheet structure in fibrillar forms of α-syn, Aβ, and tau. Furthermore, the algorithm has confirmed there to be a positive correlation between a derivative of relative β-strand propensities, relative fibrillogenicities, and pathogenic propensities. Thus, we conclude that SALSA provides new and improved insights into the sequence correlates of fibrillogenic propensities for the three proteins that are pertinent for the most common neurodegenerative conditions in humans. The data support the concept that delaying β-sheet formation by these three proteins may also delay the pathogenic consequences of fibril assembly and therefore represent part of a therapeutically beneficial strategy. The algorithm will allow us to test this hypothesis further, both in vitro and in neurodegenerative disease models.
SALSA can map latent propensities for α-helical structure as well. This is presented in the form of α-HA plots and confirms the role of hydrophobicity in the formation of membrane-associated α-helical structure in synucleins. This algorithm will also allow us to test the role of this property in α-synucleinopathy models.
Materials and Methods
Algorithm development
Chou and Fasman preference numbers
Chou and Fasman (1974b) secondary structural preference numbers have simply been used here as a scale. The SALSA algorithm does not apply any of the rules for secondary structure prediction as set out by Chou and Fasman, amongst others (Chou and Fasman 1974b, 1978; Williams et al. 1987). Therefore, it represents an alternative application of the numbers rather than an improvement of the original method.
Calculating SALSA β-strand contiguity
For any selected amino acid property, the algorithm calculates the mean score of that property for all the peptide windows within a polypeptide's sequence. This can include a range of peptide window sizes which will be overlapping in the sequence. In the case of β-strand contiguity (β-SC), a “mean β-strand propensity” (MβP) score is first calculated for each peptide window, according to Equation 1:
where Pβ, Pα, and Pt are the Chou and Fasman β-strand, α-helix, and reverse turn preference numbers, respectively (Chou and Fasman 1974a). The sums of the Pβ, Pα, or Pt preference numbers for every residue in a peptide window are abbreviated to ∑ Pβ, ∑ Pα, or ∑ Pt, respectively.
In the case of β-SC, SALSA slides a four-residue window along the entire sequence, one residue at a time, calculating the MβP score for each. Thus, in the case of human α-synuclein which has 140 residues, there are a total of 137 four-residue windows, each with its own MβP score. SALSA then repeats this calculation using a five-residue window, then a six-, seven-, eight-residue and so on up to and including a 20-residue window.
Selecting a range of peptide window sizes for β-strand contiguity plots
The peptide window size range for β-SC plots was selected in the context of fibril assembly of unfolded proteins. It has been found that fibrils can be formed by peptides as short as four residues in length (Reches et al. 2002; Tjernberg et al. 2002). Therefore, peptide window sizes were selected to range from 4 to 20 residues. This was also based on the hypothesis that the propensity for any 4-mer, 5-mer, 6-mer, 7-mer, etc., to form β-strands will be directly enhanced by the propensity of neighboring residues, potentially irrespective of whether they form part of the final β-sheet. The selection of a size range of 4–20 residues is further supported by the observation that, while β-strands in globular proteins are on average 5.3 residues in length, the majority tends to have a range of 2–10 residues and can be as long as 20 residues. This was based on an analysis of 320 nonhomologous protein chains (R. Laskowski, pers. comm.).
Deriving a minimum threshold score for β-strand contiguity plots
Thus, SALSA β-SC contiguity samples every possible window for 17 different window sizes (4–20). In the case of α-syn, this produces a data set of 2193 windows, each with its own MβP score. A β-SC plot of α-syn that is constructed using the scores from all of these windows is relatively featureless (see Supplemental Fig. 1A). Therefore, in order to produce meaningful plots, the data set needs to be filtered.
One way of doing this is to restrict the data set to a limited number of windows, i.e., those with the highest MβP scores. It was found that plots, similar to those presented in Figure 1, could be constructed using only 400 windows. The windows selected were those with the highest MβP scores (and therefore the process of filtering the data set simply involves discarding the remaining 1793 windows). Another method to filter the data set is to discard windows that have MβP scores lower than some minimum threshold score. This approach was preferred to the former, as it also allows for the direct comparison of different protein sequences (such as those presented in Fig. 2).
The requirement for filtering the data set and the methods used to perform this have provided the algorithm with a crucial advantage, namely that the plots can, to a certain extent, be calibrated according to empirical observations. For β-SC plots, we used a comparison of plots produced by the sequences of human α- and β-syn to arrive at a minimum threshold score of 1.2. This was the lowest threshold score capable of producing a good overlap between peaks of the two sequences over residues 30–60, and this threshold has been used to produce all β-SC plots presented in this paper.
Constructing SALSA β-strand contiguity plots
In all cases, SALSA plots the property in question (such as β-SC) on the y-axis, against the amino acid sequence, which is along the x-axis. For each residue along the sequence, the value for the y-coordinate is produced by adding together the MβP scores from every window that contains that particular residue. As described in the section above, this only follows a filtering step and, as a result, a residue's score may be as low as zero if all possible windows it forms a part of have MβP scores that are lower than the minimum threshold score. This is explicitly illustrated by the worked example shown in Figure 5. It follows therefore that residues which are located amidst several β-strand-favorable residues will accumulate a high score, added together from numerous and often overlapping windows, while those located amidst β-strand-unfavorable residues will tend to produce a low sum of scores, even if an individual residue has a high propensity for β-strand.
Figure 5.

A worked example of SALSA β-strand contiguity for a 10-residue peptide window, MDVFMKGLSK. Chou and Fasman (1974b) secondary structure preference numbers are listed below the sequence. A few of the windows, in order of those with the highest MβP scores, are shown (A). The MβP scores from those windows that have scored higher than the minimum threshold score of 1.2 are summed by every residue in those windows (B). These summed values are the y-coordinates which are plotted against the amino acid sequence (on the x-axis) in order to produce a SALSA β-SC plot.
A worked example of SALSA β-strand contiguity and its plotting tool
In Figure 5, SALSA and its plotting tool are illustrated with a calculation of the β-SC for a 10-residue peptide sequence. For this peptide, there are only 28 possible windows within the range of 4–20 residues and these are placed in order of their MβP scores (see also screenshot in Supplemental Fig. 1B). In Figure 5A, the calculation of MβP for the highest scoring window (VFMK) is shown in full. The Chou and Fasman (1974b) secondary structure preference numbers (from which the MβPs are calculated) are shown below the sequence. The MβPs for the other seven windows are also listed.
In Figure 5B, the calculation for the plotting tool is illustrated. Only the top five windows have MβP scores greater than the threshold of 1.2 and therefore only these window scores are included in the subsequent calculation and the plot. The value for the y-axis in the β-SC plots comes from the sum of the MβPs for each residue that is present in the top five windows. Each window's MβP score is allocated to every residue in that window equally—not to the middle residue alone.
Calculating SALSA α-helical amphipathicity
SALSA α-helical amphipathicity is calculated as the net hydrophobicity of a peptide window as though in an α-helical conformation, which is illustrated by a Schiffer and Edmundson α-helical wheel projection (Schiffer and Edmundson 1967). The net hydrophobicity is calculated by the difference of their vectors (which is similar to the measurement of the hydrophobic moment as defined by Eisenberg and colleagues) and then divided by the number of residues in that window (see Equation 2; Eisenberg et al. 1982, 1984). We refer to this as the “mean α-helical amphipathicity” (Mα-HA):
Where h is the Kyte and Doolittle hydropathy score for a residue, n is the position of the residue in the fragment (n = 0 for first residue), θ is the angle subtended by each progressive residue, as though projected onto an α-helical wheel (this is ∼100°), and N is the number of residues in the peptide window. For the plots presented here, we have used Kyte and Doolittle hydrophobicity numbers (Kyte and Doolittle 1982).
In Figure 6, a worked example is presented using a Schiffer and Edmundson α-helical wheel projection to illustrate how Mα-HA is calculated for one 11-amino acid peptide window (MDVFMKGLSKA). The first residue in the wheel is positioned at 0° and the angle subtended is 98°. Residues at 90°–270° from the first residue should therefore have negative values of those at 270°–90°. The cosine function accounts for this.
Figure 6.

A Schiffer and Edmundson α-helical wheel projection illustrates the calculation of the mean α-helical amphipathicity for MDVFMKGLSKA. (The wheel projection uses an angle of 98° according to NMR [Bussell et al. 2005] and SDSL data [Jao et al. 2004].)
Constructing SALSA α-helical amphipathicity plots
The plotting tool for α-helical amphipathicity uses the same strategy as that used to produce β-SC plots (which was illustrated in Fig. 5). Thus, a sliding peptide window calculates a mean score for all possible windows within a selected range of window sizes. In this case, the mean score is the mean α-helical amphipathicity (Mα-HA), rather than mean β-strand propensity (MβP). Once again, the plotting tool filters the large data set by discarding windows with scores below a minimum threshold. The y-coordinate for each residue comes from the sum of Mα-HA scores from every window in which that residue is found. Each window's Mα-HA score is allocated to every residue in that window equally—not to the middle residue only.
Selecting a range of peptide window sizes for α-helical plots
In globular proteins, the average length of α-helices is about 14 residues, ranging between 9 and 37 residues (Kumar and Bansal 1998). The α-helical regions in synucleins are encoded by a varying number of repeats which are in multiples of 11 amino acids (with five repeats in β-syn and seven in α-syn) (Jao et al. 2004). This has been experimentally observed to constitute three turns of an α-helix in a structure described as an 11/3 α-helix (Jao et al. 2004; Bussell et al. 2005). Therefore, a range of peptide window sizes was selected to start with 11 residues and to include all windows up to and including 33 residues. This may be particularly relevant to synucleins, because the most prominent feature of their α-helices is that they are continuously amphipathic over a large number of residues (compared to α-helices found in globular proteins) and, despite the fact that the 11-mers are not always contiguous, the α-helix does not appear to be disrupted by this. Thus, “α-helical contiguity” might also be a relevant description.
Deriving a minimum threshold score for α-helical amphipathicity plots
The minimum threshold score for α-helical amphipathicity was determined empirically. This was based on the lowest minimum threshold score that could produce the best correlation between the integrals of the α-helical amphipathicity plots with an observed conformational change from “random coil” in phosphate buffer to α-helical in the presence of 10 mM SDS (data not shown). The proteins used for this were human α-syn, human β-syn, and four other natively unfolded proteins. These included a late embryogenesis abundant (LEA) protein from Aphelenchus avenae (called “AavLEA1”), an LEA protein from wheat (called “Em”), human tau-441, and colicin N T-domain. (Purified recombinant AavLEA1 and Em were kindly provided by Dr. A. Tunnacliffe, University of Cambridge, United Kingdom. Purified recombinant colicin N T-domain was kindly provided by Dr. J. Lakey, University of Newcastle upon Tyne, United Kingdom.)
The best correlation was produced using a minimum threshold score of 0.8. SALSA is implemented in Java (Sun Microsystems) with a modern graphical user interface (see screenshots in Supplemental Fig. 1). To obtain the algorithm, please contact Louise Serpell. (l.c.serpell@sussex.ac.uk).
Acknowledgments
We thank Dr. Michael Wise and Dr. Cyrus Chothia for helpful comments. S.Z. is an Alzheimer's Research Trust Fellow, O.S.M. is supported by the UK Biotechnology and Biological Sciences Research Council, and L.C.S. by the Wellcome Trust. Part of this work was funded by the UK Medical Research Council.
Footnotes
Reprint requests to: Shahin Zibaee, MRC Laboratory of Molecular Biology, Hills Road, Cambridge CB2 2QH, United Kingdom; e-mail: shahin@mrc-lmb.cam.ac.uk; fax: +44 1223 402 310; or Louise C. Serpell, Department of Biochemistry, School of Life Sciences, University of Sussex, Falmer, Brighton BN1 9QG, United Kingdom; e-mail: l.c.serpell@sussex.ac.uk; fax: +44 1273 678 433.
Article and publication are at http://www.proteinscience.org/cgi/doi/10.1110/ps.062624507.
Supplemental material: see www.proteinscience.org
References
- Abraha A., Ghoshal, N., Gamblin, T.C., Cryns, V., Berry, R.W., Kuret, J., and Binder, L.I. 2000. C-terminal inhibition of τ assembly in vitro and in Alzheimer's disease. J. Cell Sci. 113: 3737–3745. [DOI] [PubMed] [Google Scholar]
- Alonzo N.C., Hyman, B.T., Rebeck, G.W., and Greenberg, S.M. 1998. Progression of cerebral amyloid angiopathy: Accumulation of amyloid-β40 in affected vessels. J. Neuropathol. Exp. Neurol. 57: 353–359. [DOI] [PubMed] [Google Scholar]
- Alzheimer A. 1907. Über eine eigenartige Erkrankung der Hirnrinde. Allg. Z. Psychiatr. 64: 146–148. [Google Scholar]
- Baba M., Nakajo, S., Tu, P.H., Tomita, T., Nakaya, K., Lee, V.M., Trojanowski, J.Q., and Iwatsubo, T. 1998. Aggregation of α-synuclein in Lewy bodies of sporadic Parkinson's disease and dementia with Lewy bodies. Am. J. Pathol. 152: 879–884. [PMC free article] [PubMed] [Google Scholar]
- Balbach J.J., Petkova, A.T., Oyler, N.A., Antzutkin, O.N., Gordon, D.J., Meredith, S.C., and Tycko, R. 2002. Supramolecular structure in full-length Alzheimer's β-amyloid fibrils: Evidence for a parallel β-sheet organization from solid-state nuclear magnetic resonance. Biophys. J. 83: 1205–1216. [DOI] [PMC free article] [PubMed] [Google Scholar]
- Berriman J., Serpell, L.C., Oberg, K.A., Fink, A.L., Goedert, M., and Crowther, R.A. 2003. τ filaments from human brain and from in vitro assembly of recombinant protein show cross-β structure. Proc. Natl. Acad. Sci. 100: 9034–9038. [DOI] [PMC free article] [PubMed] [Google Scholar]
- Bisaglia M., Tessari, I., Pinato, L., Bellanda, M., Giraudo, S., Fasano, M., Bergantino, E., Bubacco, L., and Mammi, S. 2005. A topological model of the interaction between α-synuclein and sodium dodecyl sulfate micelles. Biochemistry 44: 329–339. [DOI] [PubMed] [Google Scholar]
- Bodles A.M., Guthrie, D.J., Harriott, P., Campbell, P., and Irvine, G.B. 2000. Toxicity of non-Aβ component of Alzheimer's disease amyloid, and N-terminal fragments thereof, correlates to formation of β-sheet structure and fibrils. Eur. J. Biochem. 267: 2186–2194. [DOI] [PubMed] [Google Scholar]
- Bodles A.M., Guthrie, D.J., Greer, B., and Irvine, G.B. 2001. Identification of the region of non-Aβ component (NAC) of Alzheimer's disease amyloid responsible for its aggregation and toxicity. J. Neurochem. 78: 384–395. [DOI] [PubMed] [Google Scholar]
- Booth D.R., Sunde, M., Bellotti, V., Robinson, C.V., Hutchinson, W.L., Fraser, P.E., Hawkins, P.N., Dobson, C.M., Radford, S.E., Blake, C.C., et al. 1997. Instability, unfolding and aggregation of human lysozyme variants underlying amyloid fibrillogenesis. Nature 385: 787–793. [DOI] [PubMed] [Google Scholar]
- Brion J.P., Passareiro, H., Nunez, J., and Flament-Durand, J. 1985. Mise en évidence immunologique de la protéine τ au niveau des lésions de dégénérescence neurofibrillaire de la maladie d'Alzheimer. Arch. Biol. (Bruxelles) 95: 229–235. [Google Scholar]
- Bronner I.F., ter Meulen, B.C., Azmani, A., Severijnen, L.A., Willemsen, R., Kamphorst, W., Ravid, R., Heutink, P., and van Swieten, J.C. 2005. Hereditary Pick's disease with the G272V τ mutation shows predominant three-repeat τ pathology. Brain 128: 2645–2653. [DOI] [PubMed] [Google Scholar]
- Buée-Scherrer V., Hof, P.R., Buée, L., Leveugle, B., Vermersch, P., Perl, D.P., Olanow, C.W., and Delacourte, A. 1996. Hyperphosphorylated τ proteins differentiate corticobasal degeneration and Pick's disease. Acta Neuropathol. (Berl.) 91: 351–359. [DOI] [PubMed] [Google Scholar]
- Bussell R. and Eliezer, D. 2003. A structural and functional role for 11-mer repeats in α-synuclein and other exchangeable lipid binding proteins. J. Mol. Biol. 329: 763–778. [DOI] [PubMed] [Google Scholar]
- Bussell R., Ramlall, T.F., and Eliezer, D. 2005. Helix periodicity, topology, and dynamics of membrane-associated α-synuclein. Protein Sci. 14: 862–872. [DOI] [PMC free article] [PubMed] [Google Scholar]
- Chandra S., Chen, X., Rizo, J., Jahn, R., and Sudhof, T.C. 2003. A broken α-helix in folded α-synuclein. J. Biol. Chem. 278: 15313–15318. [DOI] [PubMed] [Google Scholar]
- Chiti F., Taddei, N., Baroni, F., Capanni, C., Stefani, M., Ramponi, G., and Dobson, C.M. 2002. Kinetic partitioning of protein folding and aggregation. Nat. Struct. Biol. 9: 137–143. [DOI] [PubMed] [Google Scholar]
- Chiti F., Stefani, M., Taddei, N., Ramponi, G., and Dobson, C.M. 2003. Rationalization of the effects of mutations on peptide and protein aggregation rates. Nature 424: 805–808. [DOI] [PubMed] [Google Scholar]
- Chou P.Y. and Fasman, G.D. 1974a. Conformational parameters for amino acids in helical, β-sheet, and random coil regions calculated from proteins. Biochemistry 13: 211–222. [DOI] [PubMed] [Google Scholar]
- Chou P.Y. and Fasman, G.D. 1974b. Prediction of protein conformation. Biochemistry 13: 222–245. [DOI] [PubMed] [Google Scholar]
- Chou P.Y. and Fasman, G.D. 1978. Prediction of the secondary structure of proteins from their amino acid sequence. Adv. Enzymol. Relat. Areas Mol. Biol. 47: 45–148. [DOI] [PubMed] [Google Scholar]
- Clark L.N., Poorkaj, P., Wszolek, Z., Geschwind, D.H., Nasreddine, Z.S., Miller, B., Li, D., Payami, H., Awert, F., Markopoulou, K., et al. 1998. Pathogenic implications of mutations in the τ gene in pallido-ponto-nigral degeneration and related neurodegenerative disorders linked to chromosome 17. Proc. Natl. Acad. Sci. 95: 13103–13107. [DOI] [PMC free article] [PubMed] [Google Scholar]
- Colon W. and Kelly, J.W. 1991. Transthyretin acid induced denaturation is required for amyloid fibril formation in vitro. In Applications of enzyme biotechnology (eds. J.W. Kelly and T.O. Baldwin), pp. 99–108. Springer, New York.
- Connell J.W., Rodriguez-Martin, T., Gibb, G.M., Kahn, N.M., Grierson, A.J., Hanger, D.P., Revesz, T., Lantos, P.L., Anderton, B.H., and Gallo, J.M. 2005. Quantitative analysis of τ isoform transcripts in sporadic τ opathies. Brain Res. Mol. Brain Res. 137: 104–109. [DOI] [PubMed] [Google Scholar]
- Crowther T., Goedert, M., and Wischik, C.M. 1989. The repeat region of microtubule-associated protein τ forms part of the core of the paired helical filament of Alzheimer's disease. Ann. Med. 21: 127–132. [DOI] [PubMed] [Google Scholar]
- Davidson W.S., Jonas, A., Clayton, D.F., and George, J.M. 1998. Stabilization of α-synuclein secondary structure upon binding to synthetic membranes. J. Biol. Chem. 273: 9443–9449. [DOI] [PubMed] [Google Scholar]
- Davis-Salinas J., Saporito-Irwin, S.M., Cotman, C.W., and Van Nostrand, W.E. 1995. Amyloid β-protein induces its own production in cultured degenerating cerebrovascular smooth muscle cells. J. Neurochem. 65: 931–934. [DOI] [PubMed] [Google Scholar]
- Del Mar C., Greenbaum, E.A., Mayne, L., Englander, S.W., and Woods Jr, V.L. 2005. Structure and properties of α-synuclein and other amyloids determined at the amino acid level. Proc. Natl. Acad. Sci. 102: 15477–15482. [DOI] [PMC free article] [PubMed] [Google Scholar]
- Der-Sarkissian A., Jao, C.C., Chen, J., and Langen, R. 2003. Structural organization of α-synuclein fibrils studied by site-directed spin labeling. J. Biol. Chem. 278: 37530–37535. [DOI] [PubMed] [Google Scholar]
- Du H.N., Tang, L., Luo, X.Y., Li, H.T., Hu, J., Zhou, J.W., and Hu, H.Y. 2003. A peptide motif consisting of glycine, alanine, and valine is required for the fibrillization and cytotoxicity of human α-synuclein. Biochemistry 42: 8870–8878. [DOI] [PubMed] [Google Scholar]
- Eanes E.D. and Glenner, G.G. 1968. X-ray diffraction studies on amyloid filaments. J. Histochem. Cytochem. 16: 673–677. [DOI] [PubMed] [Google Scholar]
- Eisenberg D., Weiss, R.M., and Terwilliger, T.C. 1982. The helical hydrophobic moment: A measure of the amphiphilicity of a helix. Nature 299: 371–374. [DOI] [PubMed] [Google Scholar]
- Eisenberg D., Schwarz, E., Komaromy, M., and Wall, R. 1984. Analysis of membrane and surface protein sequences with the hydrophobic moment plot. J. Mol. Biol. 179: 125–142. [DOI] [PubMed] [Google Scholar]
- El-Agnaf O.M., Bodles, A.M., Guthrie, D.J., Harriott, P., and Irvine, G.B. 1998a. The N-terminal region of non-Aβ component of Alzheimer's disease amyloid is responsible for its tendency to assume β-sheet and aggregate to form fibrils. Eur. J. Biochem. 258: 157–163. [DOI] [PubMed] [Google Scholar]
- El-Agnaf O.M., Jakes, R., Curran, M.D., Middleton, D., Ingenito, R., Bianchi, E., Pessi, A., Neill, D., and Wallace, A. 1998b. Aggregates from mutant and wild-type α-synuclein proteins and NAC peptide induce apoptotic cell death in human neuroblastoma cells by formation of β-sheet and amyloid-like filaments. FEBS Lett. 440: 71–75. [DOI] [PubMed] [Google Scholar]
- Eliezer D., Kutluay, E., Bussell Jr, R., and Browne, G. 2001. Conformational properties of α-synuclein in its free and lipid-associated states. J. Mol. Biol. 307: 1061–1073. [DOI] [PubMed] [Google Scholar]
- Fernandez-Escamilla A.M., Rousseau, F., Schymkowitz, J., and Serrano, L. 2004. Prediction of sequence-dependent and mutational effects on the aggregation of peptides and proteins. Nat. Biotechnol. 22: 1302–1306. [DOI] [PubMed] [Google Scholar]
- Fryer J.D., Taylor, J.W., DeMattos, R.B., Bales, K.R., Paul, S.M., Parsadanian, M., and Holtzman, D.M. 2003. Apolipoprotein E markedly facilitates age-dependent cerebral amyloid angiopathy and spontaneous hemorrhage in amyloid precursor protein transgenic mice. J. Neurosci. 23: 7889–7896. [DOI] [PMC free article] [PubMed] [Google Scholar]
- Gazit E. 2002. A possible role for pi-stacking in the self-assembly of amyloid fibrils. FASEB J. 16: 77–83. [DOI] [PubMed] [Google Scholar]
- Giasson B.I., Murray, I.V.J., Trojanowski, J.Q., and Lee, V.M.-Y. 2001. A hydrophobic stretch of 12 amino acid residues in the middle of α-synuclein is essential for filament assembly. J. Biol. Chem. 276: 2380–2386. [DOI] [PubMed] [Google Scholar]
- Glenner G.G. and Wong, C.W. 1984. Alzheimer's disease: Initial report of the purification and characterization of a novel cerebrovascular amyloid protein. Biochem. Biophys. Res. Commun. 120: 885–890. [DOI] [PubMed] [Google Scholar]
- Glenner G.G., Eanes, E.D., Bladen, H.A., Linke, R.P., and Termine, J.D. 1974. Beta-pleated sheet fibrils. A comparison of native amyloid with synthetic protein fibrils. J. Histochem. Cytochem. 22: 1141–1158. [DOI] [PubMed] [Google Scholar]
- Goedert M. 2001. Alpha-synuclein and neurodegenerative diseases. Nat. Rev. Neurosci. 2: 492–501. [DOI] [PubMed] [Google Scholar]
- Goedert M. and Spillantini, M.G. 2006. A century of Alzheimer's disease. Science 314: 777–781. [DOI] [PubMed] [Google Scholar]
- Goedert M., Wischik, C.M., Crowther, R.A., Walker, J.E., and Klug, A. 1988. Cloning and sequencing of the cDNA encoding a core protein of the paired helical filament of Alzheimer disease: Identification as the microtubule-associated protein τ. Proc. Natl. Acad. Sci. 85: 4051–4055. [DOI] [PMC free article] [PubMed] [Google Scholar]
- Goedert M., Spillantini, M.G., Crowther, R.A., Chen, S.G., Parchi, P., Tabaton, M., Lanska, D.J., Markesbery, W.R., Wilhelmsen, K.C., Dickson, D.W., et al. 1999. τ gene mutation in familial progressive subcortical gliosis. Nat. Med. 5: 454–457. [DOI] [PubMed] [Google Scholar]
- Gregory G.C. and Halliday, G.M. 2005. What is the dominant Aβ species in human brain tissue? A review. Neurotox. Res. 7: 29–41. [DOI] [PubMed] [Google Scholar]
- Grover A., DeTure, M., Yen, S.H., and Hutton, M. 2002. Effects on splicing and protein function of three mutations in codon N296 of τ in vitro. Neurosci. Lett. 323: 33–36. [DOI] [PubMed] [Google Scholar]
- Guijarro J.I., Sunde, M., Jones, J.A., Campbell, I.D., and Dobson, C.M. 1998. Amyloid fibril formation by an SH3 domain. Proc. Natl. Acad. Sci. 95: 4224–4228. [DOI] [PMC free article] [PubMed] [Google Scholar]
- Han H., Weinreb, P.H., and Lansbury Jr, P.T. 1995. The core Alzheimer's peptide NAC forms amyloid fibrils which seed and are seeded by β-amyloid: Is NAC a common trigger or target in neurodegenerative disease? Chem. Biol. 2: 163–169. [DOI] [PubMed] [Google Scholar]
- Hasegawa M., Smith, M.J., Iijima, M., Tabira, T., and Goedert, M. 1999. FTDP-17 mutations N279K and S305N in τ produce increased splicing of exon 10. FEBS Lett. 443: 93–96. [DOI] [PubMed] [Google Scholar]
- Heise H., Hoyer, W., Becker, S., Andronesi, O.C., Riedel, D., and Baldus, M. 2005. Molecular-level secondary structure, polymorphism, and dynamics of full-length α-synuclein fibrils studied by solid-state NMR. Proc. Natl. Acad. Sci. 102: 15871–15876. [DOI] [PMC free article] [PubMed] [Google Scholar]
- Hong M., Zhukareva, V., Vogelsberg-Ragaglia, V., Wszolek, Z., Reed, L., Miller, B.I., Geschwind, D.H., Bird, T.D., McKeel, D., Goate, A., et al. 1998. Mutation-specific functional impairments in distinct τ isoforms of hereditary FTDP-17. Science 282: 1914–1917. [DOI] [PubMed] [Google Scholar]
- Hutton M., Lendon, C.L., Rizzu, P., Baker, M., Froelich, S., Houlden, H., Pickering-Brown, S., Chakraverty, S., Isaacs, A., Grover, A., et al. 1998. Association of missense and 5′-splice-site mutations in τ with the inherited dementia FTDP-17. Nature 393: 702–705. [DOI] [PubMed] [Google Scholar]
- Ingelsson M., Fukumoto, H., Newell, K.L., Growdon, J.H., Hedley-Whyte, E.T., Frosch, M.P., Albert, M.S., Hyman, B.T., and Irizarry, M.C. 2004. Early Aβ accumulation and progressive synaptic loss, gliosis, and tangle formation in AD brain. Neurology 62: 925–931. [DOI] [PubMed] [Google Scholar]
- Iseki E., Matsumura, T., Marui, W., Hino, H., Odawara, T., Sugiyama, N., Suzuki, K., Sawada, H., Arai, T., and Kosaka, K. 2001. Familial frontotemporal dementia and parkinsonism with a novel N296H mutation in exon 10 of the τ gene and a widespread τ accumulation in the glial cells. Acta Neuropathol. (Berl.) 102: 285–292. [DOI] [PubMed] [Google Scholar]
- Iwai A., Yoshimoto, M., Masliah, E., and Saitoh, T. 1995. Non-Aβ component of Alzheimer's disease amyloid (NAC) is amyloidogenic. Biochemistry 34: 10139–10145. [DOI] [PubMed] [Google Scholar]
- Jakes R., Novak, M., Davison, M., and Wischik, C.M. 1991. Identification of 3- and 4-repeat τ isoforms within the PHF in Alzheimer's disease. EMBO J. 10: 2725–2729. [DOI] [PMC free article] [PubMed] [Google Scholar]
- Jao C.C., Der-Sarkissian, A., Chen, J., and Langen, R. 2004. Structure of membrane-bound α-synuclein studied by site-directed spin labeling. Proc. Natl. Acad. Sci. 101: 8331–8336. [DOI] [PMC free article] [PubMed] [Google Scholar]
- Jarrett J.T., Berger, E.P., and Lansbury Jr, P.T. 1993. The carboxy terminus of the β-amyloid protein is critical for the seeding of amyloid formation: Implications for the pathogenesis of Alzheimer's disease. Biochemistry 32: 4693–4697. [DOI] [PubMed] [Google Scholar]
- Joachim C.L., Duffy, L.K., Morris, J.H., and Selkoe, D.J. 1988. Protein chemical and immunocytochemical studies of meningovascular β-amyloid protein in Alzheimer's disease and normal aging. Brain Res. 474: 100–111. [DOI] [PubMed] [Google Scholar]
- Kenney J.M., Knight, D., Wise, M.J., and Vollrath, F. 2002. Amyloidogenic nature of spider silk. Eur. J. Biochem. 269: 4159–4163. [DOI] [PubMed] [Google Scholar]
- Kheterpal I., Williams, A., Murphy, C., Bledsoe, B., and Wetzel, R. 2001. Structural features of the Aβ amyloid fibril elucidated by limited proteolysis. Biochemistry 40: 11757–11767. [DOI] [PubMed] [Google Scholar]
- Kumar S. and Bansal, M. 1998. Geometrical and sequence characteristics of α-helices in globular proteins. Biophys. J. 75: 1935–1944. [DOI] [PMC free article] [PubMed] [Google Scholar]
- Kyte J. and Doolittle, R.F. 1982. A simple method for displaying the hydropathic character of a protein. J. Mol. Biol. 157: 105–132. [DOI] [PubMed] [Google Scholar]
- Lewy F.H. 1912. Paralysis agitans. In Pathologische Anatomie. Handbuch der Neurologie (ed. M. Lewandowsky), pp. 920–933. Springer-Verlag, Berlin.
- Linding R., Schymkowitz, J., Rousseau, F., Diella, F., and Serrano, L. 2004. A comparative study of the relationship between protein structure and β-aggregation in globular and intrinsically disordered proteins. J. Mol. Biol. 342: 345–353. [DOI] [PubMed] [Google Scholar]
- Lopez De La Paz M., Goldie, K., Zurdo, J., Lacroix, E., Dobson, C.M., Hoenger, A., and Serrano, L. 2002. De novo designed peptide-based amyloid fibrils. Proc. Natl. Acad. Sci. 99: 16052–16057. [DOI] [PMC free article] [PubMed] [Google Scholar]
- Lührs T., Ritter, C., Adrian, M., Riek-Loher, D., Bohrmann, B., Döbeli, H., Schubert, D., and Riek, R. 2005. 3D structure of Alzheimer's amyloid-β(1–42) fibrils. Proc. Natl. Acad. Sci. 102: 17342–17347. [DOI] [PMC free article] [PubMed] [Google Scholar]
- Makin O.S., Atkins, E., Sikorski, P., Johansson, J., and Serpell, L.C. 2005. Molecular basis for amyloid fibril formation and stability. Proc. Natl. Acad. Sci. 102: 315–320. [DOI] [PMC free article] [PubMed] [Google Scholar]
- Margittai M. and Langen, R. 2004. Template-assisted filament growth by parallel stacking of τ. Proc. Natl. Acad. Sci. 101: 10278–10283. [DOI] [PMC free article] [PubMed] [Google Scholar]
- Margittai M. and Langen, R. 2006. Side chain-dependent stacking modulates τ filament structure. J. Biol. Chem. 281: 37820–37827. [DOI] [PubMed] [Google Scholar]
- McCarron M.O., Nicoll, J.A., Stewart, J., Cole, G.M., Yang, F., Ironside, J.W., Mann, D.M., Love, S., and Graham, D.I. 2000. Amyloid β-protein length and cerebral amyloid angiopathy-related haemorrhage. Neuroreport 11: 937–940. [DOI] [PubMed] [Google Scholar]
- McParland V.J., Kad, N.M., Kalverda, A.P., Brown, A., Kirwin-Jones, P., Hunter, M.G., Sunde, M., and Radford, S.E. 2000. Partially unfolded states of β(2)-microglobulin and amyloid formation in vitro. Biochemistry 39: 8735–8746. [DOI] [PubMed] [Google Scholar]
- Miake H., Mizusawa, H., Iwatsubo, T., and Hasegawa, M. 2002. Biochemical characterization of the core structure of α-synuclein filaments. J. Biol. Chem. 277: 19213–19219. [DOI] [PubMed] [Google Scholar]
- Miyamoto K., Kowalska, A., Hasegawa, M., Tabira, T., Takahashi, K., Araki, W., Akiguchi, I., and Ikemoto, A. 2001. Familial frontotemporal dementia and parkinsonism with a novel mutation at an intron 10+11-splice site in the τ gene. Ann. Neurol. 50: 117–120. [DOI] [PubMed] [Google Scholar]
- Murakami K., Irie, K., Morimoto, A., Ohigashi, H., Shindo, M., Nagao, M., Shimizu, T., and Shirasawa, T. 2002. Synthesis, aggregation, neurotoxicity, and secondary structure of various Aβ 1–42 mutants of familial Alzheimer's disease at positions 21–23. Biochem. Biophys. Res. Commun. 294: 5–10. [DOI] [PubMed] [Google Scholar]
- Nelson R., Sawaya, M.R., Balbirnie, M., Madsen, A.O., Riekel, C., Grothe, R., and Eisenberg, D. 2005. Structure of the cross-β spine of amyloid-like fibrils. Nature 435: 773–778. [DOI] [PMC free article] [PubMed] [Google Scholar]
- Novak M., Kabat, J., and Wischik, C.M. 1993. Molecular characterization of the minimal protease resistant τ unit of the Alzheimer's disease paired helical filament. EMBO J. 12: 365–370. [DOI] [PMC free article] [PubMed] [Google Scholar]
- Pawar A.P., Dubay, K.F., Zurdo, J., Chiti, F., Vendruscolo, M., and Dobson, C.M. 2005. Prediction of “aggregation-prone” and “aggregation-susceptible” regions in proteins associated with neurodegenerative diseases. J. Mol. Biol. 350: 379–392. [DOI] [PubMed] [Google Scholar]
- Perutz M.F. 1997. Amyloid fibrils. Mutations make enzyme polymerize. Nature 385: 773–775. [DOI] [PubMed] [Google Scholar]
- Petkova A.T., Ishii, Y., Balbach, J.J., Antzutkin, O.N., Leapman, R.D., Delaglio, F., and Tycko, R. 2002. A structural model for Alzheimer's β-amyloid fibrils based on experimental constraints from solid state NMR. Proc. Natl. Acad. Sci. 99: 16742–16747. [DOI] [PMC free article] [PubMed] [Google Scholar]
- Petkova A.T., Leapman, R.D., Guo, Z., Yau, W.M., Mattson, M.P., and Tycko, R. 2005. Self-propagating, molecular-level polymorphism in Alzheimer's β-amyloid fibrils. Science 307: 262–265. [DOI] [PubMed] [Google Scholar]
- Prelli F., Castano, E., Glenner, G.G., and Frangione, B. 1988. Differences between vascular and plaque core amyloid in Alzheimer's disease. J. Neurochem. 51: 648–651. [DOI] [PubMed] [Google Scholar]
- Reches M., Porat, Y., and Gazit, E. 2002. Amyloid fibril formation by pentapeptide and tetrapeptide fragments of human calcitonin. J. Biol. Chem. 277: 35475–35480. [DOI] [PubMed] [Google Scholar]
- Roher A.E., Lowenson, J.D., Clarke, S., Woods, A.S., Cotter, R.J., Gowing, E., and Ball, M.J. 1993. β-Amyloid-(1–42) is a major component of cerebrovascular amyloid deposits: Implications for the pathology of Alzheimer disease. Proc. Natl. Acad. Sci. 90: 10836–10840. [DOI] [PMC free article] [PubMed] [Google Scholar]
- Sánchez de Groot N., Pallarés, I., Avilés, F.X., Vendrell, J., and Ventura, S. 2005. Prediction of “hot spots” of aggregation in disease-linked polypeptides. BMC Struct. Biol. 5: 18. [DOI] [PMC free article] [PubMed] [Google Scholar]
- Schiffer M. and Edmundson, A.B. 1967. Use of helical wheels to represent the structures of proteins and to identify segments with helical potential. Biophys. J. 7: 121–135. [DOI] [PMC free article] [PubMed] [Google Scholar]
- Segrest J.P., Jones, M.K., De Loof, H., Brouillette, C.G., Venkatachalapathi, Y.V., and Anantharamaiah, G.M. 1992. The amphipathic helix in the exchangeable apolipoproteins: A review of secondary structure and function. J. Lipid Res. 33: 141–166. [PubMed] [Google Scholar]
- Serpell L.C., Berriman, J., Jakes, R., Goedert, M., and Crowther, R.A. 2000. Fiber diffraction of synthetic α-synuclein filaments shows amyloid-like cross-β conformation. Proc. Natl. Acad. Sci. 97: 4897–4902. [DOI] [PMC free article] [PubMed] [Google Scholar]
- Siepen J.A. and Westhead, D.R. 2002. The fibril_one on-line database: Mutations, experimental conditions, and trends associated with amyloid fibril formation. Protein Sci. 11: 1862–1866. [DOI] [PMC free article] [PubMed] [Google Scholar]
- Spillantini M.G., Schmidt, M.L., Lee, V.M.-Y., Trojanowski, J.Q., Jakes, R., and Goedert, M. 1997. α-Synuclein in Lewy bodies. Nature 388: 839–840. [DOI] [PubMed] [Google Scholar]
- Spillantini M.G., Crowther, R.A., Jakes, R., Hasegawa, M., and Goedert, M. 1998a. α-Synuclein in filamentous inclusions of Lewy bodies from Parkinson's disease and dementia with Lewy bodies. Proc. Natl. Acad. Sci. 95: 6469–6473. [DOI] [PMC free article] [PubMed] [Google Scholar]
- Spillantini M.G., Murrell, J.R., Goedert, M., Farlow, M.R., Klug, A., and Ghetti, B. 1998b. Mutation in the τ gene in familial multiple system τ-opathy with presenile dementia. Proc. Natl. Acad. Sci. 95: 7737–7741. [DOI] [PMC free article] [PubMed] [Google Scholar]
- Spillantini M.G., Yoshida, H., Rizzini, C., Lantos, P.L., Khan, N., Rossor, M.N., Goedert, M., and Brown, J. 2000. A novel τ mutation (N296N) in familial dementia with swollen achromatic neurons and corticobasal inclusion bodies. Ann. Neurol. 48: 939–943. [DOI] [PubMed] [Google Scholar]
- Sung Y.H. and Eliezer, D. 2006. Secondary structure and dynamics of micelle bound β- and γ-synuclein. Protein Sci. 15: 1162–1174. [DOI] [PMC free article] [PubMed] [Google Scholar]
- Suzuki N., Iwatsubo, T., Odaka, A., Ishibashi, Y., Kitada, C., and Ihara, Y. 1994. High tissue content of soluble β1–40 is linked to cerebral amyloid angiopathy. Am. J. Pathol. 145: 452–460. [PMC free article] [PubMed] [Google Scholar]
- Tartaglia G.G., Cavalli, A., Pellarin, R., and Caflisch, A. 2005. Prediction of aggregation rate and aggregation-prone segments in polypeptide sequences. Protein Sci. 14: 2723–2734. [DOI] [PMC free article] [PubMed] [Google Scholar]
- Thompson M.J., Sievers, S.A., Karanicolas, J., Ivanova, M.I., Baker, D., and Eisenberg, D. 2006. The 3D profile method for identifying fibril-forming segments of proteins. Proc. Natl. Acad. Sci. 103: 4074–4078. [DOI] [PMC free article] [PubMed] [Google Scholar]
- Tjernberg L., Hosia, W., Bark, N., Thyberg, J., and Johansson, J. 2002. Charge attraction and β propensity are necessary for amyloid fibril formation from tetrapeptides. J. Biol. Chem. 277: 43243–43246. [DOI] [PubMed] [Google Scholar]
- Torok M., Milton, S., Kayed, R., Wu, P., McIntire, T., Glabe, C.G., and Langen, R. 2002. Structural and dynamic features of Alzheimer's Aβ peptide in amyloid fibrils studied by site-directed spin labeling. J. Biol. Chem. 277: 40810–40815. [DOI] [PubMed] [Google Scholar]
- Ulmer T.S., Bax, A., Cole, N.B., and Nussbaum, R.L. 2005. Structure and dynamics of micelle-bound human α-synuclein. J. Biol. Chem. 280: 9595–9603. [DOI] [PubMed] [Google Scholar]
- van Swieten J.C., Bronner, I.F., Azmani, A., Severijnen, L.A., Kamphorst, W., Ravid, R., Rizzu, P., Willemsen, R., and Heutink, P. 2007. The DeltaK280 mutation in MAP τ favors exon 10 skipping in vivo. J. Neuropathol. Exp. Neurol. 66: 17–25. [DOI] [PubMed] [Google Scholar]
- von Bergen M., Barghorn, S., Li, L., Marx, A., Biernat, J., Mandelkow, E.M., and Mandelkow, E. 2001. Mutations of τ protein in frontotemporal dementia promote aggregation of paired helical filaments by enhancing local β-structure. J. Biol. Chem. 276: 48165–48174. [DOI] [PubMed] [Google Scholar]
- Watson A.A., Fairlie, D.P., and Craik, D.J. 1998. Solution structure of methionine-oxidized amyloid β-peptide (1–40). Does oxidation affect conformational switching? Biochemistry 37: 12700–12706. [DOI] [PubMed] [Google Scholar]
- Whittemore N.A., Mishra, R., Kheterpal, I., Williams, A.D., Wetzel, R., and Serpersu, E.H. 2005. Hydrogen-deuterium (H/D) exchange mapping of Aβ1–40 amyloid fibril secondary structure using nuclear magnetic resonance spectroscopy. Biochemistry 44: 4434–4441. [DOI] [PubMed] [Google Scholar]
- Williams R.W., Chang, A., Juretic, D., and Loughran, S. 1987. Secondary structure predictions and medium range interactions. Biochim. Biophys. Acta 916: 200–204. [DOI] [PubMed] [Google Scholar]
- Williams A.D., Portelius, E., Kheterpal, I., Guo, J.T., Cook, K.D., Xu, Y., and Wetzel, R. 2004. Mapping Aβ amyloid fibril secondary structure using scanning proline mutagenesis. J. Mol. Biol. 335: 833–842. [DOI] [PubMed] [Google Scholar]
- Wischik C.M., Novak, M., Thogersen, H.C., Edwards, P.C., Runswick, M.J., Jakes, R., Walker, J.E., Milstein, C., Roth, M., and Klug, A. 1988. Isolation of a fragment of τ derived from the core of the paired helical filament of Alzheimer disease. Proc. Natl. Acad. Sci. 85: 4506–4510. [DOI] [PMC free article] [PubMed] [Google Scholar]
- Yoshida H., Crowther, R.A., and Goedert, M. 2002. Functional effects of τ gene mutations ΔN296 and N296H. J. Neurochem. 80: 548–551. [DOI] [PubMed] [Google Scholar]
- Yoshida H., Craxton, M., Jakes, R., Zibaee, S., Tavare, R., Fraser, G., Serpell, L.C., Davletov, B., Crowther, R.A., and Goedert, M. 2006. Synuclein proteins of the pufferfish Fugu rubripes: Sequences and functional characterization. Biochemistry 45: 2599–2607. [DOI] [PubMed] [Google Scholar]
- Younkin S.G. 1995. Evidence that Aβ 42 is the real culprit in Alzheimer's disease. Ann. Neurol. 37: 287–288. [DOI] [PubMed] [Google Scholar]
- Zurdo J., Guijarro, J.I., Jiménez, J.L., Saibil, H.R., and Dobson, C.M. 2001. Dependence on solution conditions of aggregation and amyloid formation by an SH3 domain. J. Mol. Biol. 311: 325–340. [DOI] [PubMed] [Google Scholar]