

Abstract
The efficacy of triple drug therapy for HIV-1 infection encourages its early use to prevent damage to the immune system. We monitored the effects of such therapy on 12 patients with 14–75-mo histories of minimal disease, i.e., CD4+ counts constantly >500/μl and little or no lymph node enlargement. In this way, we could first determine the extent of viral replication and immunoarchitectural changes in unenlarged nodes early in disease, and second follow the response to triple therapy in plasma and lymphoid tissue in tandem. As is known for lymph nodes with more advanced disease, the germinal centers showed productively infected T cells, i.e., CD4+CD1a−CD68− cells labeling intensely for HIV-1 RNA after in situ hybridization. The unenlarged nodes also showed extensive HIV-1 RNA retention on a well-preserved, follicular dendritic cell (FDC) network, and the follicles were abnormal. There were numerous CD8+ cells, many expressing TIA-1 granule antigen. Also, in contrast to normal follicles, CD4+ T cell proliferation was active, with marked increases in the number of cycling, Ki-67+CD4+CD45R0+ cells. After 28 d and 3 mo of therapy, productively infected T cells decreased dramatically and often were not apparent. The labeling of the FDC network for viral RNA also decreased, but not for gag protein. We conclude that HIV-1 replicates and accumulates in lymphoid organs before damage of the immune system, that at this stage of disease de novo production of T cells occurs in the lymphoid tissue, and that the infection is sensitive to triple drug therapy in both plasma and lymph nodes.
Recent developments in antiretroviral therapy have led to substantial advances in the management of patients infected with human immunodeficiency virus type 1 (HIV-1). The combination of two nucleoside analogues, e.g., zidovudine (AZT), didanosine (ddl) or zalcitabine (ddC), and an HIV-1 protease inhibitor (triple drug therapy) typically yields a dramatic reduction of HIV-1 RNA in the plasma and a significant increase in CD4+ T cells in the peripheral blood (1, 2). It is now important to assess therapeutic responses in the tissues and not just viral loads and CD4+ lymphocytes in the blood. It is well established that HIV-1 particles, gag proteins, and viral RNA are retained on the surface of follicular dendritic cells (FDCs)1 in germinal centers (GCs) (for review see reference 3). By in situ hybridization with HIV-1 RNA probes, productively infected cells are also numerous, particularly in the GCs (4– 11). Treatment strategies should therefore reduce these large depots of viral RNA and infected cells in the lymphoid tissue. Indeed, Cavert et al. have recently documented a marked decrease in viral RNA in tonsil biopsies from patients with advanced disease who were treated with combination antiretroviral drugs (12).
A favorable therapeutic response also should restore the architecture of the lymphoid tissue that is severely altered during HIV-1 infection (for review see reference 13). Follicular hyperplasia usually is observed in patients with persistent generalized lymphadenopathy (PGL). This is associated with varying degrees of FDC damage and a marked elevation of CD8+ lymphocytes in both the T-dependent zone and the GCs, the latter being an unusual site for CD8+ T cells. However, there has been little work on lymph node architecture and viral burden in patients with high CD4+ T cell counts and no PGL.
The use of combination therapy early in disease holds the potential of preventing virus-induced damage to the immune system. Therefore, we initiated triple drug therapy in infected seropositive asymptomatic patients with CD4+ counts constantly >500/mm3. Most of the individuals lacked lymphadenopathy. The goal of this study, therefore, was twofold. First we sought information on histology and viral replication in nonenlarged lymph nodes, given that earlier data was obtained from patients with PGL. Second, we wanted to assess the effects of triple drug therapy on lymph node HIV-1 RNA and p24, as well as immunoarchitectural restoration of lymphoid tissue.
Materials and Methods
Patients.
12 volunteers were enrolled. Eligibility criteria were: laboratory documentation of HIV-1 infection, CD4+ T cell counts constantly >500 cells/μl, no history of AIDS-defining events, no prior antiretroviral therapy, and >18 yr old. All patients gave written consent to participate. The study was approved by the local ethics committee (Arztekammer, Hamburg, Germany). Important clinical data are summarized on Table 1. There were two groups: eight patients who had no evidence of lymphadenopathy (group A) and four who had at least two peripheral lymph nodes >3 cm (group B). Biopsies of axillary lymph nodes (group A) or an enlarged node (group B) were done under local anesthesia within 7 d before beginning therapy. All patients received 250 mg zidovudine t.i.d., 0.75 mg zalcitabine t.i.d, and 2,400 mg sanquinavir t.i.d. Plasma viremia and CD4+ T cell counts were determined at days 0, 3, 7, 10, and 14, and weekly thereafter. The second lymph node biopsy was performed either 28 d (group A) or 3 mo (group B and patient No. 8 from group A) of treatment.
Table 1.
Patient Characteristics at Baseline
| Patient No. | Gender | Age | HIV+ | CD4+ | CD4/CD8 ratio | Virus load RNA | PGL | Second bx | ||||||||
|---|---|---|---|---|---|---|---|---|---|---|---|---|---|---|---|---|
| mo | cells/μl | eq/ml | ||||||||||||||
| 1 | Male | 51 | 75 | 540 | 0.24 | 300,000 | No | 28 d | ||||||||
| 2 | Male | 27 | 39 | 580 | 0.65 | 49,000 | No | 28 d | ||||||||
| 3 | Male | 32 | 60 | 510 | 0.75 | 15,000 | No | 28 d | ||||||||
| 4 | Male | 27 | 28 | 610 | 0.86 | 10,000 | No | 28 d | ||||||||
| 5 | Female | 30 | 67 | 1,350 | 0.68 | 6,500 | No | 28 d | ||||||||
| 6 | Male | 39 | 69 | 560 | 0.58 | 6,000 | No | 28 d | ||||||||
| 7 | Female | 46 | 43 | 570 | 0.80 | <500 | No | 28 d | ||||||||
| 8 | Male | 27 | 28 | 670 | 0.86 | <500 | No | 3 mo | ||||||||
| 9 | Male | 56 | 14 | 380 | 0.18 | 48,000 | Yes | 3 mo | ||||||||
| 10 | Male | 27 | 15 | 570 | 0.50 | 37,500 | Yes | 3 mo | ||||||||
| 11 | Male | 35 | 52 | 560 | 0.50 | 31,000 | Yes | 3 mo | ||||||||
| 12 | Male | 39 | 75 | 560 | 0.26 | 9,200 | Yes | 3 mo |
Light microscopy.
Tissues were fixed in 4% neutral-buffered formalin overnight, embedded in paraffin, and stained with hematoxylin and eosin, Giemsa, or Gomori silver impregnation for routine histology. Portions of lymph nodes were embedded in tissue freezing medium (Leica Instruments, Nussloch, Germany), snap frozen in liquid nitrogen, and stored at −70°C until use. As controls, 10 lymph nodes with follicular hyperplasia not related to HIV infection were selected from our files.
Immunohistochemistry.
Dewaxed paraffin sections were placed in a domestic pressure cooker containing 0.01 M buffered sodium citrate solution (pH 6), boiled for 2 min, and chilled to room temperature (14). Cryostat sections were fixed in 2% paraformaldehyde for 10 min. The sections were incubated with the primary antibodies (Table 2) according to the manufacturers' instructions. Binding of antibodies was visualized by the alkaline phosphatase anti–alkaline phosphatase (APAAP) technique using New Fuchsin as chromogen. The sections were either counterstained with hematoxylin and mounted, or dehydrated through graded ethanols and subjected to in situ hybridization to detect HIV RNA.
Table 2.
Antibodies Used in This Study
| Antibody CD (clone) | Main specificities in lymphoid tissue | Dilution | Source | |||||
|---|---|---|---|---|---|---|---|---|
| Paraffin | Frozen | |||||||
| CD1a (010) | Subset of DC and T | Undiluted | ND | Immunotech* | ||||
| CD1a (Leu 6) | Subset of DC and T | ND | 1:10 | Becton Dickinson | ||||
| CD4 (NCL-CD4-1F8) | T helper, DC, mac | 1:40 | 1:50 | Novocastra | ||||
| CD8 (C8/144B) | T cytotoxic | 1:10 | 1:40 | Dakopatts | ||||
| CD20 (L26) | B cells | 1:50 | 1:50 | Dakopatts | ||||
| CD23 | Fcε receptor II | 1:50 | 1:100 | Dakopatts | ||||
| CD57 (Leu 7) | NK subset, T subset | 1:10 | 1:10 | Becton Dickinson | ||||
| CD68 (KP1) | macrophages, some DCs | 1:10 | 1:50 | Dakopatts | ||||
| CD45R0 (UCHL-1) | activated, memory cells | 1:100 | 1:200 | Dakopatts | ||||
| CD25 | β chain of IL-2 receptor | ND | 1:5 | Becton Dickinson | ||||
| anti-p24 | p24 protein of HIV-1 | 1:5 | 1:10 | Dakopatts | ||||
| MIB-1 | Ki-67 cell cycle | 1:10 | 1:20 | Dianova | ||||
| Ki-M4p | FDC | 1:50 | 1:100 | M. Parwaresch‡ | ||||
| TIA-1 | 15-kD protein in | 1:500 | ND | Coulter | ||||
| cytotoxic cells | ||||||||
| p55 | EBV induced; DC | 1:5 | 1:5 | E. Langhoff | ||||
| S-100 (15E2E2) | Subset of DCs | 1:100 | ND | Boehringer | ||||
| Mannheim | ||||||||
Immunotech, Marseille, France; Becton Dickinson, Mountain View, CA; Novocastra, Newcastle upon Tyne, UK; Dakopatts, Copenhagen, Denmark; Dianova, Hamburg, Germany; Coulter Corp., Krefeld, Germany; Boehringer Mannheim GmbH, Mannheim, Germany.
M. Parwaresch, University of Kiel, Kiel, Germany; E. Langhoff, University of Hershey, Hershey, PA. DC, dendritic cell.
Immunohistochemical Double Labeling.
Proliferating CD4+ T cells or CD8+ lymphocytes, and the TIA-1+ CD8+ T cell subset, were detected on paraffin sections. After heat-mediated, antigen retrieval in a pressure cooker, the sections were incubated with anti-CD4 or -CD8 mAbs at 4°C overnight. Binding of antibodies was detected either with biotin-avidin peroxidase or with APAAP using New Fuchsin as red chromogen. The sections were then heat treated again for 5 min and incubated either with antibody MIB-1 to the proliferation antigen Ki-67 (15), or with the TIA-1 mAb that reacts with killer cell granules (16) overnight at 4°C. The second antibody was visualized with APAAP and Fast Blue salt.
Immunofluorescence Studies.
The association of HIV p24 with FDCs and T cells was analyzed on frozen sections by two-color immunofluorescence beginning with FITC-antibodies to CD23 (FDCs), CD4, or CD8. This was followed with an unlabeled antibody to p24, CD25, or CD45R0, and TRITC-goat anti– mouse Ig.
Detection of HIV RNA in Lymph Nodes.
An 35S-labeled, single-stranded, antisense RNA probe (Lofstrand Labs., Gaithersburg, MD) was used. The probe contained 1.4–2.7-kb fragments collectively representing ∼90% of the HIV-1 genome (8). The hybridization was done on paraffin and frozen sections, the latter being fixed in 4% paraformaldehyde for 20 min before hybridization. To increase the diffusion of the probe, paraffin sections were treated either with proteinase K (0.01 mg/ml) for 8 min at room temperature or were placed in a domestic pressure cooker containing citrate buffer and heated for 5 min. The pairs of sections were processed at the same time. The sections were placed in a cocktail (50% formamide, 0.5 M NaCl, 10 mM Tris HCl, pH 7.4, 1 mM EDTA, 0.02% Ficoll-polyvinylpyrrolidone-BSA, and 7 mg of tRNA/ml) and prehybridized for 2 h at 45°C. The sections were covered with a hybridization mixture (prehybridization cocktail, 10% dextran sulfate, and 2 × 10⁶ dpm of probe/ml) and incubated in a 45°C moist chamber overnight. The sections were washed for 15 min with three changes, each in 50% formamide: 50% 2× standard saline citrate (SSC), 2× SSC–0.1% Triton, and finally 0.1× SSC. Sections were digested with RNase (Boehringer Mannheim GmbH, Mannheim, Germany) at 37°C for 40 min, washed again in 2× SSC, and dehydrated in 0.3 M ammonium acetate with 70–90% ethanol. The slides were dipped into emulsion (NTB2; Kodak, Rochester, NY). After 7 d of exposure at 4°C, the slides were developed in developer (D19; Kodak), fixed, counterstained with hemalaun, and mounted. As a positive control, cytospin preparations of H9 cells infected with HIV-1 were hybridized with the same probe. As a negative control, sections were hybridized with a radiolabeled sense-strand probe. The sections were examined with a microscope (Axiophot; Carl Zeiss Inc., Jena, Germany) equipped with epiluminescent illumination. Cells were considered positive for viral gene expression if the grain count was more than six times the highest background.
Semiquantitative Image Analysis of HIV RNA.
To examine the extent and density of diffuse HIV RNA signals in the GCs, we used a microscope (Axioskop; Carl Zeiss Inc.) equipped with Plan Neofluar for transmitted and incident light, a 3CD color camera, and a PC-based image analysis system (KS 400; Kontron, Esching, Germany). In the first step, the transmission light image of the lymph node sections was digitalized and stored. An incident light image showing the reflectance of the silver grains was then obtained. Subsequently, these two images were superimposed. The area occupied by silver grains (RNA) was expressed as a percentage value of total GC area.
Semiquantitative Image Analysis of Proliferating CD4 or CD8 T Cells.
Using a ×40 objective, regions of GCs and T zones were marked on the monitor. Total CD4+ or CD8+ cells, and double positive cells (CD4/Ki-67 or CD8/Ki-67), were counted. Ten fields of GCs and T zones were counted on each slide. The percentage of a T cell subset expressing MIB-1 was calculated in the designated areas.
Assay for Detection of HIV-1 RNA in Plasma.
Plasma aliquots were stored at −70°C. HIV-1 RNA was measured using PCR (Amplicor Monitor HIV-1; Hoffmann-La Roche, Basel, Switzerland) according to the manufacturer's instructions (17). The limit of detection of this assay is 200 RNA copies/ml. When levels below this cutoff were found, an ultrasensitive version (20 copies/ml) of this assay was performed.
Results
Technical Considerations of HIV RNA Detection.
To allow for the penetration of probes into paraffin sections, tissue permeabilization is usually necessary. Current protocols recommend pretreatment with HCl and digitonin and/or proteinase K (8, 18). However, we find that these agents damage the morphology, making the evaluation of pathologic changes difficult. Furthermore, recently available antibodies that detect CD4+ or CD8+ T cells in paraffin sections (Table 2) do not react if the sections are treated with proteolytic enzymes but instead require superheating before immunostaining. Since high temperature also denatures RNA, yielding unfolded linear forms to which probes hybridize efficiently, we reasoned that boiling of tissue sections might intensify both RNA hybridization and immunostaining with new mAbs while preserving morphology. In pilot experiments, sections were boiled in a domestic pressure cooker for 5 min (14). Companion sections were pretreated with 0.2 N HCl for 30 min followed by proteinase K in various concentrations (5–20 μg/ml) at 37°C or at room temperature for 8–15 min, and hybridized according to published protocols (8, 18). Sections were exposed at 4°C for 1, 3, 4, 5, 7, and 10 d to optimize autoradiographic signals.
Treatment of sections with high temperature substantially increased the number (50–70%) and grain counts of actively infected or “hot” cells (cells labeling heavily with antisense RNA probe) over prior reports (3–12, 18, 19; Fig. 1, right, arrows). However, protein digestion facilitated the access of the probe to FDC-bound HIV that is complexed with antibodies, giving increased diffuse FDC labeling (8, 20; Fig. 1, left, arrow). We confirmed the findings of Cavert et al. (12) that longer autoradiographic exposure times increased the sensitivity of in situ hybridization in both approaches. For example, a 1-d exposure (recommended to quantitate FDC-bound HIV RNA; reference 18) gave low grain counts and low frequencies of productively infected cells, but exposure times of 5–7 d increased the numbers of hot profiles and FDC-bound HIV RNA. Further lengthening of exposure times did not increase sensitivity and led to a reduction of signal/noise ratio.
Figure 1.
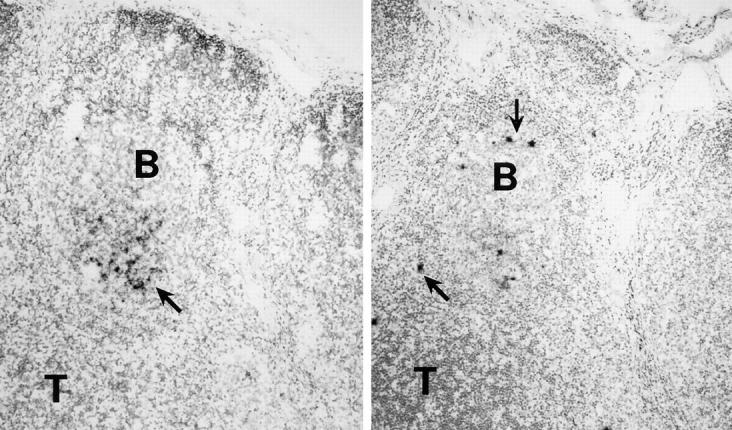
Methodological aspects of HIV-1 RNA detection. Adjacent lymph node sections were treated by boiling in a pressure cooker (right) or with proteinase K (left), and then hybridized with radiolabeled antisense RNA probes. The autoradiograms were photographed under bright field microscopy. The boiled sections contained more numerous, discretely labeled, productively infected or hot cells (arrows, right), and tissue preservation was better. Proteinase K–treated sections, in contrast, exhibited a more heavily labeled FDC network of RNA (arrow, left).
Because high temperature treatment provided for (a) immunohistochemical detection of important antigens, (b) efficient RNA hybridization signals with low background noise, and (c) well-preserved morphology, we used this method to monitor the structure of lymphoid organs and the numbers of HIV-1–producing cells. Digestion with proteinase K of additional sections was used to analyze FDC-bound HIV RNA. The high density of hybridization signals over single cells and the FDC network did not permit counting of the silver grains, so HIV-1 copy numbers were not calculated in the manner that was described previously (12, 18). Instead, therapy-induced changes were monitored semiquantitatively in terms of the area of GCs occupied by diffusely distributed silver grains and expressed as the percentage of total GC area. HIV RNA+ cells were counted over the entire section, and their localizations were noted. Since labeled cells localized preferentially to B cell follicles (Fig. 1), we used the term extrafollicular lymphoid tissue (ELT) for all nonfollicular regions, omitting further distinction of T-dependent zones, interfollicular areas, medulla, and sinuses.
Detection of HIV RNA in Lymph Nodes at the Baseline.
Even though most of the lymph nodes were not enlarged, we still observed viral RNA in all. As in enlarged nodes (3– 12, 18, 19), there were two patterns of hybridization signals: diffuse labeling over the FDC network in the light zones of GCs, and strong localized labeling of single cells, usually in GCs and the mantle zone (Fig. 1). Plasma RNA levels correlated directly with the frequency of hot HIV-infected cells in the lymph nodes (Fig. 2). The area of GCs occupied with FDC-associated RNA varied about twofold over the range of plasma RNA levels in our patient cohort (see Table 4).
Figure 2.

Direct relationship between the number of productively infected cells in lymph node sections and the level of plasma RNA (correlation coefficient: 0.65). The data are mean numbers of hot GC cells per lymph node section.
Table 4.
Patient Features before and after Triple Drug Therapy
| Patient No. Bx | CD4+ cell counts | Plasma RNA values | RNA+ cells in GC | RNA+ cells in ELT (mean) | Diffuse RNA: percent of GC area | |||||||||||||||
|---|---|---|---|---|---|---|---|---|---|---|---|---|---|---|---|---|---|---|---|---|
| Baseline | At second bx | *Baseline | ‡ At second bx | Baseline | At second bx | Baseline | At second bx | Baseline | At second bx | |||||||||||
| cells/μl | copies/ml | |||||||||||||||||||
| 1 | 540 | 490 | 300,000 | <20 | 33 | 0 | 22 | 0 | 42.0 | 7.2 | ||||||||||
| 2 | 580 | 570 | 49,000 | 630 | 63 | 2 | 31 | 2 | 37.1 | 2.9 | ||||||||||
| 3 | 510 | 720 | 15,000 | 645 | 28 | 15 | 22 | 17 | 16.7 | 28.5 | ||||||||||
| 4 | 560 | 600 | 10,000 | <20 | 11 | 0 | 4 | 0 | 31.0 | 1.4 | ||||||||||
| 5 | 1,320 | 1,110 | 6,500 | 113 | 0 | 0 | 5 | 0 | 17.2 | 1.5 | ||||||||||
| 6 | 560 | 1,000 | 6,000 | 45 | 4 | 0 | 8 | 0 | 8.3 | 4.7 | ||||||||||
| 7 | 570 | 720 | <500 | <20 | 3 | 0 | 10 | 0 | 14.7 | 7.6 | ||||||||||
| 8 | 1,080 | 1,170 | <500 | <20 | No GCs | No GCs | 4 | 0 | No GCs | No GCs | ||||||||||
| 9 | 380 | 540 | 48,000 | <20 | 19 | 0 | 12 | 0 | 27.6 | 0.7§ | ||||||||||
| 10 | 570 | 500 | 37,500 | <20 | 22 | 0 | 9 | 0 | 15.6 | 2.1‖ | ||||||||||
| 11 | 560 | 680 | 31,000 | <20 | 37 | 0 | 14 | 0 | 23.0 | 3.4‖ | ||||||||||
| 12 | 560 | 550 | 9,200 | <20 | 13 | 0 | 7 | 0 | 17.5 | 2.7‖ | ||||||||||
Conventional PCR.
Ultrasensitive PCR.
One GC with 12.8%.
Three or more GCs with 7–10.2%.
Two patients had very low plasma RNA levels of <500 copies/ml before treatment. Patient No. 8 showed only a few infected cells in the ELT but no diffuse labeling over FDCs, which were present. Patient No. 7 had a diffuse hybridization signal over 15–30% of the GCs, with productively infected cells mainly in ELT (up to 10 cells/cutting level) and rarely in GCs (up to 3/cutting level). We conclude that normal-sized nodes from patients with CD4 counts of >500/μl and low levels of plasma RNA show clear productively infected cells and viral RNA accumulation.
Light Microscopy and Lymphocyte Subsets in the Lymph Nodes before Therapy.
The classical microanatomy of the lymph nodes, i.e., the cortex, the paracortex, the medulla, and the sinuses were well preserved and showed histologic alterations commonly seen in viral lymphadenitis. The sinus system was slightly dilated and contained many lymphocytes, macrophages, and not seldomly, neutrophils. The T-dependent zones, identified by the presence of high endothelial venules and interdigitating dendritic cells (S-100+ and p55+), were well developed with increased high endothelial venules and many CD3+ T and CD20+ B blasts. Increased numbers of plasma cells and macrophages were also seen in the interfollicular regions.
The histology of the GC differed in the two groups. Only the enlarged lymph nodes from group B patients had the previously described, HIV-1–associated, follicular hyperplasia. The follicles, located both in the cortex and more diffusely, were enlarged (>700-μm diam) and irregularly shaped, with serrated or protruding margins, sometimes becoming confluent. Attenuation of the mantle zone was evident in some follicles. The GCs showed clear zonation. The light zone had centrocytes, CD4+ T cells, and some plasma cells. The dark zone contained many centroblasts (B blasts) and tingible body macrophages. In group A patients with unenlarged nodes, follicular size was normal, 300–450 μm diam (21). The follicles were usually round and the GCs showed zonation with only slightly extended dark zones. As in follicular hyperplasia, the follicles had a cortical and diffuse distribution occupying 17–24% of the lymph node cross-sectional area.
The numbers of CD4+ T cells both in the follicles and T-dependent zones were in the same range as that seen in non-HIV–infected, control lymph nodes (Fig. 3 a; Table 3). As in follicular hyperplasia not attributed to HIV infection, >95% of the CD4+ cells in the GCs were CD45RO+ and ∼40–60% also expressed CD57. The proportion of CD4+CD45RO+ cells (41–63%) in the T-dependent zones did not differ significantly from control nodes. The number of CD4+CD25+ activated T cells showed a wide range of variation (1.4–15.1%) within the same section, but in HIV-infected patients more CD4+ lymphocytes in the GCs expressed this activation marker than in the controls. As reported in HIV-1− lymph nodes (22, 23), no CD25+ cells were found among the intrafollicular, CD57+CD4+ cells.
Figure 3.
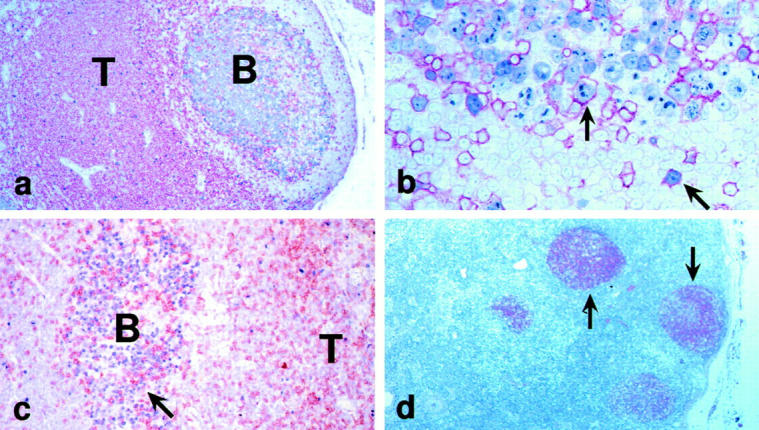
Architecture and immunolabeling of infected lymph nodes. (a) CD4+ T cells (red) were abundant in the T cell area (T), but were also found in the B cell follicle, as is typical of normal lymph nodes. (b) However, in HIV-1 infection, CD4+ T cells (red) showed an increase in the extent of labeling for Ki-67 (blue; arrows, double positive cells). (c) In HIV-1 infection, CD8+ T cells (brown, arrow) were abundant in GCs (B) that were full of Ki-67+ B blasts (blue). (d) The FDC network (arrows) was visualized with the Ki-Mp4 monoclonal antibody.
Table 3.
Percentage of T Cell Subsets in Lymph Nodes of HIV+ Patients and HIV− Controls
| T cell subsets | Controls, HIV− | Group A, HIV+ | Group B, HIV+ | |||||||||
|---|---|---|---|---|---|---|---|---|---|---|---|---|
| GC | T zone | GC | T zone | GC | T zone | |||||||
| CD4+Ki-67+ | 1.4 ± 0.4 | 2.6 ± 0.6 | 19 ± 2.0 | 3.9 ± 0.5 | 18 ± 1.7 | 3.4 ± 0.7 | ||||||
| (0–3) | (0.4–4.6) | (8–31) | (0.9–5.4) | (9.8–28) | (1.3–5.0) | |||||||
| CD8+Ki-67+ | ND | 2.9 ± 0.3 | 0.6 ± 0.1 | 5.7 ± 0.4 | 1.0 ± 0.2 | 5.1 ± 1.0 | ||||||
| (1.5–3.9) | (0.2–0.8) | (2.7–7.0) | (0.4–1.9) | (2.0–6.0) | ||||||||
| CD4+CD45R0+ | >95 | 43 ± 6.5 | >95 | 50 ± 3.7 | >95 | 43 ± 2.8 | ||||||
| (38–51) | (41–63) | (34–57) | ||||||||||
| CD8+CD45R0+ | ND | 25 ± 2.2 | >95 | 65 ± 5.3 | >95 | 69.0 ± 3.3 | ||||||
| (19–32) | (57–72) | (60.0–72.8) | ||||||||||
| CD8+TIA-1+ | ND | 49 ± 5.0 | >95 | 73 ± 3.5 | >95 | 75 ± 1.4 | ||||||
| (36–58) | (61–79) | (60–81) | ||||||||||
| CD4/CD8 ratio | 20 | 3.7 | 1.6 | 1.3 | 1.8 | 1.5 | ||||||
| (14–31) | (2.5–5.8) | (1.0–2.4) | (0.9–2.0) | (1.0–2.7) | (1.0–2.5) | |||||||
Values are ± SE based on 10 fields of T-dependent zone/lymph node and on 8 GCs/lymph node. Range is shown in parenthesis. ND, not determined because of too few CD8+ T cells.
Abnormalities in the Follicles of Unenlarged HIV-1–infected Lymph Nodes.
In HIV-1 infection, continuous virus replication results in a loss of CD4+ lymphocytes with ∼109 CD4+ T cells being destroyed each day (24). In our patients, the levels of CD4+ T cells were in the normal range, both in the circulation and in the lymph node, in spite of the fact that infection was acquired 1–6 yr earlier. Therefore, we determined the growth fraction of the CD4+ cells to see if peripheral T cell numbers might be maintained in the nodes. In agreement with published data (25), we found that intrafollicular T cells in noninfected patients usually were not proliferating, i.e., 0–3% expressed the Ki-67 cell cycle antigen (Table 3). This contrasted to our group A and B lymph nodes in which 8–31% of the CD4+ cells in GCs expressed Ki-67 (Fig. 3 b; Table 3). In the T-dependent zone, the differences in proliferation index between controls and infected lymph nodes were less pronounced (0.9– 5.4 versus 0.4–4.6% in the control lymph nodes). In contrast to CD4+ lymphocytes, CD8+ T cells proliferated mainly in the ELT. In the T-dependent zone, 2.7–7.0% of the CD8+ cells were cycling, but in the GC, only 0.2– 0.8% of the CD8+ cells were Ki-67+.
In all infected patients, the numbers of CD8+ lymphocytes were markedly elevated both in the follicles and the ELT (Fig. 3 c). This led to markedly decreased CD4/CD8 ratios in the T-dependent zone (1.3 versus 3.7 in uninfected controls) and in the GC (1.6 versus 19.8 in controls). Within GCs, CD8+ cells were almost uniformly CD45RO+ (>95%), whereas in the T zone, 57–72% of CD8+ cells belonged to this memory subtype. Up to two thirds of CD8+ cells in the T-dependent zone, and nearly all CD8+ T cells in the GCs, contained TIA-1+ cytotoxic granules. Thus, in follicles and in T zones, the proportion of CD8+ T cell subsets was similar to that seen in persistent generalized lymphadenopathy (26, 27)
The Ki-M4p mAb to FDCs showed that the FDC network was largely confined to the light zone of the infected GCs (Fig. 3 d). Even though CD8+TIA+ T cells had invaded the follicles, no evidence of significant damage to the FDC network was apparent. The CD23 antigen on FDC was upregulated. The band of CD23+ FDCs was expanded into the basal light zone and, in patients with plasma viremia >50,000 copies/ml, into the neighboring regions of the dark zone. Double labeling revealed that immune complexes of HIV-1 p24 antigen were bound only on the CD23+ portion of the FDC network.
Phenotype of HIV RNA+ Cells.
In situ hybridization and immunohistochemistry together revealed that CD4+ lymphocytes expressed viral RNA both in the GCs and ELT (not shown). Exclusively CD45RO+ memory type, CD4+ T cells replicated HIV-1. Viral RNA was not detected in the CD57+ subset that resides in the GCs. Only a minority of cells with HIV gene transcripts expressed CD25. We were not able to detect CD68+ macrophages or CD1a+ dendritic cells with viral RNA. The diffuse RNA labeling was found on the CD23+-activated part of the FDC network.
Viral RNA and Immunohistologic Changes in Lymph Nodes of Treated Patients.
Triple drug therapy markedly reduced HIV-1 RNA in the plasma of all patients, and in the lymph nodes of all but one at day 28 (Table 3). Three patients (baseline viral load of 300,000, 6,500, and 500 copies/ml) had no detectable productively infected cells. Thus, a major reduction in virus-producing cells was not dependent on the virus load in the plasma or the number of HIV RNA+ cells in lymph nodes at the baseline. In all other patients treated for 28 d, a few HIV-1 RNA+ cells could still be detected in the GCs (up to three per section) and in the ELT (up to four per section). Phenotyping of the residual hot cells after treatment revealed no change to a nonlymphoid phenotype. The extent (Fig. 4, a and b; Table 4) and density of diffuse FDC labeling in GCs also showed a marked reduction after 28 d of treatment.
Figure 4.

Effect of triple drug therapy on lymph node HIV-1 RNA. (a and b) The in situ hybridization signal for viral RNA in the FDC network is shown by reflected light (turquoise, arrow) before (a) and after (b) 28 d of therapy. (c and d) The immunolabeling signal for viral p24 or gag protein in the FDC network is shown (red) together with the in situ hybridization for viral RNA (turquoise). Before therapy (c), the red p24 (arrow) was obscured by the silver grains over viral RNA. After therapy (d), p24 persisted and was readily visible because the viral RNA signal was so weak.
In patients treated for 3 mo, we could not detect hot productively infected cells in either paraffin or cryostat sections. FDC-bound HIV RNA remained decreased in all cases. Surprisingly, GCs did not react uniformly. 34–78% of GCs contained no hybridization signals at 20 cutting levels, but in some follicles, up to 12.5% of the GC was occupied by HIV RNA with a low intensity of hybridization. Unexpectedly, FDC-bound HIV-1 p24 was not overtly reduced after triple drug treatment (Fig. 4, c and d). Immunohistochemical and histologic changes at the baseline, e.g., follicular hyperplasia, increased CD8+ cells, high T cell proliferation rates, were not changed by therapy.
Discussion
Active HIV-1 Accumulation in Unenlarged Lymph Nodes from Patients with Minimal Disease.
New therapies against HIV-1 require assessment of their impact on viral loads in lymphoid tissue. Sensitive tools are now available to quantify HIV RNA in plasma, but lymphoid tissues contain the major depots of virus (3–12, 18, 19). In this study, we emphasized in situ hybridization of lymph node sections to detect both productively infected cells as well as immune complexes of virus on FDCs. We found that viral infection was active in the unenlarged lymph nodes of asymptomatic patients with CD4+ counts >500/μl.
The GCs of untreated patients contained p24 gag protein and HIV-1 RNA bound to FDCs. HIV trapping occurred exclusively in the light zone where the FDC network was activated and CD23+. This part of the FDC network can be missed or overrepresented in a GC, depending upon the plane of sectioning. This needs to be taken into account when amounts of captured RNA are estimated. By measuring the FDC-bound HIV RNA in GCs containing both light and dark zones, we found that 15–30% of the GCs in most lymph nodes was occupied by RNA when the plasma viremia varied from 500–50,000 copies/ml.
Plasma HIV-1 RNA concentrations were much better reflected by the number of actively infected cells in the lymph nodes (Fig 2). In patients with plasma loads of <500 copies/ml, only a few cells expressed HIV RNA and the grain counts were low. With increasing plasma viremia, the number of cells with HIV RNA per total area increased. In patients with plasma viremia of >15,000 copies/ml, the vast majority of hot cells had high grain counts, suggesting high levels of viral replication in each.
It has been suggested that chronically infected macrophages, being more resistent to the cytopathic effect of HIV, could be responsible for chronic virus production (28). Therefore, we investigated the lineage of productively infected cells by double labeling the lymph node sections for HIV-1 RNA and the CD68 macrophage marker or the CD4 T cell marker. Exclusively, CD4+ lymphocytes of the CD45RO+ memory type, and not larger CD68+ macrophages, produced HIV-1 RNA in the lymph nodes. It is possible that β-chemokines (29, 30) decrease the replication of virus in macrophages in situ.
Morphology of HIV-1–infected Lymph Nodes from Patients with High CD4 Counts and without Persistent Generalized Lymphadenopathy.
In spite of the excellent clinical status of our patients (Table 1), even the nonenlarged lymph nodes showed alterations that are seen in viral lymphadenitis. For unenlarged nodes (group A patients), the follicles were normal in size, whereas enlarged nodes (group B patients) had follicular hyperplasia. In both groups, the follicles could be diffusely distributed rather than confined to the outer cortex. The GC microenvironment was clearly disturbed. For example, there were many infiltrating CD8+ T cells, and the CD23 antigen was upregulated on the FDC network. The FDC network was expanded in those lymph nodes that had hyperplastic GCs, but no FDC damage was detectable. This is in contrast to more advanced stages of disease in which a deterioration of the FDC network occurs consistently during the follicular hyperplasia stage of PGL (for review see reference 31).
It is thought that HIV-1 within the GC is somehow responsible for FDC death. However, the lack of FDC loss in our patients despite the presence of HIV-1 RNA, p24 protein, and a substantial history of infection (1–6 yr), suggests that HIV-1 infection per se does not damage the FDCs. Possibly it is a loss of CD4+ T cells that underlies FDC malfunction, and CD4+ T cells were preserved in the patients that we studied here. FDC development in mice with severe combined immunodeficiency mice requires transfer of both B and T cells (32).
In many ways, the histologic changes that were seen in unenlarged lymph nodes were similar to those reported earlier for more extensive disease including generalized lymphadenopathy. The major difference was in the extent of follicular hyperplasia, which was minimal in the unenlarged lymph nodes. Since the follicles nevertheless harbored productively infected cells as well as FDC-bound RNA and p24 of HIV-1, our observations suggest that host factors rather than the virus itself or viral components deposited in the GC drive follicular hyperplasia.
Response to Triple Drug Therapy.
Viral burdens in both plasma and lymph nodes were markedly sensitive to triple drug therapy, with a major effect being within 28 d of treatment. Most productively infected T cells in lymph nodes had disappeared in 28 d and were undetectable by 3 mo.
There were some unexpected findings that require further study. The first relates to the FDC network of viral RNA that was sensitive to therapy as described (12, 33). The longevity of immune complexes on FDCs is substantial with half lives in mice of >1–2 mo. Yet we found marked decreases of viral RNA on FDCs in just 28 d (Fig. 4, a and b). It will be important to assess RNA on FDCs after longer periods of therapy. A second surprise was that HIV-1 p24 protein was retained for longer periods, even in follicles (Fig. 4, c and d) in which HIV-1 RNA was undetectable after 3 mo of therapy. Because of a remarkable stability of the p24 core during the decay of HIV-1 (34), we assume that in our patients the FDC-bound p24 antigen is not virion associated. Third, there were clear differences in the clearance of FDC-bound HIV RNA among GCs within the same lymph node. If the lability of FDC-associated HIV RNA is determined by the equilibrium between production and clearance of virus from the circulation as suggested (12), the same magnitude of RNA decay in all GCs was expected, since in all of our patients plasma viral load was suppressed to undetectable levels. The apparent variability in the viral reservoirs that we observed in different GCs mandates some caution in monitoring the efficacy of therapy with fine-needle aspiration, or with tissues containing a limited number of GCs, e.g., tonsil and gut biopsies.
CD4+ T Cell Proliferation with GCs of HIV-1–infected Individuals.
Immune reconstitution is a vital aspect of therapy, and suppression of virus replication can be accompanied by increases in the number of circulating CD4+ T cells (1, 2, 24, 35–39). It has been suggested that the T cell expansion is a reflection of cell proliferation (24, 36). In contrast, Wolthers at al. (38) reported that cellular redistribution rather than de novo production of CD4+ T cells accounts for the initial increase of memory T cells during therapy. Our demonstration of high proliferation rates (labeling for the Ki-67 cell cycle antigen) in CD4+ T cells in lymph nodes compared with uninfected controls provides direct evidence that an accelerated CD4+ T cell turnover does indeed occur in HIV-1 infection. The high proliferation rates occur in intrafollicular CD4+/CD45RO+ lymphocytes (Fig. 3 b), whereas control GCs contain many such lymphocytes but few in the cell cycle. Possibly the proliferation of intrafollicular CD4+ T cells at the baseline and after treatment is driven by immune complexes of HIV-1 p24 presented by FDCs or GC dendritic cells. In mice, T cells in GCs do proliferate upon antigenic stimulation (40). Our findings reveal a peripheral regenerative capacity within GCs, and this may account for observed increases in CD4+ T cell counts during triple drug therapy.
Acknowledgments
This work was supported by grants from the German Ministry of Education and Research (BMBF 01-K1-9469), the Körber Foundation (Hamburg, Germany), Hoffman-LaRoche (Grenzach-Wyhlen, Germany), the Fogarty Foundation (TW00792), and the National Institutes of Health (Bethesda, MD; National Institute of Allergy and Infectious Diseases AI-40045).
Abbreviations used in this paper
- APAAP
alkaline phosphatase anti–alkaline phosphatase
- ELT
extrafollicular lymphoid tissue
- FDC
follicular dendritic cell
- GC
germinal center
- PGL
persistent generalized lymphadenopathy
- SSC
standard saline citrate
References
- 1.Collier AC, Coombs RW, Schoenfeld DA, Bassett RL, Timpone J, Baruch A, Jones M, Facey K, Whitacre C, McAuliffe VJ, et al. Treatment of human immunodeficiency virus infection with sanquinavir, zidovudine, and zalcitabine. N Engl J Med. 1996;334:1011–1017. doi: 10.1056/NEJM199604183341602. [DOI] [PubMed] [Google Scholar]
- 2.Perelson AS, Neumann AU, Markowitz M, Leonard JM, Ho DD. HIV-1 dynamics in vivo: virion clearance rate, infected cell life span, and viral generation time. Science. 1996;271:1582–1586. doi: 10.1126/science.271.5255.1582. [DOI] [PubMed] [Google Scholar]
- 3.Tenner-Racz K, Racz P. Follicular dendritic cells initiate and maintain infection of the germinal centers by human immunodeficiency virus. Curr Top Microbiol Immunol. 1995;201:141–159. doi: 10.1007/978-3-642-79603-6_9. [DOI] [PubMed] [Google Scholar]
- 4.Biberfeld P, Chayt KJ, Marselle LM, Biberfeld G, Gallo RC, Harper M. HTLV-III expression in infected lymph nodes and relevance to pathogenesis of lymphadenopathy. Am J Pathol. 1986;125:436–442. [PMC free article] [PubMed] [Google Scholar]
- 5.Tenner-Racz K, Racz P, Schmidt H, Dietrich M, Kern P, Louie A, Gartner S, Popovic M. Immunohistochemical, electron microscopic and in situ hybridization evidence for the involvement of lymphatics in the spread of HIV-1. AIDS (Lond) 1988;2:299–309. doi: 10.1097/00002030-198808000-00010. [DOI] [PubMed] [Google Scholar]
- 6.Prevot S, Fournier JG, Tardivel I, Audouin J, Diebold J. Detection by in situ hybridization of HIV-1 RNA in spleens of HIV-1 seropositive patients with thrombocytopenic purpura. Pathol Res Pract. 1989;185:187–193. doi: 10.1016/S0344-0338(89)80250-X. [DOI] [PubMed] [Google Scholar]
- 7.Emilie D, Peuchmaur M, Maillott MC, Crevon MC, Brousse N, Delfaissy JF, Dormont J, Galanud P. Production of interleukins in human immunodeficiency virus-1–replicating lymph nodes. J Clin Invest. 1990;86:148–159. doi: 10.1172/JCI114678. [DOI] [PMC free article] [PubMed] [Google Scholar]
- 8.Fox CH, Tenner-Racz K, Racz P, Fripo A, Pizzo PA, Fauci AS. Lymphoid germinal centers are reservoirs of human immunodeficiency virus type 1 RNA. J Infect Dis. 1991;164:1051–1057. doi: 10.1093/infdis/164.6.1051. [DOI] [PubMed] [Google Scholar]
- 9.Spiegel H, Herbst H, Niedobitek G, Voss HD, Stein H. Follicular dendritic cells are a major reservoir for human immunodeficiency virus type 1 in lymphoid tissues facilitating infection of CD4+ T-helper cells. Am J Pathol. 1991;140:15–22. [PMC free article] [PubMed] [Google Scholar]
- 10.Pantaleo G, Graziosi C, Demarest JF, Butini L, Montroni M, Fox CH, Orenstein JM, Kotler DP, Fauci AS. HIV infection is active and progressive in lymphoid tissue during the clinical latent stage of disease. Nature. 1993;362:355–358. doi: 10.1038/362355a0. [DOI] [PubMed] [Google Scholar]
- 11.Embretson J, Zupancic M, Ribas JL, Burke A, Racz P, Tenner-Racz K, Haase AT. Massive covert infection of helper T lymphocytes and macrophages by human immunodeficiency virus during the incubation period of AIDS. Nature. 1993;362:359–362. doi: 10.1038/362359a0. [DOI] [PubMed] [Google Scholar]
- 12.Cavert W, Notermans DW, Staskus K, Wietgrefe SW, Zupancic M, Gebhard K, Henry K, Zhang ZQ, Mills R, McDade H, et al. Kinetics of response in lymphoid tissue to antiretroviral therapy of HIV-1 infection. Science. 1997;276:960–964. doi: 10.1126/science.276.5314.960. [DOI] [PubMed] [Google Scholar]
- 13.Knowles, D.M., and A. Chadburn. 1992. Lymphadenopathy and lymphoid neoplasms associated with the acquired immunodeficiency syndrome (AIDS). In Neoplastic Hematopathology. D.M. Knowles, editor. Williams and Wilkins, Baltimore. 773–783.
- 14.Norton AJ, Jordan S, Yeomans P. Brief, high-temperature heat denaturation (pressure cooking): a simple and effective method of antigen retrieval for routinely processed tissues. J Pathol. 1994;173:371–379. doi: 10.1002/path.1711730413. [DOI] [PubMed] [Google Scholar]
- 15.Cattoretti G, Becker MH, Key G, Duchrow M, Schluter C, Galle J, Gerdes J. Monoclonal antibodies against recombinant parts of the Ki-67 antigen (MIB 1 and MIB 3) detect proliferating cells in microwave-processed formalin-fixed paraffin sections. J Pathol. 1993;168:357–363. doi: 10.1002/path.1711680404. [DOI] [PubMed] [Google Scholar]
- 16.Anderson P, Nagler-Anderson C, O'Brien C, Levine H, Watkons S, Slayter HS, Blue ML, Schlossman SF. A monoclonal antibody reactive with a 15 kDa cytoplasmic granule associated protein defines a subpopulation of CD8+lymphocytes. J Immunol. 1990;144:574–582. [PubMed] [Google Scholar]
- 17.Mulder J, McKinney N, Christopherson C, Sninsky J, Greenfield L, Kwok S. Rapid and simple PCR assay for quantification of human immunodeficiency virus type 1 RNA in plasma: application to acute retroviral infection. J Clin Microbiol. 1994;32:292–300. doi: 10.1128/jcm.32.2.292-300.1994. [DOI] [PMC free article] [PubMed] [Google Scholar]
- 18.Haase AT, Henry K, Zupancic M, Sedgewick G, Faust RA, Melroe H, Cavert W, Gebhard K, Staskus K, Zhang ZQ, et al. Quantitative image analysis of HIV-1 infection in lymphoid tissue. Science. 1996;274:985–989. doi: 10.1126/science.274.5289.985. [DOI] [PubMed] [Google Scholar]
- 19.Schuurman HJ, Krone WJA, Broekhuizen R, Goudsmit J. Expression of RNA and antigens of human immunodeficiency virus type-1 (HIV-1) in lymph nodes from HIV-1 infected individuals. Am J Pathol. 1988;133:516–524. [PMC free article] [PubMed] [Google Scholar]
- 20.Tenner-Racz K, Racz P, Bofill M, Schulz-Meyer A, Dietrich M, Kern P, Weber J, Pinching AJ, Veronese-Dimarzo F, Popovic M, et al. HTLV-III/LAV viral antigens in lymph nodes of homosexual men with persistent generalized lymphadenopathy and AIDS. Am J Pathol. 1986;123:9–15. [PMC free article] [PubMed] [Google Scholar]
- 21.Robb-Smith, A.H.T., and C.R. Taylor. 1981. The human lymph node. Component cells and functional anatomy; principles of lymph node diagnosis. In Lymph Node Biopsy. Miller Heyden Ltd., London. 9–50.
- 22.Velardi A, Tilden AB, Milo R, Grossi CE. Isolation and characterization of Leu 7+germinal center cells with the helper cell phenotype and granular lymphocyte morphology. J Clin Immunol. 1986;6:205–215. doi: 10.1007/BF00918700. [DOI] [PubMed] [Google Scholar]
- 23.Bouzahzah, F., S. Suzuki, A. Bosseloir, L.J. Simar, and E. Heinen. 1995. T cells in contact with follicular dendritic cells. In Follicular Dendritic Cells in Normal and Pathological Conditions. E. Heinen, editor. Springer, New York. 79–96.
- 24.Ho DD, Neumann AU, Perelson AS, Chen W, Leonard JM, Markowitz M. Rapid turnover of plasma virions and CD4 lymphocytes in HIV-1 infection. Nature. 1995;373:123–126. doi: 10.1038/373123a0. [DOI] [PubMed] [Google Scholar]
- 25.Wang J, Isaacson PG, Spencer J. Immunohistochemical analysis of T cell proliferation in normal tonsil and B cell lymphoma. J Clin Pathol. 1995;48:873–875. doi: 10.1136/jcp.48.9.873. [DOI] [PMC free article] [PubMed] [Google Scholar]
- 26.Racz, P., K. Tenner-Racz, F. van Vloten, N.L. Letvin, and G. Janossy. 1992. CD8+ lymphocyte response in lymph node from patients with HIV infection. In Cytotoxic T Cells in HIV and Other Retroviral Infections. P. Racz, N.L. Letvin, and J.C. Gluckman, editors. Karger, Basel. 162–173.
- 27.Tenner-Racz K, Racz P, Thomé C, Meyer CG, Anderson PJ, Schlossman SF, Letvin NL. Cytotoxic effector cell granules recognized by the monoclonal antibody TIA-1 are present in CD8+ lymphocytes in lymph nodes of human immunodeficiency virus-1–infected patients. Am J Pathol. 1993;142:1750–1758. [PMC free article] [PubMed] [Google Scholar]
- 28.Feinberg MB. Changing the natural history of HIV disease. Lancet. 1996;348:239–246. doi: 10.1016/s0140-6736(96)06231-9. [DOI] [PubMed] [Google Scholar]
- 29.Cocchi F, DeVico AL, Garzino-Demo A, Arya SK, Gallo RC, Lusso P. Identification of RANTES, MIP-1 alpha and MIP-1 beta as the major HIV-suppressive factors produced by CD8+T cells. Science. 1995;270:1811–1815. doi: 10.1126/science.270.5243.1811. [DOI] [PubMed] [Google Scholar]
- 30.Jansson M, Popovic M, Karlsson A, Cocchi F, Rossi P, Albert J, Wigzell H. Sensitivity to inhibition by β-chemokines correlates with biological phenotypes of primary HIV-1 isolates. Proc Natl Acad Sci USA. 1996;93:15382–15387. doi: 10.1073/pnas.93.26.15382. [DOI] [PMC free article] [PubMed] [Google Scholar]
- 31.Racz, P., K. Tenner-Racz, and H. Schmidt. 1989. Follicular dendritic cells in HIV-induced lymphadenopathy and AIDS. Acta Pathol. Microbiol. Scand. 97(Suppl. 8):16–23. [PubMed]
- 32.Kapasi ZF, Burton GF, Schultz LD, Tew JG, Szakal AK. Induction of functional follicular dendritic cell development in severe combined immunodeficiency mice. Influence of B and T cells. J Immunol. 1993;150:2648–2658. [PubMed] [Google Scholar]
- 33.Stellbrink HJ, van Lunzen J, Hufert FT, Fröschle G, Wolf-Vorbeck G, Zöllner B, Albrecht H, Grete H, Racz P, Tenner-Racz K. Asymptomatic HIV infection is characterized by rapid turnover of HIV RNA in plasma and lymph nodes but not of latently infected lymph node CD4+ T cells. AIDS (Lond) 1997;11:1103–1110. doi: 10.1097/00002030-199709000-00004. [DOI] [PubMed] [Google Scholar]
- 34.Layne SP, Merges MJ, Dembo M, Spouge JL, Conley SR, Moore JP, Raine JL, Renz H, Gelderblom HR, Nara PL. Factors underlying spontaneous inactivation and susceptibility to neutralization of human immunodeficiency virus. Virology. 1992;189:695–714. doi: 10.1016/0042-6822(92)90593-e. [DOI] [PubMed] [Google Scholar]
- 35.Markowitz M, Saag M, Powderly WG, Hurley AM, Hsu A, Valdes JM, Henry D, Sattler F, La A, Marca, Leonard JM, Ho DD. A preliminary study of ritonavir, an inhibitor of HIV-1 protease, to treat HIV-1 infection. N Engl J Med. 1995;333:1534–1539. doi: 10.1056/NEJM199512073332204. [DOI] [PubMed] [Google Scholar]
- 36.Kelleher AD, Carr A, Zaunders J, Cooper DA. Alterations in the immune response of human immunodeficiency virus (HIV)-infected subjects treated with an HIV-specific protease inhibitor, ritonavir. J Infect Dis. 1996;173:321–329. doi: 10.1093/infdis/173.2.321. [DOI] [PubMed] [Google Scholar]
- 37.Connors M, Kovacs JA, Krevat S, Gea-Banacloche JC, Sneller MS, Flangian M, Metcalf JA, Walker RE, Falloon J, Baseler M, et al. HIV infection induces changes in CD4+ T-cell phenotype and depletions within the CD4+T-cell repertoire that are not immediately restored by antiviral or immune-based therapies. Nat Med. 1997;3:533–540. doi: 10.1038/nm0597-533. [DOI] [PubMed] [Google Scholar]
- 38.Wolthers KC, Wisman GBA, Otto SA, Husman AMR, Schaft N, Wolf F, Goudsmit J, Coutinho RA, van der Zee AGJ, Meyaard L, Midema F. T cell telomere length in HIV-1 infection: no evidence for increased CD4+ T cell turnover. Science. 1996;274:1543–1547. doi: 10.1126/science.274.5292.1543. [DOI] [PubMed] [Google Scholar]
- 39.Autran B, Carcelain G, Li TS, Blanc C, Mathez D, Tubiana R, Katlama C, Debré P, Leibowitch J. Positive effects of combined antiretroviral therapy on CD4+T cell homeostasis and function in advanced HIV disease. Science. 1997;277:112–116. doi: 10.1126/science.277.5322.112. [DOI] [PubMed] [Google Scholar]
- 40.Fuller KA, Kanagawa O, Nahm MH. T cells within germinal centers are specific for the immunizing antigen. J Immunol. 1993;151:4505–4512. [PubMed] [Google Scholar]