

Abstract
During vertebrate gastrulation, convergence and extension (C&E) movements narrow and lengthen the embryonic tissues, respectively. In zebrafish, regional differences of C&E movements have been observed; however, the underlying cell behaviors are poorly understood. Using time-lapse analyses and computational modeling, we demonstrate that C&E of the medial presomitic mesoderm is achieved by cooperation of planar and radial cell intercalations. Radial intercalations preferentially separate anterior and posterior neighbors to promote extension. In knypek;trilobite noncanonical Wnt mutants, the frequencies of cell intercalations are altered and the anteroposterior bias of radial intercalations is lost. This provides evidence for noncanonical Wnt signaling polarizing cell movements between different mesodermal cell layers. We further show using fluorescent fusion proteins that during dorsal mesoderm C&E, the noncanonical Wnt component Prickle localizes at the anterior cell edge, whereas Dishevelled is enriched posteriorly. Asymmetrical localization of Prickle and Dishevelled to the opposite cell edges in zebrafish gastrula parallels their distribution in fly, and suggests that noncanonical Wnt signaling defines distinct anterior and posterior cell properties to bias cell intercalations.
Introduction
During vertebrate gastrulation, internalized mesodermal cells undergo C&E movements in a region-specific manner (Myers et al., 2002). In the zebrafish gastrula, the lateral mesodermal cells converge medially by directed migration at increasing speeds as they migrate closer to the nascent axial mesoderm (Myers et al., 2002). In the dorsal region where strong extension movements are accompanied by limited convergence (Myers et al., 2002; Glickman et al., 2003), the axial mesodermal cells engage in mediolateral (ML) intercalations to achieve similar rates of convergence, but threefold higher extension than the adjacent presomitic mesoderm (PSM) (Wood and Thorogood, 1994; Glickman et al., 2003). As revealed by pioneering work of Keller and colleagues, ML intercalations also mediate C&E of the mesodermal tissues in Xenopus laevis (Wilson et al., 1989; Wilson and Keller, 1991). However, the cell movement behaviors that distinguish the C&E rates of the PSM from the axial mesoderm are not well characterized.
In vertebrates, noncanonical Wnt signaling, the equivalent of the Drosophila melanogaster planar cell polarity (PCP) pathway that polarizes cells within the plane of epithelium (Klein and Mlodzik, 2005), serves as the key regulator of C&E movements during gastrulation (Wallingford et al., 2000, 2002; Myers et al., 2002). Two noncanonical Wnt signaling components, the heparan sulfate proteoglycan Knypek/Glypican4 (Kny) (Topczewski et al., 2001), and the transmembrane protein Trilobite (Tri)/Strabismus (Stbm)/Van Gogh-like 2 (Vangl2) (Jessen et al., 2002; Jessen and Solnica-Krezel, 2004), control the ML cell elongation and alignment that are essential for the planar cell behaviors that drive C&E, including directed migration and ML intercalation (Topczewski et al., 2001; Jessen et al., 2002; Lin et al., 2005). We previously reported that C&E movements of the PSM are reduced in kny and tri individual mutants, and largely inhibited in kny;tri double mutants (Henry et al., 2000; Yin and Solnica-Krezel, 2007), whereas the underlying cellular defects are not fully understood.
How does noncanonical Wnt signaling establish the ML cell polarity during C&E movements? In the fly wing epithelium, asymmetrical localization of PCP components is crucial for cell polarization. Upon activation of the PCP pathway, Frizzled receptor and the docking protein Dishevelled (Dsh) become enriched at the distal cell membrane (Strutt, 2002), whereas Stbm/Vangl2 recruits the intracellular protein Prickle (Pk) to the proximal cell membrane to suppress Frizzled and Dsh on the proximal side (Adler, 2002; Tree et al., 2002; Jenny et al., 2003). In X. laevis, Dsh was shown to be enriched at the ML tips of the intercalating cells in the dorsal marginal zone explants (Kinoshita et al., 2003). Pk, on the other hand, was reported to be localized at the anterior cell edges in the Ascidian notochord (Jiang et al., 2005), as well as in the zebrafish notochord and neural tube cells during somitogenesis (Ciruna et al., 2006). Despite of these initial studies, the localization of noncanonical Wnt components has not been well studied during vertebrate gastrulation. Moreover, the molecular mechanisms by which noncanonical Wnt signaling polarizes cells during C&E and to what degree these mechanisms are similar to those used in the fly PCP are still unclear. Indeed, the localization of Dsh at the ML tips and Pk at the anterior cell edges contrasts the situation in D. melanogaster, where Dsh and Pk are localized at the opposite cell edges, suggesting that distinct molecular mechanisms are involved in fly and vertebrates.
Here, we used time-lapse analyses and computational simulations to demonstrate that in the zebrafish gastrula, C&E movements of the medial PSM are achieved by cooperation of polarized planar and radial cell intercalations. The radial intercalations preferentially separate anterior and posterior neighboring cells, thus contributing to anisotropic tissue extension. In kny;tri C&E mutants, the anteroposterior (AP) bias of radial intercalations is lost, providing the first evidence that noncanonical Wnt signaling controls polarized cell behaviors between different mesodermal cell layers. By overexpressing fluorescent fusion proteins, we reveal that during the dorsal mesoderm C&E, the noncanonical Wnt component Pk is localized at the anterior cell edges, whereas Dsh is enriched near the posterior cell membrane, arguing for the conservation of underlying molecular mechanisms between fly and vertebrates. We therefore propose that noncanonical Wnt signaling defines distinct properties of the AP and ML cell edges to bias the orientation of planar and radial intercalations driving C&E.
Results
Patterns of C&E movements in the PSM during zebrafish gastrulation
To obtain insight into the mechanisms underlying the different C&E movement patterns in the axial and presomitic mesoderm during zebrafish gastrulation, we made Nomarski time-lapse recordings between 95% epiboly (9 h post fertilization, hpf) and the one-somite stage (10.5 hpf). The field of view covered the middle portion of both tissues, with the axial mesoderm in the center, juxtaposed by the PSM (Fig. 1 A). At this stage, the PSM contains on average three cell layers along the dorsoventral axis (unpublished data), and our time-lapse analyses were focused on the intermediate layer of the PSM. To gain a quantitative description of the cell movements in the entire field, we applied particle image velocimetry (PIV) analysis (Fig. 1; see Materials and methods) (Raffel et al., 1998; Supatto et al., 2005). The PIV algorithm generates a displacement field based on local correlation calculations between two consecutive images, allowing visualization of the velocity field of the movements. To validate this method for cell movement analyses in zebrafish, we manually tracked the cell movements within different regions of the time-lapse images that were analyzed by PIV (unpublished data). The movement patterns observed by manual cell tracking are consistent with the PIV results (unpublished data), indicating that PIV is a valid approach for cell movement analyses in zebrafish.
Figure 1.

Patterns of C&E movements in the axial and presomitic mesoderm. (A and D) Lateral views of live embryos at the one-somite stage (10.5 hpf). The regions where the time-lapse recordings were taken are indicated by brackets. (B and E) Snapshots of PIV analyses of C&E movements at the one-somite stage, showing the tissue displacements within a 9-min time window. Dorsal views, anterior to the top. Arrows indicate the direction of cell movements, whereas the length of the arrows represents the movement speed. (C and F) Same images as shown in B and E, except that different movement speeds are presented in a color-coded manner. Purple lines delineate the axial mesoderm. (G–J) Snapshots of the analyzed medial PSM cell population at the beginning and the end of the time-lapse recordings. Dorsal views, anterior to the top. Red arrows illustrate the maximum length and width of the analyzed cell population when the time lapse started. (K) Quantification of the tissue shape changes (Materials and methods). 10 embryos of each genotype were analyzed. Error bars represent the standard error. *, P < 0.05; **, P < 0.005, mutant vs. WT. A, anterior; P, posterior; Axial, axial mesoderm. Bars: (A and D) 100 μm; (B, C, E, F, and G–J) 20 μm.
PIV analyses of the wild-type (WT) gastrula revealed that cells at different positions of the field exhibited distinct speeds and directions of movements (Fig. 1, B and C). In the axial mesoderm, ML cell movements were toward the field center, whereas AP movements were away from the center. Cells located away from the center moved faster than those that were closer to the center (Fig. 1 C) (Glickman et al., 2003). In the PSM, all cells moved toward the midline, with the more laterally located cells moving faster than the medial ones (Fig. 1 C). Interestingly, we frequently observed a transient lack of mirror symmetry between the cell movements within the left and right PSM (Fig. 1, B and C), possibly due to the local heterogeneities caused by the dynamic and complex cellular behaviors involved in C&E. Compared with the cells in the axial mesoderm, the PSM cells exhibited less anterior or posterior bias in their movement directions, providing a possible mechanism for the lower extension rate of the PSM compared with the axial mesoderm.
To identify the cellular defects that impaired the C&E movements in kny;tri double mutants, we acquired time-lapse recordings and performed PIV analyses on the equivalent dorsal mesodermal cell populations in the double mutants as in WT (Fig. 1, D–F). The kny;tri cells migrated at reduced speeds (Fig. 1 F; WT: total speed = 44.8 ± 8.5 μm/h, net dorsal speed = 14.5 ± 6.2 μm/h, 320 cells/10 embryos; kny;tri double mutants: total speed = 42.1 ± 6.0 μm/h, net dorsal speed = 9.7 ± 6.2 μm/h, 299 cells/10 embryos; P < 0.04). The stereotyped cell movement patterns seen in WT were largely lost in the double mutants (Fig. 1, E and F), consistent with the notion that noncanonical Wnt signaling regulates long-range coordination of cell movement behaviors essential for generating efficient C&E.
C&E movements of the medial PSM use several distinct cellular behaviors
The different C&E patterns in the axial and presomitic mesoderm likely reflect different underlying cell behaviors. C&E movements of the axial mesoderm are driven by ML cell intercalation, whereby ML cell rearrangements narrow the tissue mediolaterally and lengthen it anteroposteriorly (Glickman et al., 2003). In this study, we monitored the movements of a small PSM cell population within six-cell diameters from the axial mesoderm throughout the time-lapse recordings. The first forming somitic boundary was used as a landmark to ensure that equivalent cell populations were analyzed in different embryos. The tissue shape changes were calculated based on the changes in the average numbers of cells along the AP and ML dimensions (see Materials and methods). In WT, the analyzed cell population narrowed mediolaterally and extended anteroposteriorly during the recording (Fig. 1, G, H, and K) (Yin and Solnica-Krezel, 2007). In contrast, C&E movements of the equivalent medial PSM cell population were severely impaired in kny;tri double mutants (Fig. 1, I–K) (Yin and Solnica-Krezel, 2007).
We manually tracked the positions of individual cells within the analyzed cell population throughout the time-lapse recordings. In WT, cells frequently exchanged neighbors while migrating medially (Fig. 2 A). In kny;tri double mutants, fewer cell rearrangements were observed compared with WT. Whereas 60% of the analyzed cells in the double mutants (320 cells/10 embryos) moved medially without any neighbor exchanges, such behavior was observed only for 34% of the equivalent WT cells (299 cells/10 embryos). Toward identifying the cellular behaviors underlying the neighbor exchanges, we observed two types of planar cell intercalation behaviors that occur within the analyzed cell layer. In the predominant planar intercalation behavior, medial intercalation, a cell intercalates medially to separate two AP neighboring cells (Fig. 2 B; Video 1, available at http://www.jcb.org/cgi/content/full/jcb.200704150/DC1). Medial intercalation simultaneously increases cell number along the AP axis and decreases it in the ML dimension, thus contributing to both convergence and extension (Keller et al., 2000). At a low frequency (4%) we observed lateral intercalation, in which a cell intercalates laterally, thus counteracting convergence (Video 1). Whereas lateral intercalation was also rare in kny;tri double mutants (4%), the frequency of medial intercalation was greatly reduced in the double mutants compared with WT (Fig. 2 B), consistent with the crucial contribution of medial intercalation to C&E movements (Keller et al., 2000; Solnica-Krezel, 2006).
Figure 2.

C&E movements of the medial PSM entail multiple cell intercalation behaviors. (A) Schematic of the analyzed cell population in WT. Dorsal views. Cells leaving the analyzed layer during the recording are shown in blue; cells entering the layer are shown in red. Six cells are assigned numbers to illustrate the significant neighbor exchanges. (B–E) Schematics and frequencies of planar medial intercalation, coordinated radial/medial intercalation, radial AP intercalation, and radial ML intercalation, respectively. Medial is to the left. (F) Frequencies of the three types of radial intercalations listed in C–E in WT, kny;tri double mutants, and embryos injected with synthetic RNA encoding Xdd1. (B–F) Error bars represent the standard error. A, anterior; M, medial. *, P < 0.05; **, P < 0.005, mutant vs. WT.
Once a cell intercalates medially, it leaves behind an empty space (Fig. 2 B). In WT, the lateral neighboring cell filled the space left by the intercalating cell in 96% of the observed medial intercalation events (n = 73) (Fig. 2 B). We interpret this result to mean that medial is the favored movement direction for the PSM cells, and name this bias a “medial preference”. In kny;tri double mutants, although fewer medial intercalations occurred, the PSM cells still exhibited an obvious medial preference: in 88% of the observed events (n = 41), the lateral neighbor filled the empty space generated by medial intercalation. Therefore, the double-mutant cells were able to distinguish between the medial and lateral directions and preferentially moved medially. This is consistent with the notion that instructive signals other than noncanonical Wnt signaling provide cues to define the directionality of C&E movements (Sepich et al., 2005; Solnica-Krezel, 2006).
To date, most described cellular behaviors contributing to C&E occur within a plane of a single cell layer (Keller et al., 2000; Myers et al., 2002). Interestingly, we noted PSM cells entering or leaving the analyzed mesodermal cell layer during C&E (Fig. 2 A). The frequencies of both cell entry and exit events were reduced in the double mutants (entry, 14%; exit, 13%) compared with WT (entry, 21%; exit, 21%; P < 0.05). To enter or leave a cell layer, cells move between the cells in a deeper or more superficial layer, so-called radial intercalation behavior (Keller et al., 2003). Radial intercalation is best known for its role in epiboly movements that spread and thin the blastoderm during gastrulation (Warga and Kimmel, 1990; Keller et al., 2003). We did not observe evident changes in the total cell number or thickness of the analyzed medial PSM during the recordings of WT or double-mutant embryos, probably because the cell entry and exit events occurred at comparable frequencies, thus balancing each other.
During epiboly, radial intercalation occurs in a random fashion with respect to the AP and ML embryonic axes, resulting in isotropic tissue expansion (Warga and Kimmel, 1990; Keller et al., 2003). However, radial intercalation was also observed during the AP tissue elongation in the early frog gastrula (Wilson et al., 1989; Wilson and Keller, 1991), and was shown to contribute to tissue extension at the posterior edge of the somitic mesoderm in X. laevis neurula explants (Wilson et al., 1989). Keller and colleagues thus hypothesized that radial intercalation should be polarized to produce an anisotropic tissue expansion, whereby tissue expands more along one dimension than another (Wilson et al., 1989; Wilson and Keller, 1991). Our examination of C&E movements during zebrafish gastrulation revealed three types of radial intercalations when a cell enters a different cell layer within the PSM (Video 2, available at http://www.jcb.org/cgi/content/full/jcb.200704150/DC1). First, coordinated radial/medial intercalation: a cell enters the analyzed cell layer at random positions, but immediately intercalates medially (Fig. 2 C). This behavior introduces new cells in the AP dimension, thus contributing to AP extension. Only at low frequency (<4%, Fig. 2 F), we observed coordinated radial/lateral intercalation that occurred in the opposite direction. Second, radial AP intercalation: a new cell intercalates, taking a position between two anterior and posterior neighbors (Fig. 2 D). This behavior also promotes AP extension. Third, radial ML intercalation: a new cell intercalates, separating two medial and lateral neighbors (Fig. 2 E). This behavior leads to ML expansion, thus counteracting C&E movements. Interestingly, WT cells exhibited a strong bias toward the behaviors that promote AP extension: among the cells entering the analyzed layer, 35% of them underwent coordinated radial/medial intercalation, 53% performed radial AP intercalation, but only 9% entered by means of radial ML intercalation (Fig. 2, C–F). In kny;tri double mutants, the frequencies of both coordinated radial/medial intercalation and radial AP intercalation were reduced compared with WT (Fig. 2, C and D). Conversely, there was a significant increase in the frequency of radial ML intercalation in the double mutants (Fig. 2 E). Therefore, the bias of radial intercalations toward the types that promote AP extension was largely lost in kny;tri mutants (Fig. 2 F). To test whether the AP bias of radial intercalations requires noncanonical Wnt signaling in general, we examined the cell intercalation behaviors in embryos expressing Xdd1, a truncated form of X. laevis Dsh that specifically blocks noncanonical Wnt pathway and impairs C&E movements in frog and zebrafish (Wallingford et al., 2000; Jessen et al., 2002). Similar to the observations in kny;tri double mutants, in the Xdd1-expressing embryos, the frequency of radial ML intercalation was greatly increased and the AP bias of radial intercalations was lost (Fig. 2 F; 5 embryos, 164 cells).
We also investigated whether the events of cells leaving the analyzed layer occurred in a polarized manner. Arguing against this notion, WT cells exited the analyzed layer from between either their AP or ML neighbors at similar frequencies (61 exit events; Video 3, available at http://www.jcb.org/cgi/content/full/jcb.200704150/DC1), and the double-mutant cells did not behave differently from WT (43 exit events; unpublished data).
In summary, our time-lapse analyses showed that several polarized cellular behaviors, including planar medial and polarized radial intercalations, occurred during and likely contributed to the C&E movements of the medial PSM. In kny;tri double mutants where both intercalation behaviors were affected, the tissue morphogenesis was greatly compromised.
Computational modeling predicts that multiple cell intercalation behaviors cooperate to underlie the medial PSM C&E
Our observation of multiple cell intercalations occurring during the medial PSM C&E is unexpected and contrasts the previous reports that C&E movements within each distinct region of the zebrafish gastrula are driven by one predominant cell movement behavior (Myers et al., 2002). Hence, it is important to understand the relative contribution of different intercalation behaviors to C&E movements. Direct in vivo analyses cannot address this issue because cells are engaged in various movement behaviors simultaneously, and are changing shape, size, and protrusive activities over time. Computational models have been used to assess how individual components of a complex biological system interact with each other to produce a specific result (Endy and Brent, 2001). Therefore, we developed a computational model to query the contributions of individual cell intercalation behaviors to C&E and to investigate whether the defects in cell intercalations accounted for the impaired C&E movements in kny;tri double mutants. Previous computational studies have evaluated the roles of cellular adhesion, protrusive activities, and cell shape changes in C&E (Weliky et al., 1991; Zajac et al., 2003; Brodland, 2006). In this work, we did not aim to achieve a comprehensive model of C&E movements. Rather, we queried the contribution of cell rearrangements to this process independent of other variables, and assumed that cells did not change shape or size in the simulation. Because only one or two proliferation events were observed in the analyzed populations in WT and the double mutants during the time-lapse recordings (unpublished data), we did not include cell divisions in the simulation. The simulation initiated with 48 cells arranged in a two-dimensional 6 × 8 lattice, representing the layer of the analyzed cell population in vivo (Fig. 3 A). The probabilities of specific intercalation behaviors that each cell would perform in the simulation were based on the frequencies obtained from the time-lapse analyses. Neighbors of the intercalating cells would move to accommodate intercalation events in directions according to the in vivo observations. The C&E rates of the simulated tissue were assessed by the changes in the average cell numbers along the AP and ML dimensions from the beginning to the end of the simulation. The detailed rules implemented in the simulation are described in the Materials and methods.
Figure 3.

Computational modeling of cell intercalation behaviors during the medial PSM C&E. (A) Tissue shape changes predicted by the control simulation. Each blue block represents a single cell. (B) Quantitative comparison of the C&E rates calculated from the WT time-lapse analyses and the control simulations. Error bars represent the standard error. P > 0.3, simulated results vs. in vivo observation. (C–F) Comparison of the results from the control simulations and the simulations in which the cell behaviors were modified based on the kny;tri double-mutant data in one of the four ways: reducing the total amount of intercalations (C); increasing radial ML intercalation (D); reducing planar medial, radial AP, and coordinated radial/medial intercalations (E); and reducing planar medial, radial AP, and coordinated radial/medial intercalations, while increasing radial ML intercalation (F). 20 independent simulations were performed for the control and each modification. Error bars represent the standard error. A, anterior; M, medial. *, P < 0.05; **, P < 0.005; ***, P < 0.0005.
To determine whether the observed cell intercalations are capable of producing C&E, we applied the frequencies of intercalation behaviors observed in WT to the simulation. The resulting C&E rates were consistent with the in vivo analyses (Fig. 3 B; P > 0.3), indicating that the cell behaviors and rules implemented in the simulation are sufficient to generate C&E of the medial PSM.
Our time-lapse analyses of kny;tri double mutants correlated the impaired C&E movements with significant reduction of cell rearrangements and changes in the frequencies of individual intercalation behaviors. First, to examine whether the overall reduction of cell intercalations was responsible for the C&E defects in the double mutants, we increased the probability of cells “not intercalating” to the double-mutant level (from 34 to 60%), while preserving the WT ratios for the relative probabilities of individual cell intercalations. This modification did not significantly reduce the C&E rates (Fig. 3 C; P > 0.07), revealing that fewer cell intercalations alone cannot account for the defective C&E in kny;tri double mutants.
To investigate the contribution of individual intercalation behaviors to C&E, we modified the probability of one behavior at a time by applying the double-mutant data, and assessed how each modification affected the simulation result. We identified three types of radial intercalations by which cells entered a different cell layer within the PSM: coordinated radial/medial intercalation, radial AP intercalation, and radial ML intercalation. WT cells exhibited a strong bias for the first two behaviors that promote AP extension, and such bias was lost in the double mutants (Fig. 2 F). When we increased the probability of radial ML intercalation to the double-mutant level in the simulation, the resulting convergence rate was significantly reduced compared with the control simulation, whereas extension was only modestly affected (Fig. 3 D; P > 0.2). Therefore, limiting radial ML intercalation is essential for convergence, but not extension.
Planar medial intercalation, radial AP intercalation, and coordinated radial/medial intercalation promote AP extension, and their frequencies were decreased in kny;tri double mutants (Fig. 2). Although reducing the probabilities of these behaviors independently in the simulations only caused a mild reduction of extension (P > 0.1; unpublished data), modification of all three behaviors in a single simulation specifically blocked tissue extension (Fig. 3 E). Thus, these three behaviors contribute additively to the extension of the medial PSM.
Finally, when the probabilities of both planar medial and polarized radial intercalations were modified in the same simulation, convergence was greatly reduced and extension was completely inhibited in the simulated tissue (Fig. 3 F). This indicates that planar medial and polarized radial intercalations cooperate to contribute to C&E of the medial PSM. Notably, modification of intercalation behaviors alone in the simulation caused less severe C&E defects compared with our observation in kny;tri double mutants (Fig. 3 F), revealing that additional cellular defects may impair the medial PSM C&E in the double mutants.
Non-canonical Wnt components Pk and Dsh are localized asymmetrically in the dorsal mesoderm during C&E gastrulation movements
Our modeling analyses indicate that the medial PSM C&E is achieved by the cooperation of planar medial and polarized radial intercalation behaviors. It is noteworthy that both intercalation behaviors preferentially separate anterior and posterior neighbors in one cell layer (Fig. 2, B–E). This suggests that within the same cell layer, the contacts between AP neighboring cells may be different from the ML neighbor contacts, providing a mechanism for the preferential separation of anterior and posterior neighbors during cell intercalations. In embryos deficient in noncanonical Wnt signaling, cells underwent fewer medial intercalations and lost the AP bias of radial intercalations (Fig. 2 F). We therefore propose that noncanonical Wnt signaling is required not only for the ML orientation and elongation of the mesodermal cell body and the elaboration of ML cellular protrusions (Wallingford et al., 2000; Topczewski et al., 2001; Jessen et al., 2002), but also for defining unique properties of anterior and posterior cell edges that bias the orientation of planar and radial intercalations.
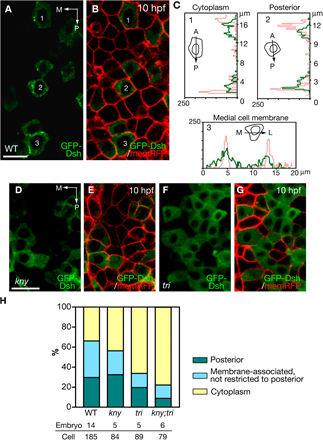
In D. melanogaster, PCP components are localized asymmetrically to define planar cell polarity (Tree et al., 2002; Bastock et al., 2003; Klein and Mlodzik, 2005). To identify the molecular signature of anterior and posterior cell edges that contribute to the biased cell intercalations during zebrafish C&E and investigate the involvement of noncanonical Wnt signaling, we examined the localization of noncanonical Wnt components at the end of gastrulation. A GFP-tagged fly Pk fusion protein (Jenny et al., 2003; Jiang et al., 2005; Ciruna et al., 2006) has been shown to localize at the anterior edge of the notochord and neural tube cells in zebrafish during somitogenesis (Ciruna et al., 2006). Two zebrafish pk genes, pk1 and pk2, are expressed in the dorsal gastrula during late gastrulation. Whereas pk2 transcript is enriched in the axial mesoderm, pk1 expression is first detected in the axial and presomitic mesoderm at late gastrulation, but becomes restricted to the PSM during early somitogenesis (Carreira-Barbosa et al., 2003; Veeman et al., 2003). Thus, the dynamic expression of pk genes in the axial and presomitic mesoderm during gastrulation might be correlated with the different patterns of C&E movements in these two tissues. To study the subcellular localization of Pk during zebrafish C&E, we mosaically expressed the fly GFP-Pk fusion protein by RNA injection and collected confocal images of the dorsal mesoderm in live embryos at the tailbud stage (10 hpf), when the axial and medial PSM cells are mediolaterally elongated and undergo active cell intercalations (Myers et al., 2002; Glickman et al., 2003). The fly GFP-Pk fusion protein was previously shown to be functional during zebrafish gastrulation, but could cause C&E movement defects upon overexpression (Ciruna et al., 2006), which is also typical for other PCP pathway components such as Tri/Stbm/Vangl2 (Jessen et al., 2002). We injected a low dose of synthetic RNA into the embryos so that the GFP-Pk expressed did not detectably alter the ML cell polarity (see Materials and methods; and Fig. S1, available at http://www.jcb.org/cgi/content/full/jcb.200704150/DC1). In the axial mesoderm and medial PSM of the WT embryos, GFP-Pk was expressed in dynamic puncta next to the anterior cell membranes (Fig. 4, A [arrows] and H; Video 4, available at http://www.jcb.org/cgi/content/full/jcb.200704150/DC1), similar to its distribution in the notochord and neural tube cells during somitogenesis (Ciruna et al., 2006). Two observations link the asymmetrical subcellular distribution of GFP-Pk to the cell polarity that is dependent on noncanonical Wnt signaling. First, the anterior localization of GFP-Pk was correlated with the ML elongation of the dorsal mesodermal cells (Fig. 4 C, arrows), as the GFP-Pk puncta were distributed randomly within these cells at 75% epiboly (8 hpf) before they became mediolaterally elongated (Fig. 4 B, arrow) (Myers et al., 2002). Second, in kny and tri individual mutants, the GFP-Pk puncta were not restricted to the anterior cell membranes (Fig. 4, D and E [arrows], and H), whereas in kny;tri double mutants, GFP-Pk was mainly detected in the cytoplasm (Fig. 4, F and H). Extending the previous observation that the anterior localization of GFP-Pk puncta is abolished in the neural tube cells in maternal-zygotic tri mutants (Ciruna et al., 2006), we found that the anterior localization of GFP-Pk requires both Kny and Tri function. In kny and tri individual mutants, the presence of maternal Kny and Tri proteins enables recruitment of GFP-Pk to the cell membrane, but is not sufficient for its anterior-restricted localization. In contrast, in kny;tri double mutants lacking the functions of both molecules, GFP-Pk fails to be recruited to the membrane. The anterior localization of GFP-Pk was also greatly reduced in the embryos expressing dominant-negative Dsh, Xdd1 (Fig. 4, G and H). This is consistent with the observation in the fly wing that Pk fails to distribute asymmetrically in the dsh mutant background (Tree et al., 2002), and further supports the notion that the anterior localization of Pk during zebrafish C&E is dependent on the normal transduction of noncanonical Wnt signaling.
Figure 4.

Subcellular localization of GFP-Pk during C&E. (A, and D–G) Confocal images of the dorsal mesoderm in live embryos expressing GFP-Pk and membrane-RFP (memRFP) at the tailbud stage (10 hpf). Dashed lines illustrate the boundary between the axial and presomitic mesoderm. (B and C) GFP-Pk localization in the dorsal mesoderm of the same WT embryo at 8 hpf (B) and 10 hpf (C). (H) Quantification of GFP-Pk localization at the tailbud stage in WT and embryos deficient in noncanonical Wnt signaling (Materials and methods). (A–G) Dorsal views. A, anterior; P, posterior; Axial, axial mesoderm. Bar, 20 μm.
In the fly wing epithelium, Stbm/Vangl2 and Pk are distributed at the proximal cell membrane, forming a complex that antagonizes the Frizzled/Dsh complex localized at the distal cell membrane (Tree et al., 2002; Klein and Mlodzik, 2005). To examine the subcellular localization of Dsh during zebrafish C&E, we expressed GFP-tagged X. laevis Dsh in a mosaic fashion without causing obvious effect on the ML elongation and orientation of the labeled cells (Fig. S1) (Rothbacher et al., 2000; Wallingford et al., 2000). In agreement with the notion that activation of the PCP pathway promotes Dsh recruitment to the cell membrane (Wallingford et al., 2000; Adler, 2002; Klein and Mlodzik, 2005), GFP-Dsh was mainly expressed along the cell membrane in the dorsal mesoderm at the tailbud stage (10 hpf) (Figs. 5, A and G; Fig. S2, available at http://www.jcb.org/cgi/content/full/jcb.200704150/DC1), when noncanonical Wnt signaling regulates C&E movements of this tissue (Myers et al., 2002). The juxtamembrane localization of GFP-Dsh was correlated with the ML elongation of the dorsal mesodermal cells (Fig. 5, E, F, E′, and F′). Surprisingly, in the axial mesoderm, 64% of the labeled cells showed enrichment of GFP-Dsh specifically along the posterior cell membrane, opposite to where GFP-Pk was localized (Fig. 5, A, A′, and G). In kny individual mutants, although GFP-Dsh was localized to the cell membrane in 60% of the labeled axial mesodermal cells, fewer cells exhibited posterior-restricted GFP-Dsh expression compared with WT (Fig. 5, C, C′, and G; P < 0.02). The membrane localization of GFP-Dsh was greatly reduced in the axial mesoderm of tri individual mutants (Fig. 5, D, D′, and G; P < 0.03), and largely absent in kny;tri double mutants (Fig. 5, B, B′, and G; P < 2 × 10⁻⁷), consistent with the previous reports that Tri/Stbm/Vangl2 is required for the recruitment of Dsh to the cell membrane (Park and Moon, 2002; Bastock et al., 2003).
Figure 5.

Subcellular localization of GFP-Dsh in the axial mesoderm during C&E. (A–D) Confocal images of the axial mesoderm in live embryos expressing GFP-Dsh at the tailbud stage (10 hpf). (A′–D′) Confocal images of the same embryos as shown in A–D, but colabeled with memRFP. Histograms of the fluorescent intensity of the selected cells (*) are shown in the right panels. Green lines represent the fluorescent intensity of GFP-Dsh and the red lines represent the intensity of memRFP. (E, F, E′, and F′) GFP-Dsh localization in the axial mesoderm of the same WT embryo. Arrows show that GFP-Dsh was mainly localized in the cytoplasm at 75% epiboly (8 hpf) (E and E′), but became restricted to the posterior cell membrane at the tailbud stage (F and F′). (G) Quantification of GFP-Dsh localization in the axial mesoderm at the tailbud stage (Materials and methods). (A–F and A′–F′) Dorsal views. A, anterior; P, posterior. Bar, 20 μm.
In the medial PSM, GFP-Dsh localization varied from cell to cell. In WT, GFP-Dsh was detected along the cell membrane in 65% of the labeled cells, but only 30% of them showed posterior-restricted GFP-Dsh localization (Fig. S2). The membrane localization of GFP-Dsh was reduced in the medial PSM of the individual mutants and largely lost in the double mutants (Fig. S2). Given that multiple dynamic cell behaviors occur during the medial PSM C&E (Fig. 2), we hypothesize that the posterior localization of GFP-Dsh might be a transient event and is correlated with specific cell behaviors. Consistent with this notion, the posterior localization of GFP-Dsh was more prominent in the axial mesoderm where every cell was engaged in ML intercalation (Fig. 5 G) (Glickman et al., 2003). During chemotaxis, transient and dynamic protein localization occurs at the leading edge of chemotactic cells in response to chemoattractants, and activates the downstream cellular machinery regulating directed cell migration (Charest and Firtel, 2006). In what manner the transient asymmetrical localization of Dsh seen in the medial PSM in zebrafish is linked to the polarized intercalation behaviors of the PSM cells requires further investigation.
Discussion
Combining in vivo and in silico approaches, we performed a comprehensive analysis of the cellular behaviors underlying the C&E movements of the medial PSM during zebrafish gastrulation. Unlike the adjacent axial mesoderm, where C&E is driven mainly by ML intercalation (Glickman et al., 2003), the medial PSM C&E is achieved by cooperation of multiple cell intercalation behaviors: planar medial, radial AP, and coordinated radial/medial intercalations contribute additively to tissue extension, whereas limiting radial ML intercalation is crucial for convergence. The differences in the repertoire of cell movement behaviors used in the axial and presomitic mesoderm can account for the distinct rates of C&E movements previously reported for these two tissues (Wood and Thorogood, 1994; Glickman et al., 2003).
In addition, we provide quantitative evidence to demonstrate that in the medial PSM of WT embryos, the radial intercalations preferentially separate anterior and posterior neighbors, and such anteroposteriorly polarized radial intercalations are capable of generating anisotropic tissue expansion. Our data are consistent with and extend the previous observation that radial intercalations contribute to tissue extension in X. laevis explants by Keller and colleagues. These authors hypothesized that radial intercalation should be polarized to produce an anisotropic expansion (Keller and Tibbetts, 1989; Wilson et al., 1989). In D. melanogaster, PCP pathway establishes cell polarity within the epithelial sheets (Adler, 2002; Klein and Mlodzik, 2005). Likewise, in vertebrates, noncanonical Wnt signaling regulates cell behaviors within a plane of mesenchymal or epithelial layer, including directed migration of mesenchymal cells (Jessen et al., 2002; Ulrich et al., 2003), ML cell intercalation (Wallingford et al., 2000), and oriented cell division in the neuroectoderm (Gong et al., 2004). Our observations that both kny;tri double mutants and embryos expressing dominant-negative Dsh lost the AP bias of radial intercalations provide the first evidence that noncanonical Wnt signaling polarizes cell behaviors between different PSM cell layers.
Toward identifying the molecular mechanisms underlying the anteroposteriorly polarized cell intercalations, we revealed asymmetrical localization of two noncanonical Wnt components, Pk and Dsh, in the dorsal mesoderm during zebrafish gastrulation (Figs. 4 and Figs.5). Strikingly, the anterior localization of Pk and posterior localization of Dsh during zebrafish C&E are reminiscent of the localization of these two proteins to the opposite cell edges in the fly wing cells, where Pk exhibits proximal and Dsh shows distal distribution (Adler, 2002; Bastock et al., 2003; Klein and Mlodzik, 2005). Several recent studies provide support for the notion that the interactions between noncanonical Wnt components are conserved between fly and vertebrates. Similar to the observation in fly, in X. laevis, Dsh is recruited to the cell membrane upon the activation of noncanonical Wnt signaling (Rothbacher et al., 2000; Wallingford et al., 2000). Tri/Stbm/Vangl2 forms a complex with Pk at the cell membrane (Jenny et al., 2003). Pk in turn inhibits Frizzled-mediated Dsh localization to the membrane, likely by moving Dsh from the membrane to the cytoplasm, or by directly binding to and degrading Dsh (Carreira-Barbosa et al., 2003). In combining with these results, our fusion protein localization analyses provide strong evidence to support the notion that the molecular mechanisms by which noncanonical Wnt/PCP pathway regulates cell polarity are evolutionarily conserved. Notably, our conclusions on Pk and Dsh localizations are based on the overexpression of GFP fusion proteins upon RNA injection. Although the low amount of RNAs we injected did not have obvious effects on cell polarity, it will be important to extend these analyses using antibodies against the endogenous zebrafish Dsh and Pk proteins.
How does the asymmetrical localization of noncanonical Wnt components contribute to the anteroposteriorly biased orientation of cell intercalations? In D. melanogaster, genes that control AP patterning mediate ML intercalation during germ band extension (Zallen and Wieschaus, 2004). Similarly, it has been proposed that in the X. laevis chordamesoderm, graded activin-like signaling that establishes AP polarity acts in parallel or upstream of noncanonical Wnt signaling to regulate the orientation of ML intercalation (Ninomiya et al., 2004). Our finding of the asymmetrical localization of Pk to the anterior cell edges together with the enrichment of Dsh near the posterior cell membrane suggests that an intrinsic AP polarity is also present in the zebrafish dorsal mesoderm during C&E. In kny and tri individual mutants, as well as in embryos with reduced Dsh activity, the asymmetrical localization of Pk and Dsh was compromised, suggesting that noncanonical Wnt signaling is necessary for the dorsal mesodermal cells to incorporate the AP polarity cues. Non-canonical Wnt signaling has been shown to constrain the lamellipodial protrusions to the ML cell tips, which is essential for ML cell intercalation (Keller et al., 2000; Wallingford et al., 2000). Other reports have connected noncanonical Wnt signaling with intercellular adhesion (Ungar et al., 1995; Ulrich et al., 2005; Witzel et al., 2006), and polarized deposition of extracellular matrix (Goto et al., 2005), processes that also contribute to ML intercalation. We therefore propose that in the dorsal mesoderm of the zebrafish gastrula, AP polarity cues activate noncanonical Wnt signaling along the anterior and posterior cell edges. This in turn provides positional information to define the mediolaterally biased protrusive activity and differential cell adhesions that lead to polarized cell intercalations. Although previous studies emphasized the roles of noncanonical Wnt signaling in controlling cell shape and orientation, and formation of polarized cellular protrusions, our work underscores the significance of this pathway in defining distinct properties of anterior and posterior cell surfaces to bias cell intercalations during C&E.
Materials and methods
Zebrafish maintenance, embryo generation, and staging
The WT, knym119/+, trim209/+, and knym119/+;trim209/+ mutant zebrafish strains were maintained as described previously (Solnica-Krezel et al., 1994). Embryos were obtained from natural matings and morphologically staged as described (Kimmel et al., 1995). The genotypes of the embryos were determined by described morphological phenotypes (Marlow et al., 1998; Henry et al., 2000; Yin and Solnica-Krezel, 2007).
Time-lapse recording and analysis
Embryos were manually dechorinated at 90% epiboly (9 hpf) and mounted, dorsal side downward, in 0.8% low-melting agarose in glass-bottomed 35-mm Petri dishes as described (Sepich et al., 2005). Multi-plane Nomarski stacks were collected at 1.5-min intervals for 90 min from 90% epiboly to the one-somite stage (10.5 hpf) using Openlab software (Improvision). All the time-lapse images were captured using a 40×/1.30 NA air objective mounted on a motorized Axiovert 200 microscope (Carl Zeiss, Inc.) equipped with an AxioCam digital camera (Carl Zeiss, Inc.), and heated stage and chamber to maintain embryos at 28.5°C. After the recordings, embryos were released from the agarose and allowed to grow in egg water until 24 hpf to determine their genotypes. For each embryo, only the cells within the intermediate depth of the PSM were analyzed. Object-Image (Norbert Vischer; http://simon.bio.uva.nl/object-image.html) was used to label and track cells. Data were exported to Excel (Microsoft) for calculation of the movement speeds and frequencies of different intercalation behaviors. Statistical analyses were performed using two-tailed t test.
The C&E rates were calculated as follows:
 |
 |
 |
PIV analyses
Velocimetric assessment of morphogenetic movements was performed as described (Raffel et al., 1998). The Nomarski time-lapse images were analyzed by using the MATPIV software package (J.K. Sveen, University of Oslo, Oslo, Norway). In brief, the algorithm first divides each time-lapse image into many small interrogation windows of a few tenths of pixels. Each window covers a surface of the scale of 3–5 cells. The choice of window size includes a minimum of cells to deal with tissue behaviors, but retaining a local measurement of the velocity. The interrogation windows are partially overlapping and differ by the scale of a single cell. Next, for each window, the algorithm estimates the best displacement of the window pattern by statistical correlation of two successive frames, which gives an estimation of the velocity vector for the time interval spanned by the frames.
RNA microinjections
To obtain mosaic expression of GFP-Pk or GFP-Dsh in the embryo, 200 pg of RNA encoding membrane-RFP (the Ras membrane-localization sequence [CAAX] fused to the C terminus of RFP) was first injected into the embryos at the one-cell stage (Wallingford et al., 2000). At the 16-cell stage (1.5 hpf), 15 pg of RNA encoding GFP-tagged D. melanogaster Pk (Jenny et al., 2003; Ciruna et al., 2006), or 30 pg of RNA encoding GFP-tagged X. laevis Dsh (Rothbacher et al., 2000; Wallingford et al., 2000), was injected into one of the blastomeres. A Venus-tagged zebrafish Pk1 has been recently reported (Carreira-Barbosa et al., 2003). However, due to the low fluorescent intensity of the Venus protein, we were unable to monitor the localization of Venus-Pk1 in live embryos by injecting 25 pg of synthetic RNA, a dose that was shown not to interfere with the ML cell polarity (Carreira-Barbosa et al., 2003). To achieve ubiquitous overexpression of Xdd1 in the embryo (Wallingford et al., 2000), 50 pg of synthetic RNA was injected into the WT embryos at the one-cell stage. Synthesis of the RNAs was described previously (Marlow et al., 1998).
Confocal imaging
To visualize the subcellular localization of GFP-Pk and GFP-Dsh, live embryos expressing membrane-RFP and either of the fusion proteins were mounted, dorsal side downward, in 0.8% low-melting agarose in glass-bottomed 35-mm Petri dishes. Confocal z-stacks were collected along the dorsoventral embryonic axis at the end of gastrulation (10 hpf) on a LSM 510 laser scanning inverted microscope (Carl Zeiss, Inc.), using a 40×/1.30 NA oil objective with zoom 2. The confocal microscope is equipped with a heated stage and chamber to maintain the embryos at 28.5°C. Three-dimensional projections were made from the z-stacks so that the localization of GFP signal within the entire cell body could be visualized. Images were processed using Volocity (Improvision). The cell length-to-width ratio was measured by using Object-Image. The orientation and angular deviation were analyzed using VectorRose (P.A. Zippi; http://pazsoftware.com/). The histogram of green (CY2) and red (CY3) fluorescent intensity was measured using LSM Examiner (Carl Zeiss, Inc.). To investigate the correlation between the ML cell elongation and the localization of GFP-Pk and GFP-Dsh, confocal images of the dorsal mesoderm in four live WT embryos that mosaically expressed either fusion protein were collected at 8 and 10 hpf.
Computational modeling of the cell intercalation behaviors during C&E
Modeling design.
To analyze the contributions of individual intercalation behaviors to the C&E movements of the medial PSM, we generated a computational model using the Matlab software package. We model cells in a single cell layer as occupied nodes of a two-dimensional 6 × 8 lattice. Each cell occupies a unique node (x,y), where x refers to a specific row and y refers to a specific column. The left side of the lattice is defined as the axial-PSM boundary and we refer to this side as medial. The value of each node represents the number of cells occupying the node: “1” for one cell, “2” for two cells, and “0” for an empty space. The maximum number of cells occupying a node is two. Referring to the frequencies with which different intercalation behaviors occurred during the time-lapse recordings, 30 min is the approximate time scale over which at least one cell intercalation event occurs. Therefore, we define three time steps in the simulation, each representing 30 min, in which intercalation events and subsequent cell rearrangements occur.
Net dorsal migration.
Our time-lapse analyses showed that the entire analyzed cell population moved toward the axial mesoderm. No other cell rearrangement was observed at the cell positions where cells moved medially without the intercalations described in the text. Because all cells are moving together, there is no net relative motion between cells. In the simulation, we assume that every cell moves medially at the same speed unless it is chosen to undergo a certain intercalation behavior. We define an additional event, default planar medial migration, in which cells do not intercalate and remain in their original nodes. Although this net medial migration does not affect the relative position of cells because all cells are moving at a uniform velocity, it may bias the motion of neighboring cell rearrangements after intercalations occur.
Intercalation events.
In time-lapse analyses we observed seven intercalation behaviors: planar medial intercalation and planar lateral intercalation in which cells move within a single cell layer, cells leaving the analyzed cell layer, and radial AP intercalation, radial ML intercalation, coordinated radial/medial intercalation and coordinated radial/lateral intercalation by which cells enter the cell layer. We do not include planar lateral intercalation or coordinated radial/lateral intercalation in the simulations because they occur at very low frequencies (<4%) irrespective of the embryo genotype. We subdivide the remaining five types of intercalation behaviors into three lattice events: cells moving within the analyzed cell layer (planar medial intercalation), cells moving out of the analyzed cell layer, and cells entering the cell layer (radial AP intercalation, radial ML intercalation, and coordinated radial/medial intercalation). In each simulation time step, each cell has a probability of moving within the cell layer or leaving the cell layer, and each node has a probability that a new cell appears.
Probabilities of lattice events were deduced from the time-lapse analyses. For example, the time-lapse analyses of the WT embryos showed that within the 90-min time scale, the frequencies of planar medial intercalation or a cell leaving the analyzed layer were 24% and 21% per cell, respectively, corresponding to probabilities of 8% and 7% per time step per cell in the simulation, respectively. The probability of a new cell appearing within the layer is 21%, corresponding to a probability of 0.15% (7%/48) per time step per node. Lattice events are implemented according to the following rules:
Planar medial intercalation: If a cell is assigned a planar medial intercalation event, it will be removed from the chosen node to the immediate medial node if the medial node has fewer than two cells. If the medial node already has two cells, which is the maximum number of cells a node can hold, the cell will remain in its original position and the intercalation behavior will not occur. Because we define the left edge of the lattice as the axial-PSM boundary, according to the experimental observation, the probability for cells in the left-most column (i.e., y = 1) to undergo medial intercalation is defined as 0.
Cell leaving the analyzed layer: If a cell is assigned the behavior to leave the analyzed cell layer, it will be deleted from the chosen node.
Cell entering the analyzed layer: If a node is assigned the behavior of a cell entering the analyzed plane, one cell is added to the chosen node if the node has fewer than two cells. If the node already has two cells, which is the maximum number of cells a node can hold, no new cell will be added.
Cell rearrangements.
At the simulation onset, every node of the lattice is occupied by exactly one cell. However, in the course of simulation, cell rearrangements result in local inhomogeneities. For instance, planar medial intercalations and cells entering the analyzed layer produce nodes with more than one cell, whereas planar medial intercalations and cells leaving the analyzed layer generate holes within the lattice. In the embryo, by contrast, we observed a confluent cell layer with no holes and rare double occupancies. To produce a more realistic representation of the in vivo situation, we model random cell motions in response to the intercalations, which simulates the way neighboring cells accommodate the intercalating cells. In each time step, after all lattice events have occurred, each node is chosen randomly. If the value of a node is greater than one, one of the cells in that node will move one node medial, lateral, up or down. If the value of a node is less than one, a cell from an adjacent node anterior, posterior, medial, or lateral will move to fill that node. In the case of no bias, the probability of a cell at a high-density node choosing an AP or an ML movement direction is equal (0.5) and the probability of a low-density node being occupied by a neighboring cell of anterior, posterior, medial, or lateral direction is equal (0.25).
Anteroposteriorly biased radial intercalation.
We distinguished three types of radial intercalations when a cell entered the analyzed layer, based on how they separate the neighboring cells: radial AP or ML intercalation, or coordinated radial/medial intercalation, respectively. The different types of radial intercalations are modeled by imposing an AP bias in the way cells move away from high-density nodes, which are created by cells entering the analyzed cell layer. To model the anteroposteriorly biased radial intercalation, the probability of a cell at a high-density node to move along the AP dimension is assigned the probability BAP. In the WT situation, 35% cell entry occurred by coordinated radial/medial intercalation, 50% by radial AP intercalation, and 9% by radial ML intercalation. Accordingly, in the control simulation, the probability of a cell at a high-density node to move in the AP direction is assigned the probability BAP = 0.90 (BAP = (0.35 + 0.50) / (0.35 + 0.50 + 0.09)).
Medial preference.
During planar medial intercalation, the intercalating cell leaves a hole in the lattice. Our time-lapse analyses showed that lateral neighboring cells often filled the holes generated by medial intercalation events. Thus, we introduce a medial preference to fill in lattice holes. In WT, there is a 96% chance a hole will be filled by the lateral neighbor. Correspondingly, the value of medial preference is 0.96 in WT. In kny;tri double mutants, the value of medial preference is 0.88. When a cell leaves the analyzed cell layer, it also generates a hole in the lattice. According to the in vivo observations, cells exited the analyzed layer from between either their AP or ML neighbors at similar frequencies. Therefore, in the simulation, we assume that after cell exit events, the holes will be filled by the anterior, posterior, medial, or lateral neighbor at equal probabilities (0.25).
Modeling the contributions of individual cell intercalation behaviors to C&E.
To investigate the contributions of different cell intercalation behaviors to C&E, we increase or decrease the probability of one cell behavior at a time while keeping the probabilities of other intercalation behaviors unchanged. Meanwhile, we modify the probability of “no intercalating” events so that the sum of the probabilities of all cell behaviors will always remain 1.
Data analyses.
We quantified the tissue shape changes by measuring the rates of C&E. For each condition (WT control simulation or simulations with the modifications of individual behaviors), 20 simulations were performed. The number of simulations required to evaluate the difference between the control and modified situations was determined by the condition of a vanishing variation of the calculated average with respect to the number of computer runs. The raw data were exported to Excel (Microsoft) for calculation of the average values and standard errors. Statistical analyses were performed using two-tailed t tests.
Online supplemental material
The supplemental material includes two figures and four videos. Fig. S1 shows that the amount of GFP-Pk and GFP-Dsh expressed had no detectable effect on the ML elongation and orientation of the labeled cells. Fig. S2 shows the subcellular distribution of GFP-Dsh in the medial PSM at the tailbud stage. Video 1 is an animation demonstrating the planar medial intercalation and lateral intercalation. Video 2 is an animation demonstrating the three types of radial intercalations by which cells enter the analyzed cell layer. Video 3 is an animation demonstrating the radial intercalations by which cells leave the analyzed cell layer. Video 4 is a time-lapse recording showing the dynamic localization of GFP-Pk puncta (green) at the anterior cell edges in the dorsal mesoderm of a live WT embryo that also expressed membrane-RFP (red). The confocal images were collected at 1-min intervals for 40 min, starting from 9.5 hpf. Online supplemental material is available at http://www.jcb.org/cgi/content/full/jcb.200704150/DC1.
Supplemental Material
Acknowledgments
We would like to thank Drs. O. Pourquie, A.F. Schier, B. Ciruna, M.K. Cooper, F. Marlow, A. Inbal, D. Carlin, and D.S. Sepich for critical comments; and L. Solnica-Krezel laboratory members for technical advice and discussions. We also thank J.P. Wallingford, B. Ciruna, and M. Tada for generous gifts of constructs. We acknowledge excellent fish care by J. Clanton, J. Ruddick, and A. Bradshaw.
This work in the L. Solnica-Krezel laboratory is supported by National Institutes of Health grant GM55101 and Human Frontiers in Science Program (HSFP) RGP14/2006. Work in the E. Farge laboratory is supported by Microsoft Research through the European PhD Scholarship Program, the INSERM and CNRS (ITS2005), and the HSFP.
Abbreviations used in this paper: AP, anteroposterior; C&E, convergence and extension; Dsh, dishevelled; hpf, hours post fertilization; kny, knypek; mem, membrane; ML, mediolateral; PCP, planar cell polarity; PIV, particle image velocimetry; Pk, prickle; PSM, presomitic mesoderm; Stbm, Strabismus; tri, trilobite; Vangl2, Van Gogh-like 2; WT, wild type.
References
- Adler, P.N. 2002. Planar signaling and morphogenesis in Drosophila. Dev. Cell. 2:525–535. [DOI] [PubMed] [Google Scholar]
- Bastock, R., H. Strutt, and D. Strutt. 2003. Strabismus is asymmetrically localised and binds to Prickle and Dishevelled during Drosophila planar polarity patterning. Development. 130:3007–3014. [DOI] [PubMed] [Google Scholar]
- Brodland, G.W. 2006. Do lamellipodia have the mechanical capacity to drive convergent extension? Int. J. Dev. Biol. 50:151–155. [DOI] [PubMed] [Google Scholar]
- Carreira-Barbosa, F., M.L. Concha, M. Takeuchi, N. Ueno, S.W. Wilson, and M. Tada. 2003. Prickle 1 regulates cell movements during gastrulation and neuronal migration in zebrafish. Development. 130:4037–4046. [DOI] [PubMed] [Google Scholar]
- Charest, P.G., and R.A. Firtel. 2006. Feedback signaling controls leading-edge formation during chemotaxis. Curr. Opin. Genet. Dev. 16:339–347. [DOI] [PubMed] [Google Scholar]
- Ciruna, B., A. Jenny, D. Lee, M. Mlodzik, and A.F. Schier. 2006. Planar cell polarity signalling couples cell division and morphogenesis during neurulation. Nature. 439:220–224. [DOI] [PMC free article] [PubMed] [Google Scholar]
- Endy, D., and R. Brent. 2001. Modelling cellular behaviour. Nature. 409:391–395. [DOI] [PubMed] [Google Scholar]
- Glickman, N.S., C.B. Kimmel, M.A. Jones, and R.J. Adams. 2003. Shaping the zebrafish notochord. Development. 130:873–887. [DOI] [PubMed] [Google Scholar]
- Gong, Y., C. Mo, and S.E. Fraser. 2004. Planar cell polarity signalling controls cell division orientation during zebrafish gastrulation. Nature. 430:689–693. [DOI] [PubMed] [Google Scholar]
- Goto, T., L. Davidson, M. Asashima, and R. Keller. 2005. Planar cell polarity genes regulate polarized extracellular matrix deposition during frog gastrulation. Curr. Biol. 15:787–793. [DOI] [PubMed] [Google Scholar]
- Henry, C.A., L.A. Hall, M. Burr Hille, L. Solnica-Krezel, and M.S. Cooper. 2000. Somites in zebrafish doubly mutant for knypek and trilobite form without internal mesenchymal cells or compaction. Curr. Biol. 10:1063–1066. [DOI] [PubMed] [Google Scholar]
- Jenny, A., R.S. Darken, P.A. Wilson, and M. Mlodzik. 2003. Prickle and Strabismus form a functional complex to generate a correct axis during planar cell polarity signaling. EMBO J. 22:4409–4420. [DOI] [PMC free article] [PubMed] [Google Scholar]
- Jessen, J.R., and L. Solnica-Krezel. 2004. Identification and developmental expression pattern of van gogh-like 1, a second zebrafish strabismus homologue. Gene Expr. Patterns. 4:339–344. [DOI] [PubMed] [Google Scholar]
- Jessen, J.R., J. Topczewski, S. Bingham, D.S. Sepich, F. Marlow, A. Chandrasekhar, and L. Solnica-Krezel. 2002. Zebrafish trilobite identifies new roles for Strabismus in gastrulation and neuronal movements. Nat. Cell Biol. 4:610–615. [DOI] [PMC free article] [PubMed] [Google Scholar]
- Jiang, D., E.M. Munro, and W.C. Smith. 2005. Ascidian prickle regulates both mediolateral and anterior-posterior cell polarity of notochord cells. Curr. Biol. 15:79–85. [DOI] [PubMed] [Google Scholar]
- Keller, R., and P. Tibbetts. 1989. Mediolateral cell intercalation in the dorsal, axial mesoderm of Xenopus laevis. Dev. Biol. 131:539–549. [DOI] [PubMed] [Google Scholar]
- Keller, R., L. Davidson, A. Edlund, T. Elul, M. Ezin, D. Shook, and P. Skoglund. 2000. Mechanisms of convergence and extension by cell intercalation. Philos. Trans. R. Soc. Lond. B Biol. Sci. 355:897–922. [DOI] [PMC free article] [PubMed] [Google Scholar]
- Keller, R., L.A. Davidson, and D.R. Shook. 2003. How we are shaped: the biomechanics of gastrulation. Differentiation. 71:171–205. [DOI] [PubMed] [Google Scholar]
- Kimmel, C.B., W.W. Ballard, S.R. Kimmel, B. Ullmann, and T.F. Schilling. 1995. Stages of embryonic development of the zebrafish. Dev. Dyn. 203:253–310. [DOI] [PubMed] [Google Scholar]
- Kinoshita, N., H. Iioka, A. Miyakoshi, and N. Ueno. 2003. PKC delta is essential for Dishevelled function in a noncanonical Wnt pathway that regulates Xenopus convergent extension movements. Genes Dev. 17:1663–1676. [DOI] [PMC free article] [PubMed] [Google Scholar]
- Klein, T.J., and M. Mlodzik. 2005. Planar cell polarization: an emerging model points in the right direction. Annu. Rev. Cell Dev. Biol. 21:155–176. [DOI] [PubMed] [Google Scholar]
- Lin, F., D.S. Sepich, S. Chen, J. Topczewski, C. Yin, L. Solnica-Krezel, and H. Hamm. 2005. Essential roles of G{alpha }12/13 signaling in distinct cell behaviors driving zebrafish convergence and extension gastrulation movements. J. Cell Biol. 169:777–787. [DOI] [PMC free article] [PubMed] [Google Scholar]
- Marlow, F., F. Zwartkruis, J. Malicki, S.C. Neuhauss, L. Abbas, M. Weaver, W. Driever, and L. Solnica-Krezel. 1998. Functional interactions of genes mediating convergent extension, knypek and trilobite, during the partitioning of the eye primordium in zebrafish. Dev. Biol. 203:382–399. [DOI] [PubMed] [Google Scholar]
- Myers, D.C., D.S. Sepich, and L. Solnica-Krezel. 2002. Convergence and extension in vertebrate gastrulae: cell movements according to or in search of identity? Trends Genet. 18:447–455. [DOI] [PubMed] [Google Scholar]
- Ninomiya, H., R.P. Elinson, and R. Winklbauer. 2004. Antero-posterior tissue polarity links mesoderm convergent extension to axial patterning. Nature. 430:364–367. [DOI] [PubMed] [Google Scholar]
- Park, M., and R.T. Moon. 2002. The planar cell-polarity gene stbm regulates cell behaviour and cell fate in vertebrate embryos. Nat. Cell Biol. 4:20–25. [DOI] [PubMed] [Google Scholar]
- Raffel, M., C. Willert, and J. Kompenhans. 1998. Particle Image Velocimetry: A Practical Guide. Springer, Berlin. 253 pp.
- Rothbacher, U., M.N. Laurent, M.A. Deardorff, P.S. Klein, K.W. Cho, and S.E. Fraser. 2000. Dishevelled phosphorylation, subcellular localization and multimerization regulate its role in early embryogenesis. EMBO J. 19:1010–1022. [DOI] [PMC free article] [PubMed] [Google Scholar]
- Sepich, D.S., C. Calmelet, M. Kiskowski, and L. Solnica-Krezel. 2005. Initiation of convergence and extension movements of lateral mesoderm during zebrafish gastrulation. Dev. Dyn. 234:279–292. [DOI] [PubMed] [Google Scholar]
- Solnica-Krezel, L. 2006. Gastrulation in zebrafish–all just about adhesion? Curr. Opin. Genet. Dev. 16:433–441. [DOI] [PubMed] [Google Scholar]
- Solnica-Krezel, L., A.F. Schier, and W. Driever. 1994. Efficient recovery of ENU-induced mutations from the zebrafish germline. Genetics. 136:1401–1420. [DOI] [PMC free article] [PubMed] [Google Scholar]
- Strutt, D.I. 2002. The asymmetric subcellular localisation of components of the planar polarity pathway. Semin. Cell Dev. Biol. 13:225–231. [DOI] [PubMed] [Google Scholar]
- Supatto, W., D. Debarre, B. Moulia, E. Brouzes, J.L. Martin, E. Farge, and E. Beaurepaire. 2005. In vivo modulation of morphogenetic movements in Drosophila embryos with femtosecond laser pulses. Proc. Natl. Acad. Sci. USA. 102:1047–1052. [DOI] [PMC free article] [PubMed] [Google Scholar]
- Topczewski, J., D.S. Sepich, D.C. Myers, C. Walker, A. Amores, Z. Lele, M. Hammerschmidt, J. Postlethwait, and L. Solnica-Krezel. 2001. The zebrafish glypican knypek controls cell polarity during gastrulation movements of convergent extension. Dev. Cell. 1:251–264. [DOI] [PubMed] [Google Scholar]
- Tree, D.R., J.M. Shulman, R. Rousset, M.P. Scott, D. Gubb, and J.D. Axelrod. 2002. Prickle mediates feedback amplification to generate asymmetric planar cell polarity signaling. Cell. 109:371–381. [DOI] [PubMed] [Google Scholar]
- Ulrich, F., M.L. Concha, P.J. Heid, E. Voss, S. Witzel, H. Roehl, M. Tada, S.W. Wilson, R.J. Adams, D.R. Soll, and C.P. Heisenberg. 2003. Slb/Wnt11 controls hypoblast cell migration and morphogenesis at the onset of zebrafish gastrulation. Development. 130:5375–5384. [DOI] [PMC free article] [PubMed] [Google Scholar]
- Ulrich, F., M. Krieg, E.M. Schotz, V. Link, I. Castanon, V. Schnabel, A. Taubenberger, D. Mueller, P.H. Puech, and C.P. Heisenberg. 2005. Wnt11 functions in gastrulation by controlling cell cohesion through Rab5c and E-cadherin. Dev. Cell. 9:555–564. [DOI] [PubMed] [Google Scholar]
- Ungar, A.R., G.M. Kelly, and R.T. Moon. 1995. Wnt4 affects morphogenesis when misexpressed in the zebrafish embryo. Mech. Dev. 52:153–164. [DOI] [PubMed] [Google Scholar]
- Veeman, M.T., D.C. Slusarski, A. Kaykas, S.H. Louie, and R.T. Moon. 2003. Zebrafish prickle, a modulator of noncanonical Wnt/Fz signaling, regulates gastrulation movements. Curr. Biol. 13:680–685. [DOI] [PubMed] [Google Scholar]
- Wallingford, J.B., B.A. Rowning, K.M. Vogeli, U. Rothbacher, S.E. Fraser, and R.M. Harland. 2000. Dishevelled controls cell polarity during Xenopus gastrulation. Nature. 405:81–85. [DOI] [PubMed] [Google Scholar]
- Wallingford, J.B., S.E. Fraser, and R.M. Harland. 2002. Convergent extension: the molecular control of polarized cell movement during embryonic development. Dev. Cell. 2:695–706. [DOI] [PubMed] [Google Scholar]
- Warga, R.M., and C.B. Kimmel. 1990. Cell movements during epiboly and gastrulation in zebrafish. Development. 108:569–580. [DOI] [PubMed] [Google Scholar]
- Weliky, M., S. Minsuk, R. Keller, and G. Oster. 1991. Notochord morphogenesis in Xenopus laevis: simulation of cell behavior underlying tissue convergence and extension. Development. 113:1231–1244. [DOI] [PubMed] [Google Scholar]
- Wilson, P., and R. Keller. 1991. Cell rearrangement during gastrulation of Xenopus: direct observation of cultured explants. Development. 112:289–300. [DOI] [PubMed] [Google Scholar]
- Wilson, P.A., G. Oster, and R. Keller. 1989. Cell rearrangement and segmentation in Xenopus: direct observation of cultured explants. Development. 105:155–166. [DOI] [PubMed] [Google Scholar]
- Witzel, S., V. Zimyanin, F. Carreira-Barbosa, M. Tada, and C.P. Heisenberg. 2006. Wnt11 controls cell contact persistence by local accumulation of Frizzled 7 at the plasma membrane. J. Cell Biol. 175:791–802. [DOI] [PMC free article] [PubMed] [Google Scholar]
- Wood, A., and P. Thorogood. 1994. Patterns of cell behaviour underlying somitogenesis and notochord formation in intact vertebrate embryos. Dev. Dyn. 201:151–167. [DOI] [PubMed] [Google Scholar]
- Yin, C., and L. Solnica-Krezel. 2007. Convergence and extension movements mediate the specification and fate maintenance of zebrafish slow muscle precursors. Dev. Biol. 304:141–155. [DOI] [PubMed] [Google Scholar]
- Zajac, M., G.L. Jones, and J.A. Glazier. 2003. Simulating convergent extension by way of anisotropic differential adhesion. J. Theor. Biol. 222:247–259. [DOI] [PubMed] [Google Scholar]
- Zallen, J.A., and E. Wieschaus. 2004. Patterned gene expression directs bipolar planar polarity in Drosophila. Dev. Cell. 6:343–355. [DOI] [PubMed] [Google Scholar]
Associated Data
This section collects any data citations, data availability statements, or supplementary materials included in this article.