Abstract
Recent development of in vivo microscopy techniques, including green fluorescent proteins, has allowed the visualization of a wide range of dynamic processes in living cells. For quantitative and visual interpretation of such processes, new concepts for time-resolved image analysis and continuous time–space visualization are required. Here, we describe a versatile and fully automated approach consisting of four techniques, namely highly sensitive object detection, fuzzy logic-based dynamic object tracking, computer graphical visualization, and measurement in time–space. Systematic model simulations were performed to evaluate the reliability of the automated object detection and tracking method. To demonstrate potential applications, the method was applied to the analysis of secretory membrane traffic and the functional dynamics of nuclear compartments enriched in pre-mRNA splicing factors.
The development of in vivo microscopy techniques and fluorescent reagents has stimulated interest in studying the dynamics of cellular processes (for review, see refs. 1 and 2). These types of experiments generate large and complex data sets and require tools for visual and quantitative analysis of the observed dynamic processes in space and time.
Imaging fast moving vesicles in living cells at high speed and high spatial resolution generally implies a low signal-to-noise ratio, hampering accurate object detection. As a consequence of the optical aperture problem, tracking of small objects based on visual similarity criteria is difficult because many objects appear very similar (3). Highly sensitive object detection and tracking has been recognized as crucial for an accurate evaluation of such data. However, a quantitative interpretation of trafficking vesicles has been generally based on manual evaluation of a user-biased selection of objects with apparently highest motility. Such an evaluation is very time-consuming and also is limited by the perception of the manual inspector.
Processes in the cell nucleus are much slower and need to be observed over a longer period of time. To avoid disruptions of nuclear processes, the total light exposure during in vivo observation must be minimized. Thus, the signal-to-noise ratio and, more importantly, the number of time series taken in a particular experiment is considerably reduced, leading to a loss in spatio-temporal resolution. Displaying time series as movies is a widely used method for visual interpretation. However, this approach does not improve temporal resolution; that is, additional information about the continuous development of the observed processes between the imaged time steps (subpixel resolution in time) is not obtained. Furthermore, quantitative information is not revealed by such a visual approach. In a first approach to quantitatively describe nuclear dynamics in vivo, single particle tracking (4) has been used to estimate the diffusion of chromatin in living cells of different species (5).
Here, we describe a novel technique for fully automated analysis and time–space visualization of time series from living cells, which involves segmentation and tracking of cellular structures as well as continuous visualization and measurement of quantitative parameters with subpixel resolution in time and space. It will be demonstrated that this approach can reconstruct resolution both in time and space. Hence, quantitative and visual information unachievable with traditional methods can be accessed.
METHODS
Highly Sensitive Object Detection.
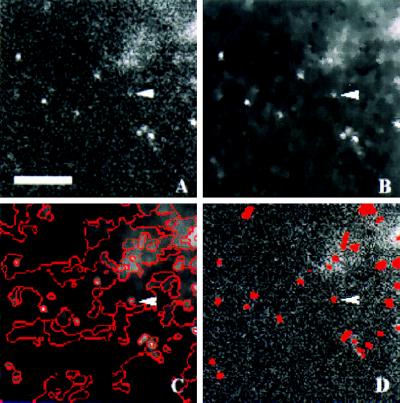
Imaging structures in living cells at high speed and high spatial resolution generally implies a low signal-to-noise ratio (Fig. 1A), hampering accurate object detection. We developed a two-step procedure for object detection. First, a constrained image smoothing by anisotropic diffusion is performed that removes noise without disturbing essential edge information (Fig. 1B). Anisotropic diffusion selectively diffuses an image I in regions where the signal is
 |
of constant mean, in contrast to those regions where a rapid signal change occurs. The smoothing process within the Perona-Malik model is monitored by an abstract time-scale t; that is, higher values imply stronger filtering (6). The diffusion process depends solely on local image properties and is governed by the shape of the so-called “edge-stopping” function g. Here, an object scale-dependent edge-stopping function based on Tukey’s biweight robust estimator ρ was applied because diffusion with the Tukey norm produces sharper boundaries than the Lorentzian (Perona-Malik) norm (7).
 |
 |
 |
For segmentation, an edge-oriented technique using a concept of local orientation was applied. Based on the smoothed representation, candidate edge pixels are determined by a modified form of the standard non-maximum-suppression algorithm (8), including a weak hysteresis formulation. A pixel is classified as an edge pixel if it has a potential predecessor and successor (hysteresis) and if the magnitude of the gradient is maximal compared with the two neighbors in direction of the gradient (nonmaxima suppression). The first condition assists in the formation of unbroken contours whereas the second inhibits multiple responses to a single edge present in the data (Fig. 1C).
Figure 1.
Detection of vesicles in human chromogranin B–GFP-transfected Vero cells. After release of secretion, 40 images were recorded with a time-lapse of 0.5 sec. (A) Unprocessed image at initial time step. (B) After diffusion filtering, the noise level is considerably reduced without loosing significant object information. (C) After edge detection within the filtered image, edges are connected to build regions. (D) Based on the induced region, neighborhood graph vesicles are detected as regions with locally maximal intensity. For comparison, the unprocessed image (A) is overlaid with the detected vesicles false-colored in red. Of note, even weak and noisy vesicle signals (denoted by arrow head) are readily detected. (Bar = 5 μm.)
To obtain closed borderlines, edges were assumed to separate two neighboring homogeneous regions. A region was considered homogenous if its intensity values could be modeled by a Gaussian distribution. Edges were traced based on two parameters, namely local orientation and equal probability of belonging to adjacent regions. For small scale structures, local orientation can be approximated by the direction of gradient. This induces a local coordinate system such that the orthogonal axis aligns with the isophote (line of constant intensity) parallel to the borderline. Because borderlines induce a partition of the image, the second condition implies that edge pixels need to belong to adjacent partitions with equal probability. As a result, closed borderlines enclosing homogeneous regions are obtained. Based on the image partition, a region neighborhood graph is built. Each node of the graph is associated with one region and is assigned morphological parameters such as mean intensity, shape, and size of the respective region. Regions of interest are finally detected as regions with locally maximal intensity (Fig. 1D).
Dynamic Object Tracking.
For dynamic analysis, cellular objects need to be tracked in time–space. Based on object features such as size, shape, total intensity, or texture, tracking an object amounts to finding its best match in consecutive images. According to the continuity equation of optical flow, corresponding objects in consecutive images should be similar. However, distortions in the imaging process, such as noise, bleaching, and illumination differences, as well as changes in focal position might considerably distort the time–space continuity assumption. Standard region-based matching techniques (9) do not give satisfying results in general. Our methods use a fuzzy logic-based system for image sequence analysis (10) based on the assumption that object features are conserved in an indistinct (fuzzy) sense.
Fuzzy theory assumes that all things are matter of degree (11). Fuzzy systems behave as associative memories mapping close inputs to close outputs without requiring a mathematical description of how the output functionally depends on the input. A fuzzy system relies on a linguistic “rule” encoded in a numerical fuzzy associative memory mapping, the fuzzy associative memory rule. According to a dynamic particle model, the velocity of an object is assumed to remain relatively constant. To compare two objects in consecutive images, differences in velocity and deviation of expected extrapolated position from the potential new position are measured. In addition, differences in total intensity and area are computed and translated into fuzzy rules.
Each of these four parameters activates each fuzzy associative memory rule to different degree mANT. The scalar activation value actj of the fuzzy associative memory rules’ consequent equals the minimum of the four antesequent conjuncts’ values. With correlation-product, encoding the value of the consequent is multiplied by the activation value. By computing the fuzzy centroid, the output is defuzzified to a single numerical value, the composite similarity measure csim. Objects in one image correspond to the object with the highest “defuzzified” similarity measure in the consecutive image.
 |
 |
 |
 |
In case no corresponding object with a similarity value below a certain threshold has been found, this object remains unmatched, and the respective object track ends. A correspondence map together with the binarized images are the output of the image sequence analysis module and are used for continuous visualization and quantification in time–space.
Continuous Time–Space Reconstruction.
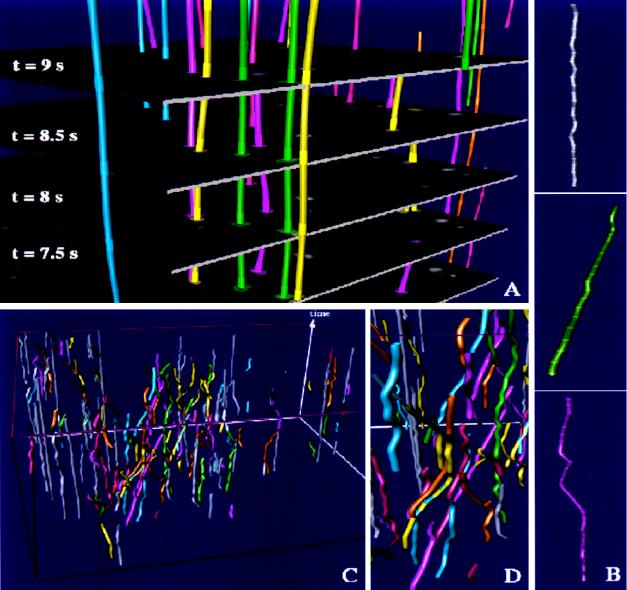
We developed two different approaches for continuous time–space reconstruction. The dynamics of objects with constant shape over time are well described by the dynamic repositioning of their gravity centers. According to the correspondence map provided by the particle, tracking module discrete trajectories are formed in time–space. By cubic b-spline interpolation between corresponding gravity centers, they are subsequently transformed into continuous trajectories (Fig. 2A). Cubic b-splines were chosen for interpolation between corresponding points because they are stable in a geometric sense: That is, they do not tend to oscillations even for a large number of sample points. Furthermore, continuous derivatives exist up to the order of two. Note that the first and second derivative correspond to velocity and acceleration, respectively, which are crucial for quantification of dynamics (see below). The reconstruction procedure was embedded in a powerful multidimensional viewer (Open Inventor Scene Viewer, Silicon Graphics, Mountain View, CA; available for almost all hardware platforms), providing a differentiated visualization of a large number of trajectories in time–space (Fig. 2B).
Figure 2.
Time–space tracking of vesicles for the cell shown in Fig. 1. (A) Tracking and interpolation between consecutive time steps is demonstrated for 4 of 40 sections at indicated time steps. The sequence of original images is embedded into the continuous time–space where time evolves along the vertical axis. The highlighted rings on trajectories correspond to intersections of the image sequence with interpolated trajectories. (B) After time–space interpolation, trajectories were categorized into three classes: stationary (Top), unidirectional (Middle), and bi-directional (Bottom). (C) Visualization of selected trajectories within the Open Inventor Scene Viewer. Fast moving trajectories are color-encoded whereas stationary trajectories are visualized in gray. For display reason, only 20% of the stationary trajectories are shown. (D) Within the scene viewer, the user may view the time–space from different directions and may zoom and assign different colors and textures (not shown) to selected trajectories. A movie showing the multidimensional visualization of trajectories is published as supplemental data on the PNAS web site (www.pnas.org).
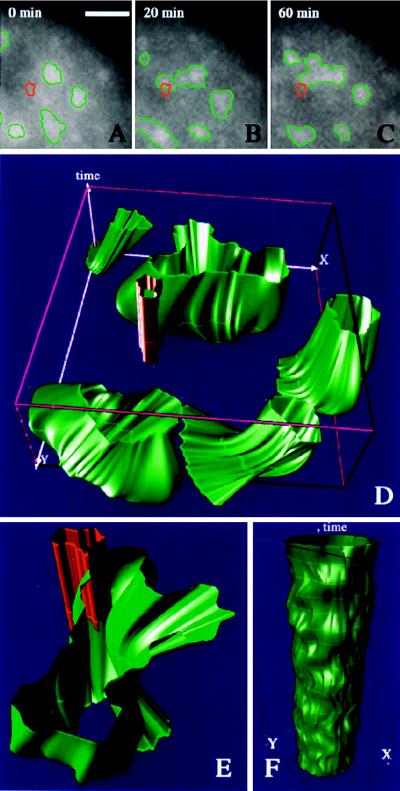
The second approach was designed for visualization of objects dynamically changing their shape over time. This problem accounts for a continuous shape reconstruction from series of two-dimensional images in time–space (12, 13). In a first step, the binarized object representation is transformed into a parameterized contour representation (Fig. 3 A–C). Thereafter, corresponding boundary points in adjacent time sections are found by a global optimization scheme. Under the assumption that the transformation of one contour k1(u) in its adjacent contour k2(v) is sufficiently smooth and leaves the order of contour points,
 |
 |
 |
 |
 |
unchanged, the optimal transformation is found by minimizing the integral over all Euclidean distances between corresponding contour points.
Figure 3.
(A–C) A series of three images after induction of transcription of BK-virus was taken at the indicated time steps. Detected speckles are outlined in green. After in vivo imaging, the induced RNA was visualized by fluorescence in situ hybridization. The outline of detected RNA (red) is visualized within the time series for comparison. (D) Time–space visualization of the dynamic evolution of speckles (green) in relation to the induced RNA signal (red). The highlighted rings along the reconstructed shapes correspond to intersections of the image sequence with interpolated trajectories. (E) A close-up of the speckle intersecting the induced RNA signal. (F) Time–space reconstruction of 20 images (time-lapse: 1 min) from a speckle visualized after inhibition of RNA polymerase II (see the supplemental data on the PNAS web site, www.pnas.org). (Bar = 1 μm.)
For minimization of this energy term, a recursive contour splitting approach was chosen. A continuous surface reconstruction in time–space is obtained by b-spline interpolation of corresponding boundary points (Fig. 3D) and is visualized within the graphical scene viewer. Triangles are essential primitives for computer graphical display. Hence, continuous surfaces need to be approximated by triangular meshes. To reduce the complexity of the triangle mesh while maintaining a close approximation to the original b-spline interpolation, a multiresolution strategy for visualization was developed. At each level of resolution, triangles are formed according to the correspondence map in time–space. To obtain a homogenous triangulation in time–space, a triangle is further subdivided only if its maximal displacement from the b-spline interpolated surface exceeds a preset threshold (14).
Quantitative Measurements.
Although multidimensional visualization is crucial for a qualitative evaluation of dynamic processes, morphological and dynamic parameters are required for quantitative measurements. Based on object outlines and the time–space correspondence map, a quantification module was developed. Within this module, morphological parameters such as size and shape as well as dynamic parameters such as path length, velocity, acceleration, mean squared distances, and diffusion coefficients are computed in a fully automated way. An interface to standard statistic software facilitates further evaluation and display of parameters (see below).
RESULTS
Dynamics of Secretory Membrane Traffic.
In a first study, we examined the motility of secretory vesicles mediating biosynthetic transport from the trans-Golgi network to the plasma membrane (15). Green fluorescent protein (GFP) was tagged to the secretory protein human chromogranin B in Vero cells followed by in vivo time-lapse microscopy. After adaptive smoothing and segmentation (Fig. 1), the object information was passed to the image sequence analysis tool for object tracking. Image analysis, graphical preprocessing, and computation of dynamic parameters involving >500 vesicles in 40 time sections was performed in a fully automated way within 60 min on a standard Pentium PC or Silicon Graphics workstation. In comparison, manual evaluation consumed >4 hours of user interaction for a small subset of 40 user selected vesicles with highest motility.
Within the time–space reconstruction module, the resulting 391 trajectories were categorized as stationary, unidirectional, or bi-directional according to their degree of motility (Fig. 2B). A trajectory was considered as stationary if its mean velocity was below the average velocity of all trajectories. The group of remaining vesicles was subdivided into two classes: vesicles performing unidirectional motion and vesicles reversing their direction of motion. A vesicle was considered as reversing its direction at a particular time step if the velocity vector averaged over three time steps before it differed at least 130° in direction as compared with three time steps afterward.
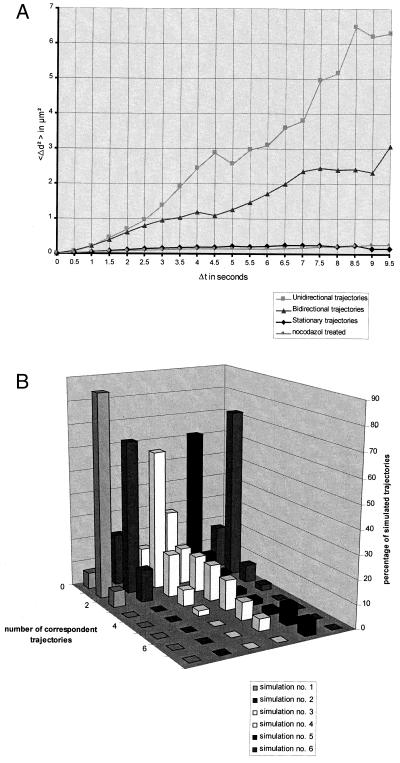
Trajectories were color-encoded for easy interpretation of motility (Fig. 2C). Dynamic parameters such as mean squared distances, diffusion coefficients, and velocities were computed (Fig. 4A). The vast majority (64%) of vesicles were found to be stationary whereas 31% showed periods of fast directed movements interspersed by periods of slow random motion. The average velocity of nonstationary vesicles was 0.587 μm/sec as compared with 0.252 μm/sec for stationary vesicles. The maximum velocity measured for this cell was 1.23 μm/sec (i.e., 6 pixels/time frame; see Table 1). A smaller fraction (5%) showed a reverse in direction, where half of these vesicles reverted their direction by 176–180°.
Figure 4.
(A) Time-dependent mean squared distances for the cell shown in Figs. 1 and 2 and a nocodazole treated cell with disrupted microtubules (not shown). The mean squared change in distances was computed as 〈Δd2〉 = 〈[d(t) − d(t + Δt)]2〉, where d(t) denotes the trajectory length at time step t, and Δt denotes the time interval. According to the classification of trajectories, a clear separation between plots for stationary (♦), bi-directional (▴), and unidirectional (■) moving vesicles is observed. Note that the mean squared distances for stationary vesicles are very much similar to those for vesicles in nocodazole treated cells (●). The diffusion constants (D = 9.260 × 10⁻¹¹ cm2/sec for stationary vesicles and D = 8.223 × 10⁻¹¹ cm2/sec for vesicles in nocodazole treated cells) show a time-independent correspondence to the slope of the mean squared distance plots, indicating that those vesicles undergo Brownian motion. In contrast, the mean squared distances for unidirectional vesicles show an upwardly curving parabolic curve, indicating a motor protein driven motility model. (B) Accuracy of the object tracking module in dependence of different dynamic models. Each row in the three-dimensional plot corresponds to one simulation (for dynamic parameter settings, see Table 1). For small velocities and acceleration (simulation 1), 95% of all simulated trajectories could be tracked (no. of correspondent trajectories = 1). Only 7% of trajectories were unmatched (no. of correspondent trajectories = 0); the remaining 7% of trajectories were separated into two independent parts (no. of correspondent trajectories = 2). In simulations 2–6, the initial and maximal velocities were increased in comparison to simulation 1. With increasing acceleration, the accuracy of the object tracking module decreases. The majority of vesicles can be accurately tracked in simulations 2–4, where a vesicle was allowed to change its velocity by up to ±70% in one time step. In simulation 5, the object tracking module meets its limitations. When a vesicle was allowed to change its velocity by ±80%, 73% of all vesicles could not be tracked. In simulation 6, dynamic parameter settings have been adapted to the experimental findings for vesicular membrane traffic (see Results for more details). Of note, under experimental conditions, the vast majority (>80%) of vesicles could be accurately tracked.
Table 1.
Simulation and time-space tracking of vesicles
| Simulation | vstart, pixel/frame | vmax, pixel/frame | a, pixel/frame2 |
|
|
|---|---|---|---|---|---|
| 1 | 1 | 2 | 1 | 2 | |
| 2 | 5 | 10 | 1 | 9 | |
| 3 | 5 | 10 | 6 | 2 | |
| 4 | 5 | 10 | 7 | 15 | |
| 5 | 5 | 10 | 8 | 28 | |
| 6 | 5 | 10 | 0 ≤ acc ≤ 6 | 3 |
Six simulations were performed for different parameter settings of initial velocity (vstart), maximal allowed velocity (vmax), and acceleration (a). The relative deviation between average velocities of simulated trajectories (vsim) and automatically tracked trajectories (vauto) is given in the fourth row.
The plots of mean squared distances and diffusion constants show that stationary vesicles in normal cells as well as vesicles in cells with disrupted microtubules after addition of nocodazole undergo Brownian motion (Fig. 4A). These findings support a trial-and-error model for transport of secretory vesicles. According to this model, vesicles are transported fast but on random tracks simply trying any direction to find a target membrane. The model further suggests that vesicles perform fast directed movements if associated with microtubules and slow random search movements toward the next microtubule after dissociation. Of interest, we also observed small clusters of vesicles apparently performing the same kind of random and directed movement bringing up the question whether those vesicles are associated with larger transport intermediates. The described techniques provide a fast and powerful tool to investigate how secretory traffic is regulated: for example, to study the effect of cell motility or cell–cell contact formation on the transport of secretory vesicles.
Comparison with Model Simulations.
In an attempt to quantitatively access the accuracy of the dynamic object tracking module, we performed a systematic simulation of trafficking vesicles under different dynamic parameter settings. Vesicles were simulated as spots with a Gaussian gray value distribution. In an initial configuration, a fixed number of vesicles was randomly placed into the image. The localization of a vesicle in the next time step depends on four parameters: its initial velocity (vini), its acceleration (a), its direction of motion, and the maximally allowed velocity (vmax). Although settings for initial and maximal velocity as well as acceleration differed among vesicles and experiments, a vesicle was allowed to perform any form of change in its directional motion in all simulations.
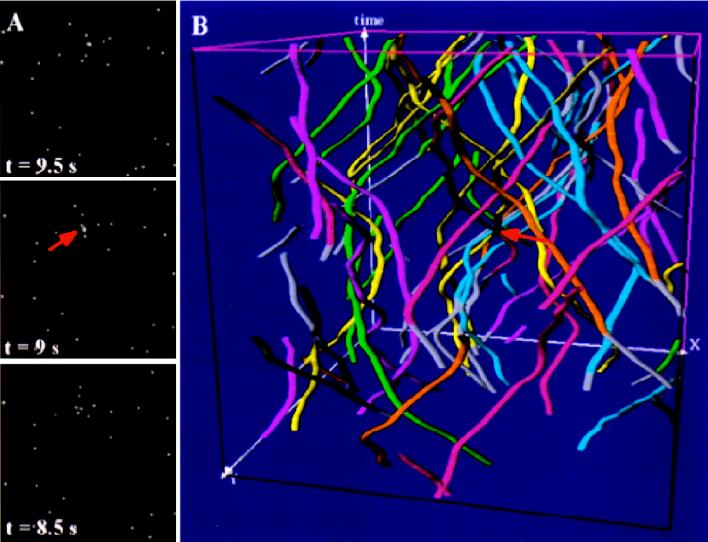
A sequence of 40 time steps was simulated under different parameter settings (Table 1). After automated object detection, vesicles were tracked by the object tracking module as described above (see Methods). Automatically found trajectories were systematically compared with simulated trajectories (Fig. 4B). Simulation of vesicles with dynamic parameters set to the experimentally determined maximal velocities and acceleration for vesicles in membrane traffic (Table 1) showed that 72.5% of the simulated vesicles could be exactly tracked by the dynamic object tracking module. Considering the high dynamics of vesicles and the frequent intersection of trajectories in time–space (Fig. 5), only 17.5% of the simulated trajectories were unmatched; the remaining 10% of trajectories were subdivided into two or three independent trajectories:, that is, at one or two time steps, a vesicle was lost. Notably, the overall dynamics as reflected by mean velocities of vesicles was accurately estimated by the automated tracking module (deviation to exact mean velocities <3%; see Table 1).
Figure 5.
Simulation and time–space tracking of vesicles under experimental dynamic conditions determined for vesicular membrane traffic (see Fig. 4A and Table 1). (A) Three sections of a series of forty simulated sections at indicated time steps. (B) Visualization of trajectories within the Open Inventor Scene Viewer. Accurately matched trajectories are color-encoded whereas unmatched trajectories are visualized in gray. Note that, despite several intersections of vesicles trafficking at high speed (arrows), the vast majority of trajectories was accurately found by the automated object tracking module (see also Fig. 4B). (See the supplemental data on the PNAS web site, www.pnas.org.)
Dynamics of Transcription and Pre-mRNA Splicing.
In a second study, the described technique was applied to study gene expression events in vivo, in particular, the tempo-spatial and functional relationship between transcription and pre-mRNA splicing. In the mammalian cell nucleus, most splicing factors are concentrated in 20–40 distinct domains called speckles. GFP was fused in-frame to the amino terminus of the essential splicing factor 2/alternative splicing factor (SF2/ASF) and was visualized by time-lapse microscopy. Time-lapse microscopy shows that those speckles are highly dynamic structures (16). BKT-1B cells, transfected with GFP–essential splicing fator 2/alternative splicing factor cAMP-inducible early genes of BK virus, were triggered in vivo, followed by time-lapse microscopy.
After automated image analysis, outlines of speckles and BK-induced RNA were computed (Fig. 3 A–C), followed by a continuous time–space reconstruction and computation of surface dynamics for these speckles (Fig. 3D). The continuous reconstruction shows that one of the speckles extends toward the BK virus gene and intersects the gene signal (Fig. 3E). Notably, the surface dynamics of all neighboring speckles measured by the average acceleration of surface points (data not shown) at each interpolated time step increases after transcriptional activation and reaches its peak when the first speckle hits the gene. Thereafter, the speckles show a rapid slow-down in surface dynamics and a slight reduction in surface area.
In a different cell, speckles were imaged after addition of α-amanitin, a specific inhibitor of RNA polymerase II. Notably, the speckles rounded up and showed only low surface dynamics (Fig. 3F). These findings suggest that speckles supply pre-mRNA splicing factors to nearby activated sites of transcription and that the dynamics of speckles is directly related to nearby transcriptional events. We are currently using these tools to quantitatively characterize the surface dynamics and intranuclear positioning of the splicing factor compartments.
CONCLUSIONS
We have developed a widely applicable technique for accurate analysis of dynamic processes in living cells. In the first application, we quantitatively characterized vesicular motility in secretory membrane traffic. Here, the method proved particularly useful because it allowed for a fully automated analysis of even complex data involving >500 vesicles in a series of 20 images. In a comparison with simulated data, we quantitatively accessed the reliability of the dynamic object tracking module. Under experimental conditions, the vast majority of vesicles could be accurately tracked. Furthermore, the small population of unmatched vesicles did not influence the overall dynamics, as reflected by the velocity distribution of vesicles. For the study of nuclear processes, the time–space interpolation technique proved particularly useful for investigating the continuous assembly of functional compartments in response to metabolic requirements.
Photon count limitations and/or limitations in total exposure time during in vivo imaging implies restrictions both in spatial and temporal resolution. Our results indicate that the developed methods help to reconstruct tempo-spatial resolution. For fast-moving vesicles, the highly sensitive object detection module reveals vesicles that are difficult or even impossible to detect by visual interactive inspection. For nuclear processes, the visualization module provides a time–space interpolation of intermediate time steps, thus allowing the prediction of dynamic processes between measured image steps.
The mechanisms and forces involved in the assembly and dynamics of functional subcellular compartments in response to metabolic requirements are not well understood at present and need further investigations. The present method has been shown to be highly suited for an accurate quantitative and qualitative study of nuclear and cellular processes with improved tempo-spatial resolution.
Supplementary Material
Acknowledgments
We thank B. Jähne for generously supporting the development of the particle tracking program and M. Markoutsakis for technical assistance. We are particularly grateful to W. Jäger for his support and helpful comments concerning mathematical image analysis. This work was supported by Bundesministerium für Bildung und Forschung Grant 01 KW 9621 and Deutsche Forschungsgemeinschaft Grant Ja 395/6-2. D.L.S. is supported by National Institute of General Medical Sciences Grant 42694, W.T. is supported by the Graduiertenkolleg at the Interdisziplinäres Zentrum für Wissenschaftliches Rechnen, and T.M. is supported by the Roche Research Foundation.
ABBREVIATION
- GFP
green fluorescent protein
References
- 1.Lamond A I, Earnshaw W C. Science. 1998;280:547–553. doi: 10.1126/science.280.5363.547. [DOI] [PubMed] [Google Scholar]
- 2.Lippincott-Schwartz J L, Smith C L. Curr Opin Neurobiol. 1997;7:631–639. doi: 10.1016/s0959-4388(97)80082-7. [DOI] [PubMed] [Google Scholar]
- 3.Bornfleth H, Sätzler K, Eils R, Cremer C. J Microsc (Oxford) 1998;189:118–136. [Google Scholar]
- 4.Qian H, Sheetz M P, Elson E L. Biophys J. 1991;60:910–921. doi: 10.1016/S0006-3495(91)82125-7. [DOI] [PMC free article] [PubMed] [Google Scholar]
- 5.Marshall W F, Straight A, Marko J F, Swedlow J, Dernburg A, Belmont A, Murray A W, Agard D A, Sedat J W. Curr Biol. 1997;7:930–939. doi: 10.1016/s0960-9822(06)00412-x. [DOI] [PubMed] [Google Scholar]
- 6.Perona P, Malik J. Proceedings of the IEEE Computer Society Workshop on Computer Vision. Washington, DC: IEEE Computer Society Press; 1987. pp. 16–22. [Google Scholar]
- 7.Black M J, Sapiro G, Marimont D, Heeger D. IEEE Trans Image Process. 1998;7:421. doi: 10.1109/83.661192. [DOI] [PubMed] [Google Scholar]
- 8.Nevatia R, Babu K R. Comput Graph Image Process. 1980;13:257–269. [Google Scholar]
- 9.Anandan P. Int J Comput Vis. 1989;2:283–310. [Google Scholar]
- 10.Hering F, Leue C, Wierzimok D, Jähne B. Exp Fluids. 1997;23:472–482. [Google Scholar]
- 11.Nauck D, Klawonn F, Cruse R. Foundations of Neuro-Fuzzy-Systems. New York: Wiley; 1997. [Google Scholar]
- 12.Eils R, Dietzel D, Bertin E, Schröck E, Speicher M R, Ried T, Robert-Nicoud M, Cremer C, Cremer T. J Cell Biol. 1996;135:1427–1440. doi: 10.1083/jcb.135.6.1427. [DOI] [PMC free article] [PubMed] [Google Scholar]
- 13.Eils R, Sätzler K. In: Handbook of Computer Vision and Applications. Jähne B, Haussecker H, Geissler P, editors. San Diego: Academic Press; 1999. [Google Scholar]
- 14.Hoppe H. Progressive Meshes: Proceedings of SIGGRAPH ’96, Computer Graphics Proceedings, Annual Conference Series. Reading, MA: Addison–Wesley; 1996. pp. 99–108. [Google Scholar]
- 15.Wacker I, Kaether C, Krömer A, Migala A, Almers W, Gerdes H H. J Cell Sci. 1997;110:1453–1463. doi: 10.1242/jcs.110.13.1453. [DOI] [PubMed] [Google Scholar]
- 16.Misteli T, Cáceres J F, Spector D L. Nature (London) 1997;387:523–527. doi: 10.1038/387523a0. [DOI] [PubMed] [Google Scholar]
Associated Data
This section collects any data citations, data availability statements, or supplementary materials included in this article.


