

Abstract
Millions of individuals suffer from a health condition known as keratoconjunctivitis sicca (KCS, also known as ‘dry eye’). Studies have indicated that the lipids in the tear film layer, which covers the outer portion of the eye, may be directly correlated with the existence of dry eye syndrome. By identifying and comparing the major, non-polar lipids in normal eye tears with a dry eye model, it may be possible to identify a symptom of, or a contributing factor to, dry eye. Electrospray tandem mass spectrometry (ES-MS/MS) was used to identify and compare the non-polar lipids, detected as lithium adducts, from normal and dry eye tear samples obtained from rabbits. A limited number of normal human tear samples were also examined for lipid content, and a close resemblance to rabbit was observed. Three distinct regions were delineated in the ES mass spectra of the non polar lipids, m/z 20–500, 500–800 and 800–1100. A common feature noted among identified lipid components was a glycerol backbone with fatty acyl substituents attached. Product ion spectra were obtained for lithiated monoacyl-, 1,2- and 1,3-diacyl- and triacylglyceride standards. Newly proposed structures and fragmentation pathways for the major product ions are presented for the 1,2- and 1,3-diglycerides, and also for the monoglyceride. New approaches to distinguishing asymmetric 1,2-diglycerides and 1,2- from 1,3-diglycerides are proposed. For the rabbit tear samples, the m/z 20–500 range contains monoester diols with empirical formulas CnH2nO4, the m/z 500–800 range includes diesters with empirical formulas CnH2n−2O5 and the m/z 800–1100 range contains triesters with empirical formulas CnH2n−4O6. Also found in the extracts were three isoprene acetals (terpenoids).
Keywords: rabbit tears, lipid extract, acylglycerides, wax ester, fragmentation pathway, electrospray tandem mass spectrometry
INTRODUCTION
Millions of humans are afflicted with keratoconjunctivitis sicca (KCS, also known as ‘dry eye’), which can be associated with aging, disease, smoke, surgery or any form of irritation of the eye. The National Eye Institute's (NEI) definition of dry eye states that KCS is a disorder of the ocular tear film layer usually caused by a tear deficiency, or excessive evaporation of the aqueous layer, resulting in damage to the ocular surface and symptoms of discomfort.1 Some forms of dry eye may be physiologically related, perhaps from the breakdown of the eye tear layer, or to hormones, as demonstrated in a hormone replacement study by Schaumberg et al.1 In two separate demographic studies, it has been estimated that 11% of Europeans (Copenhagen criteria) between the ages of 30 and 60 years suffer from dry eye symptoms,2 and that 14.6% of Americans over the age of 65 years (∼4.3 million people) also suffer from dry eye symptoms.3 Although their symptoms are similar, the underlying causes are often unknown and no practical method for evaluating the composition of tears from such patients exists. Therapeutic approaches for the treatment of dry eye include application of artificial tear drops for wetting and lubrication,4,5 corticosteroids (anti-inflammatory agents), antibiotics and immunosuppressants such as cyclosporine.6 The widely used dry eye drops consist of various solutions containing electrolytes, organic additives, etc., but are primarily composed of water (97–99%).4
The structure of the ocular tear film is generally divided into three layers: the innermost corneal layer, an intermediate aqueous–mucin layer7,8 and an outermost lipid layer.9 One of the functions of the outer lipid layer is to retard the evaporation of the inner aqueous layer. The lipids are supplied to the tear film through the meibomian gland. The chemical composition of the human meibomian gland liquid secretions is a complex mixture of cholesterol and wax esters, triglycerides, free fatty acids, diesters, free cholesterol, hydrocarbons and polar lipids,10-14 with water composing 98–98.5%.4 Some forms of dry eye may be related to the breakdown of the eye tear layer.
Electrospray15-17 tandem mass spectrometry (ES-MS/MS) is a powerful analytical tool for compound identification.18-20 In this work, we used this method to develop a standard lipid component profile of normal tears and identify specific component differences in the tears from a dry eye model. Through the development of this technology to provide specific information concerning the lipid profile of a healthy person's tears, it may be possible to identify a defective lipid profile, something which has been suggested to be a major contributor to the dry eye syndrome.21 The mass spectrometric analysis of acylglycerides, which are comprised of mono-, di- and triglycerides, has been reported using various approaches such as derivative gas chromatography electron ionization mass spectrometry (GC/EI-MS),22-24 positive chemical ionization,22 negative chemical ionization25-27 (NCI) of chloride adducts, ES-MS/MS28,29 including ES-MS/MS of ammonium adducts,30,31 matrix-assisted laser desorption/ionization time-of-flight (MALDI-TOF),32,33 fast atom bombardment (FAB),34 atmospheric pressure chemical ionization (APCI) MS30,35 and APCI liquid chromatography (LC)/APCI-MS.36-38 Quantifying triglycerides using ratios of diacylglyceride fragment ions vs parent ions and fragmentation schemes, has been reported for single-stage APCI-MS experiments.39-42 Saturated acylglycerides do not readily form protonated molecules, even in acidified solutions, so alkali metal salt (Na+) and ammonium acetate (NH4+) have been used as additives in chloroform–methanol for both LC/ES- and APCI-MS. It has also been reported36 that LC/APCI-MS is not sensitive enough to detect even moderately low amounts (about 2.5 mg ml−1) of monoacylglycerides under standard conditions.
In our MS work involving the identification of lipid fractions in tear samples, Li+ was chosen as the alkali metal for adduct formation for both the non-polar lipids such as the acylglycerides and wax esters that, to our knowledge, have not appeared in the literature, and for the more polar phosphorylated lipids, which have been reported previously.43 The specific use of lithium adducts has been reported for FAB-MS/MS, and ES-MS studies of oligosaccharides,44,45 for the ES ionization and structural determination of triacylglycerides,29,46 for ionization of aryl 1,2-diols by FAB34 and for FAB ionization and structural identification of fatty acids.47 In this paper, we present a detailed description of the major fragments produced from ES-MS/MS studies employing collisionally induced dissociation (CID) of lithium adducts of monoacylglycerides and 1,2- and 1,3-diacylglycerides, which can produce informative product ion spectra for the identification of complex biological extracts.
EXPERIMENTAL
Chemicals
Methanol and chloroform solvents were of HPLC/spectroscopy grade and were purchased from EM Science (Darmstadt, Germany). Monopentadecanoin, 1,3-dipentadecanoin, triheptadecanoin and palmityl behenate were obtained from Nu-Chek Prep. (Elysian, MN, USA), with stated purities of >99%. 1-Stearin-2-palmitin diglyceride and the 1-palmitin-2-stearin diglyceride were purchased from Larodan Fine Chemicals (Malmo, Sweden), with a stated purity of 99%. Cholesteryl stearate, 1,3-distearin and 1-palmitoyl-3-stearoyl-rac-glycerol were purchased from Sigma (St. Louis, MO, USA). Lithium chloride was ACS grade in granular form from J. T. Baker (Phillipsburg, NJ, USA). All standards were used as received.
A note on stereochemistry of acylglycerides
All vicinal diacylglycerides in this work have unknown stereochemistries at the chiral carbon. Differentiation between 1,2- and 2,3-diglycerides is not possible, and for convenience these are all designated as 1,2-diglycerides in the text. Similarly, 3-position monoglycerides are not distinguishable from 1- position monoglycerides, and the 1-position is used here to describe both. Moreover, 1,3-diglycerides cannot be distinguished from their enantiomers and the 1-position is arbitrarily assigned to the largest alkyl chain.
Rabbit tear samples
The rabbit dry eye model was created in female New Zealand white rabbits by two sequential surgical procedures. First, the main lacrimal gland was removed from the experimental eye; the contralateral eye was used as the control. Approximately 2 weeks later, the accessory lacrimal gland and nictitating membrane were removed from the experimental eye. Tear breakup time (TBUT, measured by slit lamp with a Tearscope™) was measured daily. When the TBUT of the surgical eye was half or less that of the control eye, the surgical eye was considered to be ‘dry’. Baseline tears (representing tears produced under non-irritating conditions) were collected daily from the normal and surgically induced dry eyes using 5 μl silanated microcapillary pipettes.48-50 The usual volume obtained from a normal eye was 3 μl each, whereas only 1 μl was typically obtained from a dry eye. The tear samples were immediately placed in Eppendorf tubes and preserved by storage at −70°C. The non-polar lipid fractions were extracted from tear samples with a simple chloroform solvent modification procedure51,52 and reconstituted in 9 : 1 methanol–chloroform solutions containing 2 mM LiCl.43
Instrumentation
Mass spectra were obtained using a Quattro II triple quadrupole mass spectrometer (Micromass, Manchester, UK) equipped with an electrospray interface operating at typical flow-rates of 2–4 μl min−1. Nitrogen was used as both nebulizing and drying gas. Argon was used as collision gas during CID experiments, at collision cell pressures of ∼3.0 × 10⁻⁴ mbar (measured external to the cell). The typical ‘cone’ voltage setting was 40 V and the ES capillary voltage was held at 2.5–3.5 kV. For quantification of the lipids, internal standards having similar structures to the lipids (monopentadecanoin, dipentadecanoin, triheptadecanoin and palmityl behenate) were employed to minimize differences in ionization efficiencies.53 MassLynx software (Micromass) was used to acquire, process and store mass spectral data.
RESULTS AND DISCUSSION
It was observed that, in the positive mode, mass spectral signal intensities of the lithiated adduct species (upon addition of 2 mm LiCl) were more reproducible than those of the corresponding protonated lipid molecules, or mass analysis of the deprotonated lipid species in the negative mode. Upon decomposition, the lithium adducts were also observed to form product ions that were characteristic of the lipid being analyzed, as will be described below.
Comparison of ES mass spectra for normal human tears and normal rabbit tears, obtained in our laboratory, have shown close similarities where the total chloroform extractables from normal rabbit tears match fairly closely those from human tears. This suggests that the rabbit tears are fairly close in composition to human tears, which would allow extrapolation of findings from one species to the other. Second, it was noted that there was not a readily observable difference in major components when comparing normal tear with dry eye tear total chloroform extractables, although changes in the fatty acid fragments of the non-polar and polar lipids have been reported by Sullivan and co-workers54-57 for people suffering from dry eye due to an androgen deficiency caused by Sjogren's syndrome, menopause and aging.
MS of lipid standards
Product ion spectra
Figure 1(a) is the product ion spectrum of the lithiated adduct of triheptadecanoin. The characteristic informative peaks include the C17 : 0 acylium ion at m/z 253 [C17H33O]+, the lithium adduct of heptadecanoic acid at m/z 277 [C17H34O2Li]+, the neutral loss of heptadecanoic acid, then the neutral loss of a C17 : 1 α,β-unsaturated fatty acid, to give the m/z 317 product ion [MLi – C17H34O2 – C17H32O2]+, the parent ion minus lithiated heptadecanoate at m/z 579 [MLi – C17H33O2Li]+ and the parent ion minus the neutral loss of heptadecanoic acid at m/z 585 [MLi – C17H34O2]+. The m/z 579 product ion from the neutral loss of a catonized fatty acetate, from triglycerides, has been observed in ES-MS/MS studies with ammonium adducts,36 but the product ions of m/z 317 and 585, which both involve the neutral loss of a fatty acid, have not. Hsu and Turk46 also reported the neutral loss of fatty acids from lithiated triglycerides using a triple quadrupole with an electrospray interface. The spectrum also contains hydrocarbon fragment ions at m/z 43, 57, 71 and 85, which are derived from σ-bond cleavage of the fatty acid hydrocarbon chains. Also included in the lower mass region is the product ion at m/z 99, which is the lithium adduct of the glycerol backbone, and an ion at m/z 81 derived from water loss from this glycerol backbone.
Figure 1.

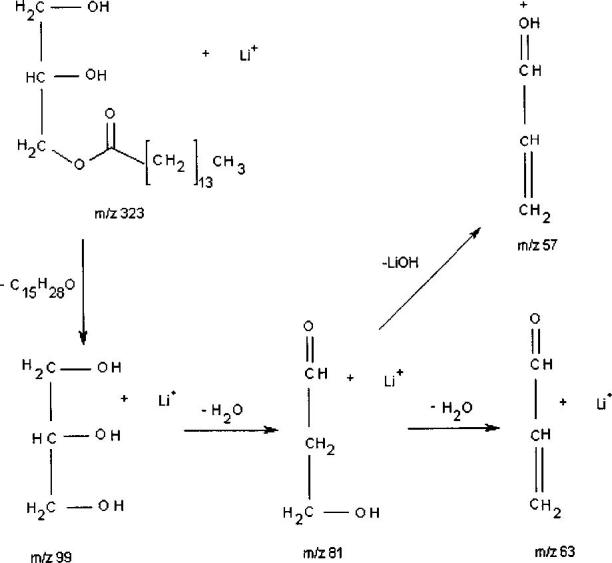
Positive mode ES-MS/MS product ion spectra of the lithium adducts of the internal acylglyceride standards used for identification and quantification of extracted lipids [MLi]+, with peak assignments of major informative fragment ions for (a) triheptadecanoin m/z 855 and (b) 1,3-dipentadecanoin m/z 547; (c) ‘up-front’ CID-MS/MS experiment using precursor (m/z 323) fragment ions formed from ‘up-front’ dissociation of the 1,3-dipentadecanoin standard (m/z 547) [M + Li]+. The product ion peak at m/z 299 (inset) indicates the minor pathway of a stepwise initial ‘in-source’ loss of ketene, followed by LiOH, in addition to production of m/z 299 from the loss of the lithium fatty acetate from m/z 547. Positive mode ES-MS/MS product ion spectra of (d) monopentadecanoin m/z 323 and (e) palmityl behenate m/z 571.
The product ion spectrum of 1,3-dipentadecanoin (Fig. 1(b)) also contains the hydrocarbon fragment ions and a peak at m/z 63 for two water losses from the glycerol backbone, in addition to m/z 99 and 81 from glycerol. In the m/z 200–350 region there are two major fragment peaks which characterize this diglyceride, i.e. lithiated pentadecanoic acid at m/z 249 [C15H30O2Li]+ and the m/z 323 fragment ion that has undergone neutral loss of C15 : 0 fatty acyl chain as a ketene [MLi – C15H28O]+. Also observed are peaks at m/z 289 from the consecutive neutral losses of H2O followed by C15 : 1 α,β-unsaturated fatty acid [MLi – H2O – C15H28O2]+. The order of this consecutive process was ascertained by a precursor scan of m/z 289 that showed peaks at m/z 547 for the lithiated parent ion and m/z 529 representing loss of H2O from the m/z 547 parent. Notably, the peak that would correspond to initial C15H28O2 loss at m/z 307 was not observed, indicating a two-step process with H2O loss being the first step. Figure 1(b) also shows peaks at m/z 299 formed from the neutral loss of C15 : 0 lithium fatty acetate [MLi – C15H29O2Li]+ and at m/z 305 for the neutral loss of C15 : 0 fatty acid [MLi – C15H30O2]+. The loss of NH4OH, then ketene, has been observed and reported by using LC/APCI-MS,36 which would be analogous to the pathway leading to m/z 299 if the process occurs in two steps, involving initial loss of C:15 fatty ketene, followed by loss of LiOH; alternatively, it could be formed through neutral loss of C15 : 0 lithium fatty acetate. To distinguish which fragment pathway was responsible for the m/z 299 product ion, an experiment was performed in which the loss of the C:15 fatty ketene from the m/z 547 precursor was produced in the source using a high cone voltage (i.e. ‘in-source’ or ‘up-front’ CID). The m/z 323 ion was then isolated with the first quadrupole, subjected to CID in the central hexapole and the product ions were scanned by the third quadrupole for the loss of LiOH at m/z 299. Figure 1(c) illustrates the results of the experiment where a small peak was observed at m/z 299, indicating that this fragmentation pathway can occur, i.e. the loss of a fatty ketene followed by loss of LiOH, but it is much less favored than the direct neutral loss of the C:15 lithium fatty acetate from the m/z 547 precursor. Finally, to the best of our knowledge, the second product ion observed at m/z 323 (Fig. 1(b)) through the loss of ketene, resulting in a lithium adduct of monoacylglycerol, has not been reported.
Figure 1(d) is the product ion spectrum from the CID of lithiated monopentadecanoin. Three peaks characteristic of the fragmentation of lithiated monoglycerides are observed in the lower molecular mass region. The major ion at m/z 99 is the glycerol backbone derived from the neutral loss of the C15 : 0 fatty ketene from the parent ion [MLi C15H28O]+. The next two ion peaks at m/z 81 and 63 are the subsequent loss of one and then two H2O molecules from the glycerol backbone, as was observed for the tri- and diglycerides. Figure 1(e) is the product ion spectrum of the lithium adduct of palmityl behenate, a representative fatty acid/fatty alcohol wax ester. In the low-mass region, only the hydrocarbon fragments are observed at m/z 43, 57, 71, 83 (one unsaturation) and 85. In the m/z 350 region there is one predominant peak appearing at m/z 347. This represents the neutral loss of the carbon chain of the fatty alcohol [MLi – C16H32]+, leaving the lithium adduct of the fatty acid portion of the wax ester at m/z 347 [C22H44O2Li]+.
Lipid fragmentation pathways
Figures 2, 3 and 4 are diagrams illustrating the major fragment ions produced from CID of the lithium adducts of the acylglycerides triheptadecanoin, 1,3-dipentadecanoin and monopentadecanoin, respectively. Mu et al.36 and Holcapek et al.37 reported different types of fragmentation pathways for the CID of CI-generated diglycerides employing ammonium adducts36 or protonated, diglycerides with three or more double bonds.37 To determine whether a different product ion spectrum would be obtained for the two types of substitution (1,2- versus 1,3-), and whether a distinction could be made between the two substituents on a 1,2-diglyceride, a 1-stearin-2-palmitin diglyceride standard was analyzed by MS/MS as the lithium adduct. Recall that in the product ion spectrum of the 1,3-dipentadecanoin standard (Fig. 1(b)), the predominant ion was the m/z 323 peak from the loss of C15 : 0 fatty acyl chain as a ketene from the parent ion [MLi – C15H28O]+, followed by the peak at m/z 299 for the neutral loss of C15 : 0 lithium fatty acetate [MLi – C15H29O2Li]+. In Fig. 5(a), the product ion spectrum of the lithium adduct of the 1,2-diglyceride, the predominant product ions are m/z 313 and 341. The m/z 313 product ion is derived from the loss of C18 : 0 lithium fatty acetate, which is in the 1-position, [MLi – C18H35O2Li]+. The second major product ion at m/z 341 is derived from the loss of C16 : 0 lithium fatty acetate, which is in the 2-position, [MLi – C16H31O2Li]+. The greater intensity of the m/z 313 peak than the m/z 341 peak indicates that lithium fatty acetate loss occurs with greater facility from the 1-position relative to the analogous loss from the 2-position. Therefore, when two non-identical fatty acyl substituents are present on a 1,2-diglyceride, the more abundant monoacyl fragment has lost the substituent that was formerly at the 1-position. This behavior is identical with the type of selective loss of the fatty acid from the 1-position being greater than the analogous loss from the 2-position observed with the phosphorylated lipids.43 To verify the positional selectivity of this lithium fatty acetate loss, the lithium adduct of 1-palmitin-2-stearin diglyceride was subjected to CID under similar conditions. The product ion spectrum showed that the predominant neutral loss was that of C16 : 0 lithium fatty acetate, from the 1-position. This behavior indicates that the principal factor in determining the preferred neutral loss of a lithium fatty acetate is the position (i.e. the 1-position is favored over the 2-position), rather than chain length. The spectrum (Fig. 5(a)) also contains a low-intensity peak at m/z 365 for the loss of the 2-position C16 : 0 fatty acyl chain as a ketene [MLi – C16H30O]+, and a very minor peak at m/z337 for the loss of the 1-position C18 : 0 fatty acyl chain as a ketene [MLi – C18H34O]+. This behavior contrasts with that of a 1,3-diglyceride in that the latter shows significant ketene loss from the 1- or 3-position as being responsible for the predominant product ions, whereas neutral losses of lithium fatty acetates are only minor.
Figure 2.

Major fragment ions produced from the CID of triheptadecanoin m/z 855 [MLi]+: the C17 : 0 acylium ion at m/z 253 [C17H33O]+, the lithium adduct of heptadecanoic acid at m/z 277 [C17H34O2Li]+, the neutral loss of heptadecanoic acid, then the neutral loss of a C17 : 1 α,β-unsaturated fatty acid, to give the m/z 317 product ion [MLi – C17H34O2 – C17H32O2]+, the parent ion minus lithiated heptadecanoate at m/z 579 [MLi – C17H33O2Li]+ and the parent ion minus the neutral loss of heptadecanoic acid at m/z 585 [MLi – C17H34O2]+.
Figure 3.

Major fragment ions produced from the CID of 1,3-dipentadecanoin m/z 547 [MLi]+: the parent ion peak minus the neutral loss of C15 : 0 fatty acyl chain as ketene at m/z 323 [MLi – C15H28O]+, the neutral loss of C15 : 0 lithium fatty acetate at m/z 299 [MLi – C15H29O2Li]+ (major path) or the loss of C15 : 0 fatty acyl chain as ketene from the parent ion followed by LiOH at m/z 299 [MLi – C15H28O – LiOH]+ (minor path), the neutral loss of C15 : 0 fatty acid at m/z 305 [MLi – C15H30O2]+, the consecutive losses of H2O followed by C15 : 1 α,β-unsaturated fatty acid at m/z 289 [MLi – H2O – C15H28O2]+ and the lithiated fatty acid ion, pentadecanoic acid, at m/z 249 [C15H30O2Li]+.
Figure 4.
Major fragment ions produced from the CID of monopentadecanoin m/z 323 [MLi]+: the major ion at m/z 99 is the glycerol backbone derived from the neutral loss of the C15 : 0 fatty acyl chain as a ketene from the parent ion [MLi – C15H28O]+,and the m/z 81 and 63 ions are the subsequent losses of one and then two H2O molecules from the lithiated glycerol backbone.
Figure 5.

(a) Product ion spectrum of 1-stearin-2-palmitin standard at m/z 603. The greater peak intensity of m/z 313 vs m/z 341 allows the identification of the 1-position of the 1,2-diglyceride. (b) Major fragment ions produced from the CID of 1-stearin-2-palmitin m/z 603 [MLi]+: the m/z 313 ion from the neutral loss of C18 : 0 lithium fatty acetate (1-position), [MLi – C18H35O2Li]+, the ion at m/z 341 from the neutral loss of C16 : 0 lithium fatty acetate (2-position), [MLi – C16H31O2Li]+, the m/z 365 ion from the loss of the C16 : 0 fatty acyl chain as ketene [MLi – C16H30O]+, the neutral loss of C16 : 0 fatty acid at m/z 347 [MLi – C16H32O2]+, the neutral loss of the C18 : 0 fatty acid at m/z 319 [MLi – C18H36O2]+, the lithium adducts of stearic acid at m/z 291 [C18H36O2Li]+, the lithium adduct of palmitic acid at m/z 263 [C16H32O2Li]+ and protonated stearic and palmitic acids at m/z 285 [C18H36O2H]+ and m/z 257 [C16H32O2H]+, respectively.
As a further control, the asymmetric 1,3-diglyceride 1-palmitin-3-stearin was analyzed under similar CID conditions. The resultant product ion spectrum confirmed that neutral losses of the fatty acyl chains as ketenes are the favored product ion pathways for 1,3-diglycerides, and peaks representing losses of each of the two fatty acid substituents were observed. Notably, for the asymmetric 1,3-diglyceride, loss of the longer C18 : 0 fatty acyl chain as a ketene was the slightly favored product ion compared with the loss of the shorter C16 : 0 fatty acyl chain as a ketene, suggesting that for the asymmetric 1,3-diglyceride a longer chain length can subtly increase the propensity for ketene loss. Also identified in the spectrum in Fig. 5(a) are peaks for the neutral loss of C16 : 0 fatty acid at m/z 347 [MLi – C16H32O2]+, the neutral loss of the C18 : 0 fatty acid at m/z 319 [MLi – C18H36O2]+ and the lithium adducts of stearic acid at m/z 291 [C18H36O2Li]+ and palmitic acid at m/z 263 [C16H32O2Li]+.
Figure 5(b) illustrates the major fragment ions produced from the CID of the lithium adduct of the 1-stearin-2-palmitin diglyceride standard. Figure 6 illustrates four proposed fragmentation pathways for the CID of the lithium adduct of 1-stearin-2-palmitin diglyceride. The top two processes (Fig. 6(a) and (b)) illustrate the major pathways producing product ions through the neutral loss of a lithium fatty acetate. The bottom two processes (Fig. 6(c) and (d)) are minor pathways each producing product ions through the neutral loss of a fatty ketene, followed by the loss of LiOH. Both processes result in the same m/z product ion with five-membered ring formation to make the most stable structure. The 1,3-diacylglycerides would have analogous pathways for the two-step neutral loss of a fatty acyl chain as a ketene, followed by the loss of LiOH. However, the neutral loss of a lithium fatty acetate for the 1,3-diacylglycerides would be slightly more complicated, involving a hydroxyl shift to form the final stable five-membered ring product ion (e.g. see m/z 299 in Fig. 3).
Figure 6.

Proposed fragmentation pathways for the CID of the lithium adduct of 1-stearin-2-palmitin diglyceride involving the fatty acid substituent and loss of LiOH. In the major fragment pathway process (top set (a) and (b)), there is the neutral loss of lithium fatty acetate (1- or 2-position) forming the product ion. In the minor fragment pathway (bottom set (c) and (d)), the initial step is the loss of the ketene of either the 1- or the 2-position fatty acid substituent, followed by the loss of LiOH forming the product ion.
Distinguishing asymmetric 1,2-diglycerides, and 1,2-from 1,3-diglycerides
Figure 7 presents a general scheme that can be used in the identification of diglycerides under low-energy (e.g. up to 100 eV Elab) collision conditions. The top part of Fig. 7(a) illustrates the use of product ion abundances for determining substituent location within an asymmetric 1,2-diglyceride. First, a characteristic of the 1,2- vs the 1,3-diglycerides is that the predominant product ions are those formed via losses of lithium fatty acetates. Furthermore, it has been observed that the R1 substituent in the 1-position of the 1,2-diglyceride shows a greater loss of the neutral lithium fatty acetate compared with the R2 substituent in the 2-position, when both are initially present. The product ion pathways leading to losses of R1 and R2 fatty acyl ketenes (Fig. 7(a), bottom half) are minor decomposition routes. In contrast to this behavior, as shown in the top half of Fig. 7(b), for decompositions of lithiated 1,3-diglycerides the neutral losses of both the R1 and the R3 substituents as fatty acyl ketenes are observed to be the major product ions formed. Finally, the bottom part of Fig. 7(b) illustrates that the 1,3-diglyceride has a fragment pathway which results in a consecutive neutral loss of H2O followed by neutral loss of an α,β-unsaturated fatty acid (this order was established by inspection of precursor scans of the ions shown at the bottom of Fig. 7(b)). The latter fragmentation pathway is not observed in the 1,2-diglycerides.
Figure 7.

General scheme for distinguishing asymmetric 1,2-diglycerides, and 1,2-diglycerides from 1,3-diglycerides based on MS/MS decompositions of lithium adducts. (a) Illustration of the use of product ion abundances for determining substituent location within an asymmetric 1,2-diglyceride. Loss of R1 substituent as lithium fatty acetate is greater than the R2 loss. Indicative of 1,2-diglycerides is that neutral losses of lithium fatty acetates are the predominant product ions. Bottom half of (a) shows that losses of fatty acyl ketenes yield minor product ions. Top half of (b) illustrates that the neutral losses of the R1 or the R3 substituent as fatty acyl ketenes are observed for the 1,3-diglyceride isomer, and these are the major product ions. Bottom part of (b) illustrates that the 1,3-diglyceride has a fragmentation pathway which results in the neutral loss of H2Owith subsequent loss of an α,β-unsaturated fatty acid. This fragmentation pathway is not observed for the 1,2-diglycerides.
MS of rabbit tear lipids
Figure 8 contains the mass spectra of (a) normal eye rabbit tears and (b) dry eye model rabbit tears extracted lipid lithium adducts. The spectra also contain lithium adduct peaks of four internal standards that were used to quantify the extracted lipids which are identified in Fig. 8 by ‘IS’. Three major envelopes are observed consisting of monoglycerides, diglycerides and triglycerides.
Figure 8.

Typical single-stage MS positive mode ES scans of the lithium adducts of extracted compounds, including the spiked internal standards (IS) of (a) normal rabbit tear extract and (b) dry eye rabbit model tear extract. The internal standards include 3.65 × 10⁻⁵ mg μl−1 monopentadecanoin at m/z 323, 4.35 × 10⁻⁵ mg μl−1 dipentadecanoin at m/z 547, 4.8 × 10⁻⁵ mg μl−1 palmityl behenate at m/z 571 and 5.2 × 10⁻⁵ mg μl−1 triheptadecanoin at m/z 855.
Identification of monoglycerides
The m/z 300–500 region contains three major peaks at m/z 337, 365 and 421. The first two have been identified as monoglycerides with empirical formulas CnH2nO4Li+, having the single substituent of C16 : 0 for the m/z 337 peak, identified as monopalmitin glyceride, and C18 : 0 for the m/z 365 peak, identified as monostearin glyceride (the m/z 421 peak has been identified as a lithium adduct of an isoprene acetal). Figure 9(a), is the product ion spectrum of the m/z 365 compound in the normal rabbit tear extract. Analogous to the product ion spectrum of monopentadecanoin, the spectrum contains the glycerol backbone lithium adduct at m/z 99 derived from the neutral loss of C18 : 0 stearyl fatty ketene from the parent ion [MLi – C18H34O]+, and ions at m/z 81 and 63 derived from the further loss of one and then two water molecules from the glycerol backbone.
Figure 9.

Positive mode ES tandem mass spectra illustrating informative fragment ions used for identification of (a) the m/z 365 lipid lithium adduct, identified as monostearyl glyceride, (b) the m/z 575 lipid lithium adduct, identified as 1,3-dipalmitin diglyceride being the major component, with a minor 1-stearin-3-myristin constituent and a minor 1-myristin-2-stearin constituent, (c) the m/z 603 lithium adduct identified as 1-stearyl-3-palmityl diglyceride and (d) the m/z 631 lithium adduct identified as 1,3-distearin acylglyceride.
Identification of diglycerides
The m/z 500–800 region of the spectra contains three major peaks at m/z 575, 603 and 631. The m/z 575, 603 and 631 peaks have been identified as diglycerides with empirical formulas CnH2n−2O5Li+, where n = 35, 37 and 39, respectively.
m/z 575
The m/z 575 compound, as a diglyceride, has two possible fatty acid configurations. The product ion spectrum of m/z 575 (Fig. 9(b)) allows assignment of at least two isomeric components having fatty acid compositions of dipalmitoyl and stearin + myristin. For the dipalmitoyl glyceride, the spectrum contains informative peaks at m/z 337 for the loss of C16 : 0 fatty acyl chain as a ketene from the parent ion [MLi – C16H30O]+, at m/z 263 for the lithium adduct of palmitic acid [C16H32O2Li]+, at m/z 319 for the neutral loss of C16 : 0 fatty acid [MLi – C16H32O2]+, at m/z 313 for the neutral loss of C16 : 0 lithium fatty acetate [MLi – C16H31O2Li]+ and at m/z 303 for the neutral loss of H2O followed by consecutive loss of C16 : 1 α,β-unsaturated fatty acid [MLi – H2O – C16H30O2]+.
According to the identification scheme illustrated in Fig. 7, the observation of the m/z 303 peak confirms the presence of the 1,3-dipalmitoyl isomer; however, a minor presence of the 1,2-dipalmitoyl isomer cannot be ruled out (conversely, the absence of m/z 303 could be used to rule out the 1,3-isomer). Second, the identification scheme illustrated in Fig. 7 suggests that the greater abundance of the m/z 337 product ion (from the C16 : 0 fatty acyl ketene loss), compared with the m/z 313 product ion (from C16 : 0 lithium fatty acetate loss), indicates a 1,3-dipalmitoyl isomer. Concerning the stearin myristin diacylglyceride, the spectrum contains peaks that allow the identification of both fatty acid substituents, including a product ion peak at m/z 235 for C14 : 0 lithiated fatty acid [C14H28O2Li]+, at m/z 347 for the neutral loss of C14 : 0 fatty acid [MLi – C14H28O2]+ and at m/z 291 for both C18 : 0 lithiated fatty acid [C18H36O2Li]+ and for the neutral loss of C18 : 0 fatty acid [MLi – C18H36O2]+ (also m/z 291). Peaks at m/z 309 for the loss of C18 : 0 fatty acyl chain as ketene [MLi – C18H34O]+ and at m/z 365 for the loss of C14 : 0 fatty acyl chain as ketene [MLi – C14H26O]+ are observed with similar intensities, and more predominant than those of the corresponding lithium fatty acetate losses, which is illustrative of the 1,3-isomer. However, the spectrum does contain peaks corresponding to these lithium fatty acetate losses at m/z 285 [MLi – C18H35O2Li]+ and at m/z 341 [MLi – C14H27O2Li]+. Because the latter peaks are found with higher intensities than one would expect from a case where only the 1,3-diglyceride was present, it is likely that the 1,2-isomer exists as a minor component. The abundance of the m/z 341 ion for the neutral loss of the C14 : 0 lithium fatty acetate is slightly greater than that of the m/z 285 ion for the neutral loss of the C18 : 0 lithium fatty acetate, suggesting that the 1,2-isomer consists largely of 1-myristin,2-stearin. Finally, a peak at m/z 275 is observed for the neutral loss of H2O followed by consecutive loss of C18 : 1 α,β-unsaturated fatty acid [MLi – H2O – C18H34O2]+, also indicative of the 1,3-isomer. Hence the parent ion contains one C14 : 0 fatty acid in the 3-position, whereas the C18 : 0 fatty acid is in the 1-position, allowing the assignment of 1-stearin,3-myristin diglyceride. The spectrum also contains low molecular mass hydrocarbon ions at m/z 43, 57, 71 and 85, plus the m/z 99, 81 and 63 ions from the lithiated glycerol backbone. The m/z 575 precursor ion was therefore identified as a mixture of lithiated 1,3-dipalmitin (major component) and of 1-stearin, 3-myristin and 1-myristin-2-stearin (minor components) diglyceride isomers.
m/z 603
Similar characterization is found with the m/z 603 parent ion (Fig. 9(c)). A major product ion appears at m/z 365 produced from the neutral loss of a C16 : 0 fatty acyl chain as a ketene from the parent [MLi – C16H30O]+. A peak with slightly greater intensity is observed at m/z 337 from the 1-position loss of the C18 : 0 fatty acyl chain as a ketene [MLi – C18H34O]+. According to the identification scheme in Fig. 7, the observance of the loss of these two different fatty acid ketenes as the predominant product ions provides evidence that this diglyceride is present as the 1,3-isomer. Moreover, the intensities of the peaks at m/z 263 for the lithiated fatty acid ion hexadecanoic [C16H32O2Li]+ and m/z 291 from the lithiated fatty acid ion octadecanoic [C18H36O2Li]+ are also similar, which further indicates that the compound is composed primarily of the 1,3- isomer. Characteristic peaks for the 1,3- isomer are also observed at m/z 303 for the consecutive neutral losses of H2O, followed by loss of C18 : 1 α,β-unsaturated fatty acid [MLi – H2O – C18H34O2]+, and at m/z 331 for the neutral losses of H2O and C16:1 α,β-unsaturated fatty acid [MLi – H2O – C16H30O2]+. Also observed are lower intensity (minor) peaks at m/z 313 from the neutral loss of C18 : 0 lithium fatty acetate [MLi – C18H35O2Li]+ and at m/z 341 from the neutral loss C16 : 0 lithium fatty acetate [MLi – C16H31O2Li]+. Also present at lower intensities are peaks at m/z 319 for the neutral loss of octadecanoic acid [MLi – C18H36O2]+ and at m/z 347 for the neutral loss of hexadecanoic acid [MLi – C16H32O2]+. The hydrocarbon ions at m/z 43, 57, 71 and 85 are present, as are the glycerol backbone ions at m/z 99, 81 and 63. The product ion at m/z 585 is due to the loss of water from the parent ion [MLi – H2O]+. The above evidence indicates that the m/z 603 parent ion primarily consists of the 1-stearin-3-palmitin isomer.
m/z 631
Finally, for the spectrum of the m/z 631 ion in Fig. 9(d), a product ion at m/z 365 is observed for the neutral loss of C18 : 0 fatty acyl chain as a ketene [MLi – C18H34O]+ and the ion at m/z 331 from the consecutive neutral losses of H2O and C18:1 α,β-unsaturated fatty acid [MLi – H2O – C18H34O2]+, that is indicative of a 1,3-diglyceride, is also observed. The spectrum also contains the lithium adduct of stearic acid at m/z 291 [C18H36O2Li]+, and peaks at m/z 341 for the neutral loss of C18 : 0 lithium fatty acetate [MLi – C18H35O2Li]+, as well as at m/z 347, representing the neutral loss of the C18 : 0 fatty acid [MLi – C18H36O2]+. The spectrum is also characterized by the low molecular mass product ions from carbon–carbon bond dissociation and the product ions for the glycerol backbone and subsequent one and two water losses. The structure is thus assigned as the 1,3-distearin diglyceride, but the presence of a minor amount of the 1,2-isomer cannot be ruled out.
Identification of triglycerides
The m/z 800–1100 region consists of triesters of the empirical formula CnH2n–4O6Li+. Figure 10(a) shows an expanded mass axis illustrating the m/z 850–970 region. As can be seen by the relative peak intensity of the internal standard triheptadecanoin (m/z 855), the triesters are present in relatively low concentrations. Peaks in this area, such as at m/z 863, 877, 905, 961, etc., were analyzed by MS/MS and were found to be singly charged Li+-bound mixed dimers primarily comprised of species from the 500–800 Da region non-covalently bound with species in the 300–500 Da region. The product ion spectrum of the m/z 897 peak (Figure 10(b)) contains ions that are consistent with the characterization of triglycerides, such as the m/z 267 peak for the C18 : 0 acylium ion [C18H35O]+, the lithium adduct of octadecanoic acid at m/z 291 [C18H36O2Li]+, the parent ion minus lithiated arachidinoate at m/z 579 [MLi – C20H39O2Li]+, the parent ion minus the neutral loss of arachidinoic acid at m/z 585 [MLi – C20H40O2]+, the parent ion minus lithiated octadecanoate at m/z 607 [MLi – C18H35O2Li]+ and the parent ion minus neutral loss of octadecanoic acid at m/z 613 [MLi – C18H36O2Li]+. A low-intensity peak is observed at m/z 641 from the loss of palmitic acid [MLi – C16H32O2]+. The absence of more of the ions of the fatty acids is probably due to the low concentration levels being measured. The spectrum also contains lower molecular mass ions from the fragmentation of the fatty acids through carbon–carbon bond cleavage. The peak at m/z 897 is thus assigned as the lithium adduct of a mixture of two triglyceride isomers with the predominant one being trioctadecanoin and the minor one being 1-arachidin-2-stearin-3-palmitin.
Figure 10.

(a) Expanded mass axis of the triester spectral region (m/z 850–970) of normal tear extract lithium adducts illustrating the occurrence of mixed dimers and low concentrations of triacylglycerols present in the extract. (b) Product ion spectrum with peak assignments of informative product ions of the m/z 897 precursor identified as an isomeric mixture of tristearin and 1-arachidin-2-stearin-3-palmitin.
Wax ester analysis
Also included in the extract is a peak at m/z 571 from the spiking addition of palmityl behenate, a fatty acid/fatty alcohol wax ester standard (see Fig. 1(e) for the structure). The wax ester was found to have a low ionization efficiency compared with the other components in the tear extract. This was expected, as the ionization efficiency for lipids with ammonium acetate showed a greater response as the polarity of the lipid increased28 (increase in number of alcohol groups, one for diglyceride, two for monoglyceride, etc.), while the product ions were only of the protonated species from the initial loss of NH3. This trend was also observed with an equimolar mixture of lipid standards, where the monoglycerides exhibited the greatest response, followed by the diglycerides, with the triglycerides showing the weakest response, although the product ions were mostly lithiated, with some appearing as fragment ions (e.g. acylium). Some of the experiments yielded good responses for the palmityl behenate wax ester standard, and peaks in the region expected for wax esters (m/z 500–700) were analyzed by MS/MS, but these peaks were not found to correspond to wax esters. The major components of the non-polar tear lipids have been reported in the past literature as wax esters,10-14 such as the C27 alcohol/C15 fatty acid wax ester which would have a lithiated mass at m/z 625. None of the simple, fatty alcohol/fatty acid wax esters58 were observed in any of the extracts reported in this study. Previous work in our laboratories (unpublished results) showed that the optimum response for lithiated phosphorylated lipids was at ∼10 mm LiCl. A new ionization–internal standard solution was used which contained 10 mm LiCl, instead of the 2mm LiCl solution which had been used in all previous experiments. While the individual wax ester standard gave an excellent response when run with 10 mm LiCl, poor responses were still achieved when it was present with other lipids in a mixture, suggesting that the low response for the wax ester standard was due to suppression from the acylglycerides. However, a search for the simple fatty alcohol/fatty acid wax esters, such as the C27 alcohol/C15 fatty acid wax ester (lithium adduct mass at m/z 625), resulted in the conclusion that the wax esters are probably not detectable by this method, as they are likely present below the method's limit of detection for wax esters (i.e. 1.4 × 10⁻⁵ mg μl−1, signal-to-noise ratio = 3) established for the spiked palmityl behenate internal standard. This means that under the method's conditions for ES of the lithium adducts, the wax and cholesterol esters are not observed. Other separation methods performed in our laboratories such as thin-layer chromatography (TLC) indicated that the wax and cholesterol esters are indeed present, but the current ES-MS method suppresses their response.
Quantification of the tear lipids
To estimate the concentration of the lipids in the extract, standards were chosen which were predicted to have ionization efficiencies very similar to those of the extracted lipids. For the m/z 20–500 region, monopentadecanoin was used with a lithium adduct mass of m/z 323; for the m/z 500–800 region, dipentadecanoin was used with a lithium adduct mass of m/z 547; for the m/z 800–1100 region, triheptadecanoin was used with a lithium adduct mass of m/z 855; for the wax esters, palmityl behenate was used with a lithium adduct mass of m/z 571. Figure 8(a) shows the spectrum of the lithium adducts of normal tear lipid extract where the locations of the internal standards are marked with ‘IS’. The concentrations of the four internal standards were chosen to be in the same approximate range as the extracted lipids, namely 3.65 × 10⁻⁵ mg μl−1 monopentadecanoin, 4.35 × 10⁻⁵ mg μl−1 dipentadecanoin, 5.2 × 10⁻⁵ mg μl−1 triheptadecanoin and 4.8 × 10⁻⁵ mg μl−1 palmityl behenate, all in 50 : 50 chloroform–methanol with 2 mm LiCl. To quantify the terpenoids, the response factor of the diacylglyceride dipentadecanoin was used owing to the expected similarity in ionization efficiency (one alcohol group) for the two.
Table 1 shows a comparison of quantitative results for the normal and dry eye tear lipid extracts. The total lipid extract value for the normal eye is 7.3 ± 0.7 μg μl−1, whereas the dry eye total lipid extract average result was determined as 14.0 ± 2.1 μg μl−1. This indicates that the total lipid content in dry eye tears is much greater, approximately double, compared with what is observed in normal eye tears. This might be explained by the fact that the dry eye may have less aqueous content in the tear layer compared with normal eyes, resulting in a higher concentration of lipids per microliter of tears. In particular, the glyceryl isoprene acetals appear to have increased in concentration the most (approximately three-fold relative to the normal eye). The relatively large standard errors of the means (see Table 1) indicate variation in lipid composition from sample to sample. The general overall pattern for the two lipid extracts is similar when comparing each compound's percentage of the total extract.
Table 1.
Comparison of quantitative results of normal and dry eye tear lipid extracts
| Compound identification | Li+ adduct (m/z) |
Normal eyea (mg μl−1) |
Dry eyeb (mg μl−1) |
Increase (%) |
|---|---|---|---|---|
| Free glycerol | 99 | 9.6 × 10⁻⁴ ± 2.3 × 10⁻⁴ | 1.5 × 10⁻³ ± 2.7 × 10⁻⁴ | 56 |
| Glycerylisoprene acetal | 153 | 6.8 × 10⁻⁴ ± 2.7 × 10⁻⁴ | 1.7 × 10⁻³ ± 8.5 × 10⁻⁴ | 150 |
| Glycerylisoprene acetal | 287 | 7.5 × 10⁻⁴ ± 2.9 × 10⁻⁴ | 1.8 × 10⁻³ ± 9.2 × 10⁻⁴ | 140 |
| Monopalmitin | 337 | 7.4 × 10⁻⁴ ± 1.6 × 10⁻⁴ | 1.1 × 10⁻³ ± 2.0 × 10⁻⁴ | 49 |
| Monostearin | 365 | 1.6 × 10⁻³ ± 3.4 × 10⁻⁴ | 2.5 × 10⁻³ ± 2.5 × 10⁻⁴ | 56 |
| Glycerylisoprene acetal | 421 | 1.2 × 10⁻³ ± 3.7 × 10⁻⁴ | 2.9 × 10⁻³ ± 1.6 × 10⁻³ | 142 |
| 1,3-Dipalmitin (major) | 575 | 1.4 × 10⁻⁴ ± 3.1 × 10⁻⁵ | 2.1 × 10⁻⁴ ± 2.3 × 10⁻⁵ | 50 |
| 1-Stearin-3-myristin (minor) | ||||
| 1-Myristin-2-stearin (minor) | ||||
| 1-Stearin-3-palmitin (major) | 603 | 5.2 × 10⁻⁴ ± 9.5 × 10⁻⁵ | 7.3 × 10⁻⁴ ± 2.7 × 10⁻⁵ | 40 |
| 1,3-Distearin (major) | 631 | 5.1 × 10⁻⁴ ± 9.0 × 10⁻⁵ | 7.2 × 10⁻⁴ ± 1.3 × 10⁻⁵ | 41 |
| Tristearin (major)c | 897 | 1.3 × 10⁻⁴ ± 5.5 × 10⁻⁵ | 1.8 × 10⁻⁴ ± 9.9 × 10⁻⁵ | 38 |
| 1-Arachidin-2-stearin-3-palmitin (minor) | ||||
| Total | 7.3 × 10⁻³ ± 7.1 × 10⁻⁴ | 1.4 × 10⁻² ± 2.1 × 10⁻³ | 92 |
Averages and standard errors of the mean reported for normal eye results were derived from four different sets of composite rabbit tear samples, where each composite set was analyzed separately. Tear composite volumes were 12, 12, 7, and 7 μL.
Dry eye results are the average and standard error of the mean of two different composite sets which were analyzed individually. Tear composite volumes were 6 and 7 μl.
Reported value for the triglyceride tristearin is substantially above the method's limit of detection for triglycerides (i.e. 5.8 × 10⁻⁶ mg μl−1).
CONCLUSIONS
MS/MS experiments on the major components of the total chloroform extracts identified that these compounds were more polar than the simple ‘fatty acid esterified to a fatty alcohol’ type of wax ester, which is what has been previously reported to make up the majority of the non-polar lipids. Empirical formulas were derived which can be used to calculate the number of oxygens and double bonds for the species in three mass regions which primarily indicate lipids. The first region (m/z 20–500) consists of free glycerol, three glycerylterpene acetals and monoacylglycerols with empirical formulas CnH2nO4Li+. The m/z 500–800 region consists of diacylglycerols with empirical formulas of CnH2n−2O5Li+ and the m/z 800–1100 region is comprised of triacylglycerols with empirical formulas CnH2n−4O6Li+.
The work reported here using lithium adducts, combined with ES-MS/MS, for the analysis of complicated biological extracts has shown a marked improvement over past approaches of TLC, HPLC/MS, derivative GC/MS, etc., that have been used to characterize the tear film lipids. New, informative product ion spectra are presented for lithiated monoacyl-, 1,2- and 1,3-diacyl- and triacylglyceride standards. Newly proposed structures and fragment pathways for the major product ions are presented for the 1,2- and 1,3-diglycerides and for the monoglyceride. The mass spectra of the lithium adducts of the acylglycerides contain detailed and informative product ions that were successfully used to identify the acylglycerides and the terpenoid-type compounds that were observed to be present in the tear extracts. Through the use of ES-MS/MS, the normal and dry eye rabbit tear extracted lipids were found to be primarily comprised of acylglycerides that exhibited high responses in ES, whereas the wax and cholesterol esters were not detected, presumably owing to ionization suppression. Also, with this approach, separation such as HPLC, TLC, SPE, etc., was not essential owing to separation by mass. Finally, all extracted compounds that are subsequently ionized and measured by the mass spectrometer can be quantified, and analyzed by MS/MS to identify their molecular structures.
Acknowledgements
Financial support was provided by the Louisiana Board of Regents through grant No. LEQSF (2001-04)-RD-B-11 and from the National Eye Institute through NEI/R03 EY014021, NEI/P30 EY002377, and Research to Prevent Blindness, Inc.
Contract/grant sponsor: Louisiana Board of Regents; Contract/grant numbers: LEQSF (2001-04)-RD-B-11; HEF (2001-06)-08.
Contract/grant sponsor: National Eye Institute; Contract/grant number: NEI/R03 EY014021.
Contract/grant sponsor: NEI/P30 EY002377.
Contract/grant sponsor: Research to Prevent Blindness, Inc.
REFERENCES
- 1.Schaumberg DA, Buring JE, Sullivan DA, Dana MR. Hormone replacement therapy and dry eye syndrome. JAMA. 2001;286:2114. doi: 10.1001/jama.286.17.2114. [DOI] [PubMed] [Google Scholar]
- 2.Bjerrum KB. Keratoconjunctivitis sicca and primary Sjogren's syndrome in a Danish population aged 30–60 years. Acta Ophthalmol. Scandi. 1997;75:281. doi: 10.1111/j.1600-0420.1997.tb00774.x. [DOI] [PubMed] [Google Scholar]
- 3.Schein OD, Munoz B, Tielsch JM, Bandeen-Roche K, West S. Prevalence of dry eye among the elderly. Am. J. Ophthalmol. 1997;124:723. doi: 10.1016/s0002-9394(14)71688-5. [DOI] [PubMed] [Google Scholar]
- 4.Murube J, Paterson A, Murube E. Classification of artificial tears. I: Composition and properties. Adv. Exp. Med. Biol. 1998;438:693. doi: 10.1007/978-1-4615-5359-5_99. [DOI] [PubMed] [Google Scholar]
- 5.Rieger G. Lipid-containing eye drops: a step closer to natural tears. Ophthalmologica. 1990;201:206. doi: 10.1159/000310154. [DOI] [PubMed] [Google Scholar]
- 6.Hillenkamp J, Reinhard T, Ross RS, Bohringer D, Cartsburg O, Roggendorf M, De Clercq E, Godehardt E, Sundmacher R. Topical treatment of acute adenoviral keratoconjunctivitis with 0.2% cidofovir and 1% cyclosporine: a controlled clinical pilot study. Arch. Ophthalmol. 2001;119:1487. doi: 10.1001/archopht.119.10.1487. [DOI] [PubMed] [Google Scholar]
- 7.Moore JC, Tiffany JM. Human ocular mucus. Chemical studies. Exp. Eye Res. 1981;33:203. doi: 10.1016/s0014-4835(81)80069-3. [DOI] [PubMed] [Google Scholar]
- 8.Carrington SD, Hicks SJ, Corfield AP, Kaswan RL, Packer N, Bolis S, Morris CA. Structural analysis of secreted ocular mucins in canine dry eye. Adv. Exp. Med. Biol. 1998;438:253. doi: 10.1007/978-1-4615-5359-5_37. [DOI] [PubMed] [Google Scholar]
- 9.McCulley JP, Shine WE. The lipd layer: the outer surface of the ocular surface tear film. Biosci. Rep. 2001;21:407. doi: 10.1023/a:1017987608937. [DOI] [PubMed] [Google Scholar]
- 10.Nicolaides N, Santos EC. The di- and triesters of the lipids of steer and human meibomian glands. Lipids. 1985;20:454. doi: 10.1007/BF02534237. [DOI] [PubMed] [Google Scholar]
- 11.Miyazaki M, Man WC, Ntambi JM. Targeted disruption of stearoyl-CoA desaturase1 gene in mice causes atrophy of sebaceous and meibomian glands and depletion of wax esters in the eyelid. Nutrient-Gene Express. 2001:2260. doi: 10.1093/jn/131.9.2260. [DOI] [PubMed] [Google Scholar]
- 12.McCulley JP, Shine WE. A compositional based model for the tear film lipid layer. Trans. Am. Ophthalmol. Soc. 1997;95:79. [PMC free article] [PubMed] [Google Scholar]
- 13.Mathers WD, Lane JA. Meibomian gland lipids, evaporation, and tear film stability. Adv. Exp. Med. Biol. 1998;438:349. doi: 10.1007/978-1-4615-5359-5_50. [DOI] [PubMed] [Google Scholar]
- 14.Nicolades N, Kaitaranta JK, Rawdah TN, Macy JI, Boswell FM, III, Smith RE. Meibomian gland studies: comparison of steer and human lipids. Invest. Ophthalmol. Vis. Sci. 1981;20:522. [PubMed] [Google Scholar]
- 15.Whitehouse CM, Dryer RN, Yamashita M, Fenn JB. Electrospray interface for liquid chromatographs and mass spectrometers. Anal. Chem. 1985;57:675. doi: 10.1021/ac00280a023. [DOI] [PubMed] [Google Scholar]
- 16.Kebarle P, Ho Y. In: Electrospray Ionization Mass Spectrometry. Cole RB, editor. Wiley; New York: 1997. p. 17. [Google Scholar]
- 17.Cole RB. Some tenets pertaining to electrospray ionization mass spectrometry. J. Mass Spectrom. 2000;35:763. doi: 10.1002/1096-9888(200007)35:7<763::AID-JMS16>3.0.CO;2-#. [DOI] [PubMed] [Google Scholar]
- 18.Cao P, Stults JT. Mapping the phosphorylation sites of proteins using on-line immobilized metal affinity chromatography/capillary electrophoresis/electrospray ionization multiple stage tandem mass spectrometry. Rapid Commun. Mass Spectrom. 2000;14:1600. doi: 10.1002/1097-0231(20000915)14:17<1600::AID-RCM68>3.0.CO;2-V. [DOI] [PubMed] [Google Scholar]
- 19.Ho YP, Huang PC, Deng KH. Metal ion complexes in the structural analysis of phospholipids by electrospray ionization tandem mass spectrometry. Rapid Commun. Mass Spectrom. 2003;17:114. doi: 10.1002/rcm.880. [DOI] [PubMed] [Google Scholar]
- 20.Kocher T, Allmaier G, Wilm M. Nanoelectrospray-based detection and sequencing of substoichiometric amounts of phosphopeptides in complex mixtures. J. Mass Spectrom. 2003;38:131. doi: 10.1002/jms.422. [DOI] [PubMed] [Google Scholar]
- 21.Shimazaki J, Sakata M, Tsubota K. Ocular surface changes and discomfort in patients with meibomian gland dysfunction. Arch. Ophthalmol. 1995;113:1266. doi: 10.1001/archopht.1995.01100100054027. [DOI] [PubMed] [Google Scholar]
- 22.Murphy RC. Mass Spectrometry of Lipids. Plenum Press; New York: 1993. Triacylglycerols, diacylglycerols and monoacylglycerols; p. 189. [Google Scholar]
- 23.Liu QT, Kinderlerer JL. Preparative thin-layer chromatographic separation and subsequent gas chromatographic–mass spectrometric analysis of monoacylglycerols derived from butter oil by fungal degradation. J. Chromatogr. A. 1999;855:617. doi: 10.1016/s0021-9673(99)00726-8. [DOI] [PubMed] [Google Scholar]
- 24.Harvey DJ, Tiffany JM. Identification of meibomian gland lipids by gas chromatography–mass spectrometry: application to the meibomian lipids of the mouse. J. Chromatogr. 1984;301:173. doi: 10.1016/s0021-9673(01)89187-1. [DOI] [PubMed] [Google Scholar]
- 25.Kuksis A, Marai L, Myher JJ. Reversed-phase liquid chromatography–mass spectrometry of complex mixtures of natural triacylglycerols with chloride-attachment negative chemical ionization. J. Chromatogr. 1991;588:73. [Google Scholar]
- 26.Marai L, Kukis A, Myher JJ, Itabashi Y. Liquid chromatography chloride attachment negative chemical ionization mass spectrometry of diacylglycerol dinitrophenylurethanes. Biol. Mass Spectrom. 1992;21:541. [Google Scholar]
- 27.Cole RB, Zhu J. Chloride anion attachment in negative ion electrospray ionization mass spectrometry. Rapid Commun. Mass Spectrom. 1999;13:607. [Google Scholar]
- 28.Duffin KL, Henion JD. Electrospray and tandem mass spectrometric characterization of acylglycerol mixtures that are dissolved in nonpolar solvents. Anal. Chem. 1991;63:1781. doi: 10.1021/ac00017a023. [DOI] [PubMed] [Google Scholar]
- 29.Han X, Gross RW. Quantitative analysis and molecular species fingerprinting of triacylglyceride molecular species directly from lipid extracts of biological samples by electrospray ionization tandem mass spectrometry. Anal. Biochem. 2001;295:88. doi: 10.1006/abio.2001.5178. [DOI] [PubMed] [Google Scholar]
- 30.Byrdwell WC, Neff WE. Dual parallel electrospray ionization and atmospheric pressure chemical ionization mass spectrometry (MS), MS/MS and MS/MS/MS for the analysis of triacylglycerols and triacylglycerol oxidation products. Rapid Commun. Mass Spectrom. 2002;16:300. doi: 10.1002/rcm.581. [DOI] [PubMed] [Google Scholar]
- 31.Marzilli LA, Fay LB, Dionisi F, Vouros P. Structural characterization of triacylglycerols using electrospray ionization-MSn ion trap MS. J. Am. Oil Chem. Soc. 2003;80:195. [Google Scholar]
- 32.Waltermann M, Luftmann H, Baumeister D, Kalscheuer R, Steinbuchel A. Rhodococcus opacus strain PD630 as a new source of high-value single-cell oil? Isolation and characterization of triacylglycerols and other storage lipids. Microbiology. 2000;146:1143. doi: 10.1099/00221287-146-5-1143. [DOI] [PubMed] [Google Scholar]
- 33.Schiller J, Arnhold J, Benard S, Muller M, Reichl S, Arnold K. Lipid analysis by matrix-assisted laser desorption and ionization mass spectrometry: a methodological approach. Anal. Biochem. 1999;267:46. doi: 10.1006/abio.1998.3001. [DOI] [PubMed] [Google Scholar]
- 34.Leary JA, Pederson SF. A reliable method for fast atom bombardment mass spectrometric analysis of α-aryl 1,2-diols. Formation of lithium–diol adducts. J. Org. Chem. 1989;54:5650. [Google Scholar]
- 35.Byrdwell WC. Atmospheric pressure chemical ionization mass spectrometry for analysis of lipids. Lipids. 2001;36:327. doi: 10.1007/s11745-001-0725-5. [DOI] [PubMed] [Google Scholar]
- 36.Mu H, Sillen H, Hoy CE. Identification of diacylglycerols and triacylglycerols in a structured lipid sample by atmospheric pressure chemical ionization liquid chromatography/mass spectrometry. J. Am. Oil Chem. Soc. 2000;77:1049. [Google Scholar]
- 37.Holcapek M, Jandera P, Fischer J. Analysis of acylglycerols and methyl esters of fatty acids in vegetable oils and in biodiesel. Crit. Rev. Anal. Chem. 2001;31:53. [Google Scholar]
- 38.Mottram HR, Woodbury SE, Evershed RP. Identification of triacylglycerol positional isomers present in vegetable oils by high performance liquid chromatography/atmospheric pressure chemical ionization mass spectrometry. Rapid Commun. Mass Spectrom. 1997;11:1240. [Google Scholar]
- 39.Holcapek M, Jandera P, Fischer J, Prokes B. Analytical monitoring of the production of biodiesel by high-performance liquid chromatography with various detection methods. J. Chromatogr. A. 1999;858:13. doi: 10.1016/s0021-9673(99)00790-6. [DOI] [PubMed] [Google Scholar]
- 40.Holcapek M, Jandera P, Zderadicka P, Hruba L. Characterization of triacylglycerol and diacylglycerol composition of plant oils using high-performance liquid chromatography—atmospheric pressure chemical ionization mass spectrometry. J. Chromatogr. A. 2003;1010:195. doi: 10.1016/s0021-9673(03)01030-6. [DOI] [PubMed] [Google Scholar]
- 41.Jakab A, Jablonkai I, Forgacs E. Quantification of the ratio of positional isomer dilinoleoyl-oleoyl glcerols in vegetable oils. Rapid Commun. Mass Spectrom. 2003;17:2295. doi: 10.1002/rcm.1193. [DOI] [PubMed] [Google Scholar]
- 42.Fauconnot L, Hau J, Aeschlimann JM, Fay LB, Dionisi F. Quantitative analysis of triacylglycerol regioisomers in fats and oils using reversed-phase high-performance liquid chromatography and atmospheric pressure chemical ionization mass spectrometry. Rapid Commun. Mass Spectrom. 2004;18:218. doi: 10.1002/rcm.1317. [DOI] [PubMed] [Google Scholar]
- 43.Hsu FF, Bohrer A, Turk J. Formation of lithiated adducts of glycerophosphocholine lipids facilitates their identification by electrospray ionization tandem mass spectrometry. J. Am. Soc. Mass Spectrom. 1998;9:516. doi: 10.1016/S1044-0305(98)00012-9. [DOI] [PubMed] [Google Scholar]
- 44.Zhou Z, Ogden S, Leary JA. Linkage position determination in oligosaccharides: MS/MS study of lithium-cationized carbohydrates. J. Org. Chem. 1990;55:5444. [Google Scholar]
- 45.Striegel AM, Timpa JD, Piotrowiak P, Cole RB. Multiple neutral alkali halide attachments onto oligosaccharides in electrospray ionization mass spectrometry. Int. J. Mass Spectrom. Ion Processes. 1997;162:45. [Google Scholar]
- 46.Hsu FF, Turk J. Structural characterization of triacylglycerols as lithiated adducts by electrospray ionization mass spectrometry using low-energy collisionally activated dissociation on a triple stage quadrupole instrument. J. Am. Soc. Mass Spectrom. 1999;10:587. doi: 10.1016/S1044-0305(99)00035-5. [DOI] [PubMed] [Google Scholar]
- 47.Adams J, Gross ML. Tandem mass spectrometry for collisionally activation of alkali-metal-cationized fatty acids: a method for determining double bond location. Anal. Chem. 1987;59:1576. [Google Scholar]
- 48.Wollensak G, Mur E, Mayr A, Baier G, Gottinger W, Stoffler G. Effective methods for the investigation of human tear film proteins and lipids. Graefe's Arch. Clin. Exp. Ophthalmol. 1990;228:78. doi: 10.1007/BF02764296. [DOI] [PubMed] [Google Scholar]
- 49.Augustin AJ, Spitznas M, Kaviani N, Meller D, Koch FHJ, Grus F, Gobbels MJ. Oxidative reactions in the tear fluid of patients suffering from dry eyes. Graefe's Arch. Clin. Exp. Ophthalmol. 1995;233:694. doi: 10.1007/BF00164671. [DOI] [PubMed] [Google Scholar]
- 50.Choy CK, Cho P, Chung WY, Benzie IF. Water-soluble antioxidants in human tears: effect of the collection method. Invest Ophthalmol. Vis. Sci. 2001;42:3130. [PubMed] [Google Scholar]
- 51.Folch J, Lees M, Stanley GHS. A simple method for the isolation and purification of total lipides from animal tissues. J. Biol. Chem. 1957;226:497. [PubMed] [Google Scholar]
- 52.Bligh EG, Dyer WJ. A rapid method of total lipid extraction and purification. Can. J. Biochem. Physiol. 1959;37:911. doi: 10.1139/o59-099. [DOI] [PubMed] [Google Scholar]
- 53.Brugger B, Erben G, Sandhoff R, Wieland FT, Lehmann WD. Quantitative analysis of biological membrane lipids at the low picomole level by nano-electrospray ionization tandem mass spectrometry. Proc. Natl. Acad. Sci. USA. 1997;94:2339. doi: 10.1073/pnas.94.6.2339. [DOI] [PMC free article] [PubMed] [Google Scholar]
- 54.Sullivan BD, Evans JE, Cermak JM, Krenzer KL, Dana MR, Sullivan DA. Complete androgen insensitivity syndrome. Arch. Ophthalmol. 2001;120:1689. doi: 10.1001/archopht.120.12.1689. [DOI] [PubMed] [Google Scholar]
- 55.Sullivan BD, Evans JE, Krenzer KL, Dana MR, Sullivan DA. Impact of antiandrogen treatment on the fatty acid profile of neutral lipids in human meibomian gland secretions. Clin. Endocrinol. Metab. 2000;85:4866. doi: 10.1210/jcem.85.12.7066. [DOI] [PubMed] [Google Scholar]
- 56.Sullivan BD, Cermak JM, Sullivan RM, Papas AS, Evans JE, Dana MR, Sullivan DA. Correlations between nutrient intake and the polar lipid profiles of meibomian gland secretions in women with Sjogren's syndrome. Adv. Exp. Med. Biol. 2002;506(PtA):441. doi: 10.1007/978-1-4615-0717-8_62. [DOI] [PubMed] [Google Scholar]
- 57.Sullivan BD, Evans JE, Dana MR, Sullivan DA. Impact of androgen deficiency on the lipid profiles in human meibomian gland secretions. Adv. Exp. Med. Biol. 2002;506(PtA):449. doi: 10.1007/978-1-4615-0717-8_63. [DOI] [PubMed] [Google Scholar]
- 58.Patel S, Nelson DR, Gibbs AG. Chemical and physical analysis of wax ester properties. J. Insect Sci. 2001;1.4:1. doi: 10.1673/031.001.0401. [DOI] [PMC free article] [PubMed] [Google Scholar]