

Abstract
Cytosolic calcium acts as both a coagonist and an inhibitor of the type 1 inositol 1,4,5-trisphosphate (InsP3)–gated Ca channel, resulting in a bell-shaped Ca dependence of channel activity (Bezprozvanny, I., J. Watras, and B.E. Ehrlich. 1991. Nature. 351:751–754; Finch, E.A., T.J. Turner, and S.M. Goldin. 1991. Science. 252: 443–446; Iino, M. 1990. J. Gen. Physiol. 95:1103–1122). The ability of Ca to inhibit channel activity, however, varies dramatically depending on InsP3 concentration (Combettes, L., Z. Hannaert-Merah, J.F. Coquil, C. Rousseau, M. Claret, S. Swillens, and P. Champeil. 1994. J. Biol. Chem. 269:17561–17571; Kaftan, E.J., B.E. Ehrlich, and J. Watras. 1997. J. Gen. Physiol. 110:529–538). In the present report, we have extended the characterization of the effect of cytosolic Ca on both InsP3 binding and InsP3-gated channel kinetics, and incorporated these data into a mathematical model capable of simulating channel kinetics. We found that cytosolic Ca increased the K d of InsP3 binding ∼3.5-fold, but did not influence the maximal number of binding sites. The ability of Ca to decrease InsP3 binding is consistent with the rightward shift in the bell-shaped Ca dependence of InsP3-gated Ca channel activity. High InsP3 concentrations are able to overcome the Ca-dependent inhibition of channel activity, apparently due to a low affinity InsP3 binding site (Kaftan, E.J., B.E. Ehrlich, and J. Watras. 1997. J. Gen. Physiol. 110:529–538). Constants from binding analyses and channel activity determinations were used to develop a mathematical model that fits the complex Ca-dependent regulation of the type 1 InsP3-gated Ca channel. This model accurately simulated both steady state data (channel open probability and InsP3 binding) and kinetic data (channel activity and open time distributions), and yielded testable predictions with regard to the regulation of this intracellular Ca channel. Information gained from these analyses, and our current molecular model of this Ca channel, will be important for understanding the basis and regulation of intracellular Ca waves and oscillations in intact cells.
Keywords: cerebellum; inositol 1,4,5-trisphosphate receptor; intracellular calcium channel; calcium signaling; kinetic model
introduction
The inositol 1,4,5-trisphosphate (InsP3)1–gated Ca channel plays a critical role in the regulation of intracellular Ca concentrations after hormonal activation of the phosphoinositide cascade in a wide variety of cell types (Abdel-Latif, 1986; Berridge and Irvine, 1989; Clapham, 1995). The mechanisms underlying regulation of the InsP3-gated channel are poorly understood; however, the involvement of both cytosolic Ca and InsP3 in the regulation of this channel is well established (Iino, 1990; Payne et al., 1990; Bezprozvanny et al., 1991; Finch et al., 1991; Bootman et al., 1995; Kaftan et al., 1997). That is, InsP3 is absolutely required for the opening of the channel, though channel activity can be modified by cytosolic Ca. Elevating the cytosolic Ca concentration from 0.01 to 0.3 μM in the presence of 2 μM InsP3, for example, resulted in a dramatic increase in channel activity (Bezprozvanny et al., 1991). Further elevation of cytosolic Ca, however, decreased channel activity, with near complete inhibition of the channel in the presence of 5 μM Ca (Bezprozvanny et al., 1991). Three basic models have been proposed to explain this bell-shaped Ca dependence of the channel differing in terms of the effects of InsP3 on the bell-shaped Ca dependence. In one model (Bezprozvanny, 1994), the peak of the bell-shaped Ca dependence is unaffected by InsP3 concentration. The other two models predict either a shift to the left (Tang et al., 1996) or the right (De Young and Keizer, 1992) in the peak of the bell-shaped Ca dependence of channel activity as InsP3 concentrations increase.
Recent studies indicate that the InsP3 concentration influences the Ca dependence of InsP3-induced Ca release, with an increased sensitivity to Ca-dependent inhibition occurring at low InsP3 concentrations (Hannaert-Merah et al., 1995; Kaftan et al., 1997). Thus, the peak of the bell-shaped Ca dependence of InsP3-gated channel activity shifted to the right as InsP3 concentration was increased from 0.2 to 2 μM (Kaftan et al., 1997). Further elevation of InsP3 concentration to 180 μM overcame the Ca-dependent inhibition of channel activity (Kaftan et al., 1997), which may reflect the presence of a second low affinity InsP3 binding site on the channel complex. Recently, we modeled this complex steady state behavior of the InsP3-gated channel by extending a basic 8-state model proposed previously (De Young and Keizer, 1992) to 16-states, assuming that there are two InsP3 (with dissociation constants of 0.3 and 10 μM) and two Ca binding sites per InsP3 receptor in the tetrameric channel complex (Kaftan et al., 1997). In the present report, we explored in further detail the Ca dependence of InsP3 binding, as well as the influence of Ca and InsP3 on the mean open times of the InsP3-gated channel, and incorporated these data into a novel mathematical model of the channel. The proposed model differs conceptually from previous models in that it focuses on the tetrameric channel complex as a unit, but more importantly it provides a better fit of the steady state channel and binding data, and simulates the kinetics of channel activation.
methods
Isolation of Microsomes
Microsomes were isolated from canine cerebellum, as described previously (Watras et al., 1991). To minimize proteolysis, all solutions used for the isolation/storage of the cerebellar microsomes included a protease inhibitor cocktail (5 μg/ml leupeptin, 2 μg/ml aprotinin, 1 μg/ml pepstatin A, 0.1 mM PMSF). In brief, cerebellum was homogenized in 6 vol of buffer A (20 mM HEPES, 0.1 mM EGTA, 5 mM NaN3, pH 7.2, 4°C) using a Brinkman polytron. The suspension was centrifuged at 4,000 g for 20 min, and then the supernatant was centrifuged at 100,000 g for 30 min. The pellet from the latter centrifugation was resuspended in 3 vol of buffer B (20 mM HEPES, 0.6 mM KCl, 20 mM Na4P2O5, 5 mM NaN3; pH 7.2, 4°C), and then centrifuged at 4,000 g for 20 min. The resulting supernatant was centrifuged at 100,000 g for 30 min. The final pellet was resuspended in buffer C (10 mM MOPS, 10% sucrose, pH 7.0) to a protein concentration of ∼6 mg/ml (as determined using a protein assay kit; Bio-Rad Laboratories; Bradford, 1976), quick frozen in liquid nitrogen, and stored at −80°C.
InsP3 Binding
InsP3 binding was determined by a centrifugation technique (Benevolensky et al., 1994), using buffer identical to that used for the InsP3-gated channel activity measurements (Bezprozvanny et al., 1991). Binding media contained 250 mM HEPES, 110 mM Tris, 1 mM ATP, 0.5 mM EGTA, pH 7.35, 0.6–1,200 nM 3H-InsP3, and CaCl2 (to yield the specified free Ca concentrations). InsP3 binding was initiated by addition of cerebellar membranes to the above buffer. After an 8-min incubation, InsP3 binding was terminated by centrifugation (40,000 g for 10 min). The supernatant was removed by aspiration. The pellets were dissolved in Soluene 350, and then assayed for radioactivity by liquid scintillation counting. Nonspecific binding was determined in the presence of 40–160 μM nonradioactive InsP3. Scatchard analysis of InsP3 binding was performed using an iterative curve-fitting routine for two binding sites (SigmaPlot; Jandel Scientific). All binding studies were replicated three to five times, with different microsomal preparations.
Calculations of total Ca needed to obtain a specified free Ca concentration were based on previously published association constants (Fabiato, 1988), adjusted to pH 7.35 (at the specified temperature; 0° or 22°C). The apparent association constants (M−1) for Ca-EGTA and Ca-ATP used for these calculations were 1.055 × 10⁷ and 7.595 × 10³, respectively, at 0°C, and 1.244 × 10⁷ and 6.312 × 10³, respectively, at 22°C.
Measurement of Channel Activity
InsP3-gated channel activity was measured as described previously (Bezprozvanny et al., 1991; Kaftan et al., 1997), using 53 mM Ba in the trans chamber as current carrier. The planar lipid bilayer contained phosphatidylethanolamine and phosphatidylserine (3:1 wt:wt; Avanti Polar Lipids), dissolved in decane (20 mg/ml). Cytosolic bilayer solutions contained 500 μM Na-ATP, 500 μM EGTA, 110 mM Tris, and 250 mM HEPES, pH 7.35. Luminal solutions contained 53 mM Ba(OH)2, 250 mM HEPES, pH 7.35. Calibrated CaCl2 was added to the cytoplasmic solution to obtain the desired free Ca concentration (Fabiato, 1988). The free Ca concentration was checked by spectrofluorometric measurements using BTC (Molecular Probes, Inc.). InsP3-gated channel activity was initiated by addition of InsP3 (at the specified concentration). The number of channels in each experiment was estimated from the maximum number of channels observed simultaneously in the bilayer (Horn, 1991). The InsP3 dependence of the open probability, measured at a fixed Ca concentration, was used to correct for variations in the maximum open probability among individual channels. Transmembrane voltage was maintained at 0 mV and the single channel current was amplified (Warner Instruments) and stored on VHS tape (Instrutech Corp.). Data were filtered at 1 kHz and digitized at 5 kHz for computer analysis using pClamp 6.0 (Axon Instruments).
Modeling
Modeling InsP3-gated channel activity was done by considering the tetrameric channel complex as one functional unit having four medium affinity InsP3 binding sites (K d = 0.3 μM at 22°C), four low affinity InsP3 binding sites (K d = 10 μM at 22°C), and four Ca binding sites. The mathematical model assumes mass action kinetics with first order on (k +) and off (k −) rates for the binding of any ligand (L) to a specific site on the receptor monomer subunit (R), which was described by ordinary differential equations of the form:
 |
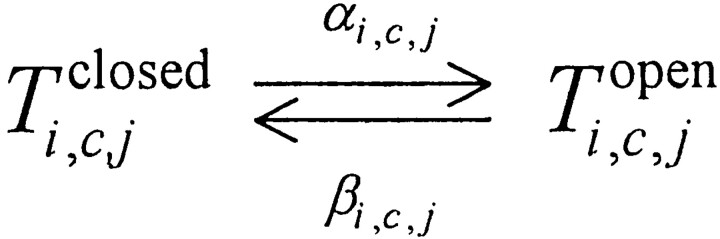
At equilibrium, the distribution of the receptor states is a function of the ligand dissociation constant (K d = k −/k +) and free concentration of ligand. The four InsP3 receptor subunits comprising the channel complex were considered identical and positionally equivalent, and a state transition reaction scheme was constructed for the 125 possible states of the channel tetramer complex (T) (see results). The various K d values fully define the steady state distribution of states and allowed us to calculate the relative abundance t i, c, j = [T i, c, j]/[T total] (of tetramers with i and j InsP3 molecules bound to the medium and low affinity site, respectively, and c Ca molecules bound) by solving a linear system of first degree equations that result from the equilibrium condition for formation/degradation of each state. The no–flux equilibrium condition, as well as several assumptions regarding binding interactions, were used to constrain the various dissociation constants that were not directly inferred from binding experiments (see results). Channel states characterized by the binding of one to two Ca and two to four InsP3 molecules were assumed to be “active;” i.e., exhibit a high open probability. InsP3 binding to the low affinity site was assumed to create an active state, independent of InsP3 and/or Ca binding to other sites within the channel complex. Channel activity was described as a transition between two substates, open and closed (Scheme I). First order reaction rates were assumed for both transitions, and the resulting open probability for any given state of the channel is:
 |
 (scheme i)
Iterative curve-fitting of the InsP3-gated Ca channel open probability data given the Ca dependence of InsP3 binding using a standard quasi-Newtonian algorithm with forward differencing and quadratic extrapolation was then performed to determine the values of unknown parameters. The open time histograms were used to further constrain the model and facilitate kinetic simulations. Diffusion-limited on rates of binding were assumed in all steps for both Ca and InsP3 binding and each off rate was determined by multiplication with the respective dissociation constant. Channel opening and closing rates were determined from the open probabilities of the respective active states given the constraints imposed on closing rates in order to match the experimental distribution histogram of open states. Simulations of the single channel recordings were performed by stochastic modeling of state transition events of the channel complex, using a Markovian model of probability matrix decomposition (Colquhoun and Hawkes, 1983) to predict state transitions over a given time period. The behavior of the channel is calculated from the matrix differential equation:
 |
where the elements p m,n(t) of the matrix P(t) are the probabilities of a channel to get from state m to n over the time period t and the elements of the matrix are the rates of transition from state m to n. The solution of this equation is:
 |
where I is a unit matrix. Relaxation from a random state (picked according to steady state distribution probability) was simulated for the desired time length to obtain channel state data sets at the chosen time step. Predicted traces were generated for the simultaneous presence of up to 10 channels in the membrane from individual current functions: i(t) = −A · χ(t) + S(t), where A is the current amplitude through the open channel, χ(t) is either 0 or 1, depending on whether the channel is in one of the closed or one of the open states, respectively, and S(t) is a standard noise spectrum function chosen to match the experimentally observed noise in any given trace.
results
Ca Inhibition of InsP3 Binding
There have been conflicting reports on the influence of Ca on InsP3 binding. Initial reports indicated that micromolar Ca concentrations could completely inhibit InsP3 binding, with half-maximal inhibition occurring at 0.3 μM Ca (Worley et al., 1987; Supattapone et al., 1988). On the other hand, Ca-dependent inhibition of cerebellar membranes can also occur as an artifact resulting from activation of an endogenous phospholipase C (Mignery et al., 1992). We have re-investigated the influence of Ca on InsP3 binding, with the goal of relating Ca-dependent modulation of InsP3 binding to the bell-shaped Ca dependence of channel activity. As shown in Fig. 1 A, micromolar Ca decreased InsP3 binding when using media identical to that used for channel activity measurements. Ca concentrations as high as 100 μM resulted in only partial inhibition of InsP3 binding (Fig. 1 A, filled bars), in contrast to the near complete inhibition previously reported (Worley et al., 1987). The inhibitory effects of Ca on InsP3 binding were reversed by addition of EGTA (Fig. 1 A, hatched bars), ruling out contributions of Ca-dependent activation of an endogenous phospholipase C (Mignery et al., 1992; Benevolensky et al., 1994). Moreover, the presence of 100 μM free barium, an inhibitor of phospholipase C (Benevolensky et al., 1994), did not alter this Ca-dependent inhibition of InsP3 binding (data not shown).
Figure 1.
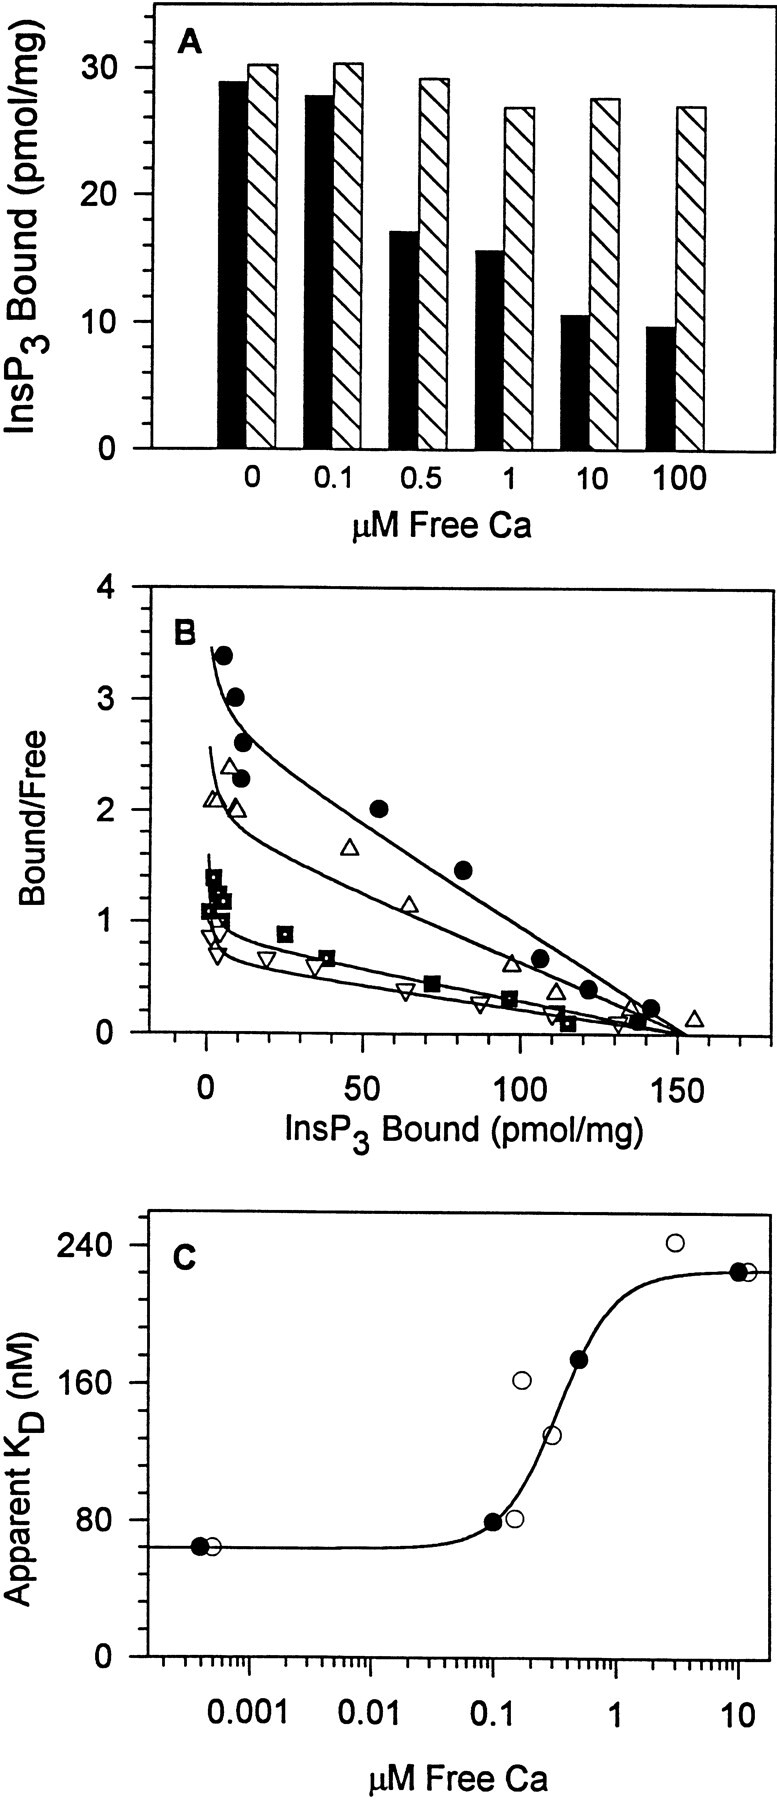
Micromolar Ca inhibits InsP3 binding to cerebellar membranes by increasing the K d for InsP3. (A) InsP3 binding decreased 66% when the Ca concentration was increased from 0 to 100 μM (solid bars), and this inhibition was fully reversible upon chelation of Ca by EGTA (hatched bars). The InsP3 concentration was 10 nM. One of three similar experiments. (B) Scatchard analysis indicated that Ca decreased InsP3 binding affinity without a change in maximal binding. Concentrations of Ca tested were 0.0004 (•), 0.1 (▵), 0.5 (▪), and 10 (▿) μM. Note that complete inhibition of InsP3 binding was not observed. (C) The K d values from B plotted as a function of the Ca concentration for two experiments (• and ○). The Ca-dependent increase in the K d for InsP3 binding increased 3.5-fold over the Ca concentration range tested with half maximal increase at 0.3 μM Ca (data were fit using a Hill equation with a coefficient n = 1.5).
Scatchard analyses of InsP3 binding (Fig. 1 B) indicated that this decreased InsP3 binding was attributable to a Ca-dependent increase in the K d for InsP3 binding. The Scatchard plots were nonlinear, suggesting the presence of multiple InsP3 binding sites. Data (which were obtained over an InsP3 concentration range of 1–600 nM) could be fit assuming two InsP3 binding sites (with K d values of 1 and 50 nM in the absence of Ca). The concentration of InsP3 used was too low to observe the low affinity InsP3 binding site discussed below (Kaftan et al., 1997). The 50-nM binding site was abundant, representing 99% of the total sites in the absence of Ca. As the Ca concentration was increased from 0.0004 to 10 μM, the apparent K d for this site increased 3.5-fold (Fig. 1, B and C). Half maximal inhibition occurred at 0.3 μM Ca with a Hill coefficient of 1.5. The high affinity InsP3 binding site, by contrast, was in very low abundance, representing <1% of the total sites at all Ca concentrations examined, and its K d (1 nM) appeared to be Ca independent (consistent with our previous observations in aortic smooth muscle microsomes; Benevolensky et al., 1994).
To more closely resemble the conditions used for channel activity determinations, InsP3 binding assays were repeated at room temperature again using media identical to that employed in the single channel experiments. Increasing the temperature to 22°C resulted in a 67% reduction in InsP3 binding; an inhibition that was reversed by reducing the temperature to 0°C (Fig. 2 A). Scatchard analyses of InsP3 binding at 0° and 22°C (Fig. 2 B) show that the increase in temperature results in a decrease in InsP3 binding affinity, with no apparent effect on the maximal number of InsP3 binding sites. The calculated Q 10 for this temperature-dependent change in InsP3 binding affinity was 2.3, consistent with that calculated for InsP3 binding to rat basophilic leukemia cells (Watras et al., 1994).
Figure 2.

Temperature dependence of InsP3 binding to cerebellar microsomes. (A) Binding decreased 66% upon elevation of the temperature from 0° to 22°C (compare open and filled bars). This change in binding is reversible (compare filled and gray bars). (B) The decrease in InsP3 binding results from a decrease in binding affinity without alteration in the maximum binding. The Q 10 was calculated as 2.3.
The Ca dependence of InsP3 binding was also reexamined at 22°C (Fig. 3), and yielded results similar to those observed at 0°C (Fig. 1). As shown in Fig. 3 A, micromolar Ca concentrations reduced InsP3 binding (measured in the presence of 170 nM InsP3) by 55% (▪), and this inhibition was completely reversed by Ca chelation with EGTA (□, dotted line). Increasing the Ca concentration to 100 μM did not increase the extent of the inhibition (data not shown), consistent with our previous observations in aortic smooth muscle microsomes (Benevolensky et al., 1994). The Ca-dependent inhibition at 22°C showed a high level of cooperativity (Hill coefficient, 2.8; half-maximal inhibition at 0.45 μM Ca) (Fig. 3 A), and was attributable to a Ca- dependent increase in the K d for InsP3 binding (Fig. 3 B). The K d for InsP3 binding at 22°C increased from 0.30 (at 0.0005 μM Ca; ○) to 1.78 μM in the presence of a high Ca concentration (•; 50 μM free Ca) (Fig. 3 B). There was no evidence for an effect of Ca on the maximum number of InsP3 binding sites at either 0° or 22°C.
Figure 3.
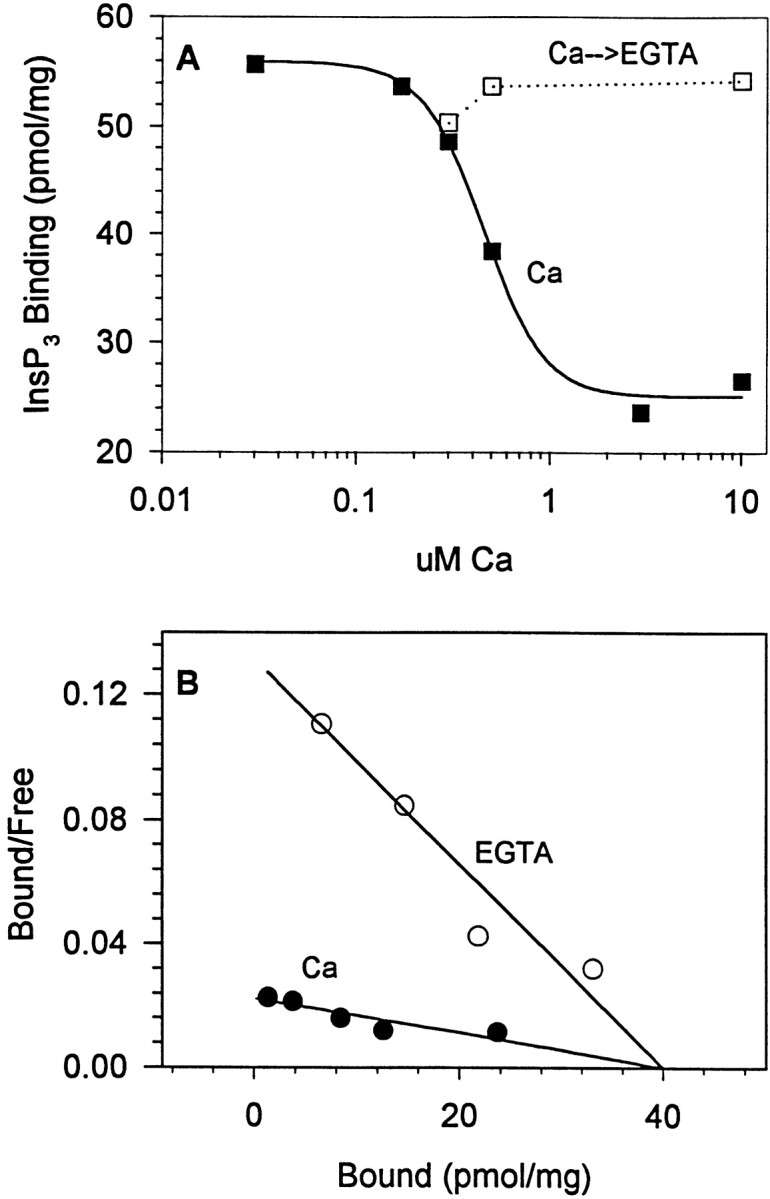
Ca-dependent inhibition of InsP3 binding to cerebellar microsomes, measured at 22°C (A and B) resembles that seen at 0°C (Fig. 1). In the presence of 170 nM InsP3 (A), an increase in Ca concentration from 0.1 to 10 μM resulted in a 55% reduction in InsP3 binding (▪; curve fit is an inverse Hill equation showing half-maximal inhibition at 0.45 μM Ca), which was completely reversible upon Ca chelation by EGTA (□/dotted line). B shows that, at 22°C, Ca decreased InsP3 binding by increasing the dissociation constant for InsP3, similar to that seen at 0°C (Fig. 1 B). Ca concentrations in B were 0.005 (○) and 50 (•) μM, with calculated InsP3 dissociation constants of 0.30 and 1.781 μM, respectively. The microsomal preparation used in B exhibited a lower maximal binding level than the preparation used in A, though the basic response to Ca was consistently observed in five different experiments.
The Scatchard analyses in Figs. 2 and 3 show the presence of only one InsP3 binding site (K d = 50 nM at 0°C and 312 nM at 22°C) due to the range of InsP3 concentrations used (5 nM–1 μM), where neither the high (K d = 1 nM) nor the low (K d = 10 μM) affinity site can be resolved. These sites are observed only if one extends the InsP3 concentration range below 1 nM (as in Fig. 1) and above 5 μM (Kaftan et al., 1997). Three InsP3 binding sites were observed in cerebellar microsomes and purified InsP3 receptor preparations, purified by either heparin-agarose chromatography or immunoprecipitation (Kaftan et al., 1997). In all assays, the 1-nM InsP3 binding site was a minor component, whereas the medium and low affinity InsP3 binding sites were abundant. At 0°C, the calculated dissociation constants for InsP3 binding to these two predominant InsP3 binding sites were 50 nM (medium affinity site) and 10 μM (low affinity site) (Kaftan et al., 1997). At 22°C, the dissociation constant of the 50-nM site increased to ∼300 nM, whereas the dissociation constant for the 10-μM InsP3 binding site could not be accurately ascertained. It appeared to remain in the 10-μM range, suggesting that the low affinity InsP3 binding site was largely temperature insensitive.
InsP3 Dependence of Channel Activity
We previously reported that the Hill coefficient for InsP3-induced Ca release was 1.3, whereas the single channel activity determinations suggested a Hill coefficient 1.0 (Watras et al., 1991). The previous experiments underestimated the Hill coefficient because the lowest concentration of InsP3 used activated the channel to 10% of the maximum, a level of activity too high for accurate measurements of cooperativity. Reinvestigation of the channel activity at lower InsP3 concentrations indicate that the Hill coefficient for channel activity measurements is at least 1.7 (Fig. 4). This value for the Hill coefficient may reflect the requirement for InsP3 to bind to at least two of the four InsP3 receptors to activate the channel.
Figure 4.

The InsP3 dependence of channel activation. The open probability of single InsP3-gated channels was plotted as a function of the InsP3 concentration. Cytosolic Ca concentration was fixed at 0.16 μM. Constants obtained from the fit (Hill equation) were incorporated into the mathematical model described below. Based upon the observed value for the Hill coefficient (1.7), the model was constrained to require the binding of two molecules of InsP3 to open the channel.
Open-Time Distribution of InsP3-gated Channels
Open-time histograms of InsP3-gated channels at two different cytoplasmic Ca concentrations were fit assuming an exponential with two time constants (Fig. 5). Increasing the number of time constants to three did not statistically improve the fit. In the presence of 0.01 μM Ca and 2 μM InsP3 (Fig. 5 A), the appropriate time constants were 1.8 and 9.3 ms. As the Ca concentration was increased to 0.1 μM (Fig. 5 B), the time constants decreased to 0.6 and 4.7 ms. Thus, the channel open times are Ca dependent. Similar analyses were done at a number of Ca and InsP3 concentrations, with the appropriate time constants incorporated into the mathematical model (described below).
Figure 5.

Single channel open times decrease as Ca concentration is elevated from 0.01 (A) to 0.1 (B) μM Ca. These panels are representative of the analyses done over a range of Ca and InsP3 concentrations. At least two classes of open times were evident at each calcium concentration. Curve fits were biexponential decays with time constants of 1.8 and 9.3 ms (A; 2:1 weighting) and 0.6 and 4.6 ms (B; 1:1 weighting).
Modeling Channel Activity Data and InsP3 Binding
Recent studies indicate that the cerebellar InsP3-gated Ca channel exhibits a complex regulation by Ca and InsP3 (Kaftan et al., 1997). Data points from this earlier report are shown in Fig. 6; lines through the points represent the fit using the model described in the present report (Fig. 6 A). For comparison, the fit obtained using the 16-state model (Kaftan et al., 1997) is also shown (Fig. 6 B), but fails to accurately predict channel activity at low InsP3 concentrations. The current model provides an excellent fit of the channel data over a broad range of InsP3 and Ca concentrations.
Figure 6.
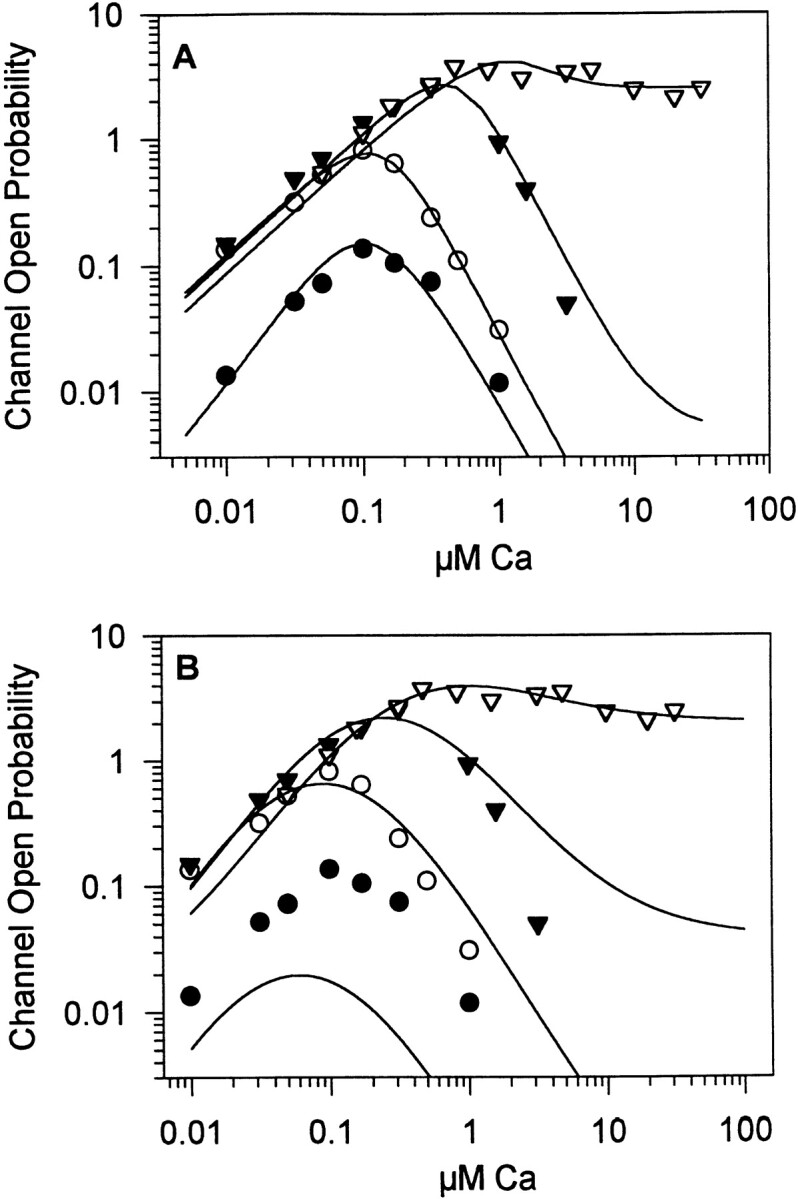
The mathematical model described in the text was used to fit the steady state channel open probability data, measured over a broad range of InsP3 and Ca concentrations. Single channel data were obtained at four InsP3 concentrations: 0.02 (•), 0.2 (○), 2 (▾), and 180 (▿) μM, and fit using the current mathematical model (A) or the 16-state model described previously (B; Kaftan et al., 1997), constrained by the InsP3 binding data. Single channel data points were taken from Kaftan et al. (1997).
Simple mass-action kinetics was assumed for ligand binding to the sites on the receptor monomer subunits (see methods). Since the functional unit of the channel is the tetrameric complex (T), this analysis was extended by introducing apparent dissociation constants for sequential binding to the four monomer subunits. A total of 24 = 16 possible different states of the channel can be generated by binding of up to four ligand molecules to the same site on the four different monomer subunits of the tetramer. We considered the subunits identical and positionally equivalent, which reduces the 16 states to only 5 different states according to Scheme II.
The resulting apparent dissociation constants for sequential binding are:
 |
This general framework was applied to InsP3 and Ca binding to the channel complex, assuming that each monomer in the tetrameric channel complex contains the equivalent of one Ca regulatory site (C), one medium affinity InsP3 site (I), and one low affinity InsP3 site (J). This results in five different states of the tetrameric channel complex (zero, one, two, three, or four sites occupied) for each of the three classes of sites (C, I, and J). A total of 53 = 125 different states per channel complex are predicted (T
i,c,j, where i, c, and j represent the number (zero to four) of ligand molecules bound to the I, C, and J sites, respectively). Fig. 7 shows the state transition scheme for the 25 states in the absence of InsP3 binding to the low affinity site (T
i,c,0). The apparent dissociation constants of binding of InsP3 to the I site were labeled  (for a tetramer that has i other I sites and c of the C sites occupied) and of Ca binding to the C site were labeled
  (for a tetramer that has c other C sites and i of the I sites occupied). This reaction scheme was extended upwards by drawing four additional planes to include binding to the low affinity InsP3 binding site (J).
Figure 7.

Partial schematic representation of the current model. Positional equivalence of the monomer subunits reduces to five the number of states of the channel tetramer generated by ligand binding to one regulatory site. The 25 states obtained by Ca and InsP3 binding to the C and I sites and the corresponding apparent dissociation constants of the transition reactions are depicted. Four similar planes (each containing 25 additional states) are drawn upwards in the full three-dimensional model to include binding to the low affinity InsP3 site (J). Highlighted transition reactions exemplify one of many cycles that are formed in which the corresponding four K′d values are constrained by the thermodynamic condition of no-flux equilibrium. The “active” states (that have significant P open values and undergo transitions between two substates, open and closed) are also highlighted. See text for details.
The “gating” or “regulatory” action of ligand binding to the various sites on the channel is in effect determined by the differences in the opening/closing transition rates of the different states (see methods; i.e., a state with α ≈ 0 is an “inactive” state). Essentially, “active” states were hypothesized to be channels having either two or more medium affinity InsP3 sites and one or two Ca sites occupied (Fig. 7, highlighted states; a total of eight active states in the absence of binding to the J site). Additionally, active states were channels having two or more low affinity InsP3 sites (J) and any number of Ca sites occupied (in upper planes of the full 125-state model, not shown in Fig. 7). The activation of the channel through J was thus assumed to overcome Ca-dependent inhibition of the channel, consistent with experimental observations (Kaftan et al., 1997).
At any given Ca and InsP3 concentration, the only parameters needed to calculate the steady state relative distribution of the different states and the overall channel open probability were the various apparent dissociation constants
 |
and the open probabilities of the various states . Some of these parameters could be inferred from measured dissociation constants based on several assumptions and constraints. In accordance with the thermodynamic principle of detailed equilibrium (Hille, 1992), reaction rates between any combination of states that form a complete cycle (e.g., the highlighted set of four transitions in Fig. 7) were constrained to yield no net flux at equilibrium. Thus, the apparent dissociation constants
  of binding to the C and I site were constrained as follows:
 |
With regard to interactions when binding to the same site on different monomer subunits, we assumed that Ca binding is cooperative  whereas InsP3 binding is independent
  ; for simplicity, we assumed that the cooperative effect is the same for each step during sequential binding of Ca; i.e., the ratio
  is the same for c = 0...3 (the value of this ratio is a parameter we named cooperativity factor, κCa). The dissociation constants for InsP3 were derived directly from the binding data (Fig. 1 C, and Table I). For the I site, we used
  = 0.3 μM (no Ca bound) and
  = 1.05 μM (for c > 0, reflecting the noncompetitive inhibition of InsP3 binding by Ca). Binding of InsP3 to the low affinity site appears independent of binding to any other sites with a dissociation constant
  = 10 μM. Given the above constraints and InsP3 binding parameters, all the dissociation constants for Ca binding could be derived from only two parameters,
  and κCa. The values of these as well as of
  were obtained through standard curve-fitting algorithms for the predicted channel open probability data (Table I). The predicted K
d of Ca binding to the first site is 0.7 μM, which approximates the reported K
d for Ca binding to a cytoplasmic region of the type 1 InsP3 receptor (Sienaert et al., 1996). Table I summarizes all the parameters used to construct the model.
were obtained through standard curve-fitting algorithms for the predicted channel open probability data (Table I). The predicted K
d of Ca binding to the first site is 0.7 μM, which approximates the reported K
d for Ca binding to a cytoplasmic region of the type 1 InsP3 receptor (Sienaert et al., 1996). Table I summarizes all the parameters used to construct the model.
Table I.
Model Parameters
| InsP3 binding | ||||
|---|---|---|---|---|
| Medium affinity site |

|
0.3 μM | ||
 (c > 0) (c > 0) |
1.05 μM | |||
| Low affinity site |

|
10 μM | ||
| On rates |

|
250 μM−1 s−1 | ||
| Ca binding | ||||
| For first molecule |

|
0.7 μM | ||
| Cooperativity factor |

|
2.6 | ||
| On rates |

|
10 μM−1 s−1 | ||
| Channel activity | ||||
| Open probabilities |
 c = 1,2; i = 1...4) c = 1,2; i = 1...4) |
0.04...0.13 | ||
 (j > 1) (j > 1) |
0.033 | |||
| Opening rates | αi, c, j | 2...40 s−1 | ||
| Closing rates | βi, c, j | 150...1000 s−1 |
Simulation of Channel Kinetics
A sample recording of InsP3-gated channel activity obtained in the presence of 0.2 μM InsP3 and 0.1 μM Ca (Fig. 8 A) is shown for comparison with channel activity predicted by the model (B). Using constants derived from the InsP3 binding analyses, channel open time histograms, and the steady state open probability data, the mathematical model described above was used to generate a time course of channel activity in the presence of 0.2 μM InsP3 and 0.1 μM Ca. The predicted channel activity data (Fig. 8 B) closely resemble the actual channel recording (A); moreover, quantitative comparisons show that the dwell time histogram of a simulated trace (Fig. 8 C) could be fitted with a double exponential curve using identical time constants as those used to fit the experimental data obtained at the same Ca and InsP3 concentrations (Fig. 5 B).
Figure 8.
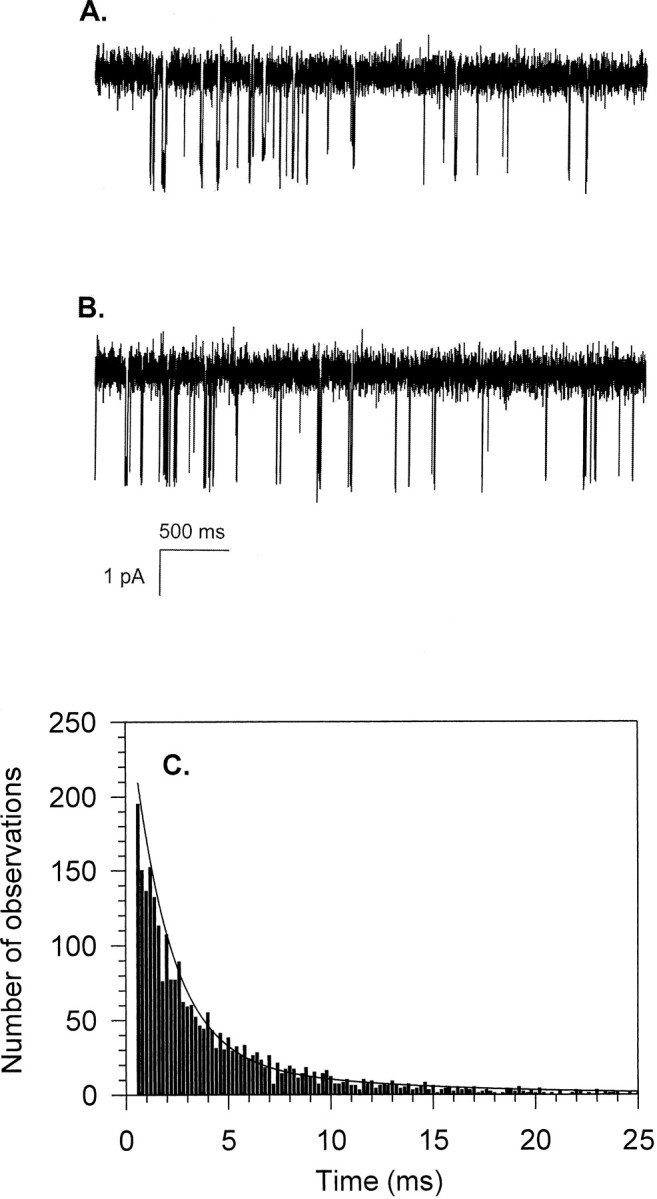
Comparison of single channel currents in the presence of 0.2 μM InsP3 and 0.1 μM free Ca. A represents an experimentally measured channel recording, whereas B represents a simulation, generated from the current mathematical model. C shows a dwell-time histogram obtained from 5 min of the simulated trace from which a representative stretch is shown in B. The open time distribution is accurately fit by a biexponential curve using the same parameters as for the experimental data shown in Fig. 5 B.
The parameter list used for the steady state analysis (and values) is not sufficient to calculate the values required to fill the transition rate matrix (see methods). This requires explicit numbers for the on and off rates (k + and k − values) and opening and closing rates (α and β values). The on rates for binding were based assuming diffusion limitation for both Ca and InsP3 (10 and 250 μM−1 s−1, respectively; this includes the effect of buffering for Ca) binding. The channel closing rates were based on the single channel open time distribution histograms. A minimum of two different closing rates is demonstrated by the biexponential fits of the dwell times. To accurately predict the apparent time constants and relative ratios, as well as their change with increasing Ca concentration (Fig. 5), we used four different closing rates ranging from 150 to 1,000 s−1 (Table I) whereby the faster rates were assigned to the active states with two Ca bound and the slower rates to the active states with one Ca bound. The corresponding binding off rates and channel opening rates were then calculated using the parameter values from the steady state simulations:
 |
To maintain the necessary matrix algebra at a manageable size, we limited ourselves to simulations of channel activity under conditions with [InsP3] ≤ 2 μM, so that the effect of the J site on channel activity is negligible and only the 25 states depicted in Fig. 7 (and the corresponding substates of the active states) have to be included in the calculations.
To produce simulated traces of channel current recording, we generated predicted relaxation data. An initial state was chosen for time 0, either arbitrarily or the most probable state for the given Ca and InsP3 concentration (as indicated by the steady state distribution values). We calculated the probability matrix P(t) for a time value equal to the chosen sampling interval in single channel records (τ = 40 μs), and generated data sets of predicted channel states at the given sampling rate for a desired length of simulation. Fig. 8 B shows a representative segment of a simulated trace with 2.1 pA open channel current amplitude and normally distributed baseline noise of 1 kHz median frequency.
The current mathematical model is thus capable of modeling both steady state open probability data, ligand binding data, and channel kinetics.
discussion
Recent studies in our laboratory indicate that Ca and InsP3 interact to increase the dynamic range of the InsP3-gated Ca channel (Kaftan et al., 1997). At a resting intracellular Ca concentration of 0.05–0.1 μM, agonist-induced production of InsP3 would be expected to activate the InsP3-gated Ca channel, with a subsequent rise of intracellular Ca (up to 0.3 μM) promoting further activation of the channel through a positive feedback mechanism (Iino, 1990; Bezprozvanny et al., 1991; Finch et al., 1991). Negative feedback of Ca on the InsP3-gated channel, however, will limit the rise of intracellular Ca, with near complete inhibition of the channel at 5 μM Ca, even in the presence of 2 μM InsP3 (Bezprozvanny et al., 1991). Increasing the InsP3 concentration results in a rightward shift in the bell-shaped curve (Kaftan et al., 1997). Thus, the channel is more sensitive to the inhibitory effects of Ca when the InsP3 concentration is low. This may be important physiologically, as it would further limit the rise in intracellular Ca in the presence of low InsP3 concentrations. That is, it would promote a more gradual rise in intracellular Ca concentration over the InsP3 concentration range 0.02–2 μM. Conversely, very high InsP3 concentrations can largely overcome this Ca-dependent inhibition of the channel (Kaftan et al., 1997), preventing closure of the channel in local/confined areas such as those near the site of InsP3 production.
An important question concerns the mechanism(s) responsible for this complex regulation of the InsP3-gated channel. Our working hypothesis has been that the previously reported Ca-dependent decrease in InsP3 binding is involved. Although micromolar Ca has been reported to completely inhibit InsP3 binding to cerebellar membranes (Worley et al., 1987; Supattapone et al., 1988), our results reveal only a partial (<50%) inhibition of InsP3 binding. As 95–99% of the InsP3 receptors in the cerebellum have been shown to be of the type 1 isoform (Sudhof et al., 1991; Wojcikiewicz, 1995), it is unlikely that this partial inhibition is due to heterogeneity of InsP3 receptors. Instead, the Ca-dependent decrease in InsP3 binding appears to reflect a change in the affinity for InsP3. This was first suggested in a report showing that the K d for InsP3 binding to rat cerebellar membranes increased from 0.04 to 0.12 μM (Joseph et al., 1989). Such a shift in InsP3 affinity has also been observed in aortic smooth muscle membranes (Benevolensky et al., 1994). Using binding conditions identical to those used for the channel activity determinations, the present study also shows a Ca-dependent shift in InsP3 affinity, though the calculated K ds are substantially higher than those previously reported. Thus, the binding affinities for InsP3 reported in the present study are comparable to the calculated InsP3 affinity for channel activation. The reason for the relatively high K d values in the present study involves in large part the high temperature dependence of the binding constant (Q 10 = 2.3 for the cerebellar membranes). That is, InsP3 binding studies are typically done on ice (0°C), whereas channel activity determinations are done at room temperature (23°C). In the present study, however, efforts were made to closely match both the InsP3 binding and channel analyses. A similar Q 10 (2.0) has been reported for the K d of InsP3 binding to rat basophilic leukemia cells (Watras et al., 1994), which was useful for modeling Ca release using InsP3 binding data.
The eight-state model originally proposed for the regulation of the InsP3-gated Ca channel (De Young and Keizer, 1992) represents one possible explanation for the bell-shaped Ca dependence of channel activity at low InsP3 concentrations. Yet this eight-state model is unable to explain the relief of Ca-dependent inhibition of InsP3-gated channel activity at high InsP3 concentrations. We hypothesized that a low affinity InsP3 binding site may be involved, and provided evidence for its existence using ligand binding assays. To fit the data at high InsP3 concentrations, the eight-state model was therefore extended to include the 10 μM InsP3 binding site, yielding a 16-state model (Kaftan et al., 1997).
In an effort to both explain the steady state channel data and extract kinetic information on InsP3-gated Ca release, we used a novel approach that involves consideration of the channel as a unit. Previous models have focused on an individual InsP3 receptor, predicting various states of the monomer, and then calculating probabilities of each combination of states in a tetrameric complex. The latter approach was used when extending the previously reported eight-state model of the InsP3 receptor (De Young and Keizer, 1992) to 16 states (Kaftan et al., 1997), and we obtained reasonable fits of the channel data. A stochastic model has recently been proposed (Swillens et al., 1998), though it assumed only one InsP3 binding site per channel complex, which is likely an oversimplification. The present model provides a more realistic representation of the channel with four medium-affinity InsP3 binding sites per channel complex (Maeda et al., 1988; Supattapone et al., 1988; Chadwick et al., 1990), and yields superior fits of the data over a broad range of InsP3 and Ca concentrations compared with our previous 16-state model (Kaftan et al., 1997; see Fig. 8 A). Moreover, rate constants (rather than dissociation constants) and mean open times were incorporated into the current model, which facilitates kinetic analyses of channel activity. By focusing on the channel complex (rather than individual InsP3-receptor subunits), the number of possible states of the channel could be greatly reduced, thereby allowing for the kinetic simulations of channel activity.
The mathematical model in the present study requires just four Ca binding sites per tetrameric channel complex. This is consistent with our initial observation (Bezprozvanny et al., 1991) that in the presence of 2 μM InsP3 the bell-shaped Ca dependence of channel activity could be fit assuming that two molecules of Ca were needed to open the channel, whereas two molecules of Ca appeared to close the channel. A similar stoichiometry of four divalent cation sites per channel complex was obtained when Mn was substituted for Ca (Striggow and Ehrlich, 1996). Examination of Ca binding to the cloned/expressed receptor fragments raises the possibility of up to eight Ca binding sites per InsP3 receptor monomer (Mignery et al., 1992; Sienaert et al., 1996, 1997). Seven of these Ca binding sites appear to reside on the cytosolic region of the InsP3 receptor (Sienaert et al., 1997), though the Ca affinity of only one of these sites (K d 0.8 μM Ca, Hill coefficient 1.0) has been determined (Sienaert et al., 1996). The predicted K d for Ca binding in the present study (0.7 μM, Table I) is consistent with the latter report. It has been hypothesized, based on the cation selectivity of the stimulation and inhibition of InsP3-induced Ca release (Marshall and Taylor, 1994; Sienaert et al., 1996; Striggow and Ehrlich, 1996), that Ca binding to at least three distinct cytosolic sites regulates InsP3-gated channel activity (Sienaert et al., 1997). For simplicity of the mathematical model, it is assumed that there are four distinct Ca binding sites on the channel, with Ca binding to one site altering the Ca affinity of the other sites in the channel complex. Inclusion of multiple Ca binding sites per InsP3 receptor monomer in the model is possible, and would be expected to increase the freedom in the model and provide even better fits of the channel and binding data, but at the cost of a considerably larger matrix calculation. As the identities of regulatory Ca binding sites become available, the mathematical model will be refined to more accurately represent the molecular details of channel structure.
Although the proposed model provides an accurate simulation of steady state InsP3-gated channel activity and InsP3 binding data, it is important to ascertain the physiological relevance of an InsP3 binding site with a dissociation constant of ∼10 μM, particularly if the medium affinity InsP3 binding site has an affinity 30× lower (0.3 μM) at 22°C. It should be appreciated, however, that the medium affinity InsP3 binding site exhibited a strong temperature dependence (Q 10 = 2.3), so that at 37°C, the dissociation constant of the medium affinity InsP3 binding site is predicted to approach 1 μM. The temperature dependence of the low affinity InsP3 binding site was difficult to measure, but it appeared to be relatively temperature independent. There are reports of ligand binding sites with low (or reversed) temperature dependence, where binding affinity is mainly entropy driven; it is not possible to accurately predict a priori if a given binding site will have a high or low temperature dependence of ligand binding (Testa et al., 1987). The low level of specificity of the low affinity site for 1,4,5-InsP3 versus 1,3,4,5-InsP4 (Kaftan et al., 1997) is in part consistent with the apparent low temperature dependence of this site. Thus, the difference in dissociation constants between the medium and low affinity InsP3 binding sites may be as low as 10-fold at the physiological temperature of 37°C (i.e., 1 vs. 10 μM).
At first glance, dissociation constants of 1–10 μM seem to be unexpectedly high, although review of the literature indicates that at physiological temperatures, rather high InsP3 concentrations may be needed to release Ca (Putney, 1990). In the case of cerebellar Purkinje cells, flash photolysis studies indicated the need for at least 9 μM intracellular InsP3 to induce Ca release, with Ca release increasing progressively as InsP3 concentration was elevated up to 80 μM (Khodakhah and Ogden, 1995). Moreover, it has been reported that sustained elevation of intracellular Ca can be observed using high concentrations (100 μM) of either InsP3 or the poorly hydrolyzed InsP3 analogue InsPS3 (Wakui et al., 1989; Petersen et al., 1991). Furthermore, relatively high InsP3 concentrations have been noted in some cell types under basal (0.1–3 μM) and agonist-induced (1–20 μM) conditions (Putney, 1990). Thus, InsP3 dissociation constants of 1–10 μM at 37°C may be of physiological significance.
In summary, the present study provides a simple mathematical model of the cerebellar InsP3-gated channel, which provides an accurate simulation of InsP3-gated channel activity over a broad range of InsP3 and Ca concentrations. The model incorporates the well known “medium affinity” InsP3 binding site, and takes into account its temperature and Ca dependences. The model also includes a low affinity InsP3 binding site that exhibits little Ca or temperature dependence. Individual rate constants were incorporated into the model to allow kinetic simulations. It is expected that this novel model will provide a foundation for subsequent studies aimed at elucidating the molecular mechanisms underlying the complex behavior of the InsP3-gated channel.
Scheme II.

Acknowledgments
The authors thank William Dyckman for his assistance in obtaining canine cerebella and Dr. Leslie Loew for valuable comments on the kinetic model.
This work was supported by National Institutes of Health grants HL-33026 (J. Watras and B.E. Ehrlich), GM-51480 (B.E. Ehrlich), RR13186 (J. Watras, I.I. Moraru), and a grant from the University of Connecticut Health Center (J. Watras).
references
- Abdel-Latif A. Calcium-mobilizing receptors, polyphosphoinositides, and the generation of second messengers. Pharmacol Rev. 1986;38:227–272. [PubMed] [Google Scholar]
- Benevolensky D, Moraru I, Watras J. Micromolar calcium reduces the affinity of the inositol 1,4,5-trisphosphate receptor in smooth muscle. Biochem J. 1994;299:631–636. doi: 10.1042/bj2990631. [DOI] [PMC free article] [PubMed] [Google Scholar]
- Berridge MJ, Irvine RF. Inositol phosphates and cell signalling. Nature. 1989;341:197–205. doi: 10.1038/341197a0. [DOI] [PubMed] [Google Scholar]
- Bezprozvanny I. Theoretical analysis of calcium wave propagation based on inositol (1,4,5)-trisphosphate (InsP3) receptor functional properties. Cell Calc. 1994;16:151–166. doi: 10.1016/0143-4160(94)90019-1. [DOI] [PubMed] [Google Scholar]
- Bezprozvanny I, Watras J, Ehrlich BE. Bell-shaped calcium-response curves of Ins(1,4,5)P3- and calcium-gated channels from endoplasmic reticulum of cerebellum. Nature. 1991;351:751–754. doi: 10.1038/351751a0. [DOI] [PubMed] [Google Scholar]
- Bootman MD, Missiaen L, Parys JB, DeSmedt H, Casteels R. Control of inositol 1,4,5-trisphosphate-induced Ca2+ release by cytosolic Ca2+ . Biochem J. 1995;306:445–451. doi: 10.1042/bj3060445. [DOI] [PMC free article] [PubMed] [Google Scholar]
- Bradford MM. A rapid and sensitive method for the quantitation of microgram quantities of protein utilizing the principle of protein-dye binding. Anal Biochem. 1976;72:248–254. doi: 10.1016/0003-2697(76)90527-3. [DOI] [PubMed] [Google Scholar]
- Chadwick CC, Saito A, Fleischer S. Isolation and characterization of the inositol trisphosphate receptor from smooth muscle. Proc Natl Acad Sci USA. 1990;87:2132–2136. doi: 10.1073/pnas.87.6.2132. [DOI] [PMC free article] [PubMed] [Google Scholar]
- Clapham DE. Calcium signaling. Cell. 1995;80:259–268. doi: 10.1016/0092-8674(95)90408-5. [DOI] [PubMed] [Google Scholar]
- Colquhoun, D., and A.G. Hawkes. 1983. The principles of the stochastic interpretation of ion-channel mechanisms. In Single Channel Recording. Plenum Publishing Corp., New York. 135–176.
- De Young GW, Keizer J. A single-pool inositol 1,4,5-trisphosphate-receptor–based model for agonist-stimulated oscillations in Ca concentration. Proc Natl Acad Sci USA. 1992;89:9895–9899. doi: 10.1073/pnas.89.20.9895. [DOI] [PMC free article] [PubMed] [Google Scholar]
- Fabiato A. Computer programs for calculating total from specified free or free from specified total ionic concentrations in aqueous solutions containing multiple metals and ligands. Methods Enzymol. 1988;157:378–417. doi: 10.1016/0076-6879(88)57093-3. [DOI] [PubMed] [Google Scholar]
- Finch EA, Turner TJ, Goldin SM. Calcium as a coagonist of inositol 1,4,5-trisphosphate-induced calcium release. Science. 1991;252:443–446. doi: 10.1126/science.2017683. [DOI] [PubMed] [Google Scholar]
- Hannaert-Merah Z, Combettes L, Coquil J-F, Swillens S, Mauger J-P, Claret M, Champeil P. Characterization of the co-agonist effects of strontium and calcium on myo-inositol trisphosphate–dependent ion fluxes in cerebellar microsomes. Cell Calc. 1995;18:390–399. doi: 10.1016/0143-4160(95)90054-3. [DOI] [PubMed] [Google Scholar]
- Hille, B. 1992. Gating mechanisms. In Ionic Channels of Excitable Membranes. Sinauer Associates, Inc., Sunderland, MA. 472–504.
- Horn R. Estimating the number of channels in patch recordings. Biophys J. 1991;60:433–439. doi: 10.1016/S0006-3495(91)82069-0. [DOI] [PMC free article] [PubMed] [Google Scholar]
- Iino M. Biphasic Ca2+ dependence of inositol 1,4,5-trisphosphate-induced Ca release in smooth muscle cells of the guinea pig taenia . caeci J Gen Physiol. 1990;95:1103–1122. doi: 10.1085/jgp.95.6.1103. [DOI] [PMC free article] [PubMed] [Google Scholar]
- Joseph SK, Rice HL, Williamson JR. The effect of external calcium and pH on inositol trisphosphate–mediated calcium release from cerebellum microsomal fractions. Biochem J. 1989;258:261–265. doi: 10.1042/bj2580261. [DOI] [PMC free article] [PubMed] [Google Scholar]
- Kaftan EJ, Ehrlich BE, Watras J. Inositol 1,4,5-trisphosphate (InsP3) and calcium interact to increase the dynamic range of InsP3receptor-dependent calcium signaling. J Gen Physiol. 1997;110:529–538. doi: 10.1085/jgp.110.5.529. [DOI] [PMC free article] [PubMed] [Google Scholar]
- Khodakhah K, Ogden D. Fast activation and inactivation of inositol trisphosphate–evoked Ca2+release in rat cerebellar Purkinje neurones. J Physiol. 1995;487:343–358. doi: 10.1113/jphysiol.1995.sp020884. [DOI] [PMC free article] [PubMed] [Google Scholar]
- Maeda N, Niinobe M, Nakahira K, Mikoshiba K. Purification and characterization of P400 protein, a glycoprotein characteristic of Purkinje cell, from mouse cerebellum. J Neurochem. 1988;51:1724–1730. doi: 10.1111/j.1471-4159.1988.tb01151.x. [DOI] [PubMed] [Google Scholar]
- Marshall I, Taylor C. Two calcium binding sites mediate the interconversion of liver inositol 1,4,5-trisphosphate receptors between three conformations states. Biochem J. 1994;301:591–598. doi: 10.1042/bj3010591. [DOI] [PMC free article] [PubMed] [Google Scholar]
- Mignery GA, Johnston PA, Sudhof TC. Mechanism of Ca2+ inhibition of inositol 1,4,5-trisphosphate (InsP3) binding to the cerebellar InsP3 receptor. J Biol Chem. 1992;267:7450–7455. [PubMed] [Google Scholar]
- Payne R, Flores TM, Fein A. Feedback inhibition by calcium limits the release of calcium by inositol trisphosphate in Limulus ventral photoreceptors. Neuron. 1990;4:547–555. doi: 10.1016/0896-6273(90)90112-s. [DOI] [PubMed] [Google Scholar]
- Petersen CCH, Toescu EC, Potter BVL, Petersen OH. Inositol triphosphate produces different patterns of cytoplasmic Ca2+spiking depending on its concentration. FEBS Lett. 1991;293:179–182. doi: 10.1016/0014-5793(91)81181-7. [DOI] [PubMed] [Google Scholar]
- Putney J. The integration of receptor-regulated intracellular calcium release and calcium entry across the plasma membrane. Curr Top Cell Regul. 1990;31:111–127. doi: 10.1016/b978-0-12-152831-7.50004-4. [DOI] [PubMed] [Google Scholar]
- Sienaert I, De Smedt H, Parys JB, Missiaen L, Vanlingen S, Sipma H, Casteels R. Characterization of a cytosolic and a luminal Ca2+binding site in the type I inositol 1,4,5-trisphosphate receptor. J Biol Chem. 1996;271:27005–27012. doi: 10.1074/jbc.271.43.27005. [DOI] [PubMed] [Google Scholar]
- Sienaert I, Missiaen L, De Smedt H, Parys JB, Sipma H, Casteels R. Molecular and functional evidence for multiple Ca2+-binding domains in the type 1 inositol 1,4,5-trisphosphate receptor. J Biol Chem. 1997;272:25899–25906. doi: 10.1074/jbc.272.41.25899. [DOI] [PubMed] [Google Scholar]
- Striggow F, Ehrlich BE. The inositol 1,4,5-trisphosphate receptor of cerebellum. Mn2+ permeability and regulation by cytosolic Mn2+ . J Gen Physiol. 1996;108:115–124. doi: 10.1085/jgp.108.2.115. [DOI] [PMC free article] [PubMed] [Google Scholar]
- Sudhof TC, Newton CL, Archer BT, III, Ushkaryov YA, Mignery GA. Structure of a novel InsP3receptor. EMBO (Eur Mol Biol Organ) J. 1991;10:3199–3206. doi: 10.1002/j.1460-2075.1991.tb04882.x. [DOI] [PMC free article] [PubMed] [Google Scholar]
- Supattapone S, Worley PF, Baraban JM, Snyder SH. Solubilization, purification, and characterization of an inositol trisphosphate receptor. J Biol Chem. 1988;263:1530–1534. [PubMed] [Google Scholar]
- Swillens S, Champeil P, Combettes L, Dupont G. Stochastic simulation of a single inositol 1,4,5-trisphosphate-sensitive Ca2+ channel reveals repetitive openings during ‘blip-like' Ca2+transients. Cell Calc. 1998;23:291–302. doi: 10.1016/s0143-4160(98)90025-2. [DOI] [PubMed] [Google Scholar]
- Tang Y, Stephenson JL, Othmer HG. Simplification and analysis of models of calcium dynamics based on IP3-sensitive calcium channel kinetics. Biophys J. 1996;70:246–263. doi: 10.1016/S0006-3495(96)79567-X. [DOI] [PMC free article] [PubMed] [Google Scholar]
- Testa, B., P. Jenner, G.J. Kilpatrick, N. el Tayar, H. Van de Waterbeemd, and C.D. Marsden. 1987. Do thermodynamic studies provide information on both the binding to and the activation of dopaminergic and other receptors? Biochem. Pharmacol. 36:4041– 4046. [DOI] [PubMed]
- Wakui M, Potter BVL, Petersen OH. Pulsatile intracellular calcium release does not depend on fluctuations in inositol trisphosphate concentration. Nature. 1989;339:317–320. doi: 10.1038/339317a0. [DOI] [PubMed] [Google Scholar]
- Watras J, Bezprozvanny I, Ehrlich BE. Inositol 1,4,5-trisphosphate-gated channels in cerebellum—presence of multiple conductance states. J Neurosci. 1991;11:3239–3245. doi: 10.1523/JNEUROSCI.11-10-03239.1991. [DOI] [PMC free article] [PubMed] [Google Scholar]
- Watras J, Moraru I, Costa DJ, Kindman LA. Two inositol 1,4,5-trisphosphate binding sites in rat basophilic leukemia cells: relationship between receptor occupancy and calcium release. Biochemistry. 1994;33:14359–14367. doi: 10.1021/bi00251a050. [DOI] [PubMed] [Google Scholar]
- Wojcikiewicz RJ. Type I, II, and III inositol 1,4,5-trisphosphate receptors are unequally susceptible to down-regulation and are expressed in markedly different proportions in different cell types. J Biol Chem. 1995;270:11678–11683. doi: 10.1074/jbc.270.19.11678. [DOI] [PubMed] [Google Scholar]
- Worley PF, Baraban JM, Supattapone S, Wilson VS, Snyder SH. Characterization of inositol trisphosphate receptor binding in brain. Regulation by pH and calcium. J Biol Chem. 1987;262:12132–12136. [PubMed] [Google Scholar]