

Abstract
To explain cotransport function, the “alternating access” model requires that conformational changes of the empty transporter allow substrates to bind alternatively on opposite membrane sides. To test this principle for the GAT1 (GABA:Na+:Cl−) cotransporter, we have analyzed how its charge-moving partial reactions depend on substrates on both membrane sides in giant Xenopus oocyte membrane patches. (a) “Slow” charge movements, which require extracellular Na+ and probably reflect occlusion of Na+ by GAT1, were defined in three ways with similar results: by application of the high-affinity GAT1 blocker (NO-711), by application of a high concentration (120 mM) of cytoplasmic Cl−, and by removal of extracellular Na+ via pipette perfusion. (b) Three results indicate that cytoplasmic Cl− and extracellular Na+ bind to the transporter in a mutually exclusive fashion: first, cytoplasmic Cl− (5–140 mM) shifts the voltage dependence of the slow charge movement to more negative potentials, specifically by slowing its “forward” rate (i.e., extracellular Na+ occlusion); second, rapid application of cytoplasmic Cl− induces an outward current transient that requires extracellular Na+, consistent with extracellular Na+ being forced out of its binding site; third, fast charge-moving reactions, which can be monitored as a capacitance, are “immobilized” both by cytoplasmic Cl− binding and by extracellular Na+ occlusion (i.e., by the slow charge movement). (c) In the absence of extracellular Na+, three fast (submillisecond) charge movements have been identified, but no slow components. The addition of cytoplasmic Cl− suppresses two components (τ < 1 ms and 13 μs) and enables a faster component (τ < 1 μs). (d) We failed to identify charge movements of fully loaded GAT1 transporters (i.e., with all substrates on both sides). (e) Under zero-trans conditions, inward (forward) GAT1 current shows pronounced pre–steady state transients, while outward (reverse) GAT1 current does not. (f) Turnover rates for reverse GAT1 transport (33°C), calculated from the ratio of steady state current magnitude to total charge movement magnitude, can exceed 60 s−1 at positive potentials.
Keywords: charge movement, neurotransmitter transporter, NO-711, transport kinetics, voltage dependence
introduction
If the transport of one neutral γ-aminobutyric acid (GABA)1 molecule by the GAT1 transporter is coupled to the cotransport of two Na+ ions and one Cl− ion (Radian and Kanner 1983; Keynan and Kanner 1988; Kavanaugh et al. 1992), then one net positive charge must be moved in the direction of GABA in each transport cycle. In fact, a single partial reaction of the GAT1 transporter has been identified that would account for the expected movement of charge (Mager et al. 1993, Mager et al. 1996). This reaction occurs in the absence of GABA, it is slow (τ > 10 ms), and it is closely related to the binding and/or occlusion of extracellular Na+ (Mager et al. 1993). We will refer to this reaction as “Q slow.” Charge movements similar to Q slow occur in Na+–glucose cotransporters, but reactions that rearrange empty binding sites are thought to also generate large charge movements in those transporters (Parent et al. 1992; Chen et al. 1996). For GAT1, we have identified charge-moving reactions in the absence of substrates that are >1,000-fold faster than Q slow, but ∼10-fold smaller in magnitude (Lu et al. 1995). We will refer to these reactions, which were identified by capacitance measurements, as “Q fast.” This article presents further kinetic and mechanistic studies of the GAT1 charge-moving reactions, as well as experimentation to define the kinetics of voltage-independent transport reactions in GAT1. These studies form the major experimental basis for a refined alternating access model of GAT1 function (Hilgemann and Lu 1999).
materials and methods
The experimental methods and solutions used in this study were essentially the same as described in the previous article (Lu and Hilgemann 1999). Charge movements were measured as described previously (Hilgemann 1994). For all giant patch experiments, GAT1 expression levels in the oocytes were estimated by checking the magnitude of outward transport current activated by 20 mM cytoplasmic GABA in the presence of 120 mM cytoplasmic NaCl and the absence of extracellular GABA.
results
Definition of Qslow in Giant Oocyte Membrane Patches
Our first goal was to identify Q slow in giant excised oocyte patches and compare its operation to results of others using intact oocytes (Mager et al. 1993, Mager et al. 1996). For brevity, we describe this work without figures. First, we defined Q slow using the GAT1 inhibitor, SKF-89976A, applied from the extracellular side via pipette perfusion; current (or charge) records with inhibitor were subtracted from records without inhibitor. Second, we determined that very similar charge movements could be defined by subtracting current records in the absence of extracellular Na+ (with substitution by N-methylglucamine) from records in the presence of extracellular Na+. This confirmed that Q slow is probably associated with extracellular Na+ binding. Third, we determined that the GAT1 inhibitor, NO-711, in contrast to SKF-89976A, could be used from the cytoplasmic side to define Q slow, thereby eliminating the need to routinely perfuse pipettes. Fourth, we tested whether NO-711 might block additional slow charge movements taking place in the absence of extracellular Na+. We examined a voltage range from +200 to −200 mV, and all Na+-independent charge movements that we identified were >10× faster than Q slow.
High Cytoplasmic Cl− Appears to Block Qslow
Inward GAT1 current and a fast GAT1 charge movement are suppressed by cytoplasmic Cl− (Lu et al. 1995; Lu and Hilgemann 1999), and, as described here, high cytoplasmic Cl− concentrations also suppress Q slow. Fig. 1 compares charge movements that are defined by the inhibitor, NO-711, with charge movements defined by cytoplasmic Cl− in the same patch. To directly visualize whether charge movements are reversible, and thereby whether any “leak currents” are blocked or induced by these interventions, we recorded charge movement per se, instead of membrane current, from the integrating patch clamp amplifier. The protocol employed was a series of 60-ms voltage pulses from a holding potential of −40 mV to potentials between −160 and +120 mV. The pipette contained 40 mM extracellular NaCl. Charge records in Fig. 1 A were obtained by subtracting signals in the presence of 0.13 mM cytoplasmic NO-711 from signals obtained in the absence of the inhibitor. Fig. 1 B shows the charge records defined by subtracting signals with 120 mM cytoplasmic Cl− from signals without Cl−, using methanesulfonate (MES−) as substitute anion. The Cl− i-defined charge records (Fig. 1 B) were obtained before the NO-711i–defined ones (Fig. 1 A) because effects of NO-711 reverse only slowly after its wash-out from the cytoplasmic side.
Figure 1.

Slow GAT1 charge movements, Q slow, in an excised oocyte patch. (A and B) Charge transfer, the time integral of membrane current, was recorded directly from an integrating patch-clamp amplifier. The signals presented are records with no cytoplasmic substrates, from which records with 0.13 mM cytoplasmic NO-711 (A) or with 120 mM cytoplasmic Cl− (B) were subtracted. Extracellular [Na+] and [Cl−] were both 40 mM. Holding potential was −40 mV; 60-ms voltage pulses to voltages between −160 and +120 mV were applied in 40-mV steps. The record at the holding potential was fitted by a straight line, representing a background current of ∼1 pA, and this baseline was subtracted from all records in the same pulse series. Dotted lines, barely visible outside of signal noise, plot the best fit of each record by a single exponential function during pulse to various potentials (Q on) and 0.6 ms after returning to −40 mV (Q off). (C and D) The charge magnitudes (Q on and Q off) and rate constants (k slow) from the exponential fits are plotted against membrane potential: ▪, Q on; □, Q off; •, k slow. The Q–V and k slow–V relations in C correspond to the inhibitor-defined charge movements (A), and those in D correspond to the Cl− i-defined records (B). Values at −40 mV are the mean for all the relaxation curves; standard error was within the symbol size. The voltage dependencies of Q on and Q off were fitted by the Boltzmann relation, ΔQV=ΔQ max1+e V12−V·q·FR·T,where ΔQ max = Q max − Q min, V1/2 is the potential where ΔQ(V) = ΔQ max/2, q is the equivalent charge moved; F, R, and T have their usual meanings. At 33°C, the fitted parameters are (C) V1/2 = −45 mV, q = 0.94, Q min = −2.47, Q max = 1.89; and (D) V1/2 = −35 mV, q = 0.76, Q min = −1.41, Q max = 1.52. The k slow–V relations were fitted by the sum of two single exponentials kslowV=A1·exp−V·q1·FR·T+A2·expV·q2·FR·T: (C) q 1 = 0.49 and q 2 = 0.30, and (D) q 1 = 0.39 and q 2 = 0.36.
The two sets of charge signals are similar, and they return nearly to initial values at the end of the observation period. However, the magnitudes of charge movements defined by inhibitor are larger, suggesting that Cl− i did not fully inhibit the underlying reactions. Note the small fast charge components, which appear as quasi-instantaneous charge jumps on return to −40 mV from 120 mV. These components might arise from electrogenic Na+ binding, similar to signals described for the Na+, K+ pump (Hilgemann 1994). However, from our results in the absence of extracellular Na+, to be described below, it is much more likely that these signals arise from empty GAT1 binding sites, rather than substrate-transporter interactions.
Single exponential functions were fitted to the signals during the voltage pulse (“on” charge) and after returning potential to −40 mV (“off” charge). They are included as dotted lines that are mostly covered by the charge records. The magnitudes and rates of charge movements are plotted against pulse potential in Fig. 1C and Fig. D, respectively, for NO-711i– and Cl− i-defined signals. Both charge–voltage (Q–V) relations are well described by a Boltzmann equation (see Fig. 1, legend). The Q–V relation for the inhibitor-defined charge has a slope of 0.94 and projects to 4.36 pC for the total charge moved. The Q–V relation for the Cl− i-defined charge has a shallower slope (0.74) and projects to a total charge of 2.93 pC. The inhibitor-defined Q–V (V1/2 = −45 mV) is left-shifted from the Cl− i-defined one (V1/2 = −35 mV). The rate–voltage (k slow–V) relations are U shaped, and the minimum rates occur at approximately the midpoint of the corresponding Q–V relations. The solid lines represent a fit of the k slow–V relations by the sum of two exponential functions with opposite voltage dependence. The slope coefficients of these functions revealed an almost equal voltage dependence of the “forward” and “backward” reactions of the charge movement (see Fig. 1, legend). We point out that we have observed clear variability of the midpoint of Q–V relations obtained from different batches of oocytes. Since excised patches tend to be unstable in the presence of high [Na+]o and large negative potentials, our success rates were greater with patches in which the midpoint of Q slow occurred at less negative potentials.
Cytoplasmic Cl− Acts by Retarding the Occlusion of Extracellular Na+
We considered three general mechanisms by which cytoplasmic Cl− may block Q slow. First, cytoplasmic Cl− might act through an inhibitory regulatory binding site (i.e., separate from transport binding sites). In this case, we would expect a biphasic (or complex) dependence of outward GAT1 current on cytoplasmic Cl−, and this was not the case (Lu and Hilgemann 1999). Second, GAT1 might be modulated by a slow autoinhibitory reaction that depends on Cl− i binding to transport sites, similar to the Na+ i-dependent inactivation in the cardiac Na+/Ca2+ exchanger (Hilgemann 1990). To test this, we performed rapid solution switches (Lu and Hilgemann 1999) to examine the time courses with which inward and outward GAT1 currents change upon application and removal of cytoplasmic Cl−. All records revealed monotonic increases or decreases of current with time courses expected for ion diffusion up to and away from the membrane patch (30–400 ms). The third possibility, then, was that the effects of Cl− i are a direct consequence of its binding to transport sites. In an alternating access model, extracellular Na+ and cytoplasmic Cl− binding could be linked by the conformational changes of the empty transporter that open binding sites alternatively to the extracellular or cytoplasmic sides. The minimum reactions involved are illustrated in a Reaction Scheme (Fig. 1).
Scheme S1.

Charge movement (★) occurs when a Na+ is occluded into the transporter from the extracellular side (1). When the binding site is open, Na+ o can dissociate (2), and the empty binding site can open alternatively to the extracellular or the cytoplasmic side (3). When the binding site is open to the cytoplasmic side, Cl− i can bind and dissociate (4). A saturating cytoplasmic Cl− concentration will disable the charge-moving reaction because transporters will all accumulate in the Cl− i-bound state. The actual effect of cytoplasmic Cl−, however, is to shift the Q slow–V relation to more negative potentials by decreasing the probability that Na+ o can bind and be occluded. If the electrogenic reaction is slower than the other reactions, cytoplasmic Cl− will specifically decrease the rate of the forward charge movement (i.e., Na+ occlusion). Based on model calculations, a 6–10-fold retardation would account for our ability to define charge movements by application and removal of cytoplasmic Cl−.
As shown in Fig. 2, our experimental results conform closely to these predictions. Current, rather than charge, was recorded to avoid signal drift during the long voltage pulses used in these protocols. As indicated in the lower part of Fig. 2 A, patches were held at 0 mV, and the on charge movement was recorded by applying 360-ms voltage pulses to potentials between +40 and −160 mV. Then the off charge movement was recorded by applying 80-ms test pulses to +80 mV, a potential positive enough so that all detectable charge moves in the backward direction. The charge movements in the absence (Fig. 2 A, top) and presence (bottom) of 120 mM cytoplasmic Cl− were defined by subtracting records taken before and after application of NO-711i (0.13 mM). The on charge movements appear to be suppressed by Cl− i, as expected from Fig. 1, while in fact they are taking place very slowly, such that the current is of small magnitude. The largest off current transients, recorded at +80 mV after voltage pulses to −160 mV, are nearly identical in magnitude and rate in the absence and presence of Cl−. Thus, the total charge that can move is unaffected by Cl−.
Figure 2.

Negative shift and slowing of Q slow by cytoplasmic Cl−. (A) GAT1 current transients elicited by an 80-ms test pulse to +80 mV after 360-ms prepulses applied in 40-mV increments from −160 to +40 mV (no cytoplasmic GABA or Na+; 100 mM extracellular NaCl). The top traces are without and the bottom traces are with 120 mM cytoplasmic Cl−. (B) Charge movement magnitudes, determined from the current traces at +80 mV, are plotted in the absence (▪) and presence (□) of 120 mM cytoplasmic Cl− (100 mM extracellular NaCl). The solid curves are fits of Boltzmann functions to the data (see Fig. 1, legend), whereby the midpoints are −36 and −96 mV in the absence and presence of 120 mM cytoplasmic Cl−, respectively. See text for details. (C) GAT1 current transients in 0, 15, and 30 mM cytoplasmic Cl− were elicited by a 180-ms pulse to −150 mV from the holding potential of 0 mV, followed by a 60-ms pulse to +50 mV (no cytoplasmic Na+ or GABA; 120 mM extracellular NaCl). The current transients at −150 mV were fitted by single exponentials (dashed lines and inset). The time constants are 12.1, 18.9, and 36.6 ms with 0, 15, and 30 mM cytoplasmic Cl−, respectively.
The steady state voltage dependence of Q slow, shown in Fig. 2 B, was determined by integrating the current transients at +80 mV. The amount of charge moved is plotted against the “pretest” potential, and the Q–V relations with (□) and without (▪) 120 mM cytoplasmic Cl− are fitted by Boltzmann equations (smooth lines). In this case, we forced the charge magnitudes (−3.4 pC) and the slope coefficient (1.3) to be equal. The midpoint of the Q–V relation is −36 mV in the absence of cytoplasmic Cl−; it is shifted to −96 mV in the presence of 120 mM cytoplasmic Cl−. This 60-mV shift corresponds to a 10-fold retardation of the forward charge movement, which indicates that ∼90% of binding sites are occupied by Cl− i at 120 mM. The Cl− i dissociation constant must therefore be ∼12 mM, and this is in good agreement with half-maximal Cl− i concentrations for activation of outward current and inhibition of inward current (Lu and Hilgemann 1999).
Fig. 2 C shows the effects of lower concentrations of cytoplasmic Cl− on current transients at negative potentials. Charge movements were elicited by a 180-ms pulse from 0 to −150 mV with 0, 15, and 30 mM cytoplasmic Cl−. Then NO-711i was applied, the protocols were repeated, and the corresponding current records with NO-711i were subtracted from those without. The current transients are shown together with single exponential fits in Fig. 2 C. As predicted for a decrease of charge movement rate without a change of charge magnitude at −150 mV, the records obtained with different Cl− i concentrations “cross” each other. For clarity, we show the “crossover” of the corresponding exponential functions above the current records. The time constants are 12.1 ms in 0 Cl− i, 18.9 ms in 15 mM Cl− i, and 36.6 ms in 30 mM Cl− i.
Cytoplasmic Cl− Releases Occluded Na+ to the Extracellular Side
Another major prediction from Fig. 1, described in Fig. 3, is that rapid application of cytoplasmic Cl− should be able to release occluded Na+ o from GAT1 and thereby generate an outward current transient. We first verified in control experiments that fast cytoplasmic Cl− switches, as described previously (Lu and Hilgemann 1999), could be carried out without generating significant current artifacts in patches from uninjected oocytes. To achieve this, the tips of the recording pipettes were thickly coated with Parafilm/mineral oil mix to reduce capacitance (not shown). When experiments were performed in GAT1-expressing patches, outward current transients were indeed obtained in the presence, but not the absence, of extracellular Na+. We mention that the presence of Cl− o in the pipette was also required to obtain signals at 0 mV. This is expected because extracellular Cl− shifts the Q slow–V relation to more positive potentials, presumably by facilitating occlusion of extracellular Na+.
Figure 3.

Linkage of cytoplasmic Cl− binding to slow GAT1 charge movements. In the presence of 40 mM extracellular Na+, current transients are elicited by stepping [Cl−]i from 0 to 120 mM and back to 0 mM. (A, top) Current traces before (a) and after (b) adding 0.13 mM cytoplasmic NO-711 (no cytoplasmic GABA or Na+). (Bottom) The inhibitor-defined current transient (a–b). (B) Current transients, as in A, were monitored at various membrane potentials. The magnitude of Cl− i-linked charge movement was calculated as the area bounded by the zero-current line and the outward-current transient. Note that charge movement is absent at the extreme potentials. (C, top) NO-711i-defined membrane current in response to combined Cl− i concentration jumps and voltage jumps (no cytoplasmic GABA or Na+). (Bottom) In the same patch, GAT1 transport current was turned on and off by applying and removing 120 mM cytoplasmic Cl− in the presence of 20 mM cytoplasmic GABA and 120 mM cytoplasmic Na+. Dashed lines in A and C represent zero current.
Fig. 3 presents typical results with 120 mM extracellular NaCl, whereby 120 mM cytoplasmic Cl− was rapidly applied and removed using MES− as the Cl− substitute. Fig. 3 A shows that, in the absence of NO-711i (a), a 2-pA outward current develops within 40 ms upon application of 120 mM Cl− i, and the current decays over the next 150 ms. On removal of Cl− i, a smaller inward current develops over 100 ms, and it decays over 350 ms. The current transients are largely blocked in the presence of 0.13 mM NO-711i (b). The subtraction record (a–b), presented below the concentration bar, shows that the magnitudes of on and off charge, defined by the areas under the current transients, are in good agreement.
Fig. 3 B shows the voltage dependence of the Cl− i-induced charge movement from another experiment. The total charge moved (Q) was calculated as the area bound by the on current trace and the baseline current in the presence of Cl− i. GAT1 expression was only moderate in this patch, but the charge magnitude clearly diminishes at both positive and negative potentials (+70 and −80 mV). This is expected because at positive potentials there will be no occluded Na+ to be released; at very negative potentials, the Na+-occluded state will be stabilized to such an extent that Na+ cannot be released by 120 mM cytoplasmic Cl−. Thus, the results in Fig. 3 B reflect a simple shift of the charge–voltage relations by Cl− i, as already described in Fig. 2.
Fig. 3 C shows the use of voltage jumps combined with concentration jumps to analyze the relationships between Cl− i- and voltage-induced charge movements. The slow charge movements elicited by a voltage pulse (0 → +100 → −100 → 0 mV) before (a), during (b), and after (c) a cytoplasmic Cl− jump are shown in Fig. 3 C. After the slow, small (∼2 pA) outward current elicited by Cl− i has decayed (∼200 ms in this patch), the voltage-induced charge movement is suppressed. In this experiment, the charge movement remained suppressed 300 ms after Cl− i removal. This slow reversal is due to the fact that, to obtain large signals, patches employed were large and rose up substantially in the pipette tip. As shown in Fig. 3 C, d, from the same patch, the time courses of outward GAT1 current activation and deactivation were similarly asymmetrical. Activation of the current occurs within 20 ms, but deactivation is only partial even after 500 ms.
Immobilization of Qfast by Extracellular Na+ Occlusion
As mentioned in the introduction, we have previously isolated fast charge-moving reactions that appear to occur in empty transporters. If binding of extracellular Na+ and cytoplasmic Cl− are mutually exclusive, then Na+ o occlusion should suppress or “immobilize” the fast charge movements. As described in Fig. 4, we have tested this possibility by monitoring changes of the availability of fast charge moving reactions as capacitance changes. The results shown are with 120 mM extracellular NaCl, and changes of membrane capacitance were monitored via a 20-kHz sinusoidal perturbation of 1-mV amplitude. Membrane potential was held for 1 s at −150 mV, and then pulsed to 0 mV for 1 s, back to −150 mV for 600 ms, and finally returned to 0 mV. These protocols yielded essentially flat records in patches from uninjected oocytes (not shown).
Figure 4.

Linkage of slow and fast charge movements revealed by capacitance measurements. (A) GAT1 capacitance was measured with 0, 60, and 120 mM cytoplasmic Cl− and 100 mM extracellular NaCl (no cytoplasmic Na+ or GABA). The patch was prepulsed from the holding potential of 0 to −150 mV for 1 s (not shown) before applying the voltage pulse shown at bottom. The capacitance records at −150 mV were fitted by single exponentials (dotted lines), and the time constant at each Cl− i concentration is given to the right of each trace. (B) Superimposed GAT1 capacitance records with 120 mM cytoplasmic Cl− and 100 mM extracellular NaCl. Same prepulse and holding potential as in A. In both A and B, the capacitance was measured with a 1-mV, 20-kHz sinusoidal perturbation.
As shown in Fig. 4 A, membrane capacitance increases in patches with high GAT1 expression (∼200 fF) when membrane potential is depolarized from −150 to 0 mV. These slow capacitance changes require the presence of Na+ o (not shown), their time courses are very similar to those of Q slow, and they are well described by single exponential functions. The time constant for the pulse from 0 to −150 mV increases from 52 ms in the absence of Cl− i, to 140 ms with 60 mM Cl− i, and to 203 ms with 120 mM Cl− i. The exponential functions are included as dotted lines. Fig. 4 B shows three superimposed capacitance traces for a voltage protocol in which the pulse duration at −150 mV was varied. These were recorded in the presence of 120 mM cytoplasmic Cl−. The “capacitance recovery” upon pulsing from −150 to 0 mV takes place somewhat more slowly after short pulses to −150 mV (Fig. 4 B, 1) than longer pulses (2 and 3). However, in all three traces, the time constants for pulses from 0 to −150 mV remain >200 ms. From these results, it seems certain that our previous description of voltage-dependent capacitance changes for GAT1 did not reflect a steady state in the presence of 120 mM cytoplasmic Cl− (Lu et al. 1995).
We stress at this point that the fast charge movements underlying the capacitance signals in Fig. 4 cannot arise solely from conformational changes of the empty transporter. The magnitude of the capacitance change induced by the voltage step is decreased only 20% by the presence of 120 mM Cl− i. From further work, illustrated in Fig. 5 and Fig. 6, we will conclude that, in fact, fast charge moving reactions also occur in the GAT1 states with Cl− bound on the cytoplasmic side. Consistent with the observation in Fig. 4, the magnitudes of those charge movements are only 20% smaller than the charge movements that occur in the empty transporter.
Figure 5.

Identification of multiple fast GAT1 charge movement components with NO-711i. GAT1 capacitance (A) and charge movements (B) were measured simultaneously. After a 100-ms prepulse to +120 mV from 0 mV, 60-ms pulses to voltages between −160 and +120 mV were applied in 40-mV decrements. The extracellular solution contained 40 mM Na+ and 120 mM Cl−, cytoplasmic Na+ and GABA were absent. (A) Capacitance signals are shown for four different cytoplasmic solutions: (a) with 0 Cl− i and 0 NO-711i, (b) 120 mM Cl− i and 0 NO-711i, (c) 0 Cl− i and 0.13 mM NO-711i, and (d) 120 mM Cl− i and 0.13 mM NO-711i. (B) Cl− i- (left) and NO-711i–defined (right) slow charge movements. Charge records accompanying the capacitance signals in A were subtracted as indicated.
Figure 6.

Multiple components of fast Cl− i-dependent GAT1 charge movements (no cytoplasmic Na+ or GABA). (A) Superimposed records of GAT1 charge movements elicited by a series of 2.7-ms pulses in 40-mV increments. The holding potential was −40 mV. Records in the presence of 120 mM cytoplasmic Cl− are subtracted from those in the absence (left) and presence (right) of 12 mM cytoplasmic Cl−. The extracellular solution contained 20 mM Cl− and no Na+. (B) The charge magnitude at the end of each voltage pulse in A is plotted against membrane voltage. (C, top) Fast Cl− i-defined charge movements resolved during 0.27-ms voltage pulses. Records shown are subtractions of records with and without 120 mM cytoplasmic Cl−. (Bottom) Traces from the top panel to +160 mV (solid line) and −200 mV (dotted line).
Suppression of GAT1 Capacitance by NO-711
That cytoplasmic Cl− does not suppress all fast charge-moving reactions in GAT1 was also apparent in capacitance responses to Cl− i (Lu and Hilgemann 1999): in the presence of 120 mM cytoplasmic Cl−, application of Na+ and GABA to the cytoplasmic side induces a further decrease of capacitance when transport current is activated. Our working hypothesis, then, is that multiple charged groups of the transporter, located within the membrane field, can flex somewhat in response to changes of membrane potential. In some transporter configurations, especially the Na+-occluded state, fast charge-moving reactions may be hindered. However, it seems unlikely that a genuine “null state” for the fast charge movements exists. As described in Fig. 5, the inhibitor, NO-711, decreases GAT1 capacitance, but does not abolish capacitance changes with changes of cytoplasmic [Cl−].
Fig. 5 shows an example of simultaneous recording of membrane capacitance and charge. The pipette contains 40 mM Na+. The capacitance responses to 60-ms voltage pulses from +120 mV to more negative potentials in 40-mV steps are shown in Fig. 5 A. Upon hyperpolarizing, membrane capacitance declines in a biphasic fashion after artifactual “spikes.” The fast decline presumably reflects saturation of the underlying fast charge-moving reactions in either the on or off state at extremes of potential. The slow phase occurs with the time course of the slow charge movements, which are shown in Fig. 5 B as the subtracted charge records defined by Cl− i (left) and NO-711i (right).
With application of 120 mM cytoplasmic Cl−, capacitance declines at 0 mV by ∼100 pF. The capacitance responses to voltage steps are largely suppressed, as expected from previous results (e.g., Fig. 1) for relatively short (60 ms) voltage pulses. Application of NO-711i in the absence of Cl− i causes capacitance to decrease by 415 pF, approximately four times larger than the decrease induced by 120 mM Cl− i. Then, in the presence of NO-711i, application and removal of 120 mM cytoplasmic Cl− still induces capacitance changes that are about one-half as large as those without the inhibitor. From such results, it is evident that NO-711i effectively silences some fast charge-moving reactions. However, even in the presence of NO-711i Cl− can still bind and dissociate from the cytoplasmic side and can still suppress a fast charge-moving reaction.
Resolution of Reactions Underlying Qfast
As just described, Cl− i can still suppress fast charge movements in the presence of NO-711. In addition to this complexity, we identified fast charge movements with altered kinetics in the presence of inhibitor (not shown). Thus, we attempted to study Q fast without inhibitors, and the most important result is shown in Fig. 6. Q fast is defined in Fig. 6 A by treating signals in the presence of 120 mM Cl− i as pseudo “null signals,” which were subtracted from signals with 0 or 12 mM Cl− i. Fig. 6 A shows the typical charge signals obtained by 3-ms voltage pulses from 0 mV to voltages between +160 and −200 mV in 40-mV steps. The pipette solution contained 20 mM Cl−; both the pipette and the bath solution were Na+ free. The same protocols resulted in virtually blank records when they were carried out in patches from uninjected oocytes (not shown).
Clearly, the Q fast signals resolved in this fashion are complex: the records from the 0 Cl− i subtraction (left) show a slow component in the positive potential range (time constant <1 ms). The 12 mM Cl− i subtraction records (right) reveal components whose time course is not well defined in the 3-ms pulse duration. The charge magnitude at the end of each voltage pulse in Fig. 6 A is plotted against pulse potential and fitted by a Boltzmann function in Fig. 6 B. The slope coefficients of the Boltzmann functions are 0.26 and 0.22 in the absence of Cl− i and with 12 mM Cl− i, respectively, the projected charge magnitudes are 81 and 43 fC, respectively, and the half-saturation points are 114 and 42 mV, respectively.
The major complication in the signals presented in Fig. 6 A is that large “charge transients” occur upon changing voltage. These components cannot be artifacts because they were not found in patches from control oocytes (not shown). To better resolve the initial components, shorter voltage pulses (0.25 ms) were employed with 1 MHz voltage clamp resolution (i.e., using highly polished pipette tips; <20 kohm). Results shown in Fig. 6 C are the subtractions of records with 120 mM Cl− i from records without Cl− i, as in Fig. 6 A (left). To illustrate the time courses more clearly, two of the records (−40 → +160 mV and −40 → −200 mV) are shown alone in Fig. 6 C (bottom). Why does the subtraction give rise to transient charge signals (i.e., two charge components of opposite sign)? Based on previous results with capacitance measurements, our interpretation is that one fast charge-moving reaction is inhibited by Cl− i. It has a time constant of ∼13 μs at all potentials (i.e., a rate constant of ∼77,000 s−1). A still faster charge component, not resolved in time, is, however, activated by Cl− i. This reaction could reflect a flexing of charged binding sites, or of Cl− i within its binding sites, in the membrane field. In good agreement with the results of Fig. 4 and Fig. 5, the slow component, which is inhibited by Cl− i, is ∼20% larger than the component activated by Cl− i.
Failure to Resolve Charge Movements of the Fully Loaded Transporter
At this point, our kinetic analysis of GAT1 is limited to the slow binding/occlusion of extracellular Na+ and to the Q fast reactions just described. No kinetic information is available about the actual substrate translocation reactions that must occur to allow coupled transport in an alternating access model. Accordingly, we tried extensively to isolate charge-moving reactions in the “fully loaded” transporter, via both voltage and concentration jumps. For example, we compared charge records in the presence of all substrates, at high concentrations, on both membrane sides, with records in which GAT1 inhibitors had been applied. To enhance the blocking action of inhibitors, we often removed GABA from the membrane side to which the inhibitor was applied. Nevertheless, no clear signal was identified (results not shown). We therefore conclude that substrate translocation reactions involving fully loaded transporters must take place in a nearly electroneutral fashion.
Relationships of Current Transients and Steady State GAT1 Current
Even though charge movements of the fully loaded transporter cannot be resolved, kinetic information about the substrate translocation reactions can be gained by indirect means. At large negative potentials, voltage-independent step(s) in the cycle become rate limiting in the forward transport mode (Lu and Hilgemann 1999). This coupling of voltage-dependent and –independent steps may be expected to give rise to pre–steady state current transients during voltage steps, and the magnitudes of transient versus steady state components can give accurate information about the rates of the voltage-independent steps.
Fig. 7 presents current transients related to both forward and reverse GAT1 transport. Results for the outward GAT1 current (A), obtained in the absence extracellular Na+, were defined both as GABAi-induced current (solid lines) and as NO-711i-inhibited current (dotted lines). For both subtraction procedures, transient current components in the outward current mode are fast and small in relation to the steady state current. The results are consistent with the outward current being rate limited by a single slow step with weak voltage dependence.
Figure 7.
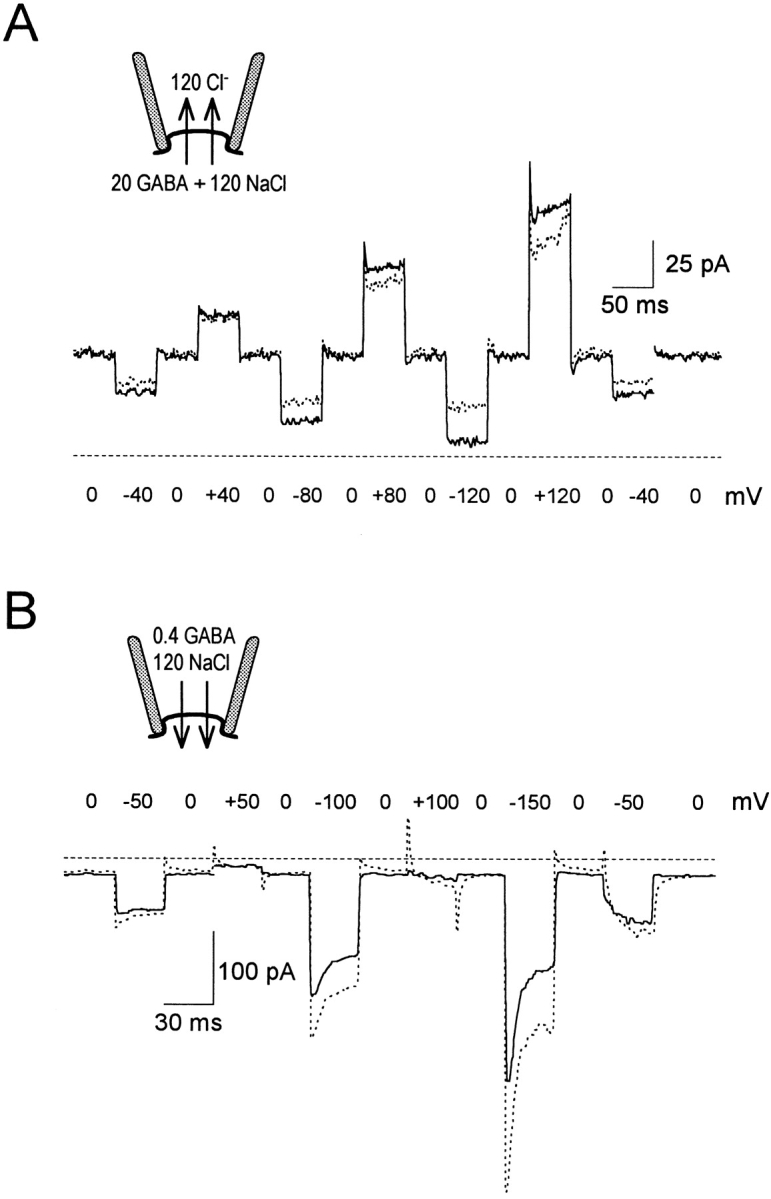
Current transients during forward and reverse GAT1 transport. (A) Outward GAT1 transport currents with 120 mM cytoplasmic NaCl, 120 mM extracellular Cl−, and no extracellular Na+. The solid line shows current activated by 20 mM cytoplasmic GABA, and the dotted line shows NO-711i–defined current. (B) Inward GAT1 transport current with 0.4 mM extracellular GABA and 120 mM extracellular NaCl. Current records in the presence of 120 mM cytoplasmic Cl−(solid line) or 0.13 mM cytoplasmic NO-711 (dotted line) were subtracted from those with zero cytoplasmic substrates and zero inhibitor. Dashed lines represent zero current. Holding potential was 0 mV.
In contrast, current transients associated with the inward transport mode are much more pronounced and have rates similar to those of the slow charge movements. Fig. 7 B shows typical results using 120 mM cytoplasmic Cl− (solid line) or 0.13 mM NO-711i (dotted line) to define the current. Membrane current responds to the voltage step from 0 to −50 mV essentially in a step, without a pre–steady state transient. Thus, at −50 mV, the rate of the charge-moving step cannot be greater than the rates of other steps. The transient current components become larger with larger pulses (i.e., to −100 and −150 mV). At −150 mV, the current activated by hyperpolarization decays by ∼50% with a rate constant of ∼80 s−1. This presumably reflects the major charge-moving step, which takes place faster with application of large voltages; the slowest electroneutral step, which presumably does not change in rate, must be taking place at ∼40 s−1 to account for the 50% decline of current.
Finally, we used the rates of charge movements to estimate the turnover rate for the reverse GAT1 transport cycle. To do so, we measured the slow charge movements and the outward transport current in the same patch, both defined by cytoplasmic NO-711 in the presence of 120 mM extracellular NaCl (Fig. 8 A). Both the Q slow–V and k slow–V relations in Fig. 8 B are similar to those described previously (Fig. 1 C). As shown in Fig. 8 B, the Q–V relation for the slow charge movement has a slope of 0.99, a midpoint potential of −33.1 mV, and a ΔQ max of 2.6 pC. Given the patch size of 8 pF and an assumed specific membrane capacitance of 0.8 μF/cm2, the transporter density is ∼2,000/μm2. On this basis, the turnover rates in the presence of extracellular Na+ can be estimated by the ratio of steady state current magnitude to ΔQ max, and they are plotted as a function of membrane potential in Fig. 8 B. The turnover rate increases from ∼3 s−1 at −120 mV to ∼60 s−1 at +120 mV. As expected, the turnover rate never exceeds the rate of the slow charge movement.
Figure 8.

Estimation of GAT1 turnover rates from the slow charge movements and steady state current magnitudes. (A) The NO-711i–sensitive GAT1 transient (top) and steady state outward transport current (bottom) were recorded in the same patch in the presence of 120 mM extracellular NaCl. The current transients are a subtraction of records with no cytoplasmic substrates (no inhibitor record minus 0.13 mM cytoplasmic NO-711 record). Steady state GAT1 transport current (bottom) is with 20 mM cytoplasmic GABA and 120 mM cytoplasmic NaCl (no inhibitor record minus 0.13 mM NO-711 record). Dashed lines under the current trace represents zero current. Holding potential was 0 mV. (B) Voltage dependence of charge movement (○ and •), rate constants of the slow charge (▪), and turnover rates (□). The magnitude and rate of charge movement in A were estimated from extrapolation of the exponential current decay for pulses to (•) and from (○) various voltages. The fit of the Q–V relation by a Boltzmann function (smooth line) gives a midpoint voltage of −33.1 mV, a slope of 0.99, and a total charge of 2.6 pC. The turnover rates were calculated as the quotient of steady state transport current and total charge moved, assuming that one elementary charge moves per transport cycle.
discussion
Our studies of GAT1 charge movements suggest that extracellular and cytoplasmic substrate binding are mutually exclusive, as predicted for an alternating access model. With this perspective, we will first discuss the charge movements themselves, then their coupling, and finally GAT1 kinetics. Our work was greatly facilitated by the finding that the GABA uptake inhibitor NO-711, in contrast to SKF-89976A (Mager et al. 1993, Mager et al. 1996), eliminates both the steady state GAT1 transport current and the slow charge movements when applied from the cytoplasmic side. We have failed to define genuine “null states” for fast charge movements occurring in GAT1.
The Slow GAT1 Charge Movement (Qslow)
Besides GAT1, several other Na+-dependent transporters display charge movements that are closely related to the binding of extracellular Na+ (Nakao and Gadsby 1986; Lagnado and McNaughton 1990; Hilgemann et al. 1991; Sturmer et al. 1991; Gadsby et al. 1993; Loo et al. 1993; Wadiche et al. 1995)—the question is how. The idea of an “ion well”, as sketched by Läuger 1991, supposes that ions diffuse into their binding sites through a pore or a “channel-like” structure, along which there is a fall of membrane potential experienced by the ion. The major GAT1 charge movement is very slow (2–300 s−1), and the rates of charge movements are sensitive to temperature (Lu and Hilgemann, unpublished observations) and mutational changes (Mager et al. 1996). Thus, it seems much more likely that conformational changes, not diffusion of ions, underlie Q slow kinetics. The conformational changes could occur, in principle, either after or before the actual binding of Na+. Our simulations, described in the following article, incorporate both possibilities (Hilgemann and Lu 1999).
For the Na/K pump, signals consistent with an ion well mechanism have been isolated for the weakly voltage-dependent binding of extracellular Na+ at sites that probably can also bind K+ (Läuger and Apell 1988; Rakowski 1993; Hilgemann 1994). If a “deep ion well” for Na+ exists, it must occur within a transitional pump state (Hilgemann 1997). In this case, ion binding will generate a fast charge movement whose magnitude is proportional to the fractional occupancy of the transitional state. We have attempted extensively to identify such charge movements for the Na/K pump in cardiac patches (Hilgemann 1997), for the Na/Ca exchanger in cardiac and oocyte patches (Hilgemann 1996), and now for the GAT1 cotransporter in oocyte patches. Up to now, we did not identify any signal that could reflect the existence of such a “deep ion well” in the literal sense of Peter Läuger's suggestion (Läuger 1991).
It is noteworthy that the Q slow of GAT1 behaves differently from that of the Na/K pump. The rate of the Na/K pump charge movement decreases monotonically with depolarization to a plateau rate (Rakowski et al. 1997). In contrast, our results for GAT1 show a bell-shaped dependence of rate on voltage (Fig. 1 and Fig. 8). In intact oocytes, the increase of rate with hyperpolarization is less pronounced (Mager et al. 1996), and our work suggests that the presence of cytoplasmic Cl− in oocytes could be a factor in this difference.
Fast GAT1 Charge Movements (Qfast )
We have developed our interpretation of the Q fast charge movements with the presentation of data. To reiterate briefly, charged residues of the GAT1 substrate binding sites might flex somewhat within the membrane field, and they would do so more easily when open to the cytoplasmic than the extracellular side. When a Cl− is bound on the cytoplasmic side, either the rate of one such reaction is increased or Cl− i itself can change position rapidly within its binding site. Thus, application of cytoplasmic Cl− suppresses one charge movement and gives rise to a faster one, such that subtractions of the charge records generate charge transients (Fig. 6). Three different types of experiments (Fig. 4 Fig. 5 Fig. 6) indicate that the magnitude of the charge movement taking place in the presence of Cl− i is ∼20% smaller than that of the reaction taking place in the absence of Cl− i (Fig. 4 Fig. 5 Fig. 6). One of the slower reactions in the absence of Cl− i might reflect opening and closing of the empty Cl− binding site, which would impart a weak voltage dependence on Cl− i binding. We have been able to identify such reactions, in spite of their small magnitude, only because they are very fast. Overall, the reactions underlying fast GAT1 charge movements are so weakly voltage dependent that they will not markedly influence the voltage dependence of GAT1 currents.
Extracellular Na+ Binding and Cytoplasmic Cl− Binding are Mutually Exclusive
While only Na+ can clearly bind to GAT1 from the extracellular side in the absence of cosubstrates, only Cl− clearly interacts with GAT1 from the cytoplasmic side in the absence of cosubstrates. Four results suggest that extracellular Na+ and cytoplasmic Cl− bind to the transporter in a mutually exclusive fashion. (a) High cytoplasmic Cl− concentrations appear to block the slow GAT1 charge movement (Fig. 1). Binding of Cl− i retards the forward rate of the charge movement (i.e., Na+ occlusion) and thereby shifts the charge movement to more negative potentials (Fig. 2). (b) Rapid application of cytoplasmic Cl− induces a Na+ o-dependent outward charge movement that is equivalent in magnitude to the backward charge reaction (i.e., Na+ deocclusion) and that precludes the backward reaction in voltage pulse experiments (Fig. 3 A). (c) Positive potential reduces the ability of Cl− i to induce Na+ o-dependent outward current transients, as expected if Na+ is already released; negative membrane voltage reduces the ability of Cl− i to induce Na+ o-dependent outward current, as expected if the Na+-occluded state is stabilized (Fig. 3 B). (d) The fast charge movements, which are suppressed by cytoplasmic Cl−, are also suppressed by the forward reaction (i.e., Na+ occlusion) of the slow charge movement (Fig. 4).
Pre–Steady State Currents and GAT1 Turnover Rates
Pre–steady state current transients induced by voltage pulses are slow and prominent during forward GAT1 operation, while they are fast and small during reverse transport operation (Fig. 7 and Fig. 8). These results allow quite precise estimates of the rates of voltage-independent steps in GAT1 operation that are considered in the following article (Hilgemann and Lu 1999). The voltage-independent reaction that occurs after Q slow in the forward transport cycle, for example, must occur at ∼40 s−1 (Fig. 7). Our estimation of turnover rates, from these and related measurements, depends on the assumption that GAT1 stoichiometry is quite constant. That uncoupled currents cannot be very large is indicated by the fact that steady state GAT1 current magnitudes never exceed current magnitudes that occur during reversible charge movements. The turnover rate for fully activated reverse transport at +120 mV is 60 s−1, and this is approximately threefold slower than the rate of the slow charge movement at the same potential in the presence of extracellular Na+ (Fig. 8 B). In the following article (Hilgemann and Lu 1999), we describe how the major findings of this article, our previous findings, and findings of others from whole-oocyte studies (Mager et al. 1993, Mager et al. 1996) can be reasonably well accounted for by a simple alternating access transport model.
Footnotes
1used in this paper: GABA, γ-aminobutyric acid; Q–V, charge–voltage
References
- Chen X.Z., Coady M.J., Lapointe J.Y. Fast voltage clamp discloses a new component of currents from the Na+–glucose cotransporter. Biophys. J. 1996;71:2544–2552. doi: 10.1016/S0006-3495(96)79447-X. [DOI] [PMC free article] [PubMed] [Google Scholar]
- Gadsby D.C., Rakowski R.F., De Weer P. Extracellular access to the Na,K pumppathway similar to ion channel. Science. 1993;260:100–103. doi: 10.1126/science.7682009. [DOI] [PubMed] [Google Scholar]
- Hilgemann D.W. Regulation and deregulation of cardiac Na+–Ca2+ exchange in giant excised sarcolemmal membrane patches. Nature. 1990;344:242–245. doi: 10.1038/344242a0. [DOI] [PubMed] [Google Scholar]
- Hilgemann D.W., Nicoll D.A., Philipson K.D. Charge movement during Na+ translocation by native and cloned cardiac Na+–Ca2+ exchanger. Nature. 1991;352:715–718. doi: 10.1038/352715a0. [DOI] [PubMed] [Google Scholar]
- Hilgemann D.W. Channel-like function of the Na,K pump probed at microsecond resolution in giant membrane patches. Science. 1994;263:1429–1432. doi: 10.1126/science.8128223. [DOI] [PubMed] [Google Scholar]
- Hilgemann D.W. Unitary cardiac Na+, Ca2+ exchange current magnitudes determined from channel-like noise and charge movements of ion transport. Biophys. J. 1996;71:759–768. doi: 10.1016/S0006-3495(96)79275-5. [DOI] [PMC free article] [PubMed] [Google Scholar]
- Hilgemann D.W. Recent electrical snapshots of the cardiac Na,K pump. Ann. NY Acad. Sci. 1997;834:260–269. doi: 10.1111/j.1749-6632.1997.tb52257.x. [DOI] [PubMed] [Google Scholar]
- Hilgemann D.W., Lu C. GAT1 (GABA:Na+:Cl−) cotransport functiondatabase reconstruction with an alternating access model. J. Gen. Physiol. 1999;114:459–475. doi: 10.1085/jgp.114.3.459. [DOI] [PMC free article] [PubMed] [Google Scholar]
- Kavanaugh M.P., Arriza J.L., North R.A., Amara S.G. Electrogenic uptake of γ-aminobutyric acid by a cloned transporter expressed in Xenopus oocytes. J. Biol. Chem. 1992;267:22007–22009. [PubMed] [Google Scholar]
- Keynan S., Kanner B.I. γ-Aminobutyric acid transport in reconstituted preparations from rat braincoupled sodium and chloride fluxes. Biochemistry. 1988;27:12–17. doi: 10.1021/bi00401a003. [DOI] [PubMed] [Google Scholar]
- Lagnado L., McNaughton P.A. Electrogenic properties of the Na:Ca exchange. J. Membr. Biol. 1990;113:177–191. doi: 10.1007/BF01870070. [DOI] [PubMed] [Google Scholar]
- Läuger P., Apell H.J. Transient behaviour of the Na+/K+-pumpmicroscopic analysis of nonstationary ion-translocation. Biochim. Biophys. Acta. 1988;944:451–464. doi: 10.1016/0005-2736(88)90516-0. [DOI] [PubMed] [Google Scholar]
- Läuger P. Electrogenic Ion Pumps 1991. Sinauer Associates, Inc; Sunderland, MA: pp. 74–81 [Google Scholar]
- Loo D.D., Hazama A., Supplisson S., Turk E., Wright E.M. Relaxation kinetics of the Na+/glucose cotransporter. Proc. Natl. Acad. Sci. USA. 1993;90:5767–5771. doi: 10.1073/pnas.90.12.5767. [DOI] [PMC free article] [PubMed] [Google Scholar]
- Lu C.C., Hilgemann D.W. GAT1 (GABA:Na+:Cl−) cotransport functionsteady state studies in giant Xenopus oocyte membrane patches. J. Gen. Physiol. 1999;114:429–444. doi: 10.1085/jgp.114.3.429. [DOI] [PMC free article] [PubMed] [Google Scholar]
- Lu C.C., Kabakov A., Markin V.S., Mager S., Frazier G.A., Hilgemann D.W. Membrane transport mechanisms probed by capacitance measurements with megahertz voltage clamp. Proc. Natl. Acad. Sci. USA. 1995;92:11220–11224. doi: 10.1073/pnas.92.24.11220. [DOI] [PMC free article] [PubMed] [Google Scholar]
- Mager S., Kleinberger-Doron N., Keshet G.I., Davidson N., Kanner B.I., Lester H.A. Ion binding and permeation at the GABA transporter GAT1. J. Neurosci. 1996;16:5405–5414. doi: 10.1523/JNEUROSCI.16-17-05405.1996. [DOI] [PMC free article] [PubMed] [Google Scholar]
- Mager S., Naeve J., Quick M., Labarca C., Davidson N., Lester H.A. Steady-states, charge movements, and rates for a cloned GABA transporter expressed in Xenopus oocytes. Neuron. 1993;10:177–188. doi: 10.1016/0896-6273(93)90309-f. [DOI] [PubMed] [Google Scholar]
- Nakao M., Gadsby D.C. Voltage dependence of Na translocation by the Na/K pump. Nature. 1986;323:628–630. doi: 10.1038/323628a0. [DOI] [PubMed] [Google Scholar]
- Parent L., Supplisson S., Loo D.D., Wright E.M. Electrogenic properties of the cloned Na+/glucose cotransporterII. A transport model under nonrapid equilibrium conditions [published erratum appears in J. Membr. Biol. 1992. 130:203] J. Membr. Biol. 1992;125:63–79. doi: 10.1007/BF00235798. [DOI] [PubMed] [Google Scholar]
- Radian R., Kanner B.I. Stoichiometry of sodium- and chloride-coupled γ-aminobutyric acid transport by synaptic plasma membrane vesicles isolated from rat brain. Biochemistry. 1983;22:1236–1241. doi: 10.1021/bi00274a038. [DOI] [PubMed] [Google Scholar]
- Rakowski R.F. Charge movement by the Na/K pump in Xenopus oocytes. J. Gen. Physiol. 1993;101:117–144. doi: 10.1085/jgp.101.1.117. [DOI] [PMC free article] [PubMed] [Google Scholar]
- Rakowski R.F., Gadsby D.C., De Weer P. Voltage dependence of the Na/K pump. J. Membr. Biol. 1997;155:105–112. doi: 10.1007/s002329900162. [DOI] [PubMed] [Google Scholar]
- Sturmer W., Buhler R., Apell H.J., Läuger P. Charge translocation by the Na,K-pumpII. Ion binding and release at the extracellular face. J. Membr. Biol. 1991;121:163–176. doi: 10.1007/BF01870530. [DOI] [PubMed] [Google Scholar]
- Wadiche J.I., Arriza J.L., Amara S.G., Kavanaugh M.P. Kinetics of a human glutamate transporter. Neuron. 1995;14:1019–1027. doi: 10.1016/0896-6273(95)90340-2. [DOI] [PubMed] [Google Scholar]