Abstract
Neurotransmitter transporters are reported to mediate transmembrane ion movements that are poorly coupled to neurotransmitter transport and to exhibit complex “channel-like” behaviors that challenge the classical “alternating access” transport model. To test alternative models, and to develop an improved model for the Na+- and Cl−-dependent γ-aminobutyric acid (GABA) transporter, GAT1, we expressed GAT1 in Xenopus oocytes and analyzed its function in detail in giant membrane patches. We detected no Na+- or Cl−- dependent currents in the absence of GABA, nor did we detect activating effects of substrates added to the trans side. Outward GAT1 current (“reverse” transport mode) requires the presence of all three substrates on the cytoplasmic side. Inward GAT1 current (“forward” transport mode) can be partially activated by GABA and Na+ on the extracellular (pipette) side in the nominal absence of Cl−. With all three substrates on both membrane sides, reversal potentials defined with specific GAT1 inhibitors are consistent with the proposed stoichiometry of 1GABA:2Na+:1Cl−. As predicted for the “alternating access” model, addition of a substrate to the trans side (120 mM extracellular Na+) decreases the half-maximal concentration for activation of current by a substrate on the cis side (cytoplasmic GABA). In the presence of extracellular Na+, the half-maximal cytoplasmic GABA concentration is increased by decreasing cytoplasmic Cl−. In the absence of extracellular Na+, half-maximal cytoplasmic substrate concentrations (8 mM Cl−, 2 mM GABA, 60 mM Na+) do not change when cosubstrate concentrations are reduced, with the exception that reducing cytoplasmic Cl− increases the half-maximal cytoplasmic Na+ concentration. The forward GAT1 current (i.e., inward current with all extracellular substrates present) is inhibited monotonically by cytoplasmic Cl− (K i, 8 mM); cytoplasmic Na+ and cytoplasmic GABA are without effect in the absence of cytoplasmic Cl−. In the absence of extracellular Na+, current–voltage relations for reverse transport current (i.e., outward current with all cytoplasmic substrates present) can be approximated by shallow exponential functions whose slopes are consistent with rate-limiting steps moving 0.15–0.3 equivalent charges. The slopes of current–voltage relations change only little when current is reduced four- to eightfold by lowering each cosubstrate concentration; they increase twofold upon addition of 100 mM Na+ to the extracellular (pipette) side.
Keywords: neurotransmitter transporter, NO-711, patch clamp, substrate translocation, voltage dependence
introduction
Neurotransmitter transporters, many of which are of great medical importance (Wong et al. 1995; Meyer et al. 1996; Ni and Miledi 1997), couple the “uphill” transport of neurotransmitters into cells to the “downhill” movement of Na+. Transport is often coupled to transmembrane movements of other ions, such as Cl−, K+, and/or protons (Wong et al. 1995; Meyer et al. 1996; Ni and Miledi 1997). Two distinct gene families for plasmalemmal neurotransmitter transporters are identified, the family of Na+/Cl−-dependent transporters for γ-aminobutyric acid (GABA),1 glycine, serotonin, and catecholamines and the family of excitatory amino acid transporters (Amara and Arriza 1993; Lester et al. 1994). GABA transport could be studied in native membranes, and a transport stoichiometry of 1GABA:2Na+:1Cl− was suggested (Radian and Kanner 1983; Keynan and Kanner 1988; Kanner and Schuldiner 1987). The GABA transporter, GAT1, was the first member of its family to be cloned (Guastella et al. 1990), and initial findings on GAT1 expressed in Xenopus oocytes (Kavanaugh et al. 1992; Mager et al. 1993) were consistent with the proposed stoichiometry.
Stoichiometric transport of substrates is usually explained by the “alternating access” hypothesis (Jardetzky 1966; Läuger 1991), whereby conformational changes allow substrates to bind alternatively on one membrane side or the other, and to be transported across the membrane (for overview of cotransport models and references, see Jauch and Läuger 1986). However, recent studies have led several authors to question the validity of the alternating access model for GAT1: some findings suggest the existence of “leak modes” of the transporter (e.g., uncoupled current in the absence of GABA) that result in major departures from the accepted stoichiometry (Cammack et al. 1994; Cammack and Schwartz 1996; Galli et al. 1996; Mager et al. 1996; Sonders and Amara 1996). Additionally, some GABA uptake studies, in combination with current measurements, suggest much larger Na+ movements than predicted by a 1GABA:2Na+:1Cl− stoichiometry (Risso et al. 1996; Bechkman and Quick 1998). Furthermore, channel-like behaviors have been identified as current noise in some recordings and as probable “single channel” currents under certain conditions in other recordings (Cammack et al. 1994; Galli et al. 1996). Possibly, the channel-like, nonstoichiometric behaviors identified for GAT1 and other neurotransmitter transporters, including a Cl− conductance in glutamate transporters (Fairman et al. 1995), represent important clues needed to understand the physical basis of neurotransmitter transport (Fairman et al. 1995; Su et al. 1996; DeFelice and Blakely 1996).
To address these issues, we have characterized GAT1 function with the Xenopus oocyte expression system, using giant membrane patches to record GAT1 currents (Hilgemann 1995). For these studies, the ability to control substrate concentrations on both membrane sides and to voltage clamp with microsecond resolution are major advantages of the giant patch methods (Hilgemann and Lu 1998). In this article, we describe problems of measuring GAT1 currents in oocyte membrane and our lack of evidence for GABA-uncoupled currents. We characterize steady state GAT1-mediated currents with an emphasis on the reverse (outward) current and cis–trans substrate interactions for both transport directions. After analyzing our results in relation to the proposed “channel-like” cotransport models, we conclude that GAT1 operates by the alternating access principle. Thus, a major goal of our work has been to develop an alternating-access reaction scheme that can account for GAT1 function in Xenopus oocyte membranes (Hilgemann and Lu 1999).
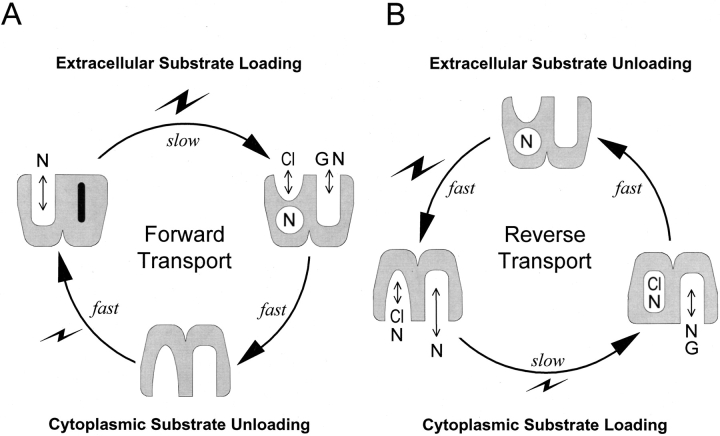
The reaction cartoons, shown in Fig. 1, are intended to orient the reader to our overall goal; namely, to account for the dependencies of GAT1 function on all three substrates on both membrane sides, to account for voltage dependencies of transport, and to account for transporter kinetics. Fig. 1 A depicts groups of reactions thought to occur in the forward transport mode of GAT1 (i.e., moving GABA into cells) on the basis of previous work. Perhaps the most important detail is that a slow reaction can occlude one Na+ ion from the extracellular side in the absence of GABA and chloride (Mager et al. 1998; Hilgemann and Lu 1999). This reaction is electrogenic and appears to move about one charge per transporter cycle through the membrane electric field. It is therefore marked with a large lightning symbol in Fig. 1. As further indicated, the reaction is relatively slow (τ = 15–200 ms), and it probably rate-limits inward current in the middle potential range, where the slope of the current–voltage relations of the transport current is quite steep. Evidently, GABA and chloride can bind only after Na+ has been occluded by the transporter, and when they do so, all three substrates are transported to the cytoplasmic side via a faster reaction (Fig. 1, fast) that is nearly electroneutral. At large negative potentials where the “slow” charge-moving reaction is accelerated, this “fast” translocation reaction probably becomes rate limiting; this would explain the observed current saturation with hyperpolarization (Mager et al. 1998). It is known from previous giant patch studies that distinct fast reactions (τ < 1 ms) can occur in GAT1 in the absence of substrates on both membrane sides (Lu et al. 1995). Labeled “fast” and associated with a small lightning symbol in Fig. 1 A, these reactions are blocked by the presence of cytoplasmic Cl−, and they might represent a reorientation of the empty transporter sites to the outside to allow rebinding of Na+ (Lu et al. 1995). Presumably, these reactions never become rate limiting for GABA transport.
Figure 1.
Perspectives on the minimum reactions involved in forward and reverse GAT1 transport. (A) Forward (GABA uptake) transport mode. Starting in the upper left, one Na+ can be occluded from the extracellular side in a slow reaction that is strongly electrogenic (i.e., a large lightning bolt). Thereafter, Cl−, GABA, and a second Na+ bind and are translocated to the cytoplasmic side in a “fast” reaction that is electroneutral. Finally, transporter binding sites reorient to the outside-open position when no substrates are bound on the cytoplasmic side. This reaction is fast and weakly voltage dependent (i.e., small lightning bolt). (B) Reverse (GABA extrusion) transport mode. Starting in the lower left, Cl− and Na+ can bind from the cytoplasmic side. One Cl− and one Na+ are occluded in a slow reaction with weak voltage dependence (i.e., small lightning bolt). Thereafter, one Na+ and one GABA bind and are translocated in a fast electroneutral reaction. When empty binding sites are open to the extracellular side, one Na+ ion is still occluded in the transporter. This Na+ ion is released to the outside in a fast, strongly voltage-dependent reaction (i.e., large lightning bolt), and, in close association with this reaction, binding sites rearrange to the cytoplasmic side-open configuration.
The results described in this article for the reverse transport mode (i.e., GABA transport from inside to outside) give rise to the reaction perspectives summarized in Fig. 1 B. In the absence of extracellular substrates, the reverse transport cycle appears to be rate limited by a weakly voltage-dependent reaction under most conditions. According to our analysis, the underlying reaction must involve the occlusion and/or translocation of substrates from the cytoplasmic side. One possible scheme is shown in Fig. 1 B, where one Cl− and one Na+ are occluded in a slow step, and all other reactions in the reverse cycle are much faster. These include (a) the binding of a second cytoplasmic Na+ and GABA, (b) electroneutral substrate transport and release to the extracellular side (Fig. 1 B, fast), (c) the electrogenic deocclusion of Na+ (fast, with a large lightning symbol), and (d) the reorientation of empty binding sites that allows cytoplasmic Cl− and Na+ to bind again. We point out that the results presented in this article alone do not justify these interpretations, and that the interpretations alone do not allow formulation of a reaction scheme for GAT1. Thus, in an accompanying article (Lu and Hilgemann 1999), we describe new kinetic findings on non–steady state GAT1 function that are critical to our interpretations. And we describe in another article the development of an alternating access model that can account for most details of GAT1 function in the Xenopus oocyte membrane (Hilgemann and Lu 1999).
materials and methods
Transporter Expression
GAT1 cRNA was in vitro transcribed from pBSAMVGAT1 (gift of S. Mager, California Institute of Technology, Pasadena, CA) with T7 polymerase and injected into Xenopus oocytes, which were isolated and maintained according to Zühlke et al. 1995. Transport currents and capacitance were recorded 4–7 d after injection in excised giant patches. In the absence of extracellular Na+, outward GAT1 transport current was 15–200 pA at 0 mV, depending on patch size and expression level, in the presence of 20 mM cytoplasmic GABA and 120 mM cytoplasmic NaCl.
Electrophysiology
Giant inside-out oocyte membrane patches (6–12 pF; seal resistance > 1 GΩ) were obtained as previously described (Hilgemann 1989, Hilgemann 1995). Methods for pipette perfusion and concentration jumps are also detailed elsewhere (Hilgemann and Lu 1998). Unless indicated otherwise, transport currents were recorded at 32°C. Membrane currents were recorded using an Axopatch 200 patch clamp amplifier (Axon Instruments). Voltage protocols and data acquisition were executed with Digidata 1200 (Axon Instruments), using our own software. Membrane capacitance was measured according to Lu et al. 1995, using a Princeton lock-in amplifier (5302; EG&G Instruments). Data analysis and curve fitting used Origin5.0 (Microcal Software, Inc.).
Data Presentation
Many experiments described in this and the next article (Lu and Hilgemann 1999) were technically demanding. The results presented are from single experiments that we judge to be reliable. The results were verified in multiple observations, and, usually, two or more additional experiments with very similar results were obtained. However, patches sometimes became unstable before all data points in a protocol were acquired, and we judge that results from patches with low GAT1 expression are in general less reliable than results from patches with high expression. For these reasons, we do not include statistical analysis.
Current–voltage relations for the outward GAT1 currents, presented in this article, are described well by a simple exponential (Boltzmann) function of the form, A · eq· 0.5 · Em · F / RT, where A is a scalar, Em is the membrane potential, F/RT has its usual meaning, and q is the equivalent charge. According to Eyring rate theory, and assuming an energy barrier midway through the membrane electrical field, the “equivalent charge” is the amount of charge that would have to move through the entire membrane field to account for the voltage dependence. This is “equivalent” to a proportionally larger charge amount that would move through a proportionally smaller fraction of membrane field to account for the same voltage dependence. RT/F was approximated as 26.5 mV.
Solutions
The standard bath solution contained (mM): 0–20 GABA, 120 NaCl, 0.5 magnesium sulfamate, 20 tetraethylammonium-OH, 10 EGTA, and 20 HEPES, pH 7.0. Unless noted otherwise, the standard pipette solution contained (mM): 20 N-methylglucamine (NMG)1-Cl, 100 NMG–2-(N-morpholino)ethanesulfonic acid (MES), 2 magnesium sulfamate, 4 calcium sulfamate, 0.02 ouabain, and 20 HEPES, pH 7.0. Equimolar NMG was substituted for Na+, and MES was substituted for Cl−.
results
Basic Properties of GAT1-mediated Currents in Giant Oocyte Membrane Patches
Experimental definition of GAT1 current.
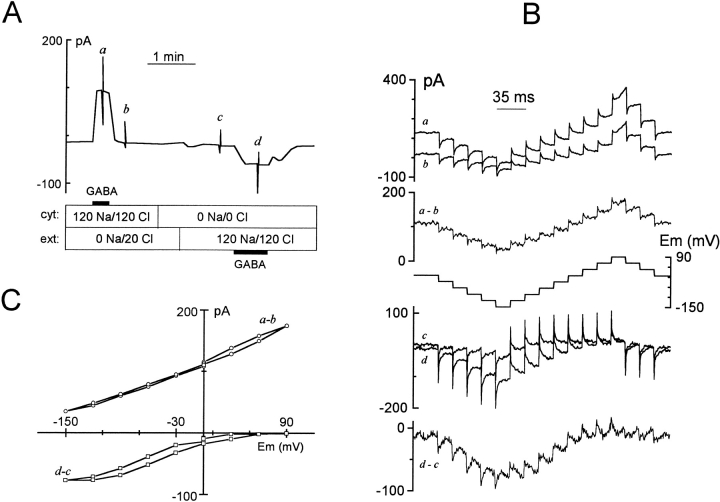
Giant membrane patches from control oocytes exhibited no GABA-activated currents (data not shown). Fig. 2 A shows the typical GABA-activated currents recorded in giant membrane patches from oocytes expressing GAT1. Outward current is activated when GABA (20 mM) is added to a cytoplasmic solution containing 120 mM NaCl, whereby the extracellular (pipette) solution contains 20 mM Cl− and no GABA or Na+. Inward current is activated in the absence of cytoplasmic GABA, Na+, and Cl− when GABA (0.2 mM) is added via pipette perfusion with a pipette solution that contains 100 mM NaCl. Inward currents at 0 mV were typically manyfold smaller than outward currents at 0 mV. In stable patches, the GABA-induced currents showed no change in magnitude for over 30 min.
Figure 2.
Definition of GAT1-mediated currents and I–V relations. (A) Chart record of membrane current at 0 mV: extracellular and cytoplasmic solutions were as indicated in millimolar. Outward GAT1 current was activated by applying 20 mM cytoplasmic GABA in the presence of 120 mM cytoplasmic NaCl. After washing off all cytoplasmic substrates with 120 mM NMG-MES, extracellular solution was changed to 120 mM NaCl via pipette perfusion. Inward GAT1 current was then turned on and off by adding and removing 0.2 mM GABAo from the pipette solution. (B) I–V protocol and the corresponding membrane current responses at the time points indicated in A. (C) I–V relations of GABA-defined outward and inward GAT1 current. The median current amplitudes during the last 3 ms of each voltage step in B are plotted against membrane potential.
Fig. 2 B illustrates our standard protocol for studying the voltage dependence of steady state transport current. When the membrane current reached a new steady value after solution changes, the voltage protocol described in Fig. 2 B (middle) was applied. This is the cause of the current spikes a–d in Fig. 2 A. Typically, we used cumulative membrane voltage steps of 30 mV magnitude from 0 to –150 mV, up to +90 mV, and back to 0 mV. The step durations were just long enough (17.5 ms in Fig. 2 B) so that pre–steady state transients of the inward GAT1 current decayed for the most part during each step. Fig. 2 B (top) shows the membrane current response during (a) and after (b) the application of cytoplasmic GABA, and the difference (a–b) is shown below. The same procedure was used to obtain membrane current responses before (c) and during (d) extracellular GABA application by pipette perfusion. The subtracted record (d–c) reveals pre–steady state current transients that are faster at negative potentials. To obtain the steady state current–voltage (I–V) relation of the subtracted current, the median current magnitude of the last 3 ms of each voltage step is plotted against membrane voltage (Fig. 2 C). The I–V relations are monotonic. There is little or no hysteresis in the outward I–V relation, and the moderate hysteresis present in the inward I–V relation is expected from the slow time-dependent processes in the forward transport cycle (Mager et al. 1993).
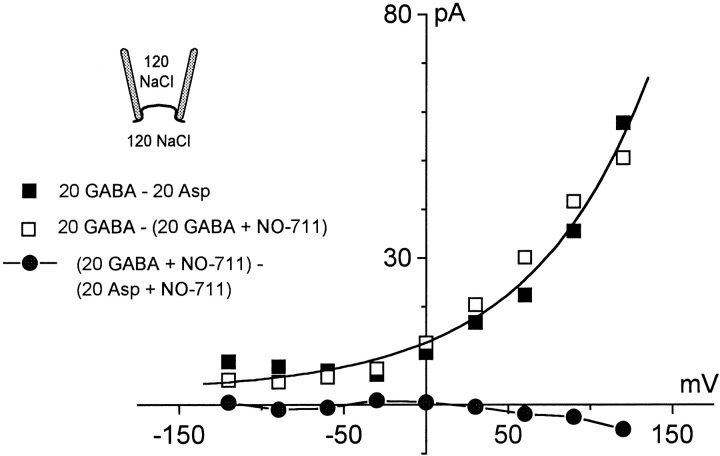
Fig. 3 shows that outward transport currents can be defined by two different means with very similar results. The extracellular solution contains Na+ (120 mM) but no GABA to test for GAT1-mediated inward current in the absence of GABA. (Fig. 3, ▪) Definition of transport current by applying and removing 20 mM GABA from the cytoplasmic side; (□) the definition by applying NO-711, a high-affinity GABA uptake inhibitor, from the cytoplasmic side in the presence of 20 mM cytoplasmic GABA. The results are fitted by the Boltzmann equation, given in materials and methods, and the equivalent charge is 0.63. This slope is two-times larger than in the absence of Na+ o. (Fig. 2 C) Pipette perfusion experiments that define the effect of Na+ o in I–V's in a single experiment are described in Fig. 6 A of a companion article (Hilgemann and Lu 1999). If GAT1 mediated an uncoupled Na+ current, these I–V relations would cross the zero current line and display an inward current component. That is not the case. As shown further in Fig. 3 (•), the presence of NO-711 (0.13 mM) on the cytoplasmic side completely blocks GABA-activated current.
Figure 3.
Outward GAT1 transport current defined by cytoplasmic GABA and NO-711. Outward GAT1 transport current activated by 20 mM cytoplasmic GABA (120 mM NaCl on both membrane sides) was defined by removing GABA with substitution by aspartate (▪) and by applying 0.13 mM NO-711 in the continued presence of GABA (□) on the cytoplasmic side. Note that the two subtraction protocols give very similar results. The results were therefore pooled and fitted by the Boltzmann equation described in materials and methods (solid line; equivalent charge, 0.63). (•) Subtraction of an I–V relation with GABA from one without GABAi in the presence of 0.13 mM cytoplasmic NO-711.
Figure 6.
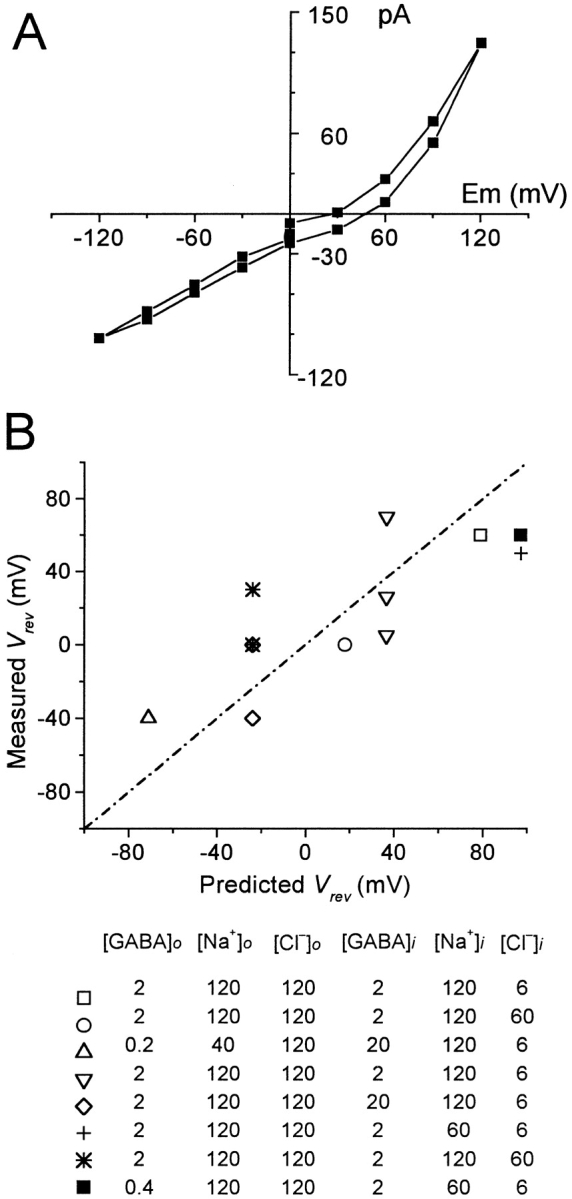
Reversal potential measurements of GAT1 current. (A) GAT1 transport current with all three substrates on both membrane sides was defined by pipette perfusion of NO-711 (13 μM) to the extracellular side. The pipette (extracellular) solution contained 0.4 mM GABA and 120 mM NaCl; the bath (cytoplasmic) solution contained 2 mM GABA, 60 mM Na+, and 6 mM Cl−. (B) NO-711o–defined reversal potentials are plotted against the theoretical values for various conditions listed below the graph. All reversal potentials were measured at 35°C. The dotted line represents the values predicted for perfect 2Na+:1Cl−:1GABA stoichiometry.
Failure to detect GABA-independent GAT1 currents.
In re-lated experiments, we used NO-711 to further test whether GAT1 mediates ionic currents in the absence of GABA. In patches expressing GAT1, current responses to membrane voltage changes before and after applying NO-711 were compared, and no NO-711–inhibited current was clearly detected. Protocols used to define GAT1 charge movements (Lu and Hilgemann 1999) provide one example. We point out that our ability to resolve small Na+ currents is limited by the Xenopus oocyte Na+ conductance. This conductance is slowly activated by depolarization beyond −20 mV in patches (He et al. 1998). It is large in many oocyte batches. Although it decreases continuously over 10–20 min after patch excision, a residual conductance is persistent.
Outward I–V relations were also defined by addition and removal of cytoplasmic Cl− or Na+, leaving the other substrate concentrations constant (not shown). Results for Cl−, using MES as the Cl− substitute, were virtually identical to those with GABA subtraction. This indicates that, in the absence of cytoplasmic Ca2+, the Cl− conductance of the oocyte membrane patches is very small. Results for Na+, using NMG as the Na+ substitute, were also very similar to those with GABA subtraction, provided that GAT1 expression was high and the endogenous Na+ conductance of the oocyte patch had run down. In general, however, the Na+ conductance of the oocyte membrane complicates results obtained with Na+ subtraction.
Strict cosubstrate requirements of outward GAT1 current.
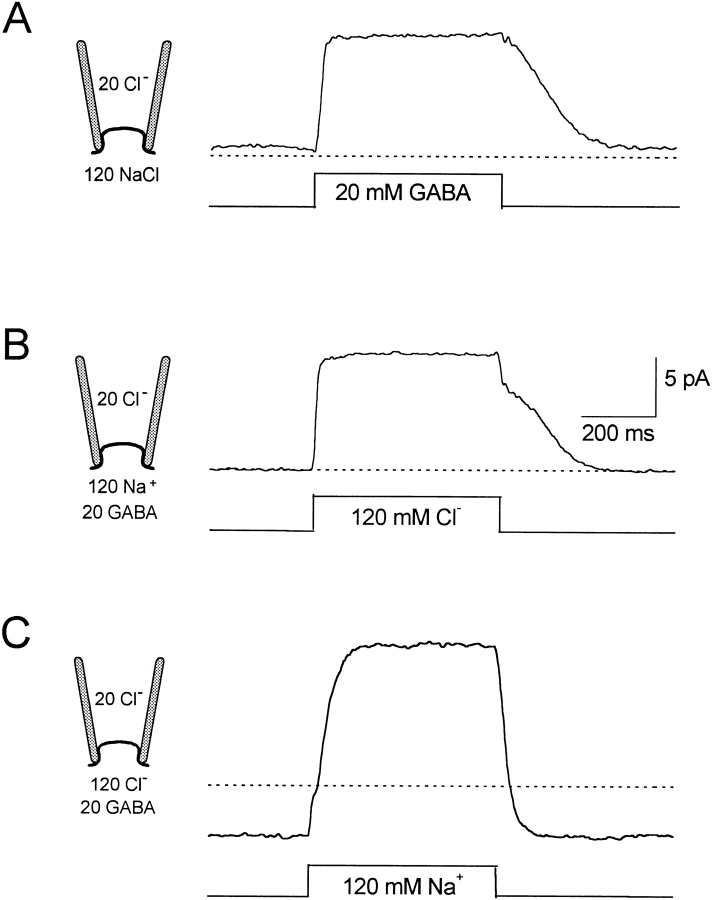
In our experience, activation of outward GAT1 transport current in oocyte patches requires the simultaneous presence of GABA, Na+, and Cl− on the cytoplasmic side. Activation by each substrate in the presence of cosubstrates is demonstrated in Fig. 4. The results were obtained using a fast solution switch device whereby the pipette tip is moved in <3 ms through the interface between two solution streams by a computer-controlled manipulator (Hilgemann and Lu 1998). We present results from a patch with relatively low GAT1 expression since these results illustrate our reasons for defining GAT1 current with GABA application and removal in subsequent experiments. Dotted lines in Fig. 4 indicate the zero current level. Fig. 4 A shows the current record for applying and removing 20 mM cytoplasmic GABA in the presence of 120 mM NaCl. The outward current activates to a plateau in ∼30 ms on applying GABAi, and the current returns to baseline with an S-shaped time course over ∼200 ms. The patch has a small “leak current” (<1 pA) in the presence of 120 mM NaCli. Due to the rise of the membrane into the pipette tip (∼50-μm diameter), the time courses of current activation and deactivation are, with good certainty, determined by the diffusion of GABA up to and away from the membrane, respectively. The rate of activation is relatively fast because the transporter binding sites become saturated with GABAi before diffusion equilibrium is reached. The time course of deactivation is slow because the concentration of GABAi at the membrane must decrease substantially before binding sites are freed of GABAi.
Figure 4.
Activation and deactivation of reverse GAT1 current by rapid solution changes. (A) Application and removal of 20 mM cytoplasmic GABA. (B) Application and removal of 120 mM cytoplasmic Cl−. (C) Application and removal of 120 mM cytoplasmic Na+. Fast changes of cytoplasmic solutions were achieved by moving the recording pipette, which was attached to a computer-controlled piezoelectric device, between two steady streams of different cytoplasmic solutions. The extracellular solution contained 20 mM Cl− and no Na+. See text for further explanations.
Fig. 4 B shows the record obtained on applying 120 mM Cl− i, instead of 120 mM MES− i, in the presence of 20 mM GABAi and 120 mM Na+ i. Current activation is just as fast as with GABAi because the half-maximal Cl− i concentration is only ∼10 mM at 0 mV (see Fig. 8 F). The current relaxation on removal of Cl− i is, however, biphasic. The fast phase of relaxation is probably an artifact caused by the liquid junction potential of these two solutions (∼8 mV), and this will affect the driving force for both leak current and transport current. Thus, Cl− i definition of GAT1 current will have significant artifactual components, particularly with low transport activities, high Cl− i concentrations, and at extreme potentials.
Figure 8.
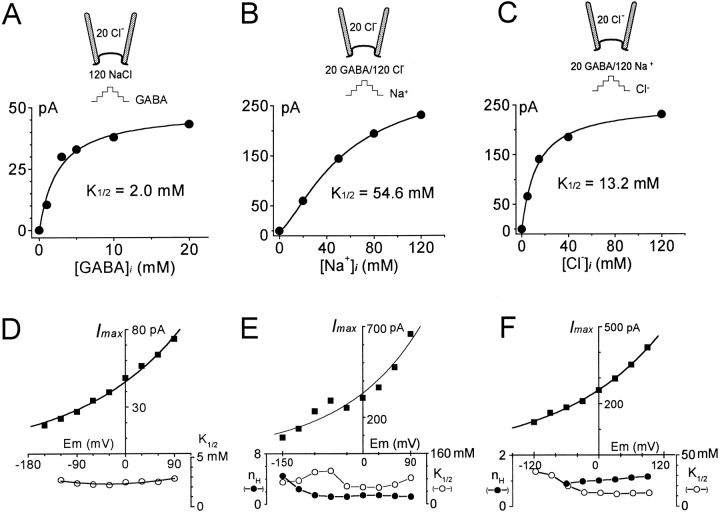
Cytoplasmic substrate dependencies of outward GAT1 transport current. (A–C) Cytoplasmic GABA (A), cytoplasmic Na+ (B), and cytoplasmic Cl− (C) dependencies of GAT1 outward transport current at 0 mV. Half-maximal substrate concentrations (K 1/2s) were obtained from fits by the Hill equation (solid lines). (D–E) Voltage dependencies of I maxs, K 1/2s, and n Hs from the Hill fits for cytoplasmic GABA, Na+, and Cl−. The I max–V relations were fit by the Boltzmann equation given in materials and methods. The slope coefficients are 0.3, 0.36, and 0.29 in D–F, respectively. The fits of GABAi dependencies (D) assumed a Hill coefficient of 1. Results in A and D are from one patch, and results in B, C, E, and F are from another patch.
Fig. 4 C shows the typical result obtained for application of 120 mM Na+ i in the presence of 20 mM GABAi and 120 mM Cl− i, using NMG+ as the Na+ substitute. In this case, removal of Na+ i causes a small inward background Na+ current (<5 pA at 0 mV), which probably reflects Na+-mediated leak current through the patch seal. The activation of GAT1 transport current by Na+ i application is somewhat slower than by GABAi and Cl− i. This is because 120 mM Na+ i does not “super-saturate” binding sites. The current deactivates faster than with the other substrates because the Na+ i dependence of the current is sigmoidal (see Fig. 8 B and 9 C). From these results, we conclude that GAT1 transport current is best defined with GABA application and removal, and GABA definition is used in subsequent results.
Failure to detect secondary “gating” or “trans-activation” mechanisms for GAT1.
In experiments similar to those just described, we tested extensively whether the GAT1 transporter undergoes substrate- and time-dependent activity changes via “secondary modulation” or “inactivation” reactions, analogous to reactions identified for cardiac Na+–Ca2+ exchange (Hilgemann 1990; Matsuoka and Hilgemann 1994). In short, we have found no evidence for such behaviors, on either long or short time scales, down to the time scale of the slow extracellular Na+-dependent GAT1 charge movements (∼20 ms) described in the next article (Lu and Hilgemann 1999). Using pipette perfusion, we also tested whether inward or outward GAT1 currents could be enhanced by the presence of substrates or monovalent ions on the opposite membrane side, as reported for GAT1 currents recorded in stably transfected HEK293 cells (Cammack and Schwartz, 1994). We did not observe any trans-activation effect.
Possible existence of Cl− o -independent inward GAT1 current component.
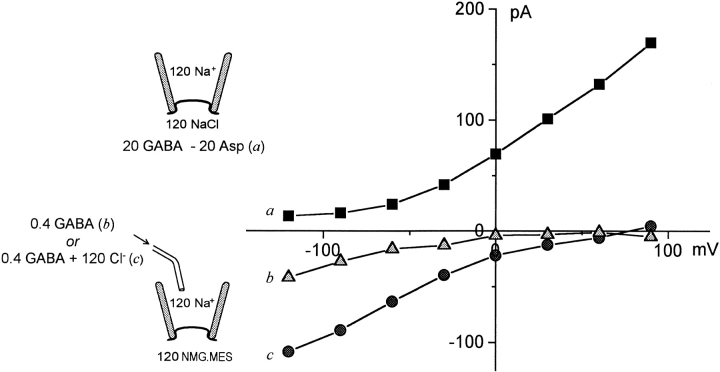
In contrast to the evident tight substrate-current coupling in the activation of reverse (outward) transport current in oocyte patches, forward transport current can be partially activated by extracellular GABA in the nominal absence of extracellular Cl−. Fig. 5 shows records from a single patch: (a) the outward current activated by 20 mM GABAi with 120 mM NaCl on both membrane sides. (b) The NO-711i-sensitive inward current with 0.4 mM GABAo, 120 mM Na+ o, no Cl− o, and no cytoplasmic substrates. (c) The NO-711i-sensitive inward current with 0.4 mM GABAo, 120 mM NaClo, and no cytoplasmic substrates. The Cl− o-independent inward current (Fig. 5b) is more significant at negative membrane potentials (at –120 mV, ∼40% of that with 120 mM Cl− o). These results are comparable with results in intact oocytes (Mager et al. 1993; D.D.F. Loo, S. Eskandari, and E.M. Wright, personal communication).
Figure 5.
I–V relations of GABA-activated currents in the presence and nominal absence of extracellular Cl−. The patch was obtained using a pipette solution with 120 mM extracellular Na-MES and 0 Cl− o, whereby a 300-mM KCl “agar bridge” was used in the pipette. Outward transport current was defined by substituting 20 mM GABA for 20 mM aspartate in the presence of 120 mM NaCl on the cytoplasmic side. After replacing the cytoplasmic solution with 120 mM NMG-MES, inward current was activated with extracellular GABA in the presence of Na+ o. Both were defined with a 0.4 mM GABAo subtraction. The extracellular solution in b contained 120 mM Na-MES and was Cl− free; in c the extracellular solution contained 120 mM NaCl, which was applied by pipette perfusion. The voltage steps were 35 ms in duration. Data points represent the average of current magnitudes at the specified membrane potential during the cumulative voltage protocol.
GAT1 reversal potentials.
To further probe substrate coupling by the GAT1 transporter, we measured reversal potentials with various extracellular-to-cytoplasmic substrate ratios and compared them with the expected reversal potentials, V rev, for 1GABA:2Na+:1Cl− stoichiometry:
 |
where R, T, and F have their usual meanings. For these measurements, I–V relations were determined with all substrates on both membrane sides, before and after extracellular application of the high-affinity organic GAT1 inhibitor NO-711 via pipette perfusion. We note that cytoplasmic NO-711 did not block effectively the GAT1-mediated currents under these conditions, presumably because GABA binding sites are occupied on both membrane sides. Fig. 6 A shows a typical GAT1 I–V relation with a measured V rev of 45 mV. With the substrate concentrations employed (see Fig. 6, legend), the predicted value is 97 mV.
Fig. 6 B shows results obtained with a variety of substrate concentrations. The scatter of experimental results is rather large in the repeated measurements, and this reflects the fact that GAT1 current amplitudes in these conditions are rather small. With 120 mM NaCl and 2 mM GABA on both sides, for example, we could not define any GAT1 current. Nevertheless, all of the measured V rev's, summarized in Fig. 6 B, scatter along the theoretical line without systematic deviation. Thus, within our experimental limitations, we find no contradiction to the idea that GAT1 transport is a well-coupled process.
No effect of osmotic gradients on outward GAT1 current.
Since activation of outward GAT1 current with GABA involves changing solution osmolarity by up to 20 mosmol/liter, we tested whether osmotic strength and/or transmembrane osmotic gradients result in any alteration of GAT1 current. We observed no effects of osmolarity changes using dextrose, aspartate, glutamate, or polyethylene glycol (not shown). In a related issue, Loo et al. 1996 have reported that GAT1 transports water in a manner similar to the brush border Na+/glucose cotransporter, where >200 water molecules appear to be directly coupled to the transport of each sugar molecule. We therefore tested the effect of changing water concentration on GAT1 transport. There was no clear effect on the outward GAT1 transport current when 30% of water molecules were replaced by low molecular weight polyethylene glycol.
Alternating Access Versus Single-file Channel Models of Cotransport
For some ion channels, it is established that ions permeate in a single-file fashion along multiple binding sites (Hille 1992). When two ion species can permeate a channel, permeation of one ion species can sweep the other ion species through the channel against its electrochemical gradient. This mechanism allows a cotransport function to be established in an ion/substrate “hopping” model when it is assumed that a substrate such as GABA can permeate through a Na+-selective channel (Su et al. 1996). Specifically, the “multisubstrate single-file” model assumes that Na+ and a substrate “hop” through a pore with three sites that can bind either the substrate or Na+. The model permits flux-coupling without generating large Na+ leak currents in the absence of substrate, and it can recreate a number of results on GAT1 function. We now compare its function with an “alternating access” model that “simultaneously transports two substrates (Jauch and Läuger 1986).
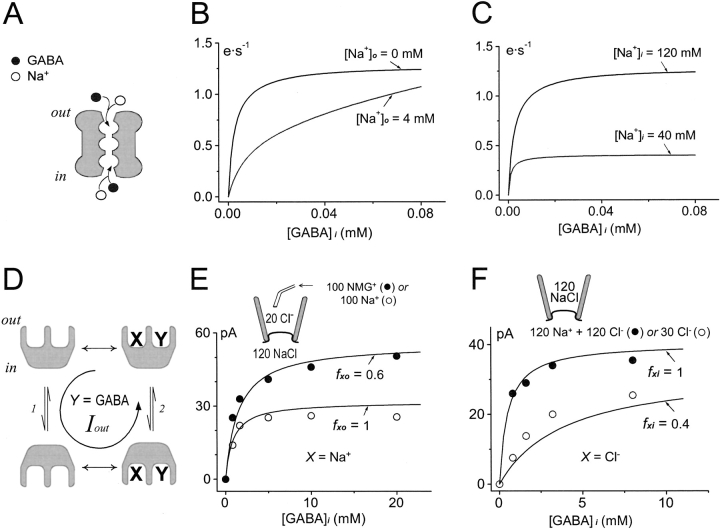
Fig. 7 illustrates predictions for trans- and cis-substrate interactions in the two models (A and D) that we consider fundamental. Predictions for the channel-like model are shown in Fig. 7B and Fig. C; those for the alternating access model are shown in E and F. We simulated the channel model with our own software using the published parameter values (Su et al. 1996), and we checked that our implementation accurately recreated all published steady state simulations. Also, we checked that the model did not contradict thermodynamic constraints under a wide range of conditions. An inherent feature of the channel-like model is that binding of a substrate on one side of the membrane tends to be prevented by substrate flux from the opposite side. Thus, addition of Na+ to the trans side decreases the apparent affinity for GABAi to activate transport from the cis side (Fig. 7 B). On the other hand, substrates on the same (cis) membrane side compete for entrance into the pore. Thus, reduction of [Na+]i results in an increase in the apparent affinity for GABAi (Fig. 7 C).
Figure 7.
Comparison of predictions from a “multi-substrate single-file model” and a two-state alternating access model. (A) Multi-substrate single-file transport model for GAT1 (Su et al. 1996). The channel contains three single-file binding sites that can accommodate either GABA or Na+, and the substrates “hop” between them. (B) Simulation of the “trans-effect” of Na+ o on the GABAi dependence of outward GAT1 transport current. (C) Simulation of the “cis-effect” of Na+ i on the GABAi dependence of outward GAT1 transport current in the presence of Na+ o. In both cases, [Na+]i is not limiting and [GABA]o is zero. (D) A two-state alternating-access model for a simulated “XY-cotransporter,” where efflux of X and Y generates outward transport current. The two time-dependent steps (arrow pairs) of the transport cycle are the rearrangement of binding sites in the empty (1) and fully loaded (2) transporters. The equations employed were equivalent to those used for more extensive simulations (Hilgemann and Lu 1999). The intrinsic transition rates for fully loaded and empty binding sites were equal. Double-headed arrows indicate “instantaneous” association/dissociation of the substrates. (E) Comparison of the measured effect of extracellular Na+ on outward GAT1 current with the simulated trans-effect of Xo. Cytoplasmic GABA concentration dependence of the outward GAT1 current with 120 mM cytoplasmic NaCl at 0 mV was measured in the absence (•) or presence (○) of 100 mM Na+ o. Solid lines represent simulated Yi dependence of outward transport current when [X]i is not limiting and [Y]o is zero, where the fraction of transporters with Xo bound (fxo) is 0.6 (upper curve) or 1 (lower curve). (F) Comparison of the measured effect of lowering cytoplasmic Cl− on outward GAT1 current with the simulated cis-effect of Xi. Cytoplasmic GABA dependence of the outward GAT1 current with 120 mM extracellular NaCl at 0 mV was measured with 120 mM (•) or 30 mM (○) cytoplasmic Cl−. Solid lines represent the simulated Yi dependence of outward transport current in the presence of Xo (fxo = 0.8) and non-limiting Xi, where the fraction of transporters with Xi bound (fxi) is 1 (upper curve) or 0.4 (lower curve).
We use the simple cotransport model in Fig. 7 D to illustrate the equivalent predictions for an alternating access scheme. In this simulation, the cotransporter binds its substrates X and Y instantaneously and independently. The presence of a trans substrate (e.g., Xo) reduces the rate of the “empty carrier translocation” or “return” step (1) in the transport cycle, thereby limiting the rate of transport from the cis side. When the return step is slow, the apparent affinity for cis substrates (e.g., Yi) is higher. The fractional increase of affinity for cis substrates should be proportional to the fractional decrease of maximal transport induced by addition of the trans substrate.
The predictions for X = Na+ and Y = GABA are shown in Fig. 7 E, together with the corresponding data from a pipette perfusion experiment. The simulated GABAi dependencies (solid lines) are scaled to the measured magnitudes of outward GAT1 currents with (○) or without (•) 100 mM extracellular Na+ at 0 mV. In the presence of high [Na+]o, the maximal GABAi-induced current is decreased, and the apparent affinity of GAT1 for GABAi is increased. The half-maximum GABAi concentrations are 0.90 and 0.52 mM, respectively, in the absence and presence of 100 mM Na+ o. Clearly, the data agrees well with the simple alternating access transport model, but not the “channel model” (Fig. 7 B).
Fig. 7 F shows predictions for cis-substrate interactions by the same alternating access model (Fig. 7 D; X = Cl− and Y = GABA), together with the corresponding experimental data. With a rate-limiting empty carrier translocation step in the reverse transport cycle, outward transport current activated by one substrate (e.g., Yi or GABAi) becomes smaller if the concentration of its cis cosubstrate (e.g., Xi or Cl− i) is lowered. This reduction in current amplitude is “overcome” by a sufficiently high concentration of Yi, and a reduction of the cis-cosubstrate concentration results in a decreased apparent affinity for the substrate. This is the case here because the maximal transport rate is determined by the rate of the return step (Fig. 7 D, 1), rather than the translocation steps (2) from the cis side. From other observations, we expect that the empty carrier translocation step in GAT1 becomes rate limiting during reverse transport only in the presence of high extracellular Na+. As shown by the data in Fig. 7 F with 120 mM extracellular NaCl, reduction of [Cl−]i from 120 to 30 mM shifts the half-maximal concentration for GABAi from 0.3 to 2.7 mM, while the maximal transport current is decreased by only 25%. This pattern is well simulated by the model in Fig. 7 D (Fig. 7 F, solid lines). In contrast, the channel model predicts that reduction of a cis cosubstrate (i.e., Na+ i) increases the apparent affinity for GABAi (Fig. 7 C) since GABAi competes with Na+ i for entrance to the pore. Thus, both cis–trans and trans–trans substrate interactions of GAT1 are predicted by alternating access models of cotransport, and they contradict the channel-like model of cotransport. Up to now, we could not envision any modifications of the channel model that would predict the substrate dependencies of the alternating-access model. Also, we point out that our results are consistent with substrates being transported simultaneously, rather than sequentially, as concluded previously by Jauch and Läuger 1986 for a Na+–alanine cotransporter.
Effects of Other Extracellular Substrates on Outward GAT1 Current
We have tested whether extracellular GABA at concentrations up to 1 mM affects the outward current in the absence of extracellular Na+, and no clear effect was observed. For extracellular Cl−, we have detected only a small inhibition of outward current (∼20%) with 120 mM versus nominally Cl− free extracellular solution in the absence of extracellular Na+.
Outward GAT1 Transport Current: Voltage and Substrate Dependencies
To gain insight into how substrate interactions with GAT1 are affected by membrane potential, we first measured the I–V relations of outward GAT1 current over a wide concentration range for one substrate, while leaving the other substrates at fixed high (“saturating”) concentrations. A data set for each GAT1 substrate could then be replotted as a series of concentration–current relations at different membrane potentials, and the maximal current amplitude (I max) and half-maximum concentration (K 1/2) for that substrate could be obtained by fitting the concentration–current relations by a Hill equation:
 |
where I is the outward transport current magnitude, [S] is the substrate concentration, and n H is the Hill coefficient.
The corresponding substrate dependencies are shown in Fig. 8, whereby the GABAi, Na+ i, and Cl− i dependencies of GAT1 outward current at 0 mV are given in A–C, respectively. The corresponding voltage dependencies of I max, K 1/2, and n H, are shown in Fig. 8D–F, respectively. The Imax–V relations are fit by the Boltzmann equation given in materials and methods (Fig. 8, D–F, top, solid lines). In each case, the equivalent charge is close to 0.3. Only small changes of I–V shapes were detected with changes of substrate concentrations: I–V's become slightly less steep with low GABA concentrations and slightly steeper at very low [Na+]i.
The fitted n H and K 1/2 are both relatively voltage independent (Fig. 8, D–F). At membrane potentials between −30 and +90 mV, where measurements are most reliable, n Hs are 1.2–1.4 for Na+ i and 0.9–1.1 for Cl− i. n H for the GABA dependencies was always close to 1, and it was therefore fixed at 1 for this presentation. Over the same range of −30 to +90 mV, the K1/2s are 2.2–2.8 mM for GABAi, 53–83 mM for Na+ i, and12.1–13.6 mM for Cl− i. In the more negative potential range there is a trend for the K1/2's for Na+ i and Cl− i to increase.
Outward GAT1 Transport Current: Cytoplasmic Substrate Interactions
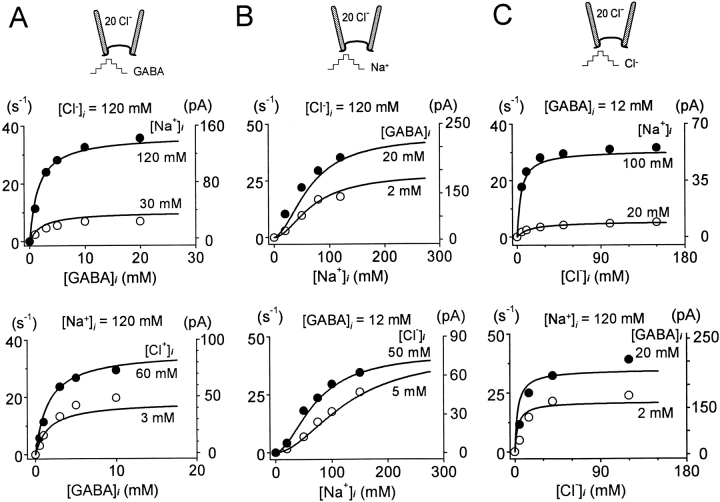
Fig. 9 describes how GAT1 substrates interact from the cytoplasmic side in the activation of outward transport current. Since the effects of voltage were minor in these interactions, we present only the data at 0 mV. Our protocol was to maintain a high concentration of one of the three substrates, and then systematically examine the effects of lowering one of the other two substrates on the concentration dependence of the third substrate. The transport current in all cases is defined by application and removal of cytoplasmic GABA with otherwise fixed substrate concentrations. In all results, the pipette solution contains 20 mM Cl−, no Na+, and no GABA. The solid lines presented with the data points in Fig. 9 represent fits by the functional model we developed for GAT1, which is detailed in another article (Hilgemann and Lu 1999).
Figure 9.
Cytoplasmic substrate dependencies of outward GAT1 transport current at 0 mV. (A) Cytoplasmic GABA dependence with 120 and 30 mM cytoplasmic Na+ (upper graph) and with 60 and 3 mM cytoplasmic Cl− (lower graph). (B) Cytoplasmic Na+ dependence with 20 and 2 mM cytoplasmic GABA (upper graph) and with 50 and 5 mM cytoplasmic Cl− (lower graph). (C) Cytoplasmic Cl− dependence with 100 and 20 cytoplasmic Na+ (upper graph) and with 20 and 2 mM cytoplasmic GABA (lower graph). Solid lines are predicted results from fitting an entire data base on GAT1 function by an alternating access model (Hilgemann and Lu 1999).
Fig. 9 A shows the cytoplasmic GABA dependencies of transport current. The data points were fit by the Hill equation with n H = 1 to obtain the corresponding Imax's and K 1/2's (not shown). When [Na+]i was lowered from 120 to 30 mM with 120 mM cytoplasmic Cl−, the Imax decreased from 155.3 to 30.7 pA, while the K 1/2 remained unchanged (2.2 and 2.1 mM, respectively, Fig. 9 A, top graph). Similar effects were obtained when reducing cytoplasmic Cl− with 120 mM cytoplasmic Na+ (bottom graph). The Imax is 98.4 pA and the K 1/2 is 2.0 mM at 60 mM Cl− i; at 3 mM Cl− i the Imax and K 1/2 values are 69.4 pA and 2.9 mM, respectively.
Fig. 9 B shows the cytoplasmic Na+ dependencies of the transport current. The top graph shows the effect of changing cytoplasmic GABA from 20 to 2 mM with 120 mM cytoplasmic Cl−: the n H obtained from fit by the Hill equation (not shown) increased from 1.2 to 2.1, the K 1/2 for Na+ i changed only slightly, and the Imax decreased by 40%. The bottom graph shows the effect of reducing Cl− i from 50 to 5 mM with 12 mM GABA: the K 1/2 for Na+ i increased by twofold (123 vs. 58 mM), while the n H and the Imax changed only slightly (80 vs. 73 pA).
Fig. 9 C shows the cytoplasmic Cl− dependencies of the transport current. These results were fit by the Hill equation with n H = 1 (not shown). The Imax is reduced from 59 pA at 100 mM Na+ i to 9.8 pA at 20 mM Na+ i, while the K 1/2 is increased from 4 to 12 mM. Reduction of [GABA]i also decreases the Imax for Cl− (239 pA at 20 mM GABAi vs. 155 pA at 2 mM GABAi), but the K 1/2 increases by only 25% at low [Na+]i (12 mM at 20 mM GABAi vs. 15 mM at 2 mM GABAi).
Only Cl− Can Interact with the Empty GAT1 Transporter from the Cytoplasmic Side
The substrate concentration dependencies presented in the previous section are predicted precisely by a binding scheme for GAT1 cytoplasmic substrates (Fig. 1), where two Na+ i and one Cl− i bind sequentially (Cl− i–Na+ i–Na+ i) and GABAi binding is independent of Cl− i and Na+ i. In this binding scheme, reduction of [Cl−]i will be overcome by high [Na+]i, and GABAi will not affect the apparent affinities of the other cosubstrate. Also, this binding order is mostly consistent with our capacitance data, which indicate that Cl− i interacts with the empty transport in the absence of other cosubstrates (Lu et al. 1995). However, there are three further predictions: (a) cytoplasmic GABA should inhibit the inward GAT1 current because it can bind from the cytoplasmic side in the absence of cosubstrates; (b) the apparent affinity for Cl− i binding, when measured as a capacitance change, should increase in the presence of high [Na+]i; and (c) inhibition of inward current by Cl− i should be enhanced by Na+ i, just as lowering [Na+]i decreases the maximal outward current activated by Cl− i (Fig. 9 C). These predictions were tested in the following experiments.
Scheme S1.
As described previously, inward transport current can be repeatedly activated in the patch using the pipette perfusion technique (Fig. 1). Fig. 10A and Fig. B, present I–V relations of the inward transport current defined by 0.2 mM extracellular GABA in the presence of 120 mM extracellular NaCl. The activation of inward transport current does not require any cytoplasmic ions, nor is inward current enhanced by cytoplasmic ions. As shown in Fig. 10 A, the presence of high cytoplasmic Na+ alone (120 mM) has a weak inhibitory effect, and GABA alone (20 mM) has almost no effect. A 25–50% inhibition of the inward current is achieved with the combined application of Na+ i and GABAi. In contrast, cytoplasmic Cl− strongly inhibits the inward transport current. The inhibition by Cl− is monotonic, and its concentration dependence at 0 mV is shown in Fig. 10 C. These data points are from additional measurements in the same patch, and the solid line represents a fit by the equation
 |
where I max is the current magnitude without Cl− i, and K 1/2 is the [Cl−]i at which inward current is reduced by 50%. Inward currents were defined by subtraction of records with and without extracellular GABA. In the presence of 120 mM cytoplasmic Cl−, >90% of the inward current is inhibited. The K 1/2 from the fit is 12.4 mM. We also examined the kinetics of inhibition by performing automated concentration jumps, and we resolved no slow components of inhibition that would not be explained by diffusion of Cl− i to and away from the patch (not shown).
Figure 10.
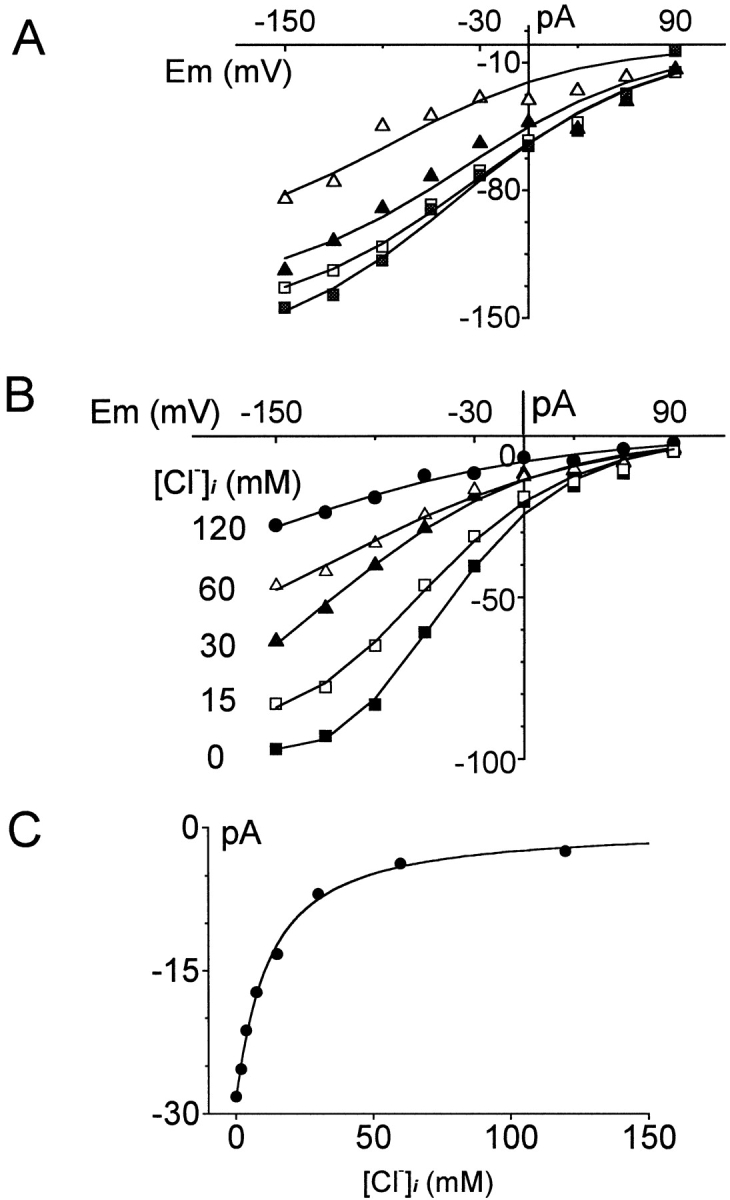
Effects of cytoplasmic substrates on I–V relations of the inward GAT1 current. Inward GAT1 current is defined as the current activated by 0.2 mM extracellular GABA via pipette perfusion. (A) I–V relations of the inward GAT1 current in the absence of cytoplasmic substrates (□), in the presence of 20 mM cytoplasmic GABA alone (▪), in the presence of 120 mM cytoplasmic Na+ alone (▴), and in the presence of 20 mM cytoplasmic GABA and 120 mM cytoplasmic Na+ (▵). (B) Effect of cytoplasmic Cl− on the I–V relation of the inward GAT1 current. (C) Inhibition of the inward GAT1 current by cytoplasmic Cl− at 0 mV. Half-inhibition occurs at 12.4 mM. See text for further details. The voltage protocol used in A and B was identical to that in Fig. 2. Data points represent the average of current magnitudes at the specified membrane potential during the cumulative voltage protocol.
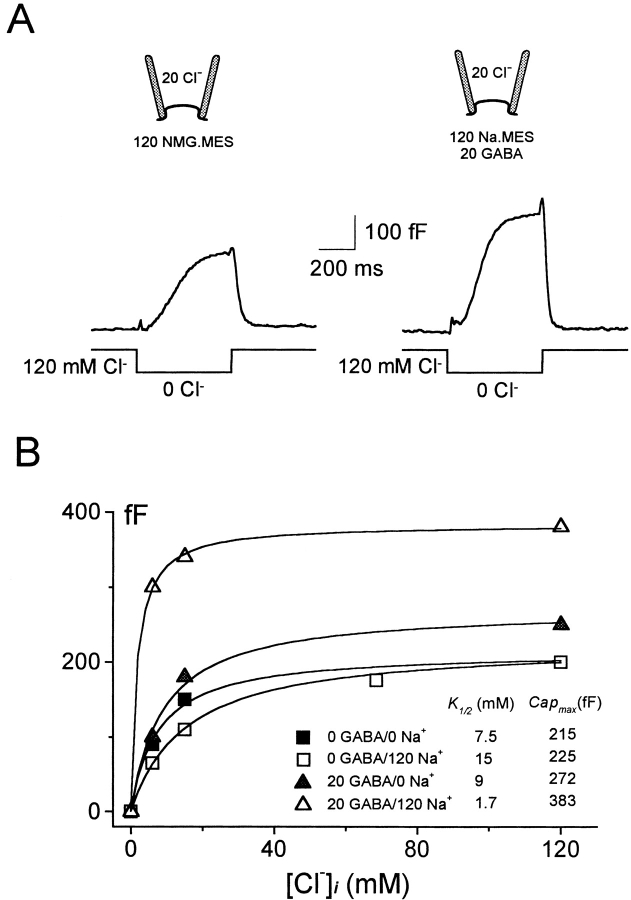
In Fig. 11, we have used the capacitance method to further analyze the interactions between GAT1 and its substrates. These results were obtained using 10 kHz/1 mV sinusoidal voltage perturbations. Fig. 11 A illustrates the membrane capacitance responses obtained when a patch is rapidly switched from high to 0 Cl− cytoplasmic solution. The magnitude of capacitance increase is larger when the cytoplasmic solution also contains GABA and Na+. Fig. 11 B shows the cytoplasmic Cl− dependence of the capacitance change under four conditions: with high GABAi and high Na+ i, with high GABAi only, with high Na+ i only, and with no GABAi or Na+ i. GABA and Na+ alone do not alter much the Cl− i-induced capacitance change. However, the simultaneous presence of cytoplasmic Na+ and GABA results in two changes in the capacitance signal. First, the Cl− i-induced capacitance change is larger at all concentrations. Second, there is a fourfold decrease of the half-maximal Cl− i concentration.
Figure 11.
GAT1 capacitance changes in response to rapid changes of the cytoplasmic Cl− concentration. (A) Membrane capacitance changes in response to removing cytoplasmic Cl− were measured in the absence (left) or presence (right) of both cytoplasmic GABA (20 mM) and cytoplasmic Na+ (120 mM). The Cl− i concentration is changed rapidly by an automated solution switcher. (C) Cytoplasmic Cl− concentration dependence of the membrane capacitance change. Solid lines represent fits by the Hill equation with a fixed slope factor (n H) of 1.
Together, the results described in Fig. 10 and Fig. 11 present definitive contradictions to the simple binding scheme for GAT1 cytoplasmic substrates discussed above. First, GABAi alone cannot inhibit the inward current (Fig. 10 A) or affect a change of capacitance (Fig. 11 B) in the absence of the other substrates. Second, Na+ i does not strongly increase the apparent affinity for Cl− i (Fig. 11 B, ▪ vs. □). An adequate account of this data therefore requires a systematic simulation effort to model GAT1 function, and this is presented in an accompanying article (Hilgemann and Lu 1999).
discussion
GAT1 Function Can Be Simple
This study has demonstrated that GAT1-mediated transport currents behave largely as expected for a simple alternating-access cotransporter in the steady state. The Hill slopes of the substrate concentration dependencies and the measured reversal potentials are all consistent with the usual postulated stoichiometry of 1GABA:2Na+:1Cl− for GAT1. Admittedly, the reversal potential measurements show considerable scatter. However, the reverse GAT1 current absolutely requires the presence of GABA and both co-ions. Neither the reverse nor the forward current requires the presence of any trans ions, nor have we observed any trans-stimulation effects of substrates. Our conclusion, that GAT1 can function as a simple transporter with fixed stoichiometry, is similar to that of Jauch et al. 1986 for a Na+–alanine cotransporter that could be studied in pancreatic acinar cells with pipette perfusion.
Our results are strikingly different from those of Cammack et al. 1994, who employed whole-cell voltage clamp to study GAT1 transiently expressed in HEK293 cells. In their study, “ex-gated” (i.e., GABAo dependent) and “in-gated” (GABAi dependent) currents were differentiated; both required the presence of monovalent cations and/or anions on the trans-membrane side. In addition, the authors reported that GAT1 has modes of action that contradict the expectations for a tightly coupled “conventional transporter:” “leak” currents were observed in the absence of GABA, suggesting that real ion channels are formed by a small fraction of the expressed GAT1 transporters (Cammack and Schwartz 1996). These differences to our results might be due to different GAT1 functions in different expression systems (Xenopus versus mammalian). Although our experience is limited, we have observed evidence for such expression system-dependent differences: in excised giant patches from HEK293 cells, transiently expressing GAT1, we found that the I–V of reverse GAT1 current was nearly voltage independent (data not presented).
Relations to Previous Oocyte Studies
Two-electrode voltage clamp studies with Xenopus oocytes have previously provided much mechanistic insight into the forward transport mode, which mediates GABA uptake (Mager et al. 1993, Mager et al. 1996), and our studies now provide complementary data on the transporter's reverse mode. We can therefore outline several clear differences between the two modes of operation. (a) Although in the forward transport cycle Na+ seems to bind to the empty transporter before Cl− and GABA at the extracellular side, in the reverse cycle the interaction of Cl− i with the transporter appears to be the first step. This is supported by the fact that only Cl− i was able to decrease capacitance of the empty carrier in a concentration-dependent manner (Lu et al. 1995) and that only Cl− i strongly inhibits the forward transport current (Fig. 11). (b) In the forward cycle, the rate-limiting step at 0 mV is a strongly voltage-dependent reaction; a voltage-independent step becomes rate limiting at large negative potentials. In contrast, the rate-limiting step of the reverse cycle is weakly voltage dependent, and it remains rate limiting under virtually all conditions; this explains the relative lack of shape changes of I–V relations. (c) The transporter has extremely asymmetrical affinities for extracellular and cytoplasmic GABA. The apparent affinity for extracellular GABA is more than two orders of magnitude higher than that for cytoplasmic GABA. The concentrations of GABAo that half-maximally activate inward GAT1 current range from ∼6 μM at −20 mV to ∼20 μM at −140 mV when extracellular Na+ and Cl− are not limiting (Mager et al. 1993). Under comparable conditions, K 1/2s for cytoplasmic GABA are in the millimolar range (Fig. 8 D). (d) The apparent affinities for extracellular GABA and Na+ depend on membrane voltage, being higher at more negative potentials. In contrast, the apparent affinities for cytoplasmic GABA, Na+, and Cl− do not vary much with membrane potential (Fig. 8, D–F), which is expected if the reverse cycle is always rate limited by a weakly voltage-dependent step.
Alternating Access versus Channel-like Models of GAT1 Function
The idea that cotransporters might operate in a channel-like fashion, without conformational changes, presupposes that a pore structure could allow hydrophilic molecules as large as GABA to bind specifically and permeate, while disallowing a nonspecific permeation of ions. We know of no clear evidence that this is physically possible, and we have presented two types of results for GAT1 that contradict the channel model (Fig. 7). First, addition of extracellular Na+ increases the apparent affinity for cytoplasmic GABA in parallel with a reduction of the maximum reverse GAT1 current. Second, reduction of cytoplasmic Cl− decreases the apparent affinity for GABAi in the presence of extracellular Na+, but not in its absence. In addition, the Cl− i-activated GAT1 capacitance changes become larger and saturate at lower Cl− i concentrations in the presence of both cosubstrates (Fig. 11). This indicates that the binding of all three substrates enables further transporter reactions, presumably conformational changes. A final well-known property of alternating access models is that the presence of a substrate on one membrane side can stimulate transport of that substrate from the opposite side. This “self-exchange” of substrates is not predicted by the channel model, but it has been well documented for the GABA transporter (Kanner et al. 1983).
Complex Cytoplasmic Substrate Interactions
The interactions of cytoplasmic substrates in the activation of the reverse current are not straightforward. As noted above, it is evident that Cl− i can bind in the absence of the other substrates. Furthermore, reduction of Cl− i shifts the Na+ i dependence of current to somewhat higher Na+ i concentrations, as expected if Na+ i binds after Cl− i. However, reduction of [Cl− i] does not shift the dependence of current on GABA, indicating that GABAi probably binds independently from Cl− i. It is then perplexing that GABAi cannot inhibit the inward current. Furthermore, Na+ i–GABAi interactions are also suggestive of independent binding sites; maximal currents are decreased when either cosubstrate concentration is reduced. That these complexities can be accounted for in the context of a simple transport model (Hilgemann and Lu 1999) was highlighted in this article by including simulations of our tentative GAT1 model with the experimental data (Fig. 9).
Physiological Relevance of Cl− i Block
Our observation that cytoplasmic Cl− inhibits potently GAT1 forward transport current raises multiple interesting points. First, since the physiological Cl− concentration inside the oocyte is probably 40–50 mM (Jaffe et al. 1985), more than threefold higher than our measured half-maximal inhibition (Fig. 10 C). The inhibitory effect of Cl− i may partially explain why the GAT1 turnover rate appears to be several times higher in our patches, where [Cl−]i is nominally zero, than estimated from whole cell experiments (Mager et al. 1993, Mager et al. 1996). In an accompanying paper (Lu and Hilgemann 1999), we provide evidence that cytoplasmic Cl− can indeed retard a slow charge moving reaction of the transport cycle. Second, it can be speculated that cytoplasmic Cl− changes might provide a mechanism for shaping GABA responses in neurons. For example, significant Cl− transients inside presynaptic GABA-anergic neurons may occur during and after inhibitory post-synaptic potential responses, thereby inhibiting and “deinhibiting” GABA transport. Moreover, it has been suggested that the cytoplasmic Cl− concentration is regulated in individual hippocampal neurons (Misgeld et al. 1986).
Acknowledgments
We express our deep gratitude to Sela Mager for numerous discussions, encouragement, and advice throughout this work. We thank Ernest M. Wright, Lou J. DeFelice, and Baruch I. Kanner for insightful discussions. We thank Ernest M. Wright especially for an open exchange of unpublished data. We thank Sela Mager, Henry Lester, and Eric Schwartz for providing GAT1 constructs. We thank SiYi Feng for expert molecular biological assistance.
This work was supported by a Grant-in-Aid from the American Heart Association.
Footnotes
1used in this paper: GABA, γ-aminobutyric acid; I–V, current–voltage; MES, 2-(N-morpholino)ethanesulfonic acid; NMG, N-methylglucamine
References
- Amara S.G., Arriza J.L. Neurotransmitter transportersthree distinct gene families. Curr. Opin. Neurobiol. 1993;3:337–344. doi: 10.1016/0959-4388(93)90126-j. [DOI] [PubMed] [Google Scholar]
- Bechkman M.L., Quick M.W. Probing neurotransmitter transporter function by two-electrode voltage clamp. AxoBits. 1998;22:8–10. [Google Scholar]
- Cammack J.N., Rakhilin S.V., Schwartz E.A. A GABA transporter operates asymmetrically and with variable stoichiometry. Neuron. 1994;13:949–960. doi: 10.1016/0896-6273(94)90260-7. [DOI] [PubMed] [Google Scholar]
- Cammack J.N., Schwartz E.A. Channel behavior in a gamma-aminobutyrate transporter. Proc. Natl. Acad. Sci. USA. 1996;93:723–727. doi: 10.1073/pnas.93.2.723. [DOI] [PMC free article] [PubMed] [Google Scholar]
- DeFelice L.J., Blakely R.D. Pore models for transporters? Biophys. J. 1996;70:579–580. doi: 10.1016/S0006-3495(96)79604-2. [DOI] [PMC free article] [PubMed] [Google Scholar]
- Fairman W.A., Vandenberg R.J., Arriza J.L., Kavanaugh M.P., Amara S.G. An excitatory amino-acid transporter with properties of a ligand-gated chloride channel. Nature. 1995;375:599–603. doi: 10.1038/375599a0. [DOI] [PubMed] [Google Scholar]
- Galli A., Blakely R.D., DeFelice L.J. Norepinephrine transporters have channel modes of conduction. Proc. Natl. Acad. Sci. USA. 1996;93:8671–8676. doi: 10.1073/pnas.93.16.8671. [DOI] [PMC free article] [PubMed] [Google Scholar]
- Guastella J., Nelson N., Nelson H., Czyzyk L., Keynan S., Miedel M.C., Davidson N., Lester H.A., Kanner B.I. Cloning and expression of a rat brain GABA transporter. Science. 1990;249:1303–1306. doi: 10.1126/science.1975955. [DOI] [PubMed] [Google Scholar]
- He Z., Tong Q., Quednau B.D., Philipson K.D., Hilgemann D.W. Cloning, expression, and characterization of the squid Na+–Ca2+ exchanger (NCX-SQ1) J. Gen. Physiol. 1998;111:857–873. doi: 10.1085/jgp.111.6.857. [DOI] [PMC free article] [PubMed] [Google Scholar]
- Hilgemann D.W. Giant excised cardiac sarcolemmal membrane patchessodium and sodium–calcium exchange currents. Pflügers Arch. 1989;415:247–249. doi: 10.1007/BF00370601. [DOI] [PubMed] [Google Scholar]
- Hilgemann D.W. Regulation and deregulation of cardiac Na+–Ca2+ exchange in giant excised sarcolemmal membrane patches. Nature. 1990;344:242–245. doi: 10.1038/344242a0. [DOI] [PubMed] [Google Scholar]
- Hilgemann D.W. The giant membrane patch. In: Sakmann B., Neher E., editors. In Single-Channel Recording. Plenum Publishing Corp; New York, NY: 1995. pp. 307–327. [Google Scholar]
- Hilgemann D.W., Lu C. giant membrane patchesimprovements and applications. Methods Enzymol. 1998;293:267–280. doi: 10.1016/s0076-6879(98)93018-x. [DOI] [PubMed] [Google Scholar]
- Hilgemann D.W., Lu C. GAT1 (GABA:Na+:Cl−) cotransport functiondatabase reconstruction with an alternating access model. J. Gen. Physiol. 1999;114:459–475. doi: 10.1085/jgp.114.3.459. [DOI] [PMC free article] [PubMed] [Google Scholar]
- Hille B. Ionic Channels of Excitable Membranes 2nd ed 1992. Sinauer Associates, Inc; Sunderland, MA: pp. 291–314 [Google Scholar]
- Jaffe L.A., Kado R.T., Muncy L. Propagating potassium and chloride conductances during activation and fertilization of the egg of the frog, Rana pipiens. J. Physiol. 1985;368:227–242. doi: 10.1113/jphysiol.1985.sp015855. [DOI] [PMC free article] [PubMed] [Google Scholar]
- Jardetzky O. Simple allosteric model for membrane pumps. Nature. 1966;211:969–970. doi: 10.1038/211969a0. [DOI] [PubMed] [Google Scholar]
- Jauch P., Petersen O.H., Läuger P. Electrogenic properties of the sodium-alanine cotransporter in pancreatic acinar cellsI. Tight-seal whole-cell recordings. J. Membr. Biol. 1986;94:99–115. doi: 10.1007/BF01871191. [DOI] [PubMed] [Google Scholar]
- Jauch P., Läuger P. Electrogenic properties of the sodium-alanine cotransporter in pancreatic acinar cellsII. Comparison with transport models. J. Membr. Biol. 1986;94:117–127. doi: 10.1007/BF01871192. [DOI] [PubMed] [Google Scholar]
- Kanner B.I., Bendahan A., Radian R. Efflux and exchange of γ-aminobutyric acid and nipecotic acid catalysed by synaptic plasma membrane vesicles isolated from immature rat brain. Biochim. Biophys. Acta. 1983;731:54–62. doi: 10.1016/0005-2736(83)90397-8. [DOI] [PubMed] [Google Scholar]
- Kanner B.I., Schuldiner S. Mechanism of transport and storage of neurotransmitters. CRC Crit. Rev. Biochem. 1987;22:1–38. doi: 10.3109/10409238709082546. [DOI] [PubMed] [Google Scholar]
- Kavanaugh M.P., Arriza J.L., North R.A., Amara S.G. Electrogenic uptake of gamma-aminobutyric acid by a cloned transporter expressed in Xenopus oocytes. J. Biol. Chem. 1992;267:22007–22009. [PubMed] [Google Scholar]
- Keynan S., Kanner B.I. gamma-Aminobutyric acid transport in reconstituted preparations from rat braincoupled sodium and chloride fluxes. Biochemistry. 1988;27:12–17. doi: 10.1021/bi00401a003. [DOI] [PubMed] [Google Scholar]
- Läuger P. Electrogenic Ion Pumps 1991. Sinauer Associates, Inc; Sunderland, MA: pp. 28–29 [Google Scholar]
- Lester H.A., Mager S., Quick M.W., Corey J.L. Permeation properties of neurotransmitter transporters. Annu. Rev. Pharmacol. Toxicol. 1994;34:219–249. doi: 10.1146/annurev.pa.34.040194.001251. [DOI] [PubMed] [Google Scholar]
- Loo D.D., Zeuthen T., Chandy G., Wright E.M. Cotransport of water by the Na+/glucose cotransporter. Proc. Natl. Acad. Sci. USA. 1996;93:13367–13370. doi: 10.1073/pnas.93.23.13367. [DOI] [PMC free article] [PubMed] [Google Scholar]
- Lu C.C., Kabakov A., Markin V.S., Mager S., Frazier G.A., Hilgemann D.W. Membrane transport mechanisms probed by capacitance measurements with megahertz voltage clamp. Proc. Natl. Acad. Sci. USA. 1995;92:11220–11224. doi: 10.1073/pnas.92.24.11220. [DOI] [PMC free article] [PubMed] [Google Scholar]
- Lu C.C., Hilgemann D.W. GAT1 (GABA:Na+:Cl−) Cotransport functionkinetic studies in giant Xenopus oocyte membrane patches. J. Gen. Physiol. 1999;114:445–457. doi: 10.1085/jgp.114.3.445. [DOI] [PMC free article] [PubMed] [Google Scholar]
- Mager S., Cao Y., Lester H.A. Measurement of transient currents from neurotransmitter transporters expressed in Xenopus oocytes. Methods Enzymol. 1998;296:551–566. doi: 10.1016/s0076-6879(98)96039-6. [DOI] [PubMed] [Google Scholar]
- Mager S., Kleinberger-Doron N., Keshet G.I., Davidson N., Kanner B.I., Lester H.A. Ion binding and permeation at the GABA transporter GAT1. J. Neurosci. 1996;16:5405–5414. doi: 10.1523/JNEUROSCI.16-17-05405.1996. [DOI] [PMC free article] [PubMed] [Google Scholar]
- Mager S., Naeve J., Quick M., Labarca C., Davidson N., Lester H.A. Steady states, charge movements, and rates for a cloned GABA transporter expressed in Xenopus oocytes. Neuron. 1993;10:177–188. doi: 10.1016/0896-6273(93)90309-f. [DOI] [PubMed] [Google Scholar]
- Matsuoka S., Hilgemann D.W. Inactivation of outward Na+–Ca2+ exchange current in guinea-pig ventricular myocytes. J. Physiol. 1994;476:443–458. doi: 10.1113/jphysiol.1994.sp020146. [DOI] [PMC free article] [PubMed] [Google Scholar]
- Meyer J.S., Shearman L.P., Collins L.M. Monoamine transporters and the neurobehavioral teratology of cocaine. Pharmacol. Biochem. Behav. 1996;55:585–593. doi: 10.1016/s0091-3057(96)00280-8. [DOI] [PubMed] [Google Scholar]
- Misgeld U., Deisz R.A., Dodt H.U., Lux H.D. The role of chloride transport in postsynaptic inhibition of hippocampal neurons. Science. 1986;232:1413–1415. doi: 10.1126/science.2424084. [DOI] [PubMed] [Google Scholar]
- Ni Y.G., Miledi R. Blockage of 5HT2C serotonin receptors by fluoxetine (Prozac) Proc. Natl. Acad. Sci. USA. 1997;94:2036–2040. doi: 10.1073/pnas.94.5.2036. [DOI] [PMC free article] [PubMed] [Google Scholar]
- Radian R., Kanner B.I. Stoichiometry of sodium- and chloride-coupled gamma-aminobutyric acid transport by synaptic plasma membrane vesicles isolated from rat brain. Biochemistry. 1983;22:1236–1241. doi: 10.1021/bi00274a038. [DOI] [PubMed] [Google Scholar]
- Risso S., DeFelice L.J., Blakely R.D. Sodium-dependent GABA-induced currents in GAT1-transfected HeLa cells. J. Physiol. 1996;490:691–702. doi: 10.1113/jphysiol.1996.sp021178. [DOI] [PMC free article] [PubMed] [Google Scholar]
- Sonders M.S., Amara S.G. Channels in transporters. Curr. Opin. Neurobiol. 1996;6:294–302. doi: 10.1016/s0959-4388(96)80111-5. [DOI] [PubMed] [Google Scholar]
- Su A., Mager S., Mayo S.L., Lester H.A. A multi-substate single-file model for ion-coupled transporters. Biophys. J. 1996;70:762–777. doi: 10.1016/S0006-3495(96)79616-9. [DOI] [PMC free article] [PubMed] [Google Scholar]
- Wong D.T., Bymaster F.P., Engleman E.A. Prozac (fluoxetine, Lilly 110140), the first selective serotonin uptake inhibitor and an antidepressant drugtwenty years since its first publication. Life Sci. 1995;57:411–441. doi: 10.1016/0024-3205(95)00209-o. [DOI] [PubMed] [Google Scholar]
- Zühlke R.D., Zhang H.-J., Joho R.H. Xenopus oocytesa system for expression cloning and structure–function studies of ion channels and receptors. Methods Neurosci. 1995;25:67–89. [Google Scholar]


