Abstract
We have developed an alternating access transport model that accounts well for GAT1 (GABA:Na+:Cl−) cotransport function in Xenopus oocyte membranes. To do so, many alternative models were fitted to a database on GAT1 function, and discrepancies were analyzed. The model assumes that GAT1 exists predominantly in two states, E in and E out. In the E in state, one chloride and two sodium ions can bind sequentially from the cytoplasmic side. In the E out state, one sodium ion is occluded within the transporter, and one chloride, one sodium, and one γ-aminobutyric acid (GABA) molecule can bind from the extracellular side. When E in sites are empty, a transition to the E out state opens binding sites to the outside and occludes one extracellular sodium ion. This conformational change is the major electrogenic GAT1 reaction, and it rate-limits forward transport (i.e., GABA uptake) at 0 mV. From the E out state, one GABA can be translocated with one sodium ion to the cytoplasmic side, thereby forming the *E in state. Thereafter, an extracellular chloride ion can be translocated and the occluded sodium ion released to the cytoplasm, which returns the transporter to the E in state. GABA–GABA exchange can occur in the absence of extracellular chloride, but a chloride ion must be transported to complete a forward transport cycle. In the reverse transport cycle, one cytoplasmic chloride ion binds first to the E in state, followed by two sodium ions. One chloride ion and one sodium ion are occluded together, and thereafter the second sodium ion and GABA are occluded and translocated. The weak voltage dependence of these reactions determines the slopes of outward current–voltage relations. Experimental results that are simulated accurately include (a) all current–voltage relations, (b) all substrate dependencies described to date, (c) cis–cis and cis–trans substrate interactions, (d) charge movements in the absence of transport current, (e) dependencies of charge movement kinetics on substrate concentrations, (f) pre–steady state current transients in the presence of substrates, (g) substrate-induced capacitance changes, (h) GABA–GABA exchange, and (i) the existence of inward transport current and GABA–GABA exchange in the nominal absence of extracellular chloride.
Keywords: electrogenic, Markov, neurotransmitter transporter, reaction kinetics, transport model
introduction
Recent success in determining the structures of several membrane transporters (Deisenhofer et al. 1995; Xia et al. 1997; Uhlin et al. 1997; Zhang et al. 1998) and ion channels (Doyle et al. 1998) has opened the way to a greatly improved understanding of membrane transport. Still, the answers to many questions about membrane transport, including structure–function issues, require improved functional studies. Our electrophysiological studies of the GAT1 cotransporter (Lu et al. 1995; Lu and Hilgemann 1999a,Lu and Hilgemann 1999b) provide the first extensive data set on the cytoplasmic substrate dependencies of a neurotransmitter transporter. Also, we have obtained new information about the voltage dependencies and kinetics of GAT1 function, as well as cis–trans and cis–cis substrate interactions. This data, together with data from previous GAT1 studies, provides one of the most extensive data sets available for the function of any transporter. Thus, we can now construct models of cotransport function and test them in relation to the data set. Starting from the general principles and transport models outlined by Läuger 1987, we have tried to formulate the simplest model that can account well for the available data. In addition to providing a framework for the molecular analysis of GAT1 function, the model may be useful to describe GAT1 function in higher-level simulations of synapse function. In this article, we describe the rationale for our model assumptions, the range of experimental observations that are accounted for, and limitations of the model in accounting for the available data on GAT1 function.
The Proposed Alternating Access Model
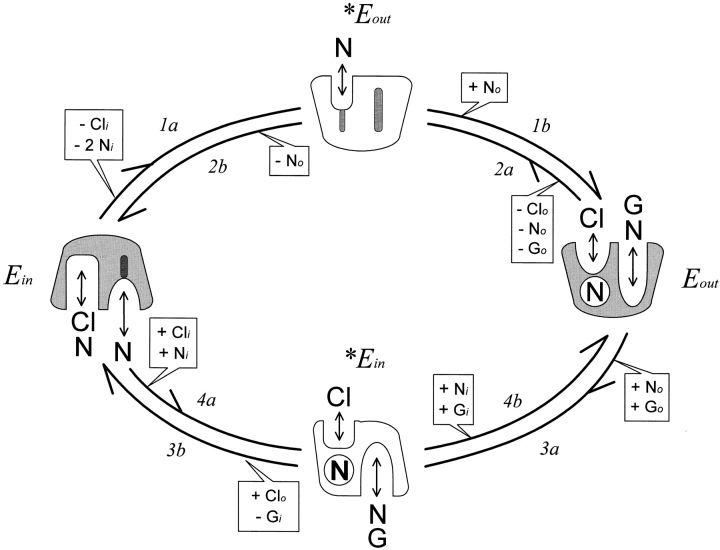
A cartoon of our model is shown in Fig. 1. Transporters exist primarily in two states, designated E in and E out, and the transitions between them (reactions 1–4) take place through transitional states, designated *E out and *E in. Within each state, substrate binding is assumed to be at equilibrium. In the E in state, binding sites are open to the cytoplasmic side, and they bind sequentially one Cl− (K d, 3.7 mM) and two Na+ (K ds, 442 and 11.5 mM). When the E in binding sites are empty, a low affinity Na+ binding site (K d, 0.92 M) can open to the extracellular side (1a; 200 s−1), thereby forming the *E out state that cannot bind any substrate from the cytoplasmic side. When a Na+ is bound to the *E out state, it can be occluded into the transporter (1b), thereby forming the stable E out state. This overall reaction (1; i.e., 1a + 1b) moves +1.1 equivalent charges through the membrane field from outside to inside. In the E out state, one Cl− (K d, 8.2 mM) and one Na+ (K d, 10.1 mM) together with 1 γ-aminobutyric acid (GABA)1 (K d, 41 μM) can be bound from the extracellular side. The backward transition to the E in state (2; i.e., 2a + 2b; 2,000 s−1), which releases one Na+ to the outside, occurs only when the E out binding sites are empty.
Figure 1.
GAT1 cotransport model. The transporter cartoons are all oriented with the extracellular side facing upward. Substrate dependencies of each reaction are indicated in a box. (−) A reaction can occur only when the given substrate is not bound; (+) a reaction can occur only when the given substrate is bound. The model assumes the existence of two stable GAT1 states (E in and E out) and two transitional GAT1 states (*E in and *E out). In the E in state, one Cl− (Cl) and two Na+ (N) can bind sequentially from the cytoplasmic side. When E in binding sites are empty, a Na+ binding site can open to the extracellular side to form the *E out state. One extracellular Na+ ion can be bound in the *E out state and occluded into the transporter, thereby forming the E out state. The E out state can bind sequentially one Na+, one Cl−, and one GABA (G). When the E out binding sites are fully occupied, a transition to the *E in state can occur in which GABA and one Na+ can dissociate to the cytoplasmic side. Further opening of binding sites returns transporters to the E in state. Conformational changes of the transitional states (1b, 2b, 3b, and 4b) are assumed to take place at infinite rates. See text for further details.
When the E out binding sites for Na+ and GABA are occupied, these two substrates can be translocated to the cytoplasmic side (Fig. 1, Fig. 3a; 40 s−1), regardless of whether extracellular Cl− is bound, thereby forming the transitional state, *E in. The GABA translocation reaction (3a) has a slight voltage dependence that opposes the overall forward transport process at negative potentials (−0.07 equivalent charges). In the transitional *E in state, GABA and Na+ can dissociate to the cytoplasmic side. For the transition to the stable E in state (3b), an extracellular Cl− must be bound, and GABA must have dissociated to the cytoplasmic side. The bound extracellular Cl− is then translocated simultaneously with the release of the occluded Na+ ion to the cytoplasmic side. The reverse reaction (4) to the E out state at first translocates one cytoplasmic Cl− and occludes one cytoplasmic Na+ (4a; 42 s−1); thereafter, one cytoplasmic Na+ and GABA are translocated (4b). The occlusion of Cl− and Na+ (i.e., 4a) has a weak voltage dependence (+0.17 equivalent charges) that promotes the reverse transport cycle at positive potentials. In the E in state, charged residues of the binding sites can flex somewhat in the membrane field (−0.18 equivalent charges), which imparts weak voltage dependence on cytoplasmic Cl− binding.
Figure 3.
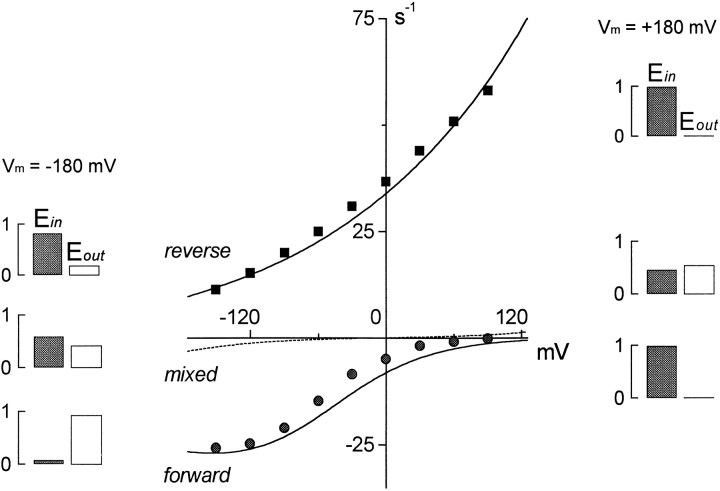
Current–voltage relations of the fully activated GAT cotransport currents. Here, and in subsequent figures, the steady state transport rate is plotted on the y axis. The data points are scaled membrane current values from experiments described previously (Lu and Hilgemann 1999a,Lu and Hilgemann 1999b). Solid curves are model predictions. The reverse (outward) current–voltage relation (▪) is with 120 mM cytoplasmic NaCl, 20 mM cytoplasmic GABA, and 20 mM extracellular Cl−. The forward (inward) current–voltage relation (•) is with 120 mM extracellular NaCl, 0.2 mM extracellular GABA, and no cytoplasmic substrates. The mixed current–voltage relation (dashed line) is with 120 mM NaCl on both membrane sides, 2 mM cytoplasmic GABA, and 0.2 mM extracellular GABA.
The Modeling Process
The model just described is the simplest Markovian transport model we have found to account for all significant features of GAT1 transport function in Xenopus oocyte membrane. To develop the model, we first constructed a database of all steady state and kinetic data that we judged to be reliable. Then, with the perspectives of the previous articles (Lu and Hilgemann 1999a,Lu and Hilgemann 1999b), we attempted to recreate the database, qualitatively and quantitatively, with various substrate binding schemes and assumptions about conformational changes. Most models were based on the alternating access principle, as it is independently supported by our data. Also, we assumed in most models that cytoplasmic Cl− binding and extracellular Na+ binding are mutually exclusive (Lu and Hilgemann 1999b). In a typical model-building cycle, a simple two- or three-state model was expanded to a model with many states to achieve an improved explanatory range. Then, it was probed how states could be merged without losing the improvement.
For brevity, we omit discussion of “dilemmas” encountered during model development. Examples pointed out previously (Lu and Hilgemann 1999a,Lu and Hilgemann 1999b) include the substrate binding scheme for the cytoplasmic side and the different kinetic behaviors of inward and outward current during voltage steps. To account for GAT1 kinetics, we find it essential to assume that only one Na+ ion is occluded by the transporter during the E in → E out transition (Fig. 1, Fig. 1; Mager et al. 1998). Since the deocclusion reaction is blocked by binding of the second Na+ ion from the extracellular side, reduction of [Na+]o from 100 to a few millimolar causes a >100-fold acceleration of the electrogenic deocclusion reaction (Mager et al. 1996). Another key observation is that GABA transport remains possible in the nominal absence of Cl− i (Kanner et al. 1983; Mager et al. 1998; Lu and Hilgemann 1999a; Loo, D.D.F., S. Eskandari, and E.M. Wright, personal communication). Without violating a fixed transport stoichiometry, this will be explained by our assumption that one Na+ and GABA are first translocated from outside to inside without cotransport of Cl−; then Cl− transport takes place in a second step from a transitional state.
materials and methods
Model-Fitting and Integration Method
Our fitting method was described previously (Matsuoka and Hilgemann 1992). In brief, we used a generalized Newton method for solving simultaneous nonlinear equations (Greenspan 1974) to minimize the squared deviations of predicted (model) results from experimental results. The model parameters are improved one-at-a-time in a random order during each fitting cycle. In addition to the model-specific parameters, one scaling variable is fitted for each experiment. Individual experiments can be weighted such that deviations of model results from data points are roughly similar for the entire database. Although our model contains only the minimum parameters needed to simulate GAT1 cotransport, we often identified multiple least-squares minima with different initial estimates for the parameters. Since variation of certain rate constants and substrate affinities had nearly identical results on model function, we fixed two of the rate constants in the model fit described here.
The model to be presented is a “pseudo–two-state model” because it has only two stable states. Other models that we explored included many different substrate binding schemes and the kinetic simulation of substrate binding reactions. Also, we carefully tested our treatment of transitional states by developing models in which the transitional states were simulated as stable states with rapid exit transitions. Results with the complex and simplified models were identical for the purposes of this article.
For kinetic simulations of two- and three-state models, we used analytical solutions to integrate state transitions over time. For the more complex models, we usually used a stable implicit method to integrate the differential equations (dy i/dt) for the individual states (y1…n) over time with the integration interval, h:
 |
where y ih is the state value at the forward time point, y i0 is the state value at the backward time point, and ∑k is the sum of rate constants leading into and away from the given state. The simulation programs were written in Pascal and C++ and compiled with Borland TurboPascal and Borland C++ Builder, respectively (Inprise).
Variability of Experimental Results
Variability in results from different groups of experiments and experimental methods is an important problem in our simulations. The two major cases are the cytoplasmic Cl− dependence of reverse GAT1 current and the voltage dependence of charge movements. Half-maximal Cl− i concentrations vary by a factor of about four, and the midpoint voltage of charge movements varies by at least 25 mV in experiments with different oocyte batches. A similar variability of charge movements was observed in whole-oocyte recordings (Dr. Sela Mager, personal communication). To demonstrate the kinetic behavior predicted by our model, we have simulated one experiment (see Fig. 10) with 70 mM extracellular NaCl, rather than the 40 mM used in the experiment.
Figure 10.
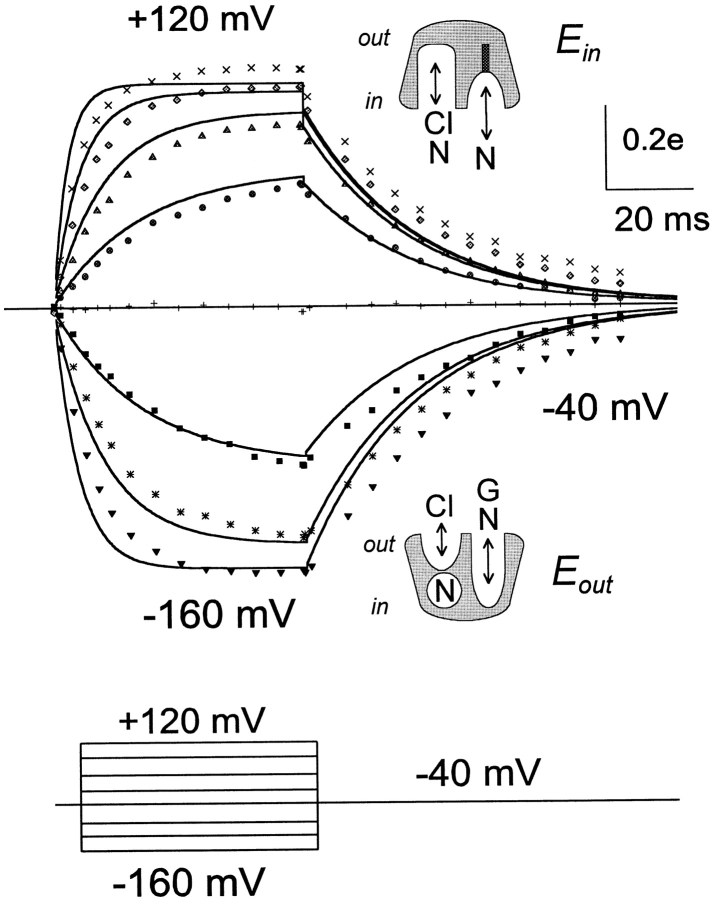
Simulated and measured GAT1 charge movements. The simulation is calibrated as elementary charges (e) moved through membrane field per single transporter. The experimental results are with 40 mM extracellular NaCl; the simulation is with 80 mM extracellular NaCl. As indicated by the cartoons, binding sites are expected to be open to the cytoplasmic side at positive potentials and to the extracellular side at negative potentials. See text for more explanations.
Model Assumptions
We describe here the rationale for two implicit model assumptions. For some simulations, we carried out a kinetic simulation of all substrate reactions, similar to a cotransport model proposed by Sanders et al. 1984. However, we assume instantaneous binding of all substrates in this simulation. It seems reasonable to assume that ion binding reactions with millimolar (or lower) affinities can take place in less than a microsecond and therefore will not influence the much slower reactions simulated here. The assumption of fast GABA binding is less reliable, and we thoroughly tested how kinetic simulation of GABA binding affects our model results. Our conclusion is that the potential influence is rather small, except for low [GABA]o, where GABA binding may limit inward GABA transport, especially at negative membrane potentials.
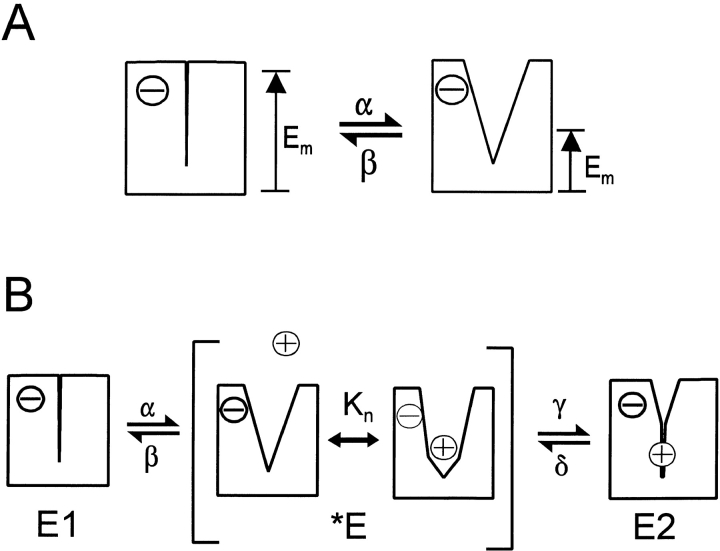
The second assumption is related to the application of Eyring rate models (Eyring 1936; Eyring et al. 1949) to transporter function. We find it important to assume that the energy barrier in a charge-moving reaction can be located highly asymmetrically in the electrical field, such that a strong “partitioning” of the voltage dependence on forward or backward reaction rates can occur. To underscore this idea for transporters, we illustrate a simple transport reaction in Fig. 2 A. We assume that the transporter can exist in two stable states, one with open and one with closed binding sites. Transitions between these states will result in rearrangements of the membrane electrical field profile, whereby electrical current is generated when field moves across a charged residue. In this example, a negative binding site charge is assumed to reside within membrane field when binding sites are closed, and the opening reaction (α) moves the electrical field across the site. No “driving force” for binding site closure (β) is provided by the electrical field because the charge is outside of the field when the site is open. Thus, the reaction will be voltage dependent only in the opening direction, although the amount of charge that moves through electrical field is the same in both directions. A still more extreme asymmetry, which we allow in simulations, is that the valences of forward and reverse reactions can be of opposite sign. This is justified if the overall reaction simulated is thought of as two reactions through a transitional state; the different valences then correspond to two different reactions that can be simulated separately with identical results.
Figure 2.
Hypothetical mechanisms of GAT1 electrogenicity. (A) Binding site opening reaction of an empty transporter. It is assumed that opening of the binding site changes the membrane potential profile across the transporter, such that the membrane electrical field moves across the charged binding site. The charge of the binding site, while open, remains outside the electrical field. Therefore, the binding site opening rate (α) will be more strongly voltage dependent than the closure rate (β). (B) Hypothetical mechanism of electrogenicity during Na+ o occlusion by the GAT1 transporter. In the E 1 state, binding sites are closed to the extracellular side. When they open, one Na+ can bind in the *E state, and the transporter binding sites close to the E 2 state with an occluded Na+. In the opening reaction, the membrane field moves partially across the negatively charged binding site, and in the closing reaction, the membrane field moves in the opposite direction across the bound Na+. See text for further explanations.
We illustrate our simulation of electrogenic reactions for the case shown in Fig. 2, assuming that one equivalent charge is moved. The opening rate coefficient (k α) is multiplied by e qα·Em27 mV,where “qα” is the charge coefficient and RT/F is approximated as 27 mV. The closure rate coefficient is multiplied bye qβ·Em27 mV,where q β = 0. Total charge moved in the reaction (i.e., one elementary charge) is the sum of the forward and reverse reaction coefficients (q α + q β).
A major charge-moving reaction of Na+,glucose transporters can be simulated as a very slow, electrogenic Na+ binding reaction (Parent et al. 1992), and our database for GAT1 allows a similar treatment. Nevertheless, we favor the idea that transporter conformational changes underlie the movement of charge through field, and the cartoon in Fig. 2 B shows how we have modeled the major charge-moving reaction for GAT1. We assume that an extracellular Na+ binding site of GAT1 becomes available in an unstable transitional state (*E), meaning that the binding site has a strong tendency to close to either the unloaded state (E1) or to the loaded, Na+-occluded state (E2), via reactions labeled β and γ, respectively. The binding site opening rates, α and δ, are assumed to be voltage dependent, whereby reaction α moves a fixed negative charge out of membrane field and the Na+ occlusion reaction (γ) moves the positively charged Na+ into the electrical field.
Assuming that the *E state never accumulates significantly, this scheme predicts simple monoexponential charge movements with rate constants determined by the rates, α and δ. Although the opening of empty binding sites (α) is a major source of charge movement, this reaction cannot be isolated in the absence of extracellular Na+. Modifications of this scheme to allow significant accumulation of the *E state predict slow charge movements in the absence of Na+, as predicted (Parent et al. 1992; Loo et al. 1993) and measured (Chen et al. 1996) for Na,glucose transporters and for proton-coupled peptide transporters (Nussberger et al. 1997). Since we do not observe slow charge movements without Na+ o, nor do we observe fast Na+ o-dependent charge components, we estimate that the *E out state can never be occupied by >2% of total transporters. At 0 mV, the opening rates used to simulate our data are 200 s−1 for 1a and 2,000 s−1 for 2a (Fig. 1). To ensure low occupancy of the transitional state, binding site closure rates (1b and 2b) would be in the range of 20,000–200,000 s−1 (Fig. 1). This is still much slower than the expected dissociation rate of Na+ from a binding site with a dissociation constant of 1 M (K no).
Designating the fractional occupancy of the binding site by Na+ in Fig. 2 as f no, and the extracellular Na+ concentration as N o,
 |
1 |
From rate theory, the state flux from E 1 to E 2 (φ12) will be
 |
2 |
and the state flux from E 2 to E 1 (Ν21) is
 |
3 |
These same expressions were derived by Dr. Vladislav Markin (University of Texas Southwestern Medical Center at Dallas) from the analytical solution of the corresponding three-state model. Since variation of the rates, γ and β, simply changes the apparent Na+ o affinity, these rates can be eliminated from the model. Thus,
 |
4 |
and
 |
5 |
whereby the rate coefficients, α and δ, will be voltage dependent.
We point out one interesting feature of this scheme, which could be relevant to the kinetic function of other transporters. Because Na+ binding in the transitional state inhibits the overall reaction that releases Na+ to the outside, the “off” rate of the charge movement is accelerated by reducing extracellular Na+. This would not be the case for a simple ion binding/dissociation reaction.
Description of the Model
The mathematical description of our model contains 18 parameters. One of these is eliminated to enforce microscopic reversibility of rates and one to enforce charge conservation (i.e., movement of one total charge per transport cycle). We fixed the intrinsic rates of 1a and 2a to 200 and 2,000 s−1, respectively (Fig. 1), because the effects of varying these rates by two- to threefold could be fully compensated by changes of substrate binding affinities. Another parameter that is not varied is designated f x. This parameter determines the ratio of extracellular Cl− dissociation constants in the E out and the *E in states; it affects only the simulations shown in Fig. 7 and Fig. 9. Thus, 13 parameters were adjusted by the fitting routine for the results presented.
Figure 7.
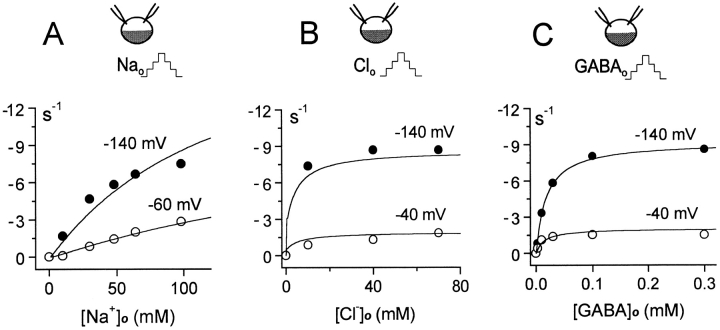
Extracellular substrate dependence of inward GAT1 current. (A) Extracellular Na+ dependence of current at −140 and −60 mV. (B) Extracellular Cl− dependence of current at −140 and −40 mV. (C) Extracellular GABA dependence of current at −140 and −40 mV. The experimental results are whole-oocyte currents (Mager et al. 1993). See text for further details.
Figure 9.
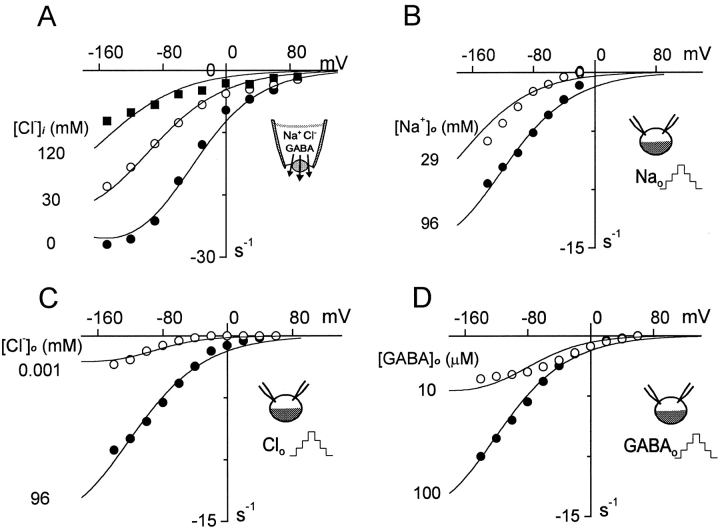
Current–voltage relations of the inward GAT1 current. (A) Inward GAT1 current in a giant patch with 0, 30, and 120 mM cytoplasmic Cl−. Results in B–D are whole-oocyte experiments (Mager et al. 1993), and the corresponding simulations assume 25 mM cytoplasmic Cl− and 12 mM cytoplasmic Na+. (B) Inward current with 96 and 29 mM extracellular Na+. (C) Inward current with 96 mM and nominally zero extracellular Cl−; the simulation is with 1 μM Cl−. (D) Inward current with 100 and 10 μM extracellular GABA. See text for further details.
Designations of the rate coefficients (k 1, k 2, k 3, and k 4) correspond to the reaction numbers in Fig. 1. Na+ ions are designated N, Cl− ions are designated Cl, and GABA molecules are designated G. Cytoplasmic and extracellular Na+ concentrations are designated ni and no, respectively; Cl− concentrations are designated ci and co, and GABA concentrations are designated gi and go. Dissociation constants for the extracellular side are designated Kno1 and Kno2 for the first and second Na+ ion to bind, respectively, during forward transport. Kgabo and Kclo are the extracellular GABA and Cl− dissociation constants. For the cytoplasmic side, our designations are Kni1 and Kni2 for the first and second Na+ ions to bind, respectively, during reverse transport. Kgabi and Kcli are the cytoplasmic GABA and Cl− dissociation constants. Each of the reactions simulated has an apparent valence, designated q1, q2, q3, and q4, according to the corresponding rate coefficients. Finally, we assume that the cytoplasmic Cl− binding site, while empty, undergoes a weakly voltage-dependent reaction that allows and disallows Cl− i binding. Its valence is designated q5.
The parameter values for the results presented were as follows: k 1 = 200 s−1, k 2 = 2,000 s−1, k 3 = 39.8 s−1, k 4 = 42.0 s−1, Kno1 = 917 mM, Kno2 = 10.1 mM, Kgabo = 41.0 μM, Kclo = 8.16 mM, Kni1 = 442 mM, Kni2 = 11.5 mM, Kgabi = 1.77 mM, Kcli = 3.66 mM, q1 = 0.684, q2 = 0.387, q3 = −0.071, q4 = 0.167, and q5 = −0.167.
Microscopic reversibility was enforced at each fitting cycle by forcing a correction factor on one parameter, such that
 |
6 |
The factors, h1–h5, modify the rates of voltage-dependent reactions. Those reactions that move positive charge in the outward direction are multiplied by their respective factor, and those moving positive charge in the inward direction are divided by their respective factor:
 |
7 |
The sum of apparent valences, q(1…5), is 1, corresponding to one net charge moved per transport cycle,
 |
8 |
Using d1–d5, r1–r4, and Kgat as temporary variables, the two-state model is simulated as follows. f 0cn is the fraction of E in transporters whose Cl−/Na+ binding sites are empty and are not available to bind Cl− i (i.e., closed by the fast voltage-dependent reaction related to q5). f cn is the fraction of E in transporters whose cytoplasmic Cl−/Na+ binding sites are occupied by one Cl− i and the first Na+ i to bind in the reverse transport cycle with the Kni1 dissociation constant. Although two Na+ ions can bind in the E in state, only the first site must be occupied for the transition to the *E in state:
 |
9 |
 |
10 |
and
 |
11 |
Na+ i and GABAi bind sequentially in the *E in transitional state, although these binding reactions can be treated as parallel reactions with no important changes. f 0g is the fraction of transporters in the transitional state whose GABAi binding sites are empty; f nag is the fraction of transitional transporters whose Na+ i/GABAi sites are occupied by both Na+ i and GABAi:
 |
12 |
 |
13 |
and
 |
14 |
f 1no is the fraction of *E out transporters with a Na+ bound, and f 0no is the fraction without Na+ bound:
 |
15 |
 |
16 |
and
 |
17 |
f fullo is the fraction of E out transporters occupied by Na+ o and GABAo, whereby extracellular Na+ (no) and GABA (go) bind sequentially. Again, these binding reactions can be treated as parallel reactions without important changes. f 0o is the fraction of E out transporters with empty Na+/GABA binding sites:
 |
18 |
 |
19 |
and
 |
20 |
f clo is the fraction of extracellularly-oriented Cl− binding sites which is occupied by Cl−:
 |
21 |
The rate coefficients, k 1 to k 4, are multiplied by the appropriate factors to calculate the rates of the E in → E out (r1 and r4) and the E out → E in (r2 and r3) transitions:
 |
22 |
and
 |
23 |
Calculation of the reaction rates, r3 and r4, is more complex because more substrates interact with the *E in state than the *E out state. These rates are modified by a denominator, h6, derived analogously to that in and . The denominator is the sum of the factors that modify exit rates from the *E 2 state (Fig. 1, Fig. 3b and Fig. 4b). The dissociation constant for Cl− in the E out state is multiplied by a factor, f x, to give the dissociation constant in the *E in state. Microscopic reversibility is maintained by modifying the Eout → *E in transition rate in the absence of Cl− o by the same factor. The extracellular Cl− dependence of the overall reaction, r3, is then
 |
24 |
which simplifies to f clo. f x was assigned a value of 0.2 for the simulations presented, and its variation from 0.1 to 0.3 is without significant consequence.
Figure 4.
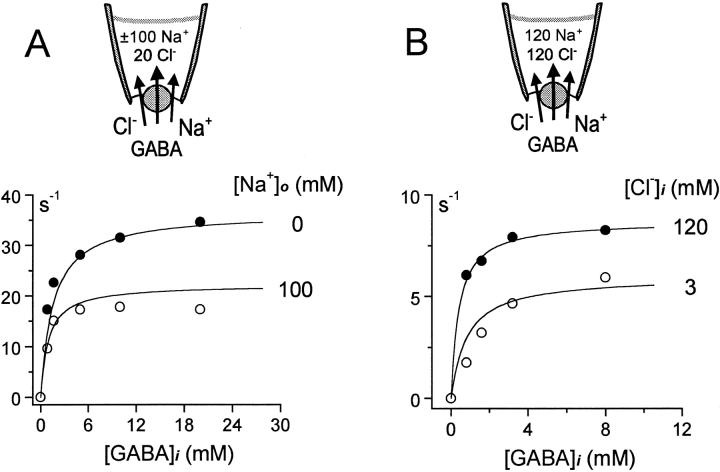
(A) GABA dependence of the outward transport current at 0 mV in the presence of 120 mM cytoplasmic Cl−, with and without 120 mM extracellular Na+. See text for details. (B) GABA dependence of the outward transport current at 0 mV in the presence of 120 mM extracellular NaCl, with 120 and 3 mM cytoplasmic Cl−.
The r3 and r4 rates are calculated as follows:
 |
25 |
 |
26 |
and
 |
27 |
The fractional occupancy of the E in and E out states, and the steady state transporter turnover rate (Rgat) are calculated as follows:
 |
28 |
 |
29 |
 |
30 |
and
 |
31 |
As required by thermodynamics for a tightly coupled transport process, the complete equation system obeys the relationship,
 |
32 |
For non–steady state (kinetic) simulations, the E in state at time t, E in(t), is calculated from its value at time zero, E in(0), and steady state value, E in(∞):
 |
33 |
The charge moved per second by a single transporter is calculated as follows:
 |
34 |
This equation takes into account the model assumption that E in transporters undergo a fast (instantaneous) charge-moving reaction that enables Cl− i binding. Thus, for each transition that alters the E in occupancy, it is calculated how much charge is moved simultaneously by a shift of the E in distribution between the states with and without available Cl− i sites. We note that simulation results were nearly identical when the charge-moving reaction within the E in state was simulated kinetically, using a three-state model, with forward and backward rate constants of 77,000 s−1, roughly as measured experimentally for Q fast.
Charge signals are presented only for the case that GABA is absent on both membrane sides, so that the r3 and r4 rates are zero. With this limitation, the total transporter-associated charge (Qgat), which has moved through the membrane electrical field, relative to the E out state (i.e., with one occluded Na+ o and no substrates bound), can be calculated:
 |
35 |
Calculation of GABA Efflux Rates
Finally, the unidirectional GABA extrusion rate is calculated to relate model function to GABA radioisotope flux studies. The flux has two components: first, an outward GABA flux that occurs via the overall reaction 4 (Fig. 1), and second, an exchange component that occurs when the E out sites undergo conformational changes to the *E in transitional state, and then return to the E out state without reaching the E in state. Thus,
 |
36 |
Results were nearly identical when the transitional state was simulated as a stable state with high exit rates, and GABA efflux was calculated as occupancy of that state times the transition rate to the E out state.
results
Fully Activated GAT1 Current–Voltage Relations and Model Overview
Fig. 3 shows fully activated current–voltage relations predicted by the model, together with corresponding data from experiments. Here, and in subsequent figures with steady state model predictions, we plot the calculated transporter turnover rates (y axis), rather than membrane current magnitudes from experiments. The membrane currents (data points) are proportional to the simulated turnover rate (lines), and the current magnitudes are available for all data simulated from the relevant figures in the previous articles (Lu and Hilgemann 1999a,Lu and Hilgemann 1999b). Fig. 3 includes results for the fully activated outward current (120 mM NaCl + 20 mM GABA on the cytoplasmic side; 20 mM Cl− and no other substrates on the extracellular side) and for the fully activated inward current from the same patch (120 mM NaCl + 0.2 mM GABA on the extracellular side; no cytoplasmic substrates). Simulated results (dotted line) are also given for a “mixed” mode (reversing) condition with all substrates in equal concentrations on both sides (100 mM Cl−, 100 mM Na+, and 2 mM GABA). The mixed mode current reverses at 0 mV, as required by thermodynamics. The shapes of the forward and reverse current–voltage relations are predicted in detail by the model, as are their relative magnitudes. Also, the small magnitude of the mixed mode current corresponds to our experience, that we could not confidently define any GAT1-mediated current, steady or transient, with these high substrate concentrations on both sides.
These simulations allow us to summarize concisely major features of the model's function: outward GAT1 current, in the absence of extracellular Na+, has weak voltage dependence that corresponds to the voltage dependence of substrate occlusion from the cytoplasmic side (k 4). This step is rate limiting for reverse current because the deocclusion of Na+ to the extracellular side (k 2) is very fast in the absence of extracellular Na+. For the same reason, the ratio of E in to E out occupancy does not change when voltage changes or cytoplasmic substrate concentrations are changed over a substantial range (not shown). The maximum turnover rate for outward transport at 0 mV, simulated for results at 32°C, is ∼40 s−1.
The relative slope of the fully activated inward current is larger than that of the outward current. This slope is determined mostly by the valence of reaction 1a (Fig. 1). The relatively slow rate of this process, even with 120 mM extracellular Na+, determines the 4.5-fold smaller magnitude of fully activated inward current, compared with outward current, at 0 mV. The inward current saturates with increasing hyperpolarization because the GABA translocation step (reaction 3a, Fig. 1) becomes rate limiting. This saturation behavior is enhanced by our assumption that this step moves a small amount of negative charge from outside to inside (i.e., in opposite direction from Na+ occlusion). In fact, the model predicts that negative slopes of the current–voltage relations should be found at more negative potentials. Also, the weak voltage dependence of the GABA translocation reaction (reaction 3a, Fig. 1) contributes to a small voltage dependence of current activation by extracellular GABA (see Fig. 7 C). The maximum forward transport rate at 0 mV is ∼8 s−1. As indicated with bar graphs in Fig. 3, changes of membrane voltage in the inward current condition result in large changes in the fractional distribution of the E in and E out states. In contrast, voltage changes result in very little shift from the E in configuration in the outward current condition.
Cis–Trans Substrate Interactions for Reverse GAT1 Current
As described previously (Lu and Hilgemann 1999a), an alternating access model of cotransport function predicts that the presence of one substrate on the trans membrane side will increase the apparent affinity for a substrate on the cis side in proportion to its inhibition of cis-to-trans transport activity. Fig. 4 A shows the GABA dependence of the reverse GAT1 current at 0 mV with 120 mM cytoplasmic NaCl, with and without 120 mM extracellular Na+. The half-maximal GABAi concentration shifts from ∼1.5 to ∼0.8 mM in the presence of 120 mM extracellular Na+, which inhibits the current by ∼40%. The magnitudes of inhibition and the changes of concentration dependence are both predicted well by the model.
Fig. 4 B shows the simulation result obtained for cis–cis substrate interaction, when reverse current is limited by the “return” step of the alternating access model (i.e., with NaCl in the pipette). In this case, reduction of the cytoplasmic cosubstrate concentration, [Cl−]i, from 120 to 3 mM increases the half-maximal concentration of cytoplasmic GABA. The predicted effect is smaller than the experimental effect. As described at the end of results, this discrepancy is completely alleviated when the *E in state is simulated as a stable state that can accumulate significantly.
GABA–GABA Exchange
Isotope flux studies of GABA–GABA exchange provide another important test of our model. In outside-out synaptic membrane vesicles, extracellular GABA promotes GABA efflux both in the presence and in the nominal absence of extracellular Cl− (Kanner et al. 1983). This result is accounted for by our model because Na+ and GABA can be translocated from outside to inside (reaction 3a, Fig. 1) regardless of whether the parallel Cl− binding site is occupied. As noted in materials and methods, we have simulated this reaction so that it takes place fivefold faster when extracellular Cl− is bound than when Cl− is not bound.
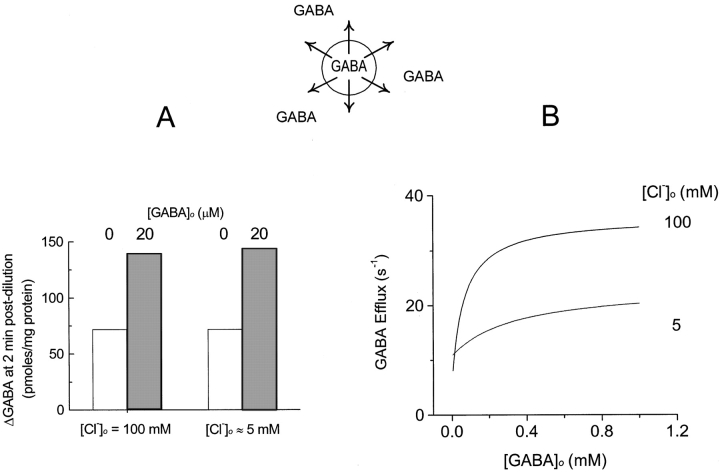
Fig. 5 A shows the relevant measurements of GABA efflux by Kanner et al. 1983(2-min time points of Fig. 4). With 100 mM extracellular NaCl, GABA efflux in the presence of all substrates on the cytoplasmic side is roughly doubled by the presence of 20 μM extracellular GABA, and this effect is similar when extracellular Cl− is ∼5 mM. Our simulation of GABA efflux in the presence of all cytoplasmic substrates is shown in Fig. 5 B. The cytoplasm was assumed to contain 40 mM NaCl and 20 mM GABA, the extracellular solution was assumed to contain 100 mM Na+, and membrane potential was assumed to be 0 mV. The GABA dependence of GABA efflux is shown with 100 and 5 mM extracellular Cl−. In both cases, GABA efflux is stimulated for increasing extracellular GABA concentrations. The maximum GABA efflux rate is larger with high than with low [Cl−]o. The results are in reasonable qualitative agreement with the experimental data, particularly in light of the fact that membrane potential and cytoplasmic substrate concentrations are not controlled in the experiments.
Figure 5.
Measured and predicted characteristics of GABAo-stimulated GABA efflux. (A) GABA efflux from outside-out synaptic vesicles (Kanner et al. 1983). Vesicles were loaded with GAT1 substrates by forward transport. GABA efflux was monitored as loss of labeled GABA from the vesicles after diluting them into solutions containing Na+. Extracellular GABA (20 μM) stimulates GABA efflux by about twofold in the presence of 100 mM Cl− o, as well as in its nominal absence (<5 mM). Stimulation of GABA efflux by GABAo required the presence of extracellular Na+. (B) Model predictions: extracellular GABA dependence of GABA efflux in the presence of 40 mM cytoplasmic NaCl, 20 mM cytoplasmic GABA, and 100 mM extracellular Na+ (0 mV). GABA efflux is increased about fourfold by GABAo in the presence of 100 mM Cl− o, and by about twofold in the presence of 5 mM Cl− o.
Cytoplasmic Substrate Interactions in the Activation of Reverse GAT1 Current
The model predictions for cytoplasmic substrate interactions in the activation of reverse GAT1 current were presented together with the relevant data (Lu and Hilgemann, 1999; see Fig. 9). Here, we summarize the major features. (a) The GABAi dependence of the fully activated current shows almost no change when either cytoplasmic Na+ or Cl− is reduced. This is because a time-dependent transition takes place between the binding of Cl− i and the first Na+ i ion, and the binding of GABAi. Also, the second Na+ i ion binds with such a high affinity that reduction of Na+ to a few millimolar has no effect on the apparent GABA affinity. (b) There is almost no change of the apparent Cl− i affinity with reduction of cosubstrate concentrations. This is because the second Na+ i and GABAi bind in a state that is temporally separated from that in which Cl− i binds. Also, it is important that one Na+ i binds immediately after binding of Cl− i. This arrangement explains why Na+ i does not inhibit the inward GAT1 current in the absence of Cl− i (see Fig. 8). (c) With [Cl−]i reduction, there is a shift of the half-maximal Na+ i concentration to higher values. This is accounted for by the assumed sequential Cl− → Na+ → Na+ binding order; the inhibitory effect of reducing the Cl− i concentration can be overcome by higher Na+ i concentrations.
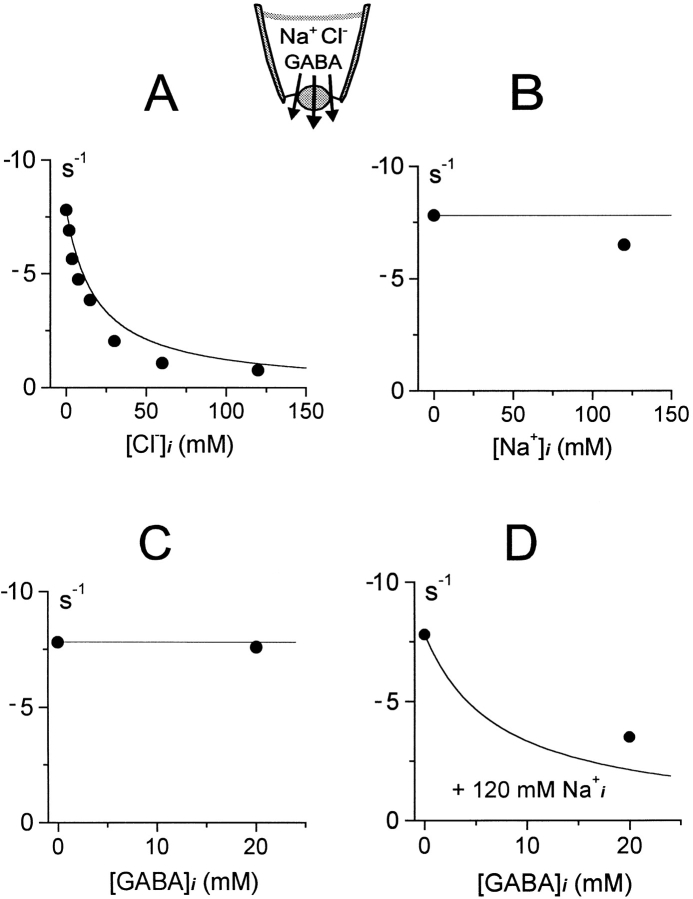
Figure 8.
Cytoplasmic substrate dependence of inward GAT1 current. (A) Inhibition of inward GAT1 current by cytoplasmic Cl−. (B) Weak inhibition of inward GAT1 current by cytoplasmic Na+. (C) Lack of effect of GABAi on inward GAT1 current. (D) Weak inhibition of inward GAT1 current by GABAi in the presence of 120 mM cytoplasmic Na+ and no Cl−. See text for further details.
Voltage Dependencies of Outward GAT1 Current
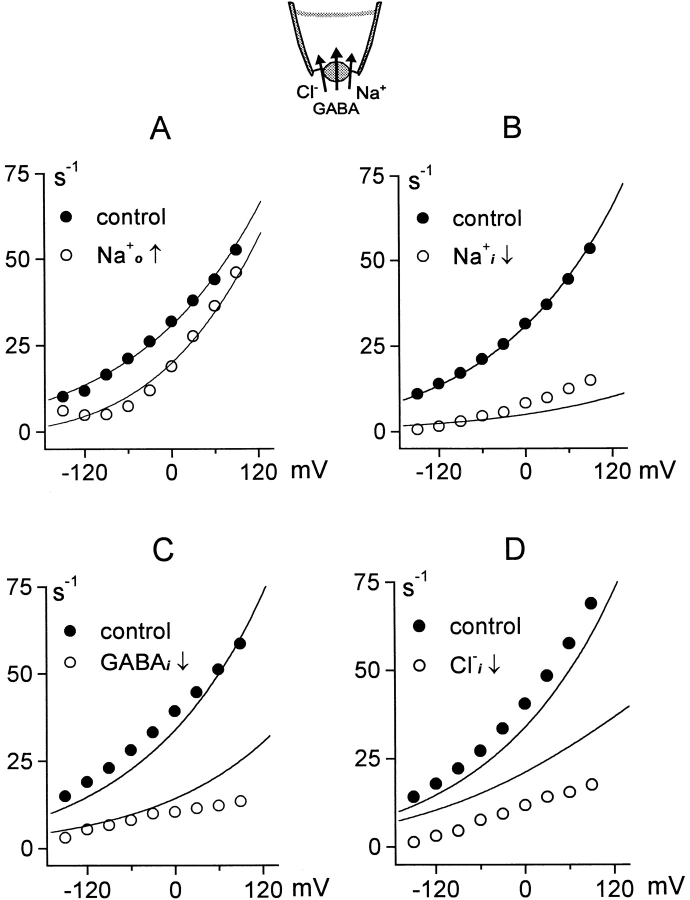
Fig. 6 shows experimental and predicted current–voltage relations for the outward GAT1 current (20 mM Cl− o and no other extracellular substrates). Fig. 6 A shows the effect of adding 120 mM extracellular Na+ via pipette perfusion. Inhibition is ∼75% at −120 mV, but only ∼10% at +90 mV. The strongly voltage-dependent deocclusion reaction becomes rate limiting for the reverse transport cycle at negative potentials in the presence of Na+ o. Positive membrane potential relieves the inhibition because transporters are driven to accumulate in the E 1 state. Discrepancies between the experimental and predicted results are in the range of our experimental error.
Figure 6.
Current–voltage relations of outward GAT1 current. Fully activated outward current (120 mM NaCl and 20 mM GABA) is plotted in each case (•). (A) Inhibition of outward current by 100 mM extracellular Na+. (B) Inhibition of outward current by reducing the cytoplasmic Na+ concentration from 120 to 20 mM. (C) Inhibition of outward current by reducing cytoplasmic GABA from 20 to 0.5 mM. (D) Inhibition of outward current by reducing cytoplasmic Cl− from 120 to 15 mM. See text for further details.
Fig. 6B–D, shows results in the absence of extracellular Na+. Fig. 6 B shows the effect of lowering the cytoplasmic Na+ concentration from 120 to 20 mM on the outward current–voltage relation. The model predicts no significant change of the shape of the current–voltage relation; the measured current–voltage relation in low [Na+]i is somewhat steeper than predicted. This could reflect a small voltage dependence of Na+ i binding (not simulated), whose influence becomes more pronounced when Na+ i concentrations are not saturating.
Fig. 6 C shows the effect of lowering cytoplasmic GABA from 20 to 0.5 mM. In this case, the simulated current–voltage relation at the low GABAi concentration is somewhat steeper than experimental results. One possible explanation is that GABAi interaction (binding and/or occlusion) from the cytoplasmic side becomes rate limiting at low GABAi concentrations; the three-state simulation described at the end of results gives a more accurate account of this result. Fig. 6 D shows the effect of reducing cytoplasmic Cl− from 120 to 5 mM on the current–voltage relation. The discrepancy between predicted and observed results reflects an experimental variability of the apparent Cl− i affinity, as noted in materials and methods. The shapes of current–voltage relations are predicted with reasonable accuracy.
Voltage Dependence of Apparent Extracellular Substrate Affinity
Fig. 7 shows the substrate dependence of the inward GAT1 current in whole-oocytes at different membrane potentials. These data points have been replotted from Mager et al. 1993, and they are simulated by assuming that intracellular Cl− and Na+ concentrations are 50 and 12 mM, respectively. Fig. 7 A shows the extracellular Na+ dependence at −60 and −140 mV with 0.2 mM GABAo and 100 mM Cl− o. The shapes of the Na+ o dependencies are reasonably predicted. Saturation comes about with negative potentials because at high [Na+]o the E out → *E in → Ein transition becomes rate limiting.
Fig. 7 B shows the Cl− o dependence of the inward current at −140 and −40 mV. The Cl− o dependence is biphasic. Approximately 50% of the current activates with very high affinity, and ∼50% with low affinity (K d = 8 mM). The high-affinity component comes about because the overall E out → E in transition becomes very fast when [GABA]i is low. This, in turn, depends on our assumption that GABAi can be translocated from the extracellular side in the absence of Cl− o. The apparent affinity will be determined by the ratio of rates 3b to 4a (Fig. 1), which in our simplified model is infinity. The effect of membrane potential and the overall Cl− o dependence are predicted accurately.
Fig. 7 C shows the GABAo dependence of the inward current. When maximum current is strongly reduced by depolarization, there is a modest increase in the apparent GABAo affinity at less negative potentials. In current–voltage relations (see Fig. 9), this effect results in a more pronounced saturation of current with hyperpolarization when the GABAo concentration is low.
Inhibition of Inward and Outward GAT1 Currents by Substrates from the Trans Side
Fig. 8 shows the inhibition of inward GAT1 current in giant patches by cytoplasmic substrates (0 mV; 120 mM extracellular NaCl and 0.2 mM extracellular GABA). Results in Fig. 8A–C, are for the individual substrates, Cl− i, Na+ i, and GABAi, respectively. Cytoplasmic Cl− monotonically inhibits the inward current with half-inhibition at ∼15 mM (Fig. 8 A). Cytoplasmic Na+ and GABA, when applied individually, have almost no effect (B and C). The lack of effect of Na+ i and GABAi relies on the assumption that the *E in state does not accumulate significantly during inward current. The complete lack of effect of GABAi, in the absence of Cl− i and Na+ i, derives from the assumption that Na+ i binding precedes GABAi binding in the *E in state. However, the results are only marginally different when binding of cytoplasmic Na+ and GABA is simulated as parallel reactions (not shown). In the presence of 120 mM Na+ i and the absence of Cl− i, GABAi inhibits the inward current with low affinity (Fig. 8 D); the predicted inhibition is ∼75% with 20 mM GABAi, while the inhibition obtained experimentally is ∼60%.
Outward GAT1 current.
For brevity, we do not show model results on the inhibition of outward GAT1 current by substrates applied to the extracellular side. The inhibitory effect of extracellular Na+ on outward current was described in Fig. 6 A. In the absence of extracellular Na+, outward current is inhibited by only ∼10% when [Cl−]o is increased from 0 to 120 mM in the model, and this is in close agreement with our experimental experience. The Cl− o inhibition is small because the E out state does not accumulate significantly in this condition. Extracellular GABA is without effect in the absence of extracellular Na+ because GABAo binds after Na+ o in the model.
Voltage Dependence of the Inward GAT1 Current
Fig. 9 shows the predicted and measured current–voltage relations of the inward GAT1 current in patches (A) and whole oocytes (B–D). Fig. 9 A shows the effect of Cl− i (0, 30, and 120 mM) on inward current in an oocyte patch. With high [Cl−]i, inward currents lose their tendency to saturate at negative potentials.
Fig. 9B–D, shows simulation results for whole-oocyte experiments, whereby we have assumed cytoplasmic Na+ and Cl− to be 12 and 50 mM, respectively. Fig. 9 B shows the effect of reducing [Na+]o from 96 to 29 mM. In the absence of Cl− i, the current–voltage relation would be shifted by ∼30 mV to more positive potentials. For the most part, the effect of reducing [Na+]o is to shift the current–voltage relation to more negative potentials, and this is well predicted.
Fig. 9 C shows the experimental effect of removing extracellular Cl−. We assume for this simulation that nominally Cl− -free solutions will still contain 1 μM Cl−. With this assumption, the simulated current–voltage (I–V) relations describe the experimental data accurately without violating a fixed transport stoichiometry. Removal of Cl− scales down the I–V relation and somewhat enhances the saturation with hyperpolarization. Fig. 9 D shows the effect of reducing extracellular GABA from 100 to 10 μM; saturation of I–V relations at negative potentials becomes more pronounced at low extracellular GABA.
GAT1 Kinetics
Fig. 10 Fig. 11 Fig. 12 Fig. 13 Fig. 14 Fig. 15 describe model predictions for GAT1 kinetic function. Fig. 10 shows the charge movements predicted by the two-state model. These results are shifted by ∼25 mV from results shown subsequently under identical conditions. We suspect that this variability, already pointed out in materials and methods, reflects a variable regulatory process in the oocytes that influences GAT1 function. To demonstrate the kinetic behavior of the model in relation this data, therefore, we have used 70 instead of 40 mM NaClo to simulate this single data set. The results are calibrated as charge moved (e) per single transporter. In agreement with experimental results, the simulated charge signals contain immediate charge jumps on changing potential from positive values to −40 mV. These jumps arise from the charge-moving reaction of the empty Cl− i binding sites (q5), which moves a total of −0.08 equivalent charges per transporter. Clearly, the kinetics of slow charge movements are simulated accurately by the model.
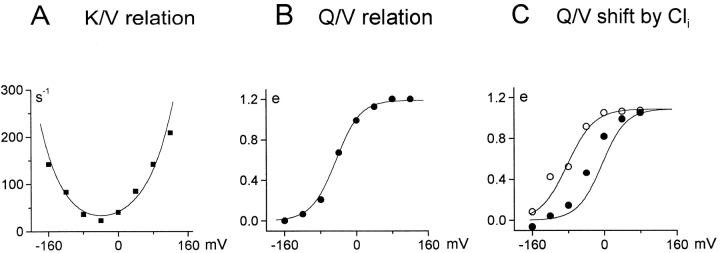
Figure 11.
Rate– (K/V) and charge–voltage (Q/V) relations. (A and B) Results from an excised oocyte patch with 40 mM extracellular NaCl, simulated with 80 mM NaCl. (C) Effect of 120 mM cytoplasmic Cl− on Q/V relation of a patch with 120 mM extracellular NaCl. The simulated charge is calibrated as elementary charges (e) moved through membrane field per single transporter. See text for details.
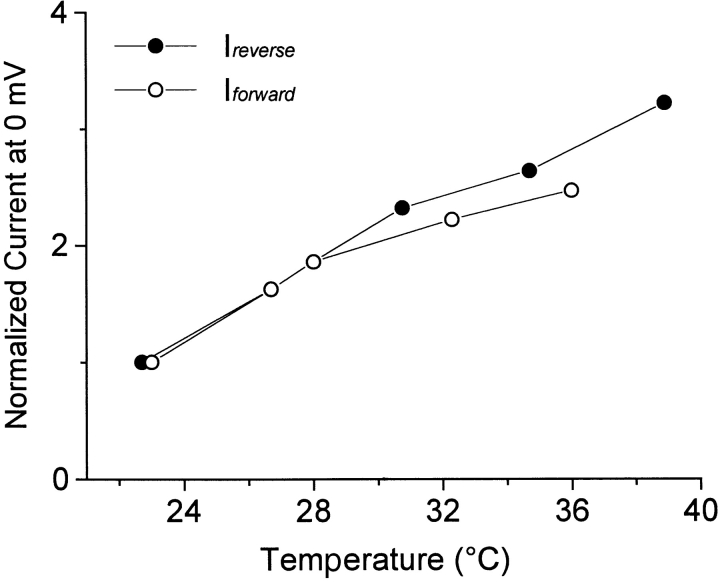
Figure 12.
Temperature dependence of inward and outward GAT1 currents at 0 mV in excised oocyte patches. Inward current was recorded with 120 mM NaCl and 0.2 mM GABA on the extracellular side. Outward current was recorded with 120 mM NaCl and 20 mM GABA on the cytoplasmic side.
Figure 13.
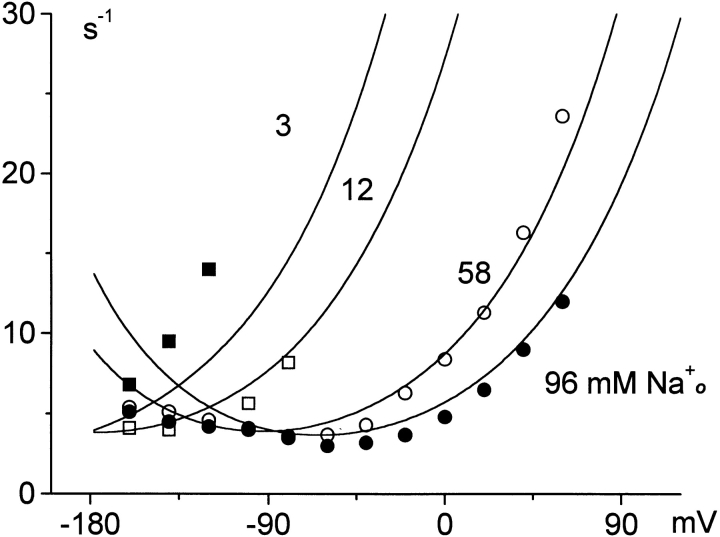
Voltage dependence of charge-movement rates in whole-oocyte voltage clamp with 96, 58, 12, and 3 mM extracellular Na+. The results are from Mager et al. 1996. See text for details.
Figure 14.
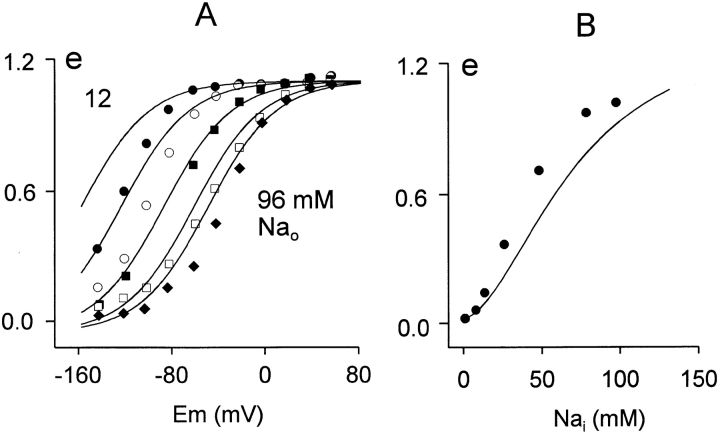
Voltage and extracellular Na+ dependence of GAT1 charge movements in whole-oocyte voltage clamp. The simulations are calibrated as elementary charges (e) moved through membrane field per single transporter. The results are from Mager et al. 1996. (A) Voltage dependence of charge moved at 96 (♦), 77 (□), 48 (▪), 24 (○), and 12 (•) mM extracellular Na+. (B) Na+ i dependence of charge moved at −80 mV by application of 96 mM extracellular Na+.
Figure 15.
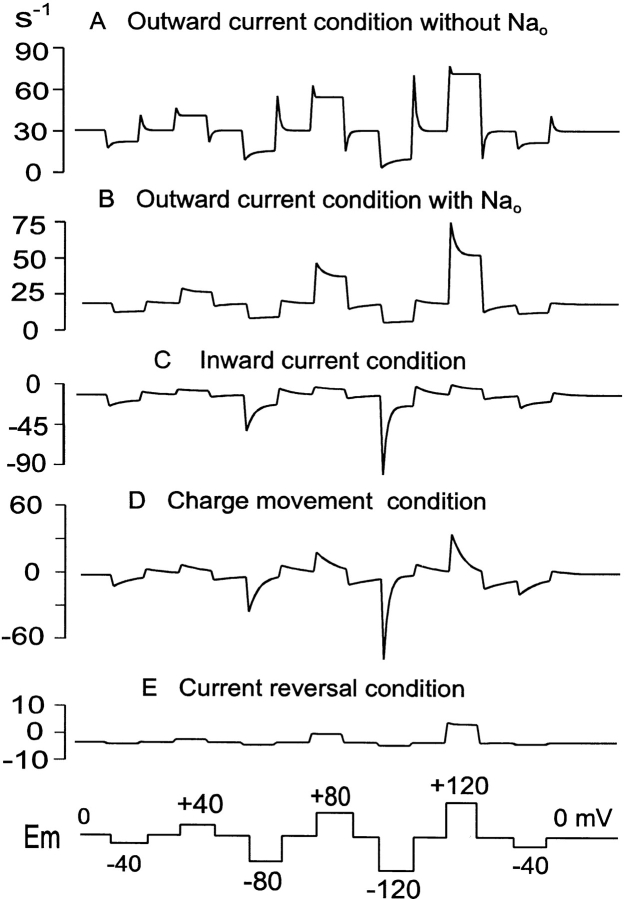
Predicted GAT1 pre–steady state current transients. The voltage protocol is given below the figure. These model results are comparable to experimental results described previously (Lu and Hilgemann 1999b). (A) Outward current condition without extracellular Na+: 120 mM cytoplasmic NaCl, 20 mM cytoplasmic GABA, and 20 mM extracellular Cl−. (B) Outward current condition as in A with additional 120 mM extracellular Na+. (C) Inward current condition: 120 mM extracellular NaCl, 0.2 mM extracellular GABA, and no cytoplasmic substrates. (D) Charge movement condition: 120 mM extracellular NaCl and no other GAT1 substrates. (E) Current reversal condition: 120 mM NaCl and 2 mM GABA on the extracellular side; 120 mM Na+, 6 mM Cl−, and 2 mM GABA on the cytoplasmic side. See text for complete details.
Fig. 11A and Fig. B, shows the predicted and measured rate– and charge–voltage relations from another experiment with 40 and 60 mM extracellular Na+ and Cl−, respectively. The shapes and positions of both the rate– and charge–voltage relations are predicted accurately. Fig. 11 C shows the predicted and measured effect of 120 mM cytoplasmic Cl− on charge–voltage relations in the presence of 90 mM extracellular NaCl. Qualitatively, the simulations are in good agreement with the experimental data.
Since the results described next were performed at room temperature with intact oocytes, we describe here the effect of temperature on GAT1 currents. Fig. 12 shows the temperature dependence of both the inward and outward transport currents in oocyte patches. Increasing temperature from room temperature (23°C) to 32°C at 0 mV causes a 2.2-fold increase in both currents. Although we have not characterized the temperature dependence of charge movements in detail, we have observed rate changes for individual voltage pulses in this general range. To fit the charge movement rates determined in oocytes, it was essential to divide the predicted model rates by a somewhat larger factor of 3.6. This larger factor might reflect the loss of some inhibitory influence on GAT1 transport upon patch excision.
Fig. 13 and Fig. 14 show results from whole-oocyte experiments. Fig. 13 shows the rates of slow charge movements with 96 mM Cl− o at different extracellular Na+ concentrations (96, 58, 12, and 3 mM). These results are replotted from Mager et al. 1996 after converting time constants to rate constants. Reduction of [Na+]o shifts the rate–voltage relations to more negative potentials, and this is predicted accurately. The measured charge movement rates with 96 mM Na+ o increase somewhat less steeply with hyperpolarization than the simulated rates. This shifting of rates with changing [Na+]o comes about because the E out → *E out transition (i.e., opening of binding sites from the loaded state) is strongly inhibited by Na+ o binding at the second extracellular site. There is an additional acceleration at low [Na+]o because the overall E out → E in transition is inhibited by Na+ o binding to the transitional *E out state.
Fig. 14 shows the voltage and Na+ o dependencies of the slow charge movement in intact oocytes and in the model. Fig. 14 A presents the voltage dependence of charge moved at different extracellular Na+ concentrations (12, 24, 48, 77, and 96 mM). Again, the results are replotted from Mager et al. 1996 and scaled to the magnitude of charge moved per transporter (e) in the simulation. The shifts of voltage dependence and the shapes of charge–voltage relations are predicted accurately, although the predicted shifts are somewhat larger than those observed experimentally. Fig. 14 B presents the concentration dependence of charge moved at −80 mV when different extracellular Na+ concentrations are applied. The shape of the Na+ o dependence of charge available at 0 mV is reasonably well predicted, but the apparent Na+ o affinity is somewhat lower in the model than determined experimentally. An important interpretive point is that the sigmoidal shape of this relationship does not require that both Na+ ions bind before they are occluded. Binding of the second Na+ ion after the slow occlusion of the first Na+ ion has the same effect, and this order of events is essential to explain the changes of charge movement rates with changes of Na+ o concentration.
Current Transients
Fig. 15 shows simulations of GAT1-mediated currents under the different conditions studied with voltage pulse protocols. The corresponding experimental results (Lu and Hilgemann 1999b, Fig. 7 and Fig. 8) were not included in the simulation database, so these simulations provide a test of model constraint. The voltage protocol is shown below the results; membrane potential was stepped, in 40-mV increments, from 0 mV to different potentials, and then back to 0 mV. Fig. 15 A shows simulated outward transport current with 20 mM Cl− o, 0 mM Na+ o, and 0 mM GABAo. With voltage pulses to positive potentials, pre–steady state transients are very small and fast, consistent with our experimental results. The relative lack of transients is due to the fact that the transport cycle is rate limited by a single step in the E in → *E in transition; the Na+ deocclusion reaction (E out → *E out) takes place 10× faster. A predicted experimental result, which we have not tested, is that significant current transients should occur after pulsing to large negative potentials. Fig. 15 B shows simulated results for outward current in the presence of 120 mM extracellular NaCl. In this case, current transients at positive potentials are substantial. They come about because in this condition the relatively slow deocclusion of Na+ o from the E out state allows transporters to accumulate in the Na+ o-occluded E out state, which is subsequently released by voltage pulses to positive potentials.
Fig. 15 C simulates the inward current condition (i.e., with all substrates on the extracellular side and none on the cytoplasmic side). Upon hyperpolarization to −120 mV, the inward current relaxes by ∼75%, and on returning to positive potentials, the “off” transients are smaller (i.e., they would integrate to a smaller total amount of charge moved). The model behaviors are in reasonable agreement with experimental results (see Fig. 7 and Fig. 8; Lu and Hilgemann 1999b). Fig. 15 D simulates results with 120 mM NaClo, and no other substrates—the same condition used to monitor slow GAT1 charge movements. The simulations reproduce in reasonable detail the rates of charge movements and their voltage dependence.
Fig. 15 E shows simulation results for the “reversal” condition (6 mM Cl−, 120 mM Na+, and 2 mM GABA on the cytoplasmic side; 120 mM Na+, 40 mM Cl−, and 2 mM GABA on the extracellular side). Small steady state currents are generated, but there are essentially no pre–steady state transients. The major reason is that the transport reactions involving fully loaded transporters are nearly electroneutral.
GAT1-mediated Capacitance Signals: Limited Occupancy of the *Ein State Is Probable
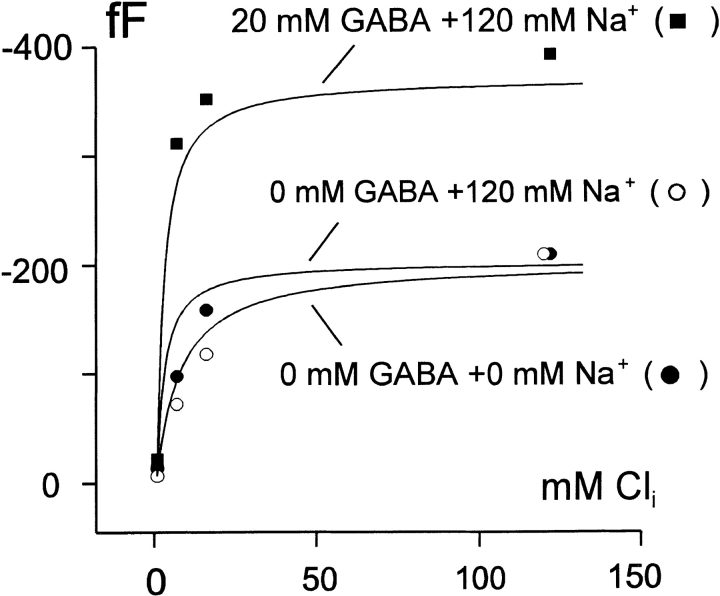
The simulation equations assume that empty transporters undergo a voltage-dependent reaction (q5). This reaction gives rise to a capacitance that decreases when cytoplasmic Cl− binds from the cytoplasmic side, but other details of the Q fast reactions are not represented. In particular, we know that charge-moving reactions still occur in the Cl− i-bound state. To simulate roughly results on capacitance, we assume that the entire E out state is a null state that contributes no capacitance. We assigned the fractions of the E in state with no substrates bound a relative capacitance of unity, and we assigned a relative capacitance of 0.93 to the fractions of the E in state that have at least one bound substrate. From our experimental data (Lu and Hilgemann 1999b; Fig. 4 Fig. 5 Fig. 6), the latter value would be 0.8 since charge movements in the presence of Cl− i are ∼20% smaller in magnitude than those without Cl− i. With these assumptions, Fig. 16 shows model predictions for the cytoplasmic Cl− dependence of capacitance changes in the absence of cosubstrates, in the presence of 120 mM cytoplasmic Na+, and in the presence of 120 mM cytoplasmic Na+ and 20 mM GABA. The Cl− i dependence in the absence of cytoplasmic Na+ is reproduced well. However, the model predicts that the Cl− i dependence shifts ∼2.5-fold to lower Cl− i concentrations in the presence of Na+ i. This result was obtained in only one of four similar experiments.
Figure 16.
Simulation of GAT1-mediated membrane capacitance changes with application of cytoplasmic Cl−. Measured and predicted capacitance changes on application of cytoplasmic Cl− in the absence of cosubstrates (•), in the presence of 120 mM cytoplasmic Na+ (○), and in the presence of 120 mM cytoplasmic Na+ and 20 mM GABA (▪).
Improved Simulations with a Three-State Model: The *Ein State Can Accumulate
The following discrepancies between the two-state model predictions and corresponding experimental data cannot be explained by experimental variability and therefore appear fundamental. (a) In the simulation of cis–cis substrate interactions with extracellular Na+ (Fig. 4 B), reduction of cytoplasmic Cl− does not shift the GABAi dependence of outward current strongly enough to higher GABAi concentrations. (b) The measured current–voltage relations for outward current become relatively more shallow with reduction of GABAi (Fig. 6 C). (c) The extracellular Na+ dependence of inward current does not saturate strongly enough with increasing [Na+]o at negative potentials (Fig. 7 A). (d) In the simulations of capacitance results (Fig. 16), the relative capacitance of the substrate-bound E in fractions must be assumed to be larger than measured experimentally. Also, the presence of Na+ i shifts the Cl− i dependence of capacitance to lower Cl− i concentrations.
All of these discrepancies were reduced significantly, or eliminated, in simulations that included kinetic simulation of the *E in state. The rate coefficients of reactions 3b and 4b (Fig. 1) were selected by the fitting routine such that the *E in state accumulated substantially during reverse GAT1 operation, while its occupancy remained negligible during forward GAT1 operation. Reaction 4b was assigned the voltage dependence of q4, and for simplicity the reactions 4a and 3b were left voltage independent. With these assignments, all other simulation results remained at least as accurate as those presented for the two-state model. The fitted parameters were as follows: k 1 = 53.7 s−1, k 2 = 1,642 s−1, k 3 = 61.7 s−1, k 4 = 365.8 s−1, Kno1 = 237 mM, Kno2 = 7.4 mM, Kgabo = 68.3 μM, Kclo = 54.0 mM, Kni1 = 1,283 mM, Kni2 = 8.0 mM, Kgabi = 0.66 mM, Kcli = 5.18 mM, q1 = 0.652, q2 = 0.419, q3 = −0.059, q4 = 0.215, q5 = −0.22, and f x = 0.3. The additional rate constants for reactions 3b and 4b were 1,767 and 52.2 s−1, respectively.
discussion
Our ability to simulate GAT1 function in oocyte membrane by a model with only two stable states lends confidence to our conclusion that GAT1 works by a simple alternating access mechanism. The model described, while simple, incorporates many detailed assumptions about substrate binding and the dependencies of state transitions thereon. It accounts for many aspects of GAT1 function that we could not explain before undertaking a comprehensive simulation effort. We recognize that our specific assumptions are ad hoc in nature. However, our central assumption is the fundamental principle of enzyme kinetics that substrate binding can either enable or disable individual enzymatic reactions. Also, we recognize that experimental variability limits confidence in the model parameters determined. Nevertheless, the biological variability of GAT1 function, which may reflect the influence of important regulatory processes, does not compromise the simulations presented in any obvious way. We have discussed our simulations for the most part with their presentation.
Cl− o-independent GABA Flux and Transport Current
Our simulations give us no new insight into the significance of uncoupled GAT1 currents, as reported for GAT1 expressed in HEK cells (Cammack et al. 1994) and in the presence of lithium in oocytes (Mager et al. 1996). Since we are confident of an alternating access model for GAT1, our bias is that uncoupled Na+ fluxes, when present, represent failures of the transport mechanism that either do not occur physiologically or occur with such rarity that they play no important role in electrophysiology or ion homeostasis.
An important related issue, which has received less attention in recent years, is the coupling of GABA transport with Cl− movements. Our model assumes tight 1:1 Cl−:GABA coupling during transport, and for the reverse GAT1 transport mode, 20 mM cytoplasmic GABA activates no current in the absence of cytoplasmic Cl−. Our model predicts that GABAo-induced inward currents can be significant at negative potentials with micromolar (or even submicromolar) concentrations of extracellular Cl− (Mager et al. 1993; Lu and Hilgemann 1999a). These predictions evolved from our search for an explanation as to how GABA–GABA exchange in synaptic vesicles could be possible in the nominal absence of Cl− on the extracellular side (Kanner et al. 1983). Since GABA/Na+ translocation occurs to a transitional state, the next step (reaction 3b, Fig. 1) involving Cl− translocation occurs with very high probability when cytoplasmic substrate concentrations are low. Thus, extracellular Cl− can be swept into the cytoplasm with very high apparent affinity as the transporter returns to the E in state.
We stress that experimental evidence for this explanation is still lacking, and three other possibilities must be considered. (a) Extracellular Cl− contamination might be greater than we expect, both in the clefts of oocyte surface and in the pipette tip during our pipette perfusion experiments. (b) The Cl− substitutes employed in experiments might be transported at a slow rate in place of Cl−. (c) Genuine Na+/GABA cotransport may occur under Cl− o-free conditions via transporter reactions that do not occur in the presence of Cl−. This last possibility was suggested from recent isotope flux studies in Xenopus oocytes (Loo, D.D.F., S. Eskandari, and E.M. Wright, personal communication). These authors found that GABA uptake is well coupled with Cl− o uptake in the presence of Cl− o, but that Na+-dependent GABA uptake remains substantial at negative potentials in the absence of extracellular Cl−. Since the current-to-uptake ratio is not much changed in Cl− o-free solution, a 1 Na+/1 GABA uptake mode would explain the results.
Perspectives and Possible Relevance to Other Cotransporters
Finally, it is interesting to compare our model of GAT1 function with relevant models of other transporters. First, we predict that only one Na+ is occluded in an energetically stable state in the GAT1 transporter. This is different from the Na+/K pump in which stable occluded states are formed with three bound Na+ as well as two bound K+ (e.g., Karlish, 1998). Second, we are impressed that transitional states seem important to account for GAT1 function. This is how Na+ occlusion from the outside can be tightly coupled with the empty carrier conformational change that alternates binding site access. Third, our general modeling scheme for the Na+ o -dependent charge movements and their kinetics in GAT1 can probably be applied to Na+/glucose transporters, although there is no obvious sequence similarity between these transporters.
In conclusion, our analysis of GAT1 function does not exclude cotransport coupling mechanisms other than the alternating access mechanism. Nevertheless, our analysis of GAT1 function clearly favors conservative interpretations. We have verified rigorously the alternating access model, established probable cytoplasmic and extracellular substrate binding schemes, identified probable sources of electrogenicity, and refined the kinetic analysis of others. Our model of GAT1 function should be useful in understanding GAT1 mutants that exhibit altered kinetics and charge movements (Mager et al. 1996). Our model predicts the existence of two parallel substrate binding sites in GAT1, rather than a single pore-like structure with single-file sites, and this structural implication will ultimately be verified or contradicted. The physiological significance of “nonconservative,” uncoupled modes of operation of GAT1 remains to be established.
Acknowledgments
We express our gratitude to Dr. Vladislov Markin for many helpful discussions and mathematical aid. For other acknowledgments, see Lu and Hilgemann 1999a.
Note Added in Proof. We have examined the sensitivity of GAT to several interventions that are relevant to the described variability of GAT1 charge movements and cytoplasmic Cl− dependence. Protein phosphorylation might be important because an alkaline phosphatase (P1030; Sigma Chemical Co.) can strongly inhibit outward GAT1 current (>80%). Cytoskeletal interactions also might be important because microfillament disrupters, cytochalasin D (10 μM) and latrunculin B (25 μm), inhibited the outward current. Phosphatidylinositol-bisphosphate and phosphatidic acid were without effect.
Footnotes
1used in this paper: GABA, γ-aminobutyric acid
References
- Cammack J.N., Rakhilin S.V., Schwartz E.A. A GABA transporter operates asymmetrically and with variable stoichiometry. Neuron. 1994;13:949–960. doi: 10.1016/0896-6273(94)90260-7. [DOI] [PubMed] [Google Scholar]
- Chen X.Z., Coady M.J., Lapointe J.Y. Fast voltage clamp discloses a new component of presteady-state currents from the Na(+)-glucose cotransporter. Biophys. J. 1996;71:2544–2552. doi: 10.1016/S0006-3495(96)79447-X. [DOI] [PMC free article] [PubMed] [Google Scholar]
- Deisenhofer J., Epp O., Sinning I., Michel H. Crystallographic refinement at 2.3 A resolution and refined model of the photosynthetic reaction centre from Rhodopseudomonas viridis . J. Mol. Biol. 1995;246:429–457. doi: 10.1006/jmbi.1994.0097. [DOI] [PubMed] [Google Scholar]
- Doyle D.A., Cabral J.M., Pfuetzner R.A., Kuo A., Gulbis J.M., Cohen S.L., Chait B.T., MacKinnon R. The structure of the potassium channelmolecular basis of K+ conduction and selectivity. Science. 1998;280:69–77. doi: 10.1126/science.280.5360.69. [DOI] [PubMed] [Google Scholar]
- Eyring H.R. The activated complex in chemical reactions. J. Chem. Phys. 1936;3:107–115. [Google Scholar]
- Eyring H.R., Lumry R., Woodbury J.W. Some applications of modern rate theory to physiological systems. Record Chem. Prog. 1949;10:100–114. [Google Scholar]
- Greenspan D. Discrete Numerical Methods in Physics and Engineering 1974. Academic Press, Inc; New York, NY: pp. 1–23 [Google Scholar]
- Kanner B.I., Bendahan A., Radian R. Efflux and exchange of gamma-aminobutyric acid and nipecotic acid catalysed by synaptic plasma membrane vesicles isolated from immature rat brain. Biochim. Biophys. Acta. 1983;731:54–62. doi: 10.1016/0005-2736(83)90397-8. [DOI] [PubMed] [Google Scholar]
- Karlish S.J.D. Organization of the membrane domain of the Na/K-pump. Ann. NY Acad. Sci. 1997;834:30–44. doi: 10.1111/j.1749-6632.1997.tb52223.x. [DOI] [PubMed] [Google Scholar]
- Läuger P. Dynamics of ion transport systems in membranes. Physiol. Rev. 1987;67:1296–1331. doi: 10.1152/physrev.1987.67.4.1296. [DOI] [PubMed] [Google Scholar]
- Loo D.D., Hazama A., Supplisson S., Turk E., Wright E.M. Relaxation kinetics of the Na+/glucose cotransporter. Proc. Natl. Acad. Sci. USA. 1993;90:5767–5771. doi: 10.1073/pnas.90.12.5767. [DOI] [PMC free article] [PubMed] [Google Scholar]
- Lu C.C., Hilgemann D.W. GAT1 (GABA:Na+:Cl−) cotransport functionsteady state studies in giant Xenopus oocyte membrane patches J. Gen. Physiol. 114 1999. 429 444a [DOI] [PMC free article] [PubMed] [Google Scholar]
- Lu C.C., Hilgemann D.W. GAT1 (GABA:Na+:Cl−) cotransport functionkinetic studies in giant Xenopus oocyte membrane patches J. Gen. Physiol. 114 1999. 445 457b [DOI] [PMC free article] [PubMed] [Google Scholar]
- Lu C.C., Kabakov A., Markin V.S., Mager S., Frazier G.A., Hilgemann D.W. Membrane transport mechanisms probed by capacitance measurements with megahertz voltage clamp. Proc. Natl. Acad. Sci. USA. 1995;92:11220–11224. doi: 10.1073/pnas.92.24.11220. [DOI] [PMC free article] [PubMed] [Google Scholar]
- Mager S., Cao Y., Lester H.A. Measurement of transient currents from neurotransmitter transporters expressed in Xenopus oocytes. Methods Enzymol. 1998;296:551–566. doi: 10.1016/s0076-6879(98)96039-6. [DOI] [PubMed] [Google Scholar]
- Mager S., Kleinberger-Doron N., Keshet G.I., Davidson N., Kanner B.I., Lester H.A. Ion binding and permeation at the GABA transporter GAT1. J. Neurosci. 1996;16:5405–5414. doi: 10.1523/JNEUROSCI.16-17-05405.1996. [DOI] [PMC free article] [PubMed] [Google Scholar]
- Mager S., Naeve J., Quick M., Labarca C., Davidson N., Lester H.A. Steady states, charge movements, and rates for a cloned GABA transporter expressed in Xenopus oocytes. Neuron. 1993;10:177–188. doi: 10.1016/0896-6273(93)90309-f. [DOI] [PubMed] [Google Scholar]
- Matsuoka S., Hilgemann D.W. Steady-state and dynamic properties of cardiac sodium–calcium exchange. Ion and voltage dependencies of the transport cycle. J. Gen. Physiol. 1992;100:963–1001. doi: 10.1085/jgp.100.6.963. [DOI] [PMC free article] [PubMed] [Google Scholar]
- Nussberger S., Steel A., Trotti D., Romero M.F., Boron W.F., Hediger M.A. Symmetry of H+ binding to the intra- and extracellular side of the H+-coupled oligopeptide cotransporter PepT1. J. Biol. Chem. 1997;272:7777–7785. doi: 10.1074/jbc.272.12.7777. [DOI] [PubMed] [Google Scholar]
- Parent L., Supplisson S., Loo D.D., Wright E.M. Electrogenic properties of the cloned Na+/glucose cotransporterII. A transport model under nonrapid equilibrium conditions [published erratum appears in J. Membr. Biol. 1992. 130:203] J. Membr. Biol. 1992;125:63–79. doi: 10.1007/BF00235798. [DOI] [PubMed] [Google Scholar]
- Sanders D., Hansen U.P., Gradman D., Slayman C.L. Generalized kinetic analysis of ion-driven cotransport systemsa unified interpretation of selective ionic effects on Michaelis parameters. J. Membr. Biol. 1984;77:123–152. doi: 10.1007/BF01925862. [DOI] [PubMed] [Google Scholar]
- Uhlin U., Cox G.B., Guss J.M. Crystal structure of the epsilon subunit of the proton-translocating ATP synthase from Escherichia coli . Structure. 1997;5:1219–1230. doi: 10.1016/s0969-2126(97)00272-4. [DOI] [PubMed] [Google Scholar]
- Xia D., Yu C.A., Kim H., Xia J.Z., Kachurin A.M., Zhang L., Yu L., Deisenhofer J. Crystal structure of the cytochrome bc1 complex from bovine heart mitochondria [published erratum appears in Science. 1997. 278:2037] Science. 1997;277:60–66. doi: 10.1126/science.277.5322.60. [DOI] [PMC free article] [PubMed] [Google Scholar]
- Zhang P., Toyoshima C., Yonekura K., Green N.M., Stokes D.L. Structure of the calcium pump from sarcoplasmic reticulum at 8-A resolution. Nature. 1998;392:835–839. doi: 10.1038/33959. [DOI] [PubMed] [Google Scholar]


