Abstract
Neutralization of the aspartate near the selectivity filter in the GYGD pore sequence (D292N) of the voltage- and Ca2+-activated K+ channel (MaxiK, BKCa) does not prevent conduction like the corresponding mutation in Shaker channel, but profoundly affects major biophysical properties of the channel (Haug, T., D. Sigg, S. Ciani, L. Toro, E. Stefani, and R. Olcese. 2004. J. Gen. Physiol. 124:173–184). Upon depolarizations, the D292N mutant elicited mostly gating current, followed by small or no ionic current, at voltages where the wild-type hSlo channel displayed robust ionic current. In fact, while the voltage dependence of the gating current was not significantly affected by the mutation, the overall activation curve was shifted by ∼20 mV toward more depolarized potentials. Several lines of evidence suggest that the mutation prevents population of certain open states that in the wild type lead to high open probability. The activation curves of WT and D292N can both be fitted to the sum of two Boltzmann distributions with identical slope factors and half activation potentials, just by changing their relative amplitudes. The steeper and more negative component of the activation curve was drastically reduced by the D292N mutation (from 0.65 to 0.30), suggesting that the population of open states that occurs early in the activation pathway is reduced. Furthermore, the slow component of the gating current, which has been suggested to reflect transitions from closed to open states, was greatly reduced in D292N channels. The D292N mutation also affected the limiting open probability: at 0 mV, the limiting open probability dropped from ∼0.5 for the wild-type channel to 0.06 in D292N (in 1 mM [Ca2+]i). In addition to these effects on gating charge and open probability, as already described in Part I, the D292N mutation introduces a ∼40% reduction of outward single channel conductance, as well as a strong outward rectification.
Keywords: potassium channel, conduction, gating current, pore, hSlo
INTRODUCTION
Large conductance Ca2+- and voltage-activated K+ channels (BKCa) are widely distributed in human tissues, where they play a variety of roles in diverse processes, including smooth muscle contraction, neurotransmitter release, regulation of secretion in endocrine cells, and hearing (Petersen and Maruyama, 1984; Neyton and Miller, 1988; Ribalet et al., 1988; Vergara et al., 1998; Fettiplace and Fuchs, 1999; Orio et al., 2002). The BKCa channels differ from the other related K+ selective channels in that their open probability (Po) increases both with membrane depolarization and intracellular Ca2+ concentration. Intracellular Ca2+ increases Po by binding to at least one recognized binding site on the COOH-terminal part of the channel α subunit (Wei et al., 1994; Schreiber and Salkoff, 1997). Still, the channel can be opened by strong depolarizations in the virtual absence of intracellular Ca2+ (Horrigan et al., 1999).
BKCa channels possess a voltage sensor encoded mainly in the forth transmembrane segment whose displacement with voltage generates gating currents (S4) (Stefani et al., 1997; Diaz et al., 1998). Most importantly, BKCa channel gating currents have an initial fast component followed by slow components that develops with a time course comparable to that of ionic current activation and reflecting charge movement associated with transitions involving open states (Horrigan and Aldrich, 1999). Recent work has clarified the role of Ca2+ binding and voltage gating. Horrigan and Aldrich (2002) have examined in detail how intracellular Ca2+ and membrane voltage regulate the gating of BKCa by characterizing the voltage dependence of ionic and gating currents in the presence and absence of Ca2+. Raising internal Ca2+ has only a small effect on the voltage sensor as reflected by small changes of the fast component of ON gating current, while it dramatically increases the open probability (Po), suggesting that Ca2+ can facilitate the population of open states without changes in the activation of the voltage sensor. Thus, it seems that Ca2+ binding and the movement of the voltage sensor promote the population of open states in an independent manner. The experimental data could be described by an allosteric model (Scheme II of Horrigan and Aldrich, 2002) where Ca2+ binding and voltage sensor movement regulate the transitions from closed to open states in a practically independent manner, where the voltage sensor movement is ∼100-fold more effective (Horrigan and Aldrich, 2002).
The pore loop of K+ channels contains the highly conserved GYG sequence, which is critical for K+ selectivity (Heginbotham et al., 1992, 1994; Doyle et al., 1998). An aspartate (D) downstream of the GYG signature sequence is also strongly conserved among Kv channels, but does not seem to be involved in ion selectivity (Chapman et al., 2001). According to the crystal structure of the KcsA K+ channel, this residue is located in the outer part of the pore, pointing away from the selectivity filter (Doyle et al., 1998; Zhou et al., 2001). Hurst et al. (1996) found that replacing this negatively charged aspartate with the neutral asparagine (D447N) suppressed the open state, while leaving the voltage sensor movements practically unchanged. The same mutation in other Kv channels also abolishes conduction (Molina et al., 1998). In the previous paper, we concluded that the removal of negative charge in the outer pore region of hSlo channels by the D292N mutation reduces the surface charge, leading to a reduction of the local K+ concentration and the K+ conductance. In this work, we have analyzed the changes in channel opening and gating currents by the D292N mutation. We found that this mutation greatly destabilizes the open state, reducing the Po and practically removing a gating current slow component associated with long channel openings. We conclude that the D292 residue, by increasing the local K+ concentration, is critical for both ion conduction and channel opening.
MATERIALS AND METHODS
Molecular Biology, Oocyte Preparation, and cRNA Injection
The following cDNAs were used for measurements of ionic and gating currents: Shaker-IR (Shaker channel with N-type inactivation removed: Shaker H4 Δ6-46) (Hoshi et al., 1990), Shaker-IR-D447N, hSlo (Wallner et al., 1995), hSlo-D292N, hSlo-R207Q, and hSlo-R207Q-D292N. The cDNAs were translated in vitro (mMESSAGE mMACHINE; Ambion), and the cRNA injected into Xenopus laevis oocytes (stage V–VI). 24 h before cRNA injection, the oocytes were treated with collagenase (200 U/ml GIBCO) in a Ca2+-free solution in order to remove the follicular layer. Oocytes were injected with 50 nl cRNA (0.02–0.2 μg/μl) using a “nano-injector,” and maintained at 18°C in modified Barth's solution containing (mM) 100 NaCl, 2 KCl, 1.8 CaCl2, 1 MgCl2, 5 Na-HEPES (pH 7.6), and 50 mg/ml gentamycin.
Solutions, Electrophysiological Recordings, and Analysis
Cut-Open Oocyte Voltage Clamp.
Ionic and gating currents were recorded 1 to 5 d after cRNA injection, using the cut-open Vaseline gap voltage clamp (Stefani and Bezanilla, 1998). The external solution was (mM) 110 Na-methanesulphonate (Na-MES), 2 Ca(MES)2, 10 HEPES. The internal solution was (mM) 120 K-MES, 10 HEPES. Intracellular micropipettes were filled with (mM) 2700 Na-MES, 10 NaCl. All solutions were buffered to pH 7.0. Low access resistance to the oocyte interior was obtained by permeabilizing the oocyte bottom with 0.1% saponin. Currents were recorded unsubtracted or using a P/−4, −6 subtracting protocol; the subtracting holding potential (SHP) was 0 or −120 mV depending on the pulse protocol applied.
Patch Clamp Recordings.
Recordings were performed with conventional patch clamp techniques in the inside-out patch configuration. Single channel activity was recorded at 0 mV with various internal free Ca2+ concentrations. The external solution was (mM) 115 Na-MES, 5 KCl, 10 HEPES, 5 HEDTA, the internal external solution (mM) 115 K-MES, 5 KCl, 10 HEPES. To obtain different Ca2+ concentrations, varying amounts of CaCl2 was added to the internal solution. Free Ca2+ was measured with a Ca2+ electrode (World Precision Instruments). Gating currents were recorded in (mM) 110 N-Methyl-d-glucamine (NMG)-MES, 10 KCl, 10 HEPES, and 5 HEDTA buffered to 1.5 μM free Ca2+ (internal) and 115 tetraethylammonium (TEA)-MES, 5 TEA-Cl, 10 HEPES, and 5 HEDTA buffered to 1.5 μM free Ca2+. For single channel experiments in varying symmetrical K+ concentration, external and internal solutions contained (mM) 5 KCl, 10 HEPES, and K-MES to desired concentrations. Solutions were buffered to pH 7.0. Pipette resistance for macroscopic and gating current measurements was 0.5–3 MΩ, and for single channel measurements 10–60 MΩ. All experiments were performed at room temperature (22–24°C). The filter cut-off frequency was 1/5 of the sampling frequency. Values are reported as mean ± SEM.
Single Channel Data Analysis.
Single channel records were analyzed with TRANSIT (vanDongen, 1996) and analysis programs developed in the laboratory. Single channel open probability from multiple channel membrane patches was obtained from Imean/Ni, where Imean is the mean current, and N is the number of channels estimated from the limiting values of Po and of the single channel amplitude, i, at the maximum applied voltage.
Nonstationary Noise Analysis.
Ensemble traces of macroscopic current were recorded in inside out membrane patches in 120 mM symmetrical K-MES and 1.5 μM free Ca2+. Current traces were acquired at a minimum frequency of 200 kHz and filtered at 40 kHz. To obtain the mean current, the linear leak and the capacitance transients were subtracted off-line with a subtracting pulse from −100 mV to −50 mV. Nonstationary variance was obtained by subtracting pairs of subsequent records (Sigworth, 1980). Variance was plotted versus the mean current and fitted to the theoretical variance function σ2(t) = I(t)i − (I(t)2/N), where σ2 is the variance, I the mean current, i the single channel current, and N the number of channels. The maximum Po was calculated from the maximum mean current: Po = Imax/(iN).
RESULTS
The D to N Pore Mutation Does not Prevent Conduction in hSlo channels
In the previous paper (Part I, Haug et al., 2004), we have shown that the D292N mutation reduces the single channel conductance of hSlo BKCa channels by ∼40%. In this paper, we have analyzed the role of this residue on voltage and Ca2+ dependence of channel opening and associated gating currents.
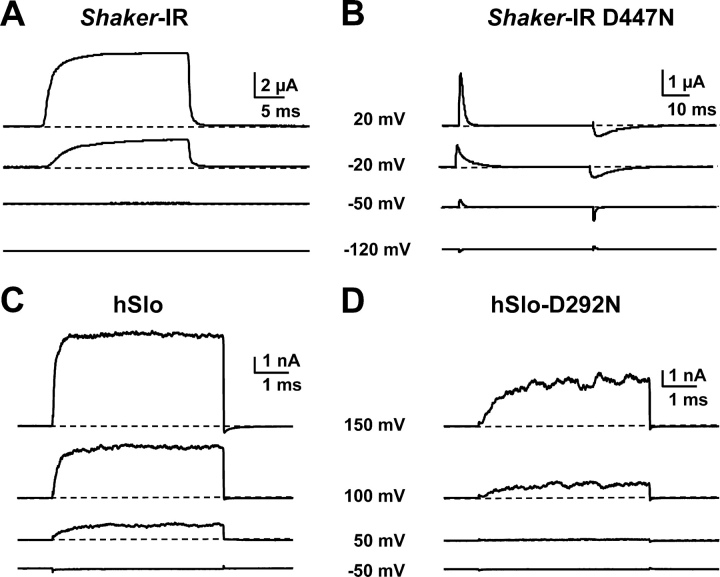
Fig. 1 A shows examples of outward K+ currents recorded with the cut-open oocyte voltage clamp technique (COVG) from an oocyte expressing NH2 terminus deletion of Shaker H4 Δ6–46 channels (Sh-IR, inactivation removed). Currents were elicited by a 20-ms pulse to varying potentials (indicated next to the traces) from −90 mV holding potential (HP). While depolarizations to −20 and +20 mV elicited large ionic current in the Sh-IR channel, the same voltage steps produced only gating current in the Sh-IR D447N channel (Fig. 1 B). Gating currents are seen as upward and downward deflections at the beginning and end of the pulse (Hurst et al., 1996). Fig. 1 C shows outward current recordings in inside-out excised patches (1.5 μM internal free Ca2+) from an oocyte expressing hSlo channels. Currents were elicited with varying voltage steps as indicated for each trace from 0 mV HP. An identical pulse protocol evoked ionic currents also in the hSlo-D292N channel, but the ionic current activation was much slower and was detected at more positive pulse potentials (Fig. 1 D). The fact that this mutant conducts suggests that, despite the large degree of similarity in the amino acid sequences of Shaker and hSlo pore regions (18 of 33 similar or identical amino acids), the two pores arrange into a different structure. In the following section, we have examined changes in channel opening and charge movement induced by the hSlo-D292N mutant.
Figure 1.
The D447N pore mutation prevents conduction in Shaker K+ channel, while the corresponding D292N pore mutation in hSlo channel allows conduction. (A) Outward K+ current recorded with the cut open oocyte voltage clamp, from oocytes expressing Sh-IR; the current was elicited by voltage pulses as indicated for each trace, from an HP of −90 mV. (B) Current records from an oocyte expressing Sh-IR D447N channels. The fast upward and downward deflections at the beginning and end of the voltage pulses are the gating currents recorded unsubtracted during depolarizations from HP = −90 mV to the indicated potentials. (C and D) Typical current records from inside-out membrane patches from oocytes expressing hSlo and hSlo-D292N respectively, with 1.5 μM internal free Ca2+. HP was 0 mV. Current records were obtained 2 d (hSlo) and 4 d (hSlo-D292N) after oocyte injection; the amount of cRNA for hSlo-D292N was also 10 times higher than for hSlo. Note that the same voltage step elicited a larger and faster activating ionic current in wild-type hSlo than in the D292N mutant.
The D292N Mutation Changes the Voltage Dependence of the Activation
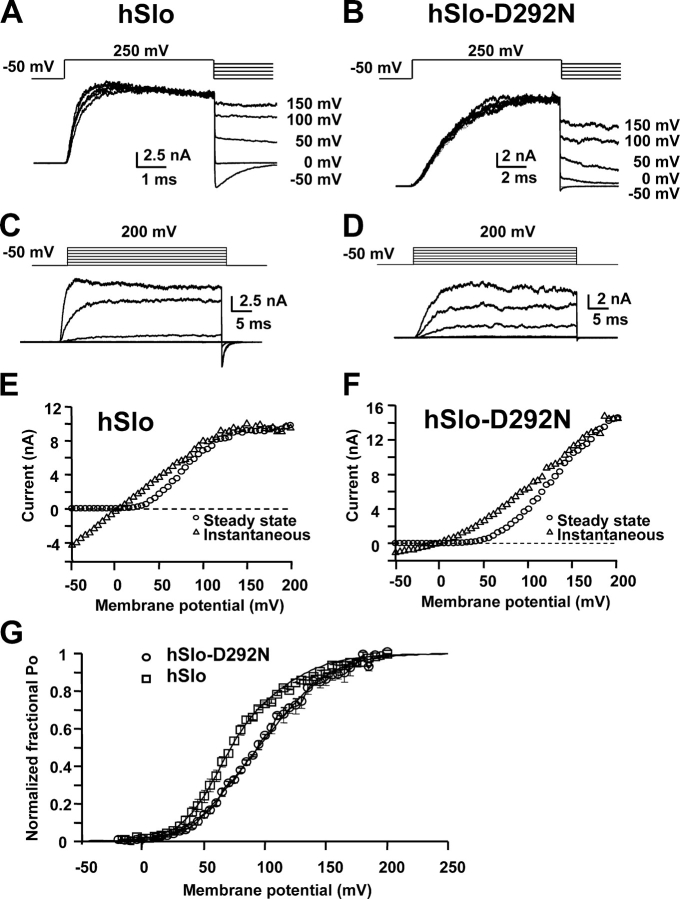
Fig. 1 (C and D) shows that hSlo-D292N channels seem to require stronger depolarization for activation than wild-type channels. To investigate this point, we determined the voltage dependence of channel opening in hSlo and hSlo-D292N channels. Since BKCa channels show a voltage-dependent block at very positive potentials due to divalent cations (Diaz et al., 1996) and the D292N mutation introduced a significant outward rectification (Part I, Haug et al., 2004), the voltage dependence of activation curves were constructed taking into account the nonlinear single channel current–voltage (I–V) relationship. The fractional open probability–voltage (fPo–V) curves were obtained by dividing the steady-state I–V curve by the instantaneous I–V curve obtained from peak tail currents at various voltages after a preceding pulse to 250 mV. In this condition I–Vsteady-state/I–Vinstantaneous = N·i(V)·Po(V)/N·i(V)·Po(V = 250 mV) = Po(V)/Po(V = 250 mV), where N is the number of channels in the patch, and i(V) and Po(V) are the single channel current amplitude and open probability as a function of voltage, respectively. Po(V)/Po(V = 250 mV) is the fractional open probability (fPo) normalized to the limiting Po value at 250 mV (Po(V = 250 mV)) (Fig. 2 G).
Figure 2.
Shift to more depolarized potentials of the voltage activation curve by the D292N mutation. (A and B) Current traces elicited by pulses to 250 mV followed by repolarizations to the indicated potentials, for hSlo (A) and hSlo-D292N (B). (C and D) Current traces elicited by 40-ms voltage steps to −50, 0, 50, 100, 150 mV from HP-50 mV (same patches as in A and B). (E and F) Instantaneous (Δ) and steady-state (○) I–V relationships for hSlo (E) and hSlo-D292N (F). The instantaneous I–V curve was measured in tail currents 40 μs after repolarization. hSlo channels have a more pronounced voltage-dependent block at positive potentials for both steady and tail currents. On the other hand, hSlo-D292N channels have a strong reduction of the instantaneous conductance at potentials more negative than +50 mV. (G) fPo vs. voltage relationship for hSlo (○) and hSlo-D292N (Δ). Averaged data points (n = 3) were fitted to a double Boltzmann distribution. The parameters of the fitting are Z1 = 1.7, Z2 = 1.1, V1/21 = 61 mV, V1/22 = 111 mV, A1 = 0.65 (hSlo) and 0.30 (hSlo-D292N), A2 = 0.35 (hSlo) and 0.70 (hSlo-D292N). Inside-out membrane patches in 120 mM symmetrical K+ and 1.5 μM free [Ca2+].
Fig. 2 (A–D) shows a family of ionic currents to determine the instantaneous (A and B) and steady (C and D) I–V relationships. Experiments were performed in inside out patches in symmetrical 120 mM K-MES and 1.5 μM free Ca2+ (AC hSlo; BD hSlo-D292N). The steady-state (○) and instantaneous (Δ) I–V curves are displayed in Fig. 2 E (hSlo) and F (hSlo-D292N). The I–V curves show that the voltage-dependent block at positive potentials is more pronounced in the hSlo wild-type channel, and the D292N mutant showed a reduction of the instantaneous inward conductance at potentials more negative than +50 mV, as also described in Part I (Haug et al., 2004).
The fPo–V curves (Fig. 2 G) show that hSlo-D292N channel activation had shallower voltage dependence and was shifted toward more positive potential with respect to the wild-type channels. Both activation curves could be simultaneously well fitted by the sum of two Boltzmann distributions by changing the relative amplitude of their components (A-1 and A-2), while the slope factors (z-1 and z-2) and the half activation potentials (Vhalf-1 and Vhalf-2) were identical in both channels. The main finding is that hSlo-D292N has a reduced relative contribution of the more negative component (Vhalf-1 = 61.1 mV) of the activation curve, which has the steepest voltage dependence (z-1 = 1.7 vs. z-2 = 1.1). As a result, the fPo–V curve in hSlo-D292N channels becomes shallower and right shifted.
The simplest explanation for this initial observation is that the mutation reduced the voltage-dependent population of an open state with steeper and more negative voltage sensitivity. Since channel opening in hSlo channels is associated with gating current slower components, in the following section, we have compared gating properties in hSlo and hSlo-D292N channels (Horrigan and Aldrich, 2002).
Charge Displacement Seems Less Efficient to Open Channels in the hSlo-D292N than in hSlo
hSlo ionic and gating currents could not be adequately recorded in isotonic K+ solutions since the channel expression level required for gating current measurements generated large ionic currents that could not be voltage clamped. This problem was circumvented by reducing internal and external K+ concentration to 10 mM (in NMG-MES) in 1.5 μM free Ca2+. Fig. 3 A shows subtracted records of ionic and gating currents in hSlo-D292N for a pulse from −50 mV HP to 50 mV. The trace shows ON gating current as the transient upward deflection at the beginning of the depolarization. The fast ON gating current is followed by a slowly rising ionic current of comparable size. After returning to −50 mV, the inward tail current reflects mainly the OFF gating current. Fig. 3 B shows an equivalent experiment in hSlo superimposed to hSlo-D292N. In hSlo channels, the much larger ionic current almost completely masks the gating current. Fig. 3 B also shows at the same gain the current trace from hSlo-D292N in A. It is obvious that for a charge movement of equivalent amplitude, ionic currents are much larger in hSlo channels. This is illustrated in Fig. 3 C, which shows an enlarged view of the onset of the pulse (Fig. 3 B, inset), demonstrating the reduced ionic current in hSlo-D292N when compared with hSlo for a similar charge movement. The gating current amplitude in hSlo is overestimated since it is contaminated by the time-dependent rise of the outward K+ current, reinforcing the view that in the hSlo-D292N channels, the ratio between the ionic currents and gating currents is much smaller than in the hSlo WT channels.
Figure 3.
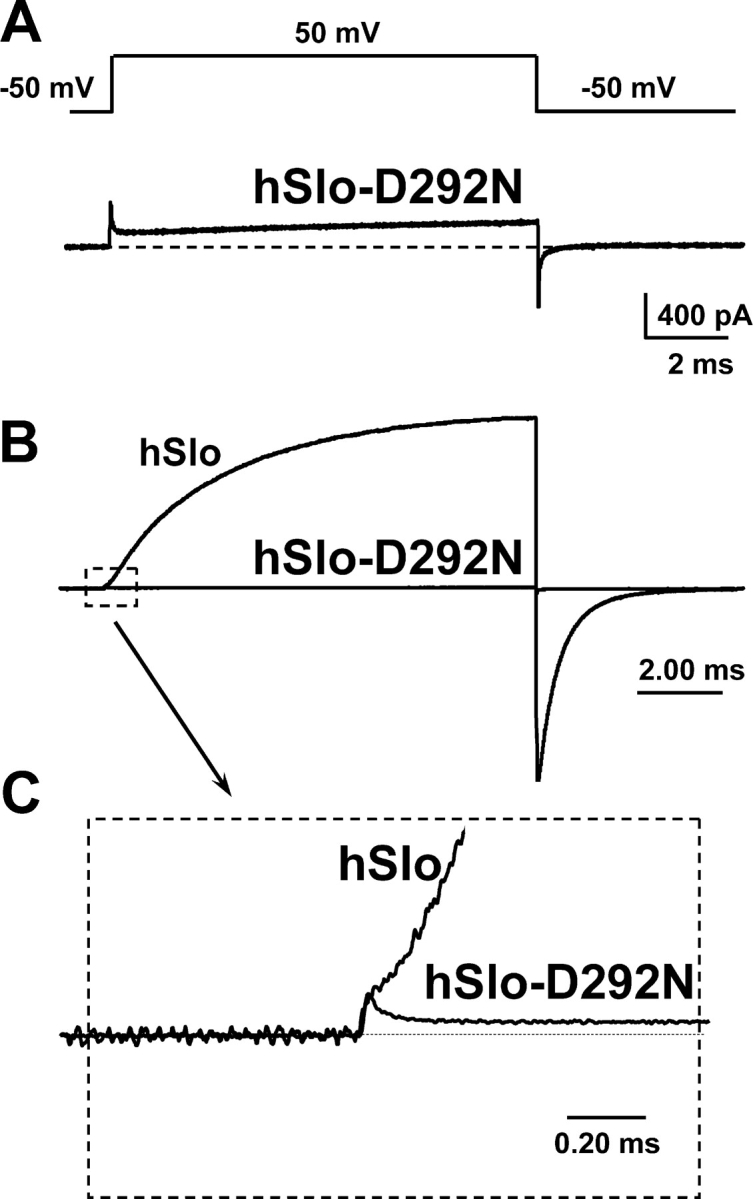
The D292N mutation reduces the coupling between voltage sensor movement and pore opening. (A and B) Current recordings from inside-out patches expressing hSlo-D292N and hSlo. The currents were elicited by a voltage pulse to 50 mV, from an HP of −50 mV, and the linear component of the current was subtracted off-line (subtracting pulse was to −150 mV from −100 mV). (B) The traces of both hSlo and hSlo-D292N superimposed and normalized to the size of the gating current. The inset (C) shows the ON gating current from B on an enlarged scale. Note that, in proportion, a similar charge displacement elicits a much smaller ionic current in hSlo-D292N than in hSlo. Recordings performed in 110 mM NMG-MES, 10 mM KMES, and 1.5 μM free Ca2+.
Since gating current size provides a rough estimate of the number of channels in the patch, our finding that gating currents of similar size are followed by very large (hSlo) or very small (hSlo-D292N) ionic currents eliminates the possibility that the observed difference in the size of macroscopic current is due to lower expression of hSlo-D292N channel. In addition, the dramatic reduction in ionic current cannot be explained solely by the ∼40% reduction of single channel conductance of the mutant channel (Part I, Haug et al., 2004). Thus, it seems that an equivalent charge displacement will open fewer channels, and with a lower Po, in hSlo-D292N than in hSlo wild type. To further characterize the relationship between charge movement and pore opening in hSlo and hSlo-D2092N channels, we have studied the properties of gating current in both channels.
The Voltage Dependence of Charge Movement is not Significantly Affected by the D292N Mutation
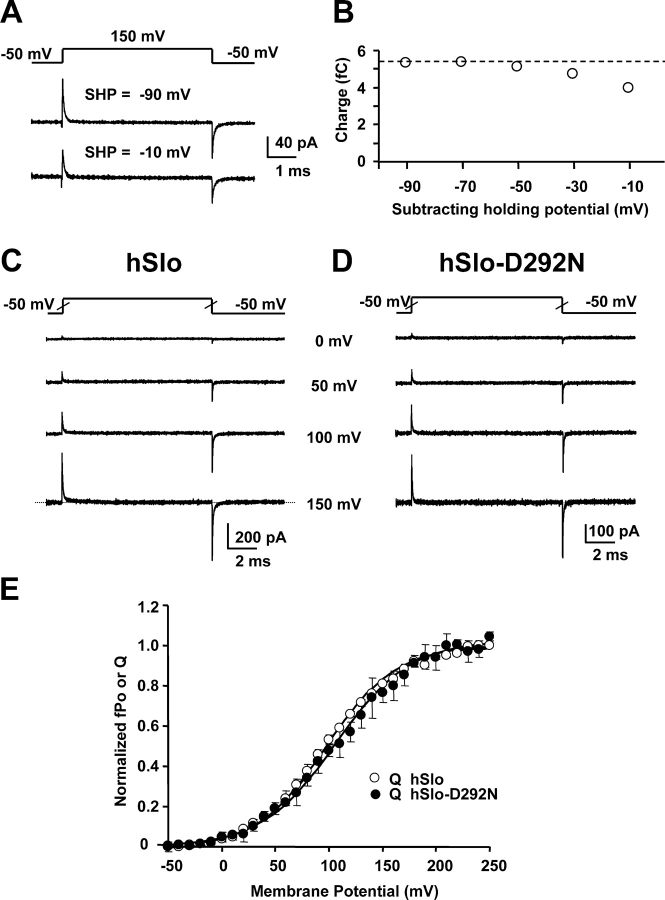
Gating current measurements require the subtraction of the membrane current linear components, which are obtained from subtracting pulses in a potential range where no gating currents are elicited. We assessed various subtraction protocols to select which one has only linear components and do not distort gating currents. To evaluate the distribution of the nonlinear charge movement, membrane currents elicited by a constant pulse from −50 mV to 150 mV were scaled subtracted with currents elicited with a −100-mV pulse from different increasingly negative SHPs starting at −90 mV. These measurements were performed in symmetrical 120 mM TEA-MES with 1.5 μM free Ca2+ that eliminates the ionic conduction. Fig. 4 A illustrates the reduction of gating current amplitude with −10 mV SHP when compared with −90 mV SHP. This indicates that the subtracting pulse from −10 mV SHP moved a fraction of nonlinear charge. To evaluate the voltage distribution of charge movement, the time integral of gating currents was plotted versus the SHP (Fig. 4 B). The graph shows that charge movement amplitude increases as the SHP was made more negative, and it reaches a plateau for SHPs more negative than −50 mV. The hSlo-D292N channel showed similar results. Thus, in our experimental conditions, we used negative subtracting pulses from −100 mV SHP.
Figure 4.
The Q–V curves in hSlo and hSlo-D292N. (A) Gating current recordings from inside-out patches expressing hSlo, in symmetrical 120 mM TEA-MES and 1.5 μM free Ca2+, elicited by voltage pulses (shown above the recordings) from −50 mV to 150 mV. The linear capacity transients were subtracted off-line by using different SHPs, as indicated for each trace. (B) Plot of the absolute value of the time integral of OFF gating currents vs. SHP for hSlo. Identical results were obtained for hSlo-D292N. Note that for SHP negative to −50 mV, the charge remains unchanged. (C and D) Gating currents recorded from inside-out patches from oocytes expressing hSlo (C) and hSlo-D292N (D), in symmetrical 120 mM TEA-MES, with 1.5 μM free Ca2+. The currents were elicited by 10-ms voltage steps to the indicated voltages. Each trace is subtracted with a subtracting pulse from a holding of −100 mV to −150 mV. (E) Averaged and normalized Q–V curves estimated from the OFF gating current for hSlo (○) and hSlo-D292N (•) (n = 3 ± SEM). Curves were normalized to the mean charge calculated for voltage steps to 230 mV, 240 mV, and 250 mV. The two Q–V curves were fitted to a single Boltzmann distribution in the form 1/(1+exp(zF(Vhalf − V)/ RT)), where F, R, and T are the usual thermodynamic parameters. Parameters fitting were for hSlo: Vhalf = 96 mV and z = 0.77, for hSlo-D292N: Vhalf = 106 mV and z = 0.74.
Fig. 4 C shows gating currents at varying potentials for hSlo (C) and hSlo-D292N (D) channels. The traces show that gating current time course for potentials up to 100 mV are very similar in both hSlo and hSlo-D292N. However, at potentials close to the limiting Po value (+150 mV; Fig. 2 G), ON and OFF gating in the hSlo channel have a more pronounced slower component of decay than in the hSlo-D292N channel (Fig. 5). Charge–voltage (Q–V) curves were calculated by plotting the OFF gating charge at each potential as function of voltage. Charge displacement in both clones have ON and OFF equality, however, in some cases at very high potentials, ON gating currents can be contaminated by outward ionic currents. Thus, Q–V curves were obtained by plotting the OFF gating charge. The fact that Q–V curves saturate at very positive potentials indicates the adequacy of the measurements and the lack of significant ionic current contamination. Fig. 4 E shows that normalized Q–V curves for hSlo (○) and hSlo-D292N (•) were practically superimposed. The finding that the Q–V curves were practically identical in both the wild-type and mutant clone indicates that the D292N mutation does not significantly affect the overall voltage dependence of the voltage sensor. The right shift of the fPo–V in hSlo-D292N channels could be related to the reduction of the gating current slow components that is associated with transitions to open states (Horrigan and Aldrich, 1999, 2002), and as the charge movement slow components carry relatively little charge, its reduction in the hSlo-D292N channel would not significantly modify the Q–V relationship.
Figure 5.
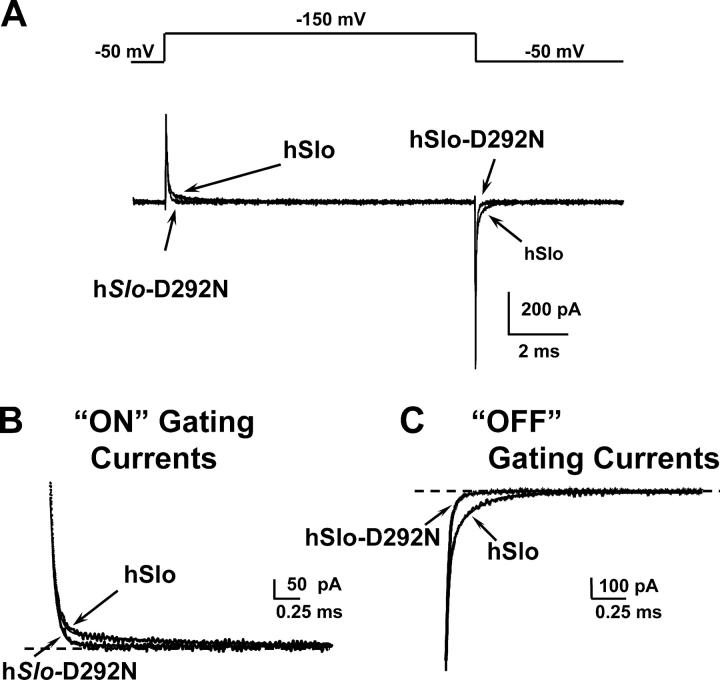
The slow component of gating currents is reduced in the hSlo-D292N channel. (A) Gating current traces for hSlo and hSlo-D292N for a pulse from −50 mV to 150 mV. (B) ON gating currents (inset of A) with τfast = 0.052 ms and τslow = 1.1 ms; the slow component amplitude was reduced from 70% in hSlo to 25% in hSlo-D292N. (C) OFF gating currents (inset of A) with superimposed fits: τfast = 0.022 ms, τmedium = 0.083 ms, τslow = 0.350 ms, for both clones; the relative amplitudes of the components were Afast = 51%, Amedium = 35%, and Aslow = 14% for hSlo, and Afast = 89%, Amedium = 10%, and Aslow = 1% for hslo D292N. Gating current recordings in 120 mM TEAMES and 1.5 μM free Ca2+.
Reduction of ON Gating Current Slow Component in hSlo-D292N Channels
BKCa ON gating currents measured in the mSlo clone in internal nominal “0” Ca2+ (0.8 nM) showed a fast and slow component with time constants of 63 μs and 4.22 ms (Horrigan and Aldrich, 1999). We found similar fast and slow components in ON and OFF hSlo gating currents in 1.5 μM internal Ca2+. Since in an allosteric model of BKCa channel activation, gating current slow components are associated with transitions involving open states, and hSlo-D292N channels have a much lower Po (see below), we compared gating current components in hSlo and hSlo-D292N channels. Fig. 5 (A–C) illustrates superimposed traces of gating currents in hSlo and hSlo-D292N channels for a pulse from −50 mV to +150 mV. hSlo ON and OFF gating currents relaxed with two components for ON gating currents and three for OFF gating currents. Fig. 5 B shows superimposed traces and fitted curves for ON hSlo and hSlo-D292N gating currents with the same fast (52 μs) and slow (1.1 ms) time constants, but in the hSlo-D292N, the relative contribution of the slow component to the total charge was reduced from 70 to 25%. OFF gating currents were fitted with the sum of three exponential functions with the same time constant values for both clones (τfast = 0.022 ms, τmedium = 0.083 ms, τslow = 0.350 ms) but with a 10-fold reduction of the slow component in hSlo-D292N channel.
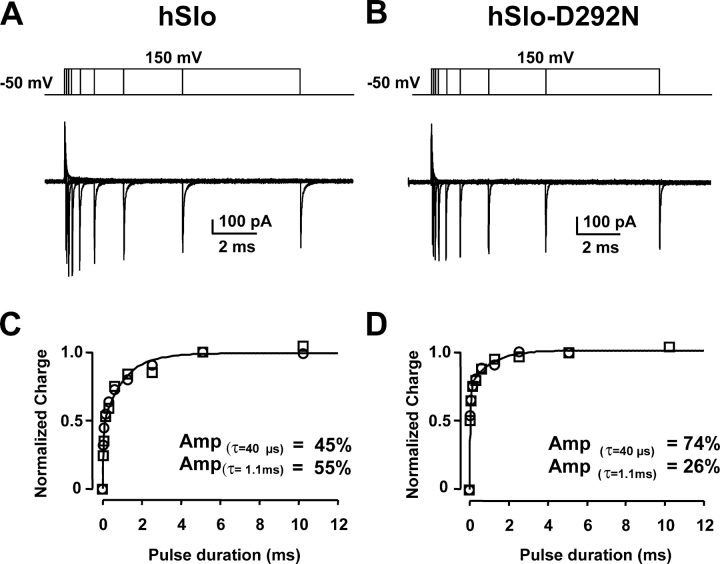
To further characterize the differences in gating current components in hSlo and hSlo-D292N channels, we measured OFF charge movement following pulses of different durations. In this protocol, OFF charge amplitude corresponds to the charge that has moved during the preceding pulse depolarization. OFF gating currents at negative potentials can be accurately measured since they are much faster than ON gating current and their measurements are less dependent on the baseline during depolarizing pulses, which may have contamination of outward ionic currents. Fig. 6 (A and B) shows superimposed gating current traces for hSlo (A) and hSlo-D292N (B), with the voltage protocol displayed above the traces. OFF charge amplitude as a function of the pulse duration is plotted for two different sets of data for each clone in Fig. 6 (C, hSlo, and D, hSlo-D292N). The total charge displaced increased with pulse duration following a bi-exponential time course. The envelope of the OFF gating charge was fitted by the sum of two exponential functions, with the same fast and slow time constants (τfast= 40 μs, τslow = 1.1 ms). The relative contribution of the charge movement slow component diminished from 55% in the hSlo to 26% in hSlo-D292N. These values are very similar to the ones obtained by directly fitting ON gating currents (Fig. 5 B), reinforcing the view that hSlo-D292N channels have a reduced ON charge slow component. This is consistent with the idea that the slow gating current component reflects transitions involving open states (Horrigan and Aldrich, 1999). We can conclude that the D292N mutation greatly reduces the slower component of ON and OFF gating currents, which can be associated with transitions to open states and could be the basis for the reduced channel opening with voltage in hSlo-D292N channels.
Figure 6.
Reduction of the charge movement slow component in the hSlo-D292N channel. OFF gating currents in hSlo (A) and hSlo-D292N (B) elicited by voltage pulses from HP −50 mV to 150 mV of increasing durations, ranging from 40 μs to 10.2 ms. (C and D) OFF charge from two experiments as in A and B plotted as a function of the pulse duration. Data were normalized to the charge displaced by the 5.1-ms pulse and fitted to a bi-exponential function with a single fast (40 μs) and slow (1.1 ms) time constant. The charge movement slow component was reduced from 55% in hSlo to 26% in hSlo-D292N. Gating current recordings in 120 mM TEAMES and 1.5 μM free Ca2+.
Reduction of OFF Gating Current Slow Component in hSlo-D292N Channels
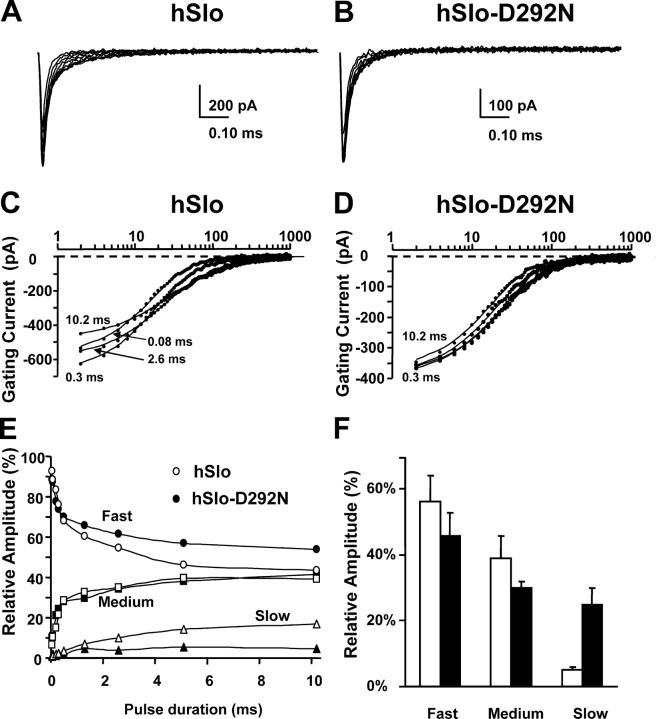
To further characterize the changes induced by the D292N mutation in the relationship between charge movement and pore opening, we have analyzed the kinetics of the three components of OFF gating currents (Fig. 5 C) with the framework of the recent allosteric model for BKCa channel gating (Horrigan and Aldrich, 1999). This model predicts that OFF gating current relaxation after a large depolarization that maximally populates open states will display fast, medium, and slow components related to C–C, O–O, and O–C transitions, respectively.
The experiments in Fig. 7 confirm the observations of Horrigan and Aldrich (1999) for hSlo wild-type clone and reveal a significant reduction of the slow component of the OFF gating current in hSlo-D292N when compared with hSlo. Fig. 7 (A and B) shows OFF gating currents following depolarizations to 150 mV of increasing durations. The slow component of the OFF hSlo-D292N gating current is significantly reduced. OFF gating currents from the two clones were simultaneously fitted by the sum of three exponential functions. Fig. 7 (C and D) shows in a semilog plot selected traces from A and B with the superimposed fits. The relative amplitude of the three components of the OFF gating current varies with the pulse duration and is plotted in Fig. 7 E. In hSlo, the relative amplitude of the slow and middle component increases with the pulse duration, while the contribution of the fast component is reduced (Fig. 7 D, open symbols). A similar pattern is shown for hSlo-D292N, but the amplitude of the slow component rapidly saturated for brief depolarizations (1 ms), and its steady-state value was significantly reduced. The reduction of the slow component provides an indication of a reduced population of open states, which is in agreement with a lower Po in hSlo-D292N (see Fig. 9). The reduction of the slower component of the OFF gating current in quasi steady-state condition (10.2-ms pulse) is illustrated in the bar graph in Fig. 7 F. In summary, the reduction in hSlo-D292N gating current slow component together with the increase in the gating current fast component suggest that hSlo-D292N channels deactivate mainly from closed states due to their low Po.
Figure 7.
OFF gating current components with different pulse durations. (A and B) Superimposed OFF gating currents following different pulse durations (0.04 ms to 10.2 ms) in hSlo and hSlo-D292N as shown in Fig. 6 (A and B). Note the more prominent slow components in hSlo. (C and D) Selected traces from A and B with superimposed fits to the sum of three exponential functions. (D) Relative amplitudes of fast, slow, and medium components as function the pulse durations for hSlo (open symbols) and hSlo-D292N (filled symbols) with τfast = 0.017 ms, τmedium = 0.062 ms, and τslow = 0.278 ms for both clones. Note that the amplitude of the slow component was greatly diminished in hSlo-D292N. (E) Average values in hSlo (n = 6) and hSlo-D292N (n = 9) of the relative amplitude of fast, medium, and slow OFF gating current components at −50 mV following a 10.2-ms pulse to 150 mV. Time constant values were: hSlo, τfast = 0.020 ± 0.003 ms, τmedium = 0.062 ± 0.01 ms, and τslow = 0.371 ± 0.140 ms; hSlo-D292N, τfast = 0.019 ± 0.003 ms, τmedium = 0.059 ± 0.007 ms, and τslow = 0.333 ± 0.054 ms.
Figure 9.
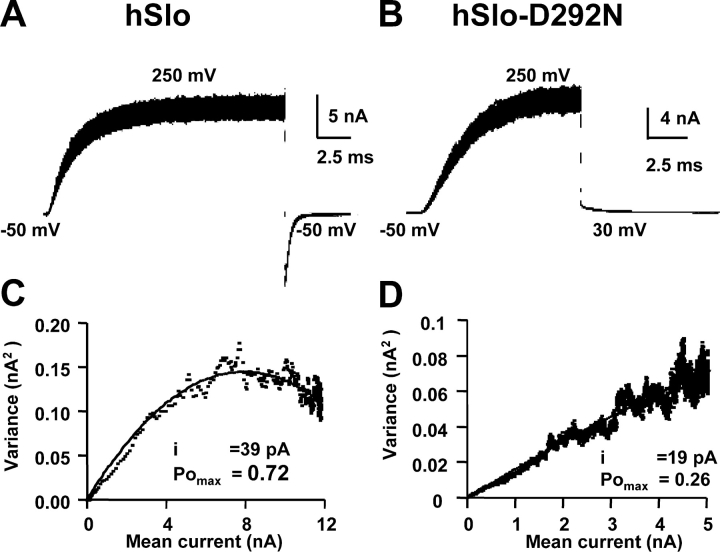
Variance analysis shows a reduced limiting Po for the mutant hSlo-D292N channels. (A and B) Superimposed K+ current traces (100) recorded with pulses from −50 mV to 250 mV in 120 symmetrical K-MES with 1.5 μM free Ca2+ from hSlo (A) and hSlo-D292N (B). (C and D) Variance–mean current plots in two other patches for hSlo (C) and hSlo D292N (D). Data points were fitted to σ2(t) = I(t)i − (I(t)2/N), where σ2 is the variance, I the mean current, i the single channel current, and N the number of channels. Values were for hSlo POmax = 0.72, i = 39 pA, and N = 419, and for hSlo-D292N POmax = 0.26, i = 19 pA, and N = 1,000.
hSlo-D292N Channels Show Reduction of Single Channel Conductance and No Changes in Ca2+ Sensitivity
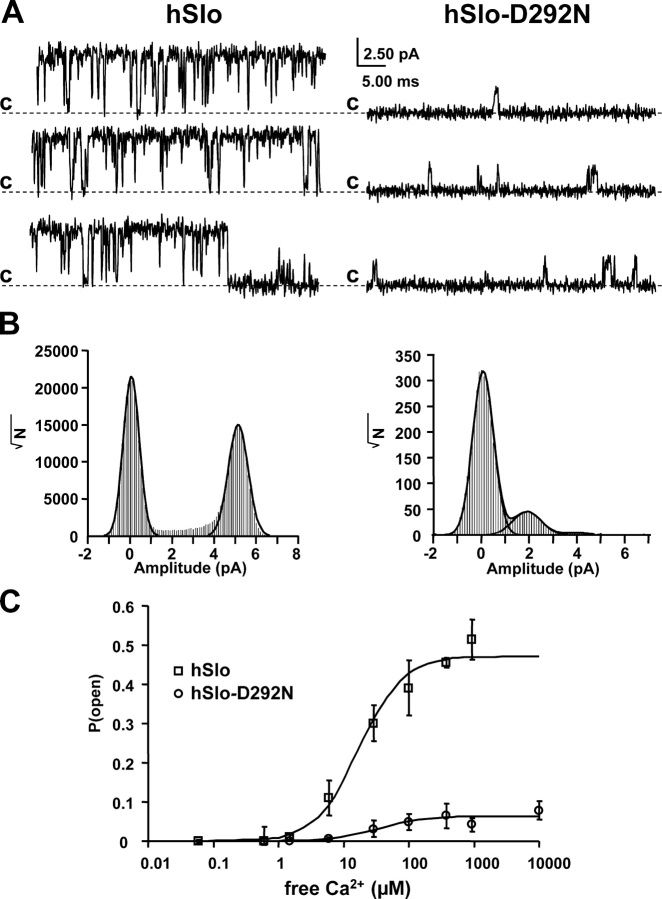
We have previously shown that gating currents of similar size are associated with large ionic currents in hSlo and very small ionic currents in hSlo-D292N (Fig. 3). To characterize the mechanism of this current reduction, we have measured in hSlo and hSlo-D292N single channel conductance and the limiting Po values at saturating internal Ca2+ concentrations and depolarizing voltages. Fig. 8 shows single channel recordings of hSlo (A) and hSlo-D292N (B) at 0 mV with asymmetric K+ concentrations (120 mM K+ internal and 5 mM K+ external) and 400 μM [Ca2+]i. hSlo channels show high Po values with long openings (upward deflections), while hSlo-D292N channels have small Po values with brief openings and ∼40% reduction of single channel amplitude (Part I, Haug et al., 2004). The total point histogram (Fig. 8 B) illustrates both the reduction in single channel amplitude (hSlo 5.1 pA, hSlo D292N 1.9 pA) and Po, as indicated by the large reduction of the area of the right peak representative of the open state.
Figure 8.
The Po at limiting [Ca2+]i at 0 mV is significantly lower in hSlo-D292N than in hSlo. (A) Single channel activity from inside out patches of oocytes expressing hSlo (left) and hSlo-D292N (right) channels. Recordings at 0 mV, in asymmetric K+ concentration ([K+]o = 5 mM, [K+]i = 120 mM) with 400 μM free [Ca2+]i. (B) Total point histograms from the experiment in A. (C) Po vs. [Ca2+]i plot at 0 mV for hSlo and hSlo-D292N. Each point is the average of three patches of hSlo channels and six membrane patches for hSlo-D292N channels. The data were fitted to the Hill equation (Po = MaxPo/(1+(K1/2/[Ca])n)), with n = 1.3, MaxPo = 0.06 D292N, and n = 1.7, MaxPo = 0.47 for WT. K1/2 = 19.5 μM for both channels.
Fig. 8 C shows Po–Ca2+ curves at 0 mV from 0.06 μM to 10 mM in the two clones. Both Ca2+ activation curves were fitted to the Hill equation (Po = PoMax/(1 + (K1/2/[Ca])n, continuous lines), with a common K1/2 = 19.5 μM and a Hill coefficient (n) of 1.7 for hSlo and 1.3 for hSlo-D292N. The main difference was a dramatic reduction of PoMax from 0.48 in hSlo to 0.06 in hSlo-D292N. These results indicate that the D292N mutant retains its Ca2+ sensing properties unchanged, but when the Ca2+ binding site is saturated, it opens with a very low probability, resulting in small macroscopic ionic currents.
D292N Mutation Reduces the Limiting Po of the hSlo Channel
To define the limiting Po value of hSlo-D292N channels, we performed nonstationary variance-mean analysis at saturating depolarizations for the fPo–V curve (Sigworth, 1980). Fig. 9 (A and B) shows 100 superimposed traces for pulses from −50mV to 250 mV in hSlo (A) and hSlo-D292N (B). As previously shown in Fig. 1, hSlo channels have a faster activation time course. Fig. 9 (C and D) is the variance versus mean plot for hSlo and hSlo-D292N channels. Data points were fitted to the theoretical variance function σ2(t) = I(t)i − (I(t)2/N), where σ2 is the variance, I the mean current, i the single channel current, and N the number of channels. The maximum Po (PoMax), calculated from PoMax = Imax/(iN), where Imax is the peak current during the pulse, was 0.71 ± 0.07 (n = 3) for the hSlo channel, while it reached only 0.17 ± 0.05 (n = 5) in the pore mutant. This analysis confirmed the reduction in single channel current amplitude, which at 250 mV was 41 ± 1 pA (n = 3) in hSlo and 17 ± 4 (n = 5) pA in hSlo-D292N. Similar results in Po were obtained for depolarization to 100, 150, and 200 mV. We can conclude that the D292N mutation reduces the gating current slow component and prevents full channel opening at limiting internal Ca2+ concentration and positive voltages.
DISCUSSION
The salient changes in channel function caused by the D292N mutation in the hSlo channel are a drastic reduction in the limiting Po values at high voltages, a shift to more depolarized potentials of the voltage dependence of channel opening, and a reduction of single channel conductance. These changes occur without significant modification in the channel Ca2+ sensitivity or in the voltage dependence of the movement of the voltage sensor. The shift to more depolarized potentials of the activation curve by the D292N mutation indicates a destabilization of the open state. hSlo and hslo-D292N activation curves were adequately fitted with the sum of two Boltzmann distributions with the same slope factor and by changing their relative amplitudes. The steeper and more negative component of the activation curve was drastically reduced by the D292N mutation (from 0.65 to 0.30), suggesting that the population of open states that occurs early in the activation pathway is reduced by the mutation. This change in the relative amplitude of the initial steeper component produces an overall shallower activation curve.
A careful analysis of gating current kinetic properties demonstrated that slow components of hSlo-D292N were greatly reduced. The fact that the hSlo gating current slow components are a small fraction of the total charge may explain why the reduction of these components is not reflected in the steady-state Q–V curves, which were not significantly different in hSlo and hSlo-D292N channels. These observations agree with the idea that a large fraction of hSlo charge movement that constitutes the fast component occurs in transitions between closed states before channel opening. The fact that hSlo-D292N channels have much lower limiting Po values than the wild-type channel either at limiting [Ca2+]i or at very depolarized potentials (+250 mV) (Figs. 8 and 9) further indicates that the D292 residue is critical to facilitate transitions to open states.
What remains to be explained is how a pore mutation that destabilizes the open state results in the reduction of the gating current slow components, which are reflecting gating charge movements in transitions to open states. In Part I, we have shown that the neutralization of the negative D292 residue (located outside, but in the near proximity of the selectivity filter) reduces the single channel conductance by the destabilization of K+ binding in the selectivity filter due to a reduction of the local K+ concentration (Part I, Haug et al., 2004). As a consequence, the lack of K+ in the pore region would cause an impairment of the channel gate. The inability for the channel to open would be reflected at the level of gating current, with the reduction in the slow component (associated to channel opening). This is an interesting hypothesis that implies a fairly rigid coupling between voltage sensor movement and pore opening; however, a single mechanism (the reduction in surface charge density) can explain all the effects observed in the D292N mutant.
On the other hand, it can also be postulated that the D292N mutation induces allosteric changes in the gating machinery that couples the movement of the voltage sensor with the internal gate located in the cytoplasmic region of the S5 and S6 segments. In this case, voltage-dependent conformational changes in these segments generate the gating current slow components that trigger long channel openings. In fact, BKCa channels follow a rather complex activation and deactivation pathway, involving multiple open states, that has been recently studied and modeled by Horrigan and Aldrich (1999) in the mSlo channel. The authors adopted an allosteric model for BKCa channel activation, composed by two parallel lines of open (upper) and closed (lower) states interconnected (Scheme 1 of Horrigan and Aldrich, 1999). This model can predict the experimental data, showing that the rate constants governing the transitions among the open states are significantly slower than those involved in transitions among closed states. In particular, the slow component reflects the transitions from the open to closed states (vertical transition in the Scheme 1 of Horrigan and Aldrich, 1999). The fact that we observed an ∼10-fold reduction in the amplitude of the OFF gating current slow component in hSlo-D292N, compared with hSlo, supports the idea that the mutation prevents the channel to reach stable open states, and that during depolarizations, mostly closed states become populated. On the contrary, in hSlo, the slow component of the OFF gating current is clearly evident, develops during depolarization, and seems to correlate with a different and more robust population of open states. This finding, together with the observation that also the Po is very much reduced in hSlo-D292N suggests that a small number of open states becomes populated during depolarizations. In other words, the gating currents of hSlo D292N mainly report the fast transitions among closed states, since the open states are rarely populated.
The importance of D292 for the stability of open states does not seem to be limited to hSlo channels. The corresponding residue in Kv2.1 channels (D378) appears to have a similar role in open state stability (Chapman et al., 2001). Even the conservative D378E mutation in Kv2.1 channels introduces a flickering channel activity, resulting in a markedly reduced Po. In a simulation study of the KcsA channel, Guidoni et al. (1999) suggest that residue D80 (corresponding to hSlo D292) is involved in a salt bridge with R89 (R301 in hSlo) (Guidoni et al., 1999). The authors propose that the disruption of this bridge might be the reason why mutations of either of these two residues produce nonfunctional pores in several K channels (Goldstein et al., 1994; Kirsch et al., 1995; Perozo et al., 1998). The fact that neutralization of D292 in hSlo produced a still functional channel implies that the putative salt bridge is either absent or less important for channel function than in the Kv channels studied. Still, the destabilization of the mutant channel open state might result from disruption of this salt bridge. In addition, another model of the arrangement of pore residues around the selectivity filter (Berneche and Roux, 2000) suggests that D80 in KcsA is also involved in two hydrogen bonds, with G79 (G291 in hSlo, in the GYG pore sequence) and E71 (V283 in hSlo). Disruption of one or more of these bonds is likely to affect the structure of the pore, which may reduce the conductance and/or open probability.
The importance of hydrogen bonds and salt bridges for the functionality of the pore is also strengthened by other mutations in the vicinity of the selectivity filter. For example, mutating the residues Y293 and F294 in the Drosophila BKCa (dSlo) to W have profound effects on the permeation and gating properties of the channel (Lagrutta et al., 1998). The Y293W mutation introduced outward rectification of the single channel conductance, while the F294W mutation resulted in greater flickering activity of the channel. In summary, the structure and properties of the pore seem to depend upon numerous interactions between different residues, and thus, mutation of one residue may have effects also in more distant areas of the channel. According to this point of view, the D292N mutation may affect the voltage activation process by subtle changes in the overall channel conformation.
As the slow component of the charge movement has been associated with the final transition between closed and open state (Stefani et al., 1997), this result supports the view that the D292N mutation prevents transition to a relatively stable open state. Indeed as shown in Fig. 6, the overall open probability was significantly reduced by the mutation. Our results have reproduced in hSlo the finding by Horrigan and Aldrich (1999) relative to the development of the slow component in the OFF gating, as the duration of the depolarization increases.
In conclusion, the general pattern of effects generated by the neutralization of D292 can be explained by a combination of structural modification and reduction in surface charge density (Part I, Haug et al., 2004). As discussed in Part I, the structural modification could also be explained by the decrease of the local [K+] caused by D292 neutralization. Temporary absence of K+ could cause collapses of the pore, which is revealed as a severely reduced Po. The collapse of K+ pores in absence of K+ has been reported previously (Almers and Armstrong, 1980; Gomez-Lagunas, 1997; Melishchuk et al., 1998; Vergara et al., 1999; Loboda et al., 2001).
Our results indicate that the D292 residue, situated directly outside the selectivity filter, plays a key role in ion conduction, as well as in pore opening triggered by voltage or intracellular Ca2+. The D292N pore mutation (a) shifts the overall activation curve toward more depolarized potentials, (b) destabilizes the open state, and (c) greatly reduces the limiting Po.
Acknowledgments
We thank Ramon Latorre for insightful comments, Antonius VanDongen for the TRANSIT program for single channel kinetics analysis, Viktor Grabarchuk for developing the acquisition and analysis programs GPATCHW and ANALYSIS, and Evgenia Grigorova for the technical support with Xenopus oocytes.
This work was supported by National Institutes of Health grant NS043240 to R. Olcese, GM52203 to E. Stefani, and HL54970 to L. Toro, by the Norwegian Research Council grant 133604/410 to T. Haug, and by American Heart Association Grant in Aid 0250170N to R. Olcese.
Olaf S. Andersen served as editor.
Trude Haug and Riccardo Olcese contributed equally to this work.
Abbreviations used in this paper: HP, holding potential; SHP, subtracting holding potential.
References
- Almers, W., and C.M. Armstrong. 1980. Survival of K+ permeability and gating currents in squid axons perfused with K+-free media. J. Gen. Physiol. 75:61–78. [DOI] [PMC free article] [PubMed] [Google Scholar]
- Berneche, S., and B. Roux. 2000. Molecular dynamics of the KcsA K(+) channel in a bilayer membrane. Biophys. J. 78:2900–2917. [DOI] [PMC free article] [PubMed] [Google Scholar]
- Chapman, M.L., H.S. Krovetz, and A.M. VanDongen. 2001. GYGD pore motifs in neighbouring potassium channel subunits interact to determine ion selectivity. J. Physiol. 530:21–33. [DOI] [PMC free article] [PubMed] [Google Scholar]
- Diaz, F., P. Meera, J. Amigo, E. Stefani, O. Alvarez, L. Toro, and R. Latorre. 1998. Role of the S4 segment in a voltage-dependent calcium-sensitive potassium (hSlo) channel. J. Biol. Chem. 273:32430–32436. [DOI] [PubMed] [Google Scholar]
- Diaz, F., M. Wallner, E. Stefani, L. Toro, and R. Latorre. 1996. Interaction of internal Ba2+ with a cloned Ca2+-dependent K+ (hslo) channel from smooth muscle. J. Gen. Physiol. 107:399–407. [DOI] [PMC free article] [PubMed] [Google Scholar]
- Doyle, D.A., J.M. Cabral, R.A. Pfuetzner, A. Kuo, J.M. Gulbis, S.L. Cohen, B.T. Chait, and R. MacKinnon. 1998. The structure of the potassium channel: molecular basis of K+ conduction and selectivity. Science. 280:69–77. [DOI] [PubMed] [Google Scholar]
- Fettiplace, R., and P.A. Fuchs. 1999. Mechanisms of hair cell tuning. Annu. Rev. Physiol. 61:809–834. [DOI] [PubMed] [Google Scholar]
- Goldstein, S.A.N., D.J. Pheasant, and C. Miller. 1994. The charybdotoxin receptor of a Shaker K+ channel: peptide and channel residues mediating molecular recognition. Neuron. 12:1377–1388. [DOI] [PubMed] [Google Scholar]
- Gomez-Lagunas, F. 1997. Shaker B K+ conductance in Na+ solutions lacking K+ ions: a remarkably stable non-conducting state produced by membrane depolarizations. J. Physiol. 499:3–15. [DOI] [PMC free article] [PubMed] [Google Scholar]
- Guidoni, L., V. Torre, and P. Carloni. 1999. Potassium and sodium binding to the outer mouth of the K+ channel. Biochemistry. 38:8599–8604. [DOI] [PubMed] [Google Scholar]
- Haug, T., D. Sigg, S. Ciani, L. Toro, E. Stefani, and R. Olcese. 2004. Regulation of K+ flow by a ring of negative charges in the outer pore of BKCa channels. Part I: aspartate 292 modulates K+ conduction by external surface charge effect. 124:173–184. [DOI] [PMC free article] [PubMed]
- Heginbotham, L., T. Abramson, and R. MacKinnon. 1992. A functional connection between the pores of distantly related ion channels as revealed by mutant K+ channels. Science. 258:1152–1155. [DOI] [PubMed] [Google Scholar]
- Heginbotham, L., Z. Lu, T. Abramson, and R. MacKinnon. 1994. Mutations in the K+ channel signature sequence. Biophys. J. 66:1061–1067. [DOI] [PMC free article] [PubMed] [Google Scholar]
- Horrigan, F.T., and R.W. Aldrich. 1999. Allosteric voltage gating of potassium channels II. Mslo channel gating charge movement in the absence of Ca(2+). J. Gen. Physiol. 114:305–336. [DOI] [PMC free article] [PubMed] [Google Scholar]
- Horrigan, F.T., and R.W. Aldrich. 2002. Coupling between voltage sensor activation, Ca2+ binding and channel opening in large conductance (BK) potassium channels. J. Gen. Physiol. 120:267–305. [DOI] [PMC free article] [PubMed] [Google Scholar]
- Horrigan, F.T., J. Cui, and R.W. Aldrich. 1999. Allosteric voltage gating of potassium channels I. Mslo ionic currents in the absence of Ca(2+). J. Gen. Physiol. 114:277–304. [DOI] [PMC free article] [PubMed] [Google Scholar]
- Hoshi, T., W.N. Zagotta, and R.W. Aldrich. 1990. Biophysical and molecular mechanisms of Shaker potassium channel inactivation. Science. 250:533–538. [DOI] [PubMed] [Google Scholar]
- Hurst, R.S., L. Toro, and E. Stefani. 1996. Molecular determinants of external barium block in Shaker potassium channels. FEBS Lett. 388:59–65. [DOI] [PubMed] [Google Scholar]
- Kirsch, G.E., J.M. Pascual, and C.-C. Shieh. 1995. Functional role of a conserved aspartate in the external mouth of voltage-gated potassium channels. Biophys. J. 68:1804–1813. [DOI] [PMC free article] [PubMed] [Google Scholar]
- Lagrutta, A.A., K.Z. Shen, A. Rivard, R.A. North, and J.P. Adelman. 1998. Aromatic residues affecting permeation and gating in dSlo BK channels. Pflugers Arch. 435:731–739. [DOI] [PubMed] [Google Scholar]
- Loboda, A., A. Melishchuk, and C. Armstrong. 2001. Dilated and defunct k channels in the absence of k(+). Biophys. J. 80:2704–2714. [DOI] [PMC free article] [PubMed] [Google Scholar]
- Melishchuk, A., A. Loboda, and C.M. Armstrong. 1998. Loss of shaker K channel conductance in 0 K+ solutions: role of the voltage sensor. Biophys. J. 75:1828–1835. [DOI] [PMC free article] [PubMed] [Google Scholar]
- Molina, A., P. Ortega-Saenz, and J. Lopez-Barneo. 1998. Pore mutations alter closing and opening kinetics in Shaker K+ channels. J. Physiol. 509(Pt 2):327–337. [DOI] [PMC free article] [PubMed] [Google Scholar]
- Neyton, J., and C. Miller. 1988. Discrete Ba2+ as a probe of ion occupancy and pore structure in the high-conductance Ca2+ activated K+ channel. J. Gen. Physiol. 92:569–586. [DOI] [PMC free article] [PubMed] [Google Scholar]
- Orio, P., P. Rojas, G. Ferreira, and R. Latorre. 2002. New disguises for an old channel: MaxiK channel {beta}-subunits. News Physiol. Sci. 17:156–161. [DOI] [PubMed] [Google Scholar]
- Perozo, E., D.M. Cortes, and L.G. Cuello. 1998. Three-dimensional architecture and gating mechanism of a K+ channel studied by EPR spectroscopy. Nat. Struct. Biol. 5:459–469. [DOI] [PubMed] [Google Scholar]
- Petersen, O.H., and Y. Maruyama. 1984. Calcium-activated potassium channels and their role in secretion. Nature. 307:693–696. [DOI] [PubMed] [Google Scholar]
- Ribalet, B., G.T. Eddlestone, and S. Ciani. 1988. Metabolic regulation of the K(ATP) and a maxi-K(V) channel in the insulin-secreting RINm5F cell. J. Gen. Physiol. 92:219–237. [DOI] [PMC free article] [PubMed] [Google Scholar]
- Schreiber, M., and L. Salkoff. 1997. A novel calcium-sensing domain in the BK channel. Biophys. J. 73:1355–1363. [DOI] [PMC free article] [PubMed] [Google Scholar]
- Sigworth, F.J. 1980. The variance of sodium current fluctuations at the node of ranvier. J. Physiol. 307:97–129. [DOI] [PMC free article] [PubMed] [Google Scholar]
- Stefani, E., and F. Bezanilla. 1998. Cut-open oocyte voltage-clamp technique. Methods Enzymol. 293:300–318. [DOI] [PubMed] [Google Scholar]
- Stefani, E., M. Ottolia, F. Noceti, R. Olcese, M. Wallner, R. Latorre, and L. Toro. 1997. Voltage-controlled gating in a large conductance Ca2+-sensitive K+ channel (hslo). Proc. Natl. Acad. Sci. USA. 94:5427–5431. [DOI] [PMC free article] [PubMed] [Google Scholar]
- vanDongen, A.M.J. 1996. A new algorithm for idealizing single ion channel data containing multiple unknown conductance levels. Biophys. J. 70:1303–1315. [DOI] [PMC free article] [PubMed] [Google Scholar]
- Vergara, C., O. Alvarez, and R. Latorre. 1999. Localization of the K+ lock-In and the Ba2+ binding sites in a voltage- gated calcium-modulated channel. Implications for survival of K+ permeability. J. Gen. Physiol. 114:365–376. [DOI] [PMC free article] [PubMed] [Google Scholar]
- Vergara, C., R. Latorre, N.V. Marrion, and J.P. Adelman. 1998. Calcium-activated potassium channels. Curr. Opin. Neurobiol. 8:321–329. [DOI] [PubMed] [Google Scholar]
- Wallner, M., P. Meera, M. Ottolia, G.J. Kaczorowski, R. Latorre, M.L. Garcia, E. Stefani, and L. Toro. 1995. Characterization of and modulation by a beta-subunit of a human maxi KCa channel cloned from myometrium. Receptors Channels. 3:185–199. [PubMed] [Google Scholar]
- Wei, A., C. Solaro, C. Lingle, and L. Salkoff. 1994. Calcium sensitivity of BK-type KCa channels determined by a separable domain. Neuron. 13:671–681. [DOI] [PubMed] [Google Scholar]
- Zhou, Y., J.H. Morais-Cabral, A. Kaufman, and R. MacKinnon. 2001. Chemistry of ion coordination and hydration revealed by a K+ channel-Fab complex at 2.0 A resolution. Nature. 414:43–48. [DOI] [PubMed] [Google Scholar]


