

Abstract
Responses of single guinea-pig liver cells to the application of external ATP were studied using the whole-cell voltage clamp technique.
When the cells were loaded with 5 mm EGTA in the absence of K+ and Cl− in both internal and external solutions, application of ATP (0.03-100 μm) elicited a large cation-selective inward current at negative holding potentials. The current densities at the peak of the response to 100 μm ATP were 4.5 ± 0.5 pA pF−1 (mean ± s.e.m., n = 18) in the presence of Na+ and Ca2+ in the external medium and 3.3 ± 0.7 pA pF−1 (n = 6) with Ca2+ as the major permeant ion.
Divalent cations, when added during the response to ATP in the presence of Na+ and Ca2+, exerted different effects: CdSO4 (2 mm) totally and NiSO4 (2 mm) partially blocked the inward current whereas MnSO4 (2 mm) did not block it. The ATP-activated conductance was permeable to all the divalent cations tested in this study, i.e. Ca2+, Cd2+, Ni2+, Mn2+ and Mg2+. No response to ATP was observed in the absence of external cations.
The activation of the inward current was not maintained in the continuous presence of ATP. The effect of Ca2+ ions on the desensitization of the response was studied in different external solutions. The decline in the amplitude of the inward current after the peak was fitted with a single exponential with a time constant of about 2 s for pure Ca2+, Cd2+ or Ni2+ currents, 3 s for Mg2+ or Mn2+ and 4 s in the presence of both Na+ and Ca2+.
Under more physiological conditions, the entry of Ca2+ evoked after the stimulation of P2X purinoceptors was associated with an increase in fluo-3 fluorescence and a marked reduction in the delay before the mobilization of internal Ca2+ stores following the activation of P2Y purinoceptors.
ATP is a neurotransmitter co-released with noradrenaline from the same synaptic vesicles after stimulation of sympathetic nerves (Von Kugelgen & Starke, 1991). The direct innervation of single hepatocytes by sympathetic nerve terminals (Gardemann, Puschel & Jungermann, 1992) suggests an important role for ATP in the Ca2+ homeostasis of these cells. ATP has a wide range of actions on cellular Ca2+, involving the activation of membrane cation channels (Kolb & Wakelam, 1983; Krishtal, Marchenko & Pidoplichko, 1983; Benham & Tsien, 1987) or the stimulation of phospholipase C (Charest, Blackmore & Exton, 1985), resulting from the stimulation of P2X or P2Y purinoceptors, respectively. The ability of extracellular ATP to activate hydrolysis of polyphosphoinositides, InsP3 production, and Ca2+ mobilization in isolated liver cells following the activation of P2Y purinoceptors has been studied in detail (see Dubyak & El-Moatassim, 1993, for review). The resulting cytosolic free Ca2+ concentration ([Ca2+]i) increase leads to the activation of the Ca2+-dependent K+ conductance in guinea-pig liver cells (Capiod & Ogden, 1989a). ATP activates a cation channel permeable to Ca2+, K+ and Na+ in several cell types (see Bean, 1992, for review) including a rat hepatoma cell line (Bear & Li, 1991). Seven cDNA clones of P2X purinoceptors (coding for ligand-gated ion channels) and seven clones of P2Y purinoceptors (five of them have been shown to be coupled via a G protein to the InsP3 pathway) have been identified (see North & Barnard, 1997, for review) with multiple subtypes of P2X and P2Y purinoceptors being co-expressed in the same cell. A P2Y1 subtype was recently identified in hepatocytes (Tokuyama, Hara, Jones, Fan & Bell, 1995) whereas the exact nature of the P2X subtypes present in these cells remains unknown. However, since P2X purinoceptors show rather dramatic differences in their sensitivity to agonists and kinetics of desensitization (Evans & Surprenant, 1996), the characterization of the ATP- activated cation current in guinea-pig hepatocytes should provide some insights into the identification of the P2X subtypes present on these cells. This study therefore investigated the properties of this ATP-activated cation conductance in freshly dissociated guinea-pig hepatocytes using the whole-cell voltage clamp technique.
Little is known about the interactions between P2X and P2Y purinoceptors when co-localized in the same cell (Dubyak & El-Moatassim, 1993). Both types of receptors are known to increase [Ca2+]i but P2X-mediated [Ca2+]i rises are more likely to happen before the delayed Ca2+ mobilization associated with the P2Y purinoceptor. The Ca2+ indicator fluo-3 was used to monitor [Ca2+]i during the P2X-mediated Ca2+ influx under physiological conditions, and the influence of this Ca2+ influx on P2Y-mediated Ca2+ mobilization from intracellular stores was investigated.
A preliminary account of this work has been published (Capiod, 1993, 1995).
METHODS
Cell isolation
Guinea-pigs (males of the Hartley strain) were anaesthetized by i.p. administration of urethane (5 mg kg−1) and isolated hepatocytes were prepared by collagenase digestion and mechanical dispersion (Field & Jenkinson, 1987). Animals were killed by an overdose of anaesthetic and exsanguination after removal of the liver. Thirty minutes after preparation, hepatocytes were plated from the suspension onto 40 mm collagen-coated quartz coverslips, in Williams medium E (Gibco) supplemented with fetal calf serum (10%), penicillin (200 000 u ml−1) and streptomycin (100 mg ml−1). The dishes were incubated at 37°C in a hydrated atmosphere of 5% CO2 in air for at least 2 h and were then used within the next 8 h. Recordings were made at a temperature of 32–34°C.
Electrophysiological measurements
Standard tight-seal whole-cell recording techniques were used (Hamill, Marty, Neher, Sakmann & Sigworth, 1981). Signals from whole-cell recordings were digitized by a CED 1401 interface (CED Ltd) and traces analysed with the VCAN package supplied by J. Dempster (University of Strathclyde, UK). Cells were first perfused with a Cl−-free solution containing (mm): sodium gluconate, 145; potassium gluconate, 5.6; CaSO4, 5; MgSO4, 1.2; Hepes, 8; and then 2 min before the application of ATP with an external solution containing (mm): NaOH, 75; Ca(OH)2, 2; Hepes, 214. In Na+-free solutions, 75 mm NaOH was substituted with 75 mm N-methyl-D-glucamine (NMDG). The other external solutions used in this study are emphasized in the figure legends. Patch pipettes contained (mm): NMDG, 87; EGTA, 5; Hepes, 199. Patch pipette resistances were typically 15–20 MΩ and series resistances usually were 20–25 MΩ in these solutions, resulting in voltage errors of about 2–8 mV at the peak of the P2X responses.
The changes in [Ca2+]i were studied in the initial Cl−-free external solution with the patch pipettes containing (mm): potassium gluconate, 153; Na2ATP, 3; MgSO4, 3; Hepes, 8; plus 100 μm fluo-3 or 500 μm furaptra. The Ca2+-free solution contained (mm): sodium gluconate, 149; potassium gluconate, 5.6; MgSO4, 3; EGTA, 0.05; Hepes, 8; and the Na+-free solution contained (mm): NMDG, 175; gluconic acid, 145; potassium gluconate, 5.6; CaSO4, 5; MgSO4, 1.2; Hepes, 8. Input resistances of single guinea-pig hepatocytes were usually between 0.5 and 1.5 GΩ (Capiod & Ogden, 1989a). No series resistance compensation was used. Patch pipette resistances were typically 3–5 MΩ and series resistances were usually 5–8 MΩ in these solutions, resulting in voltage errors up to 10 mV at the peak of the P2Y responses.
The dishes were continuously perfused and drugs added to the external medium when needed. All the solutions were buffered at pH 7.3 and 0.22 μm Millipore filtered. The data recorded between different solutions were corrected for the presence of liquid junction potentials.
Fluorescence measurements
The fluorescent indicator used to detect changes in Ca2+ concentration was chosen according to the type of measurement being made. Fluo-3 has a dissociation constant (KD) for Ca2+ of 0.7 μm in situ (sufficiently close to the resting [Ca2+]i of the liver cells to allow this dye to detect changes in concentration of this cation near its resting level) with a large fluorescence increase on binding Ca2+; this was used to measure the amplitude of [Ca2+]i increases associated with the inward Ca2+ current, and the delays in the activation of Ca2+ release after stimulation of P2X and P2Y purinoceptors.
Estimates of the time course of [Ca2+]i changes from changes in fluo-3 fluorescence were found to be distorted when compared with data obtained with lower affinity indicators (see Ogden, Khodakhah, Carter, Thomas & Capiod, 1995). This presumably results from saturation of the fluo-3 at high local [Ca2+] near release sites with the global fluorescence changes across the cell producing underestimates of the localized [Ca2+]i changes at early times after InsP3 release. Therefore experiments to measure the time course of the rise of [Ca2+]i were made with the low affinity indicator furaptra (KD = 44 μm, Konishi, Hollingworth, Hawkins & Baylor, 1991; KD = 48 μm, Ogden et al. 1995; KD estimated as 100 μm in frog muscle myoplasm, Zhao, Hollingworth & Baylor, 1996).
Fluo-3 (100 μm) or furaptra (500 μm) free acids were introduced into the cell via the patch pipette with diffusional equilibration between the pipette solution and the cell being determined from the fluorescence record; recordings were made at least 5 min after membrane rupture. Microspectrofluorimetry was performed using a Nikon TMD microscope with a × 40 1.3 numerical aperture objective. Excitation light (fluo-3, 450–490 nm; furaptra, 400–440 nm) was from a xenon arc lamp, and the light emitted from a single cell viewed with long pass filters at > 520 nm (fluo-3) or > 470 nm (furaptra). The area viewed was restricted to a single cell by an adjustable rectangular diaphragm and emitted light detected by a photomultiplier operating in photon-counting mode. Pulse output was counted by a Tecmar interface, corrected for missed pulses and stored via software (Photon Technology International, Surbiton, Surrey, UK). Photon counts were converted in parallel to an analog signal by an integrating amplifier with correction for missed counts (Cairn Research) and stored on FM tape.
Fluorescence changes in fluo-3 were expressed as a ratio with respect to the initial resting fluorescence. Furaptra was used at a single excitation wavelength of 420 nm (in most experiments 400–440 nm) conditions under which the fluorescence is quenched close to zero on binding Ca2+. The methodology behind the calculation of free Ca2+ from the fluorescence has been described previously (Ogden et al. 1995; Ogden & Capiod, 1997; see Konishi et al. 1991).
The Ca2+-dependent K+ conductance has a range of activation depending on the cytosolic Ca2+ ion concentration (between 0.3 μm and 1.5 μm) and a maximum open probability of 0.9 (Capiod & Ogden, 1989b). It is not detectably activated at [Ca2+]i below 0.3 μm and provides a good index of low resting [Ca2+]i. Cells with any degree of activation of Ca2+-dependent K+ conductance before InsP3 stimulation were not used. The Ca2+-dependent K+ conductance was also used as an index of changes in [Ca2+]i during experiments.
Close application of agonist to the cell
In most experiments, ATP was applied to the cell via a puffer pipette close (20–30 μm) to the cell. The speed of changes of solution was tested as followed: the cells were loaded with a high free Ca2+ internal solution (composition (mm): potassium gluconate, 130; CaSO4, 9.5; BAPTA, 10; and Hepes, 8) via the patch pipette to fully activate the Ca2+-dependent K+ conductance of these cells (Capiod & Ogden, 1989b). The external solution contained (mm): sodium gluconate, 145; potassium gluconate, 5.6; CaSO4 5, MgSO4, 1.2; and Hepes, 8. A high potassium external solution was then applied via the puffer pipette to zero the electrochemical gradient. The delay between the electrical pulse triggering the opening of the pressure valve and the response was about 10 ms, and 90% of the current changes was observed within 100 ms.
During the experiments described here, the cells were continously superfused with the external solution allowing the removal of ATP at the end of the pressure application.
Chemicals
Collagenase CLS 2 was obtained from Worthington Biochemical Corporation, fluo-3 and furaptra from Molecular Probes, and all other reagents were Analar grade from Sigma, Aldrich or Boehringer Mannheim.
RESULTS
ATP-evoked inward currents
The stimulation of the different types of P2 purinoceptor by external ATP has multiple effects on the free calcium concentration. It is well known that ATP acting through P2X purinoceptors can activate a cation current permeant to Ca2+ ions in several types of cells. Alternatively, the stimulation of P2Y purinoceptors by ATP leads to the release of Ca2+ from intracellular stores which in turn activates Ca2+-dependent K+ and Cl− conductances in liver cells. The large currents resulting from the release of intracellular Ca2+ may therefore complicate the observation of an ATP-evoked inward current of small amplitude. Furthermore, P2X purinoceptors are permeable to K+ ions (Evans et al. 1996), and it has been shown that Cl− can be substituted with HCO3− after the stimulation of P3 purinoceptors (Pucéat, Clément & Vassort, 1991). Therefore the ATP-evoked inward current described herein was recorded in the presence of EGTA to block Ca2+-dependent conductances, and K+ and Cl− ions were substituted in both internal and external solutions. Figure 1A shows the inward current evoked by the application of 100 μm ATP in a single hepatocyte at a holding potential of −40 mV with Na+ and Ca2+ in the external solution. The Mg2+ salt of ATP was applied by a fast perfusion system evoking, after a short delay, an inward current accompanied by a marked increase in the membrane current noise. The current rapidly declined to 5–10% of its peak value, even in the continuous presence of ATP. ATP was then washed away and the current returned to its baseline within a few seconds. The inward current evoked by ATP in the presence of Ca2+ alone in the external solution is shown in Fig. 1B. The amplitude of the inward current measured at the peak of the response was dependent on the size of the cells and the results are therefore expressed as current densities (in pA pF−1). The mean inward current density evoked by 100 μm ATP in the presence of 75 mm Na+ and 2 mm Ca2+ was 5.3 ±0.7 pA pF−1 (mean ± s.e.m., n = 19) at −40 mV for a corresponding mean value for the cell capacitance of 42 ± 2 pF. In the presence of 2 mm Ca2+ only, the current density had a mean magnitude of 3.3 ± 0.7 pA pF−1 (n = 6) at −40 mV, about 62% but not significantly different (P ≥ 0.05, Student's non-paired t test) to that in the presence of Na+ and Ca2+.
Figure 1. ATP-activated cation currents in whole-cell voltage-clamped guinea-pig hepatocytes.
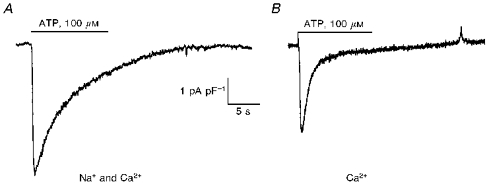
The traces were obtained from 2 different cells in the presence of both Na+ and Ca2+ (A) and Ca2+ alone (B). ATP (100 μm) was applied as shown by the horizontal bar from a puffer pipette on the cells at a holding potential of −40 mV. The responses evoked by ATP are expressed as current densities; cell capacitances were 50 and 30 pF for A and B, respectively.
ATP dependence of the current amplitudes
The ATP-evoked activation of the inward current has several features that made the generation of a concentration- response relationship problematic. First, successive applications of ATP on the same cell led to responses of decreasing amplitude, with no recovery of sensitivity to ATP being seen. The concentration-response relationship to ATP was therefore obtained from different cells. However, the inward currents evoked by ATP also depended on two other factors: first, the different magnitudes of the guinea-pig liver cell capacitances (ranging from 28 to 65 pF in this study) and second, day-to-day variations in the cell preparation. These were overcome by expressing current as densities (pA pF−1) and to minimize the day-to-day variability, responses were normalized to the amplitude of the current evoked by 100 μm ATP at −40 mV on each cell preparation with both Na+ and Ca2+ in the external solution. Figure 2 summarizes the concentration-response data obtained in eight cell preparations. The inward current densities increased with ATP concentration over the range of 0.03 to 100 μm. No responses were seen to an ATP concentration lower than 30 nm, with one cell (out of 3) producing no current at 30 nm. The largest current density observed at −40 mV was 14 pA pF−1 (cell capacitance, 45 pF) at 30 μm ATP. The points were fitted with a simple single site binding curve giving an estimate of the EC50 for the activation of the inward currents by ATP of about 0.3 μm in guinea-pig liver cells.
Figure 2. Concentration dependence of the amplitudes of the ATP-evoked currents.
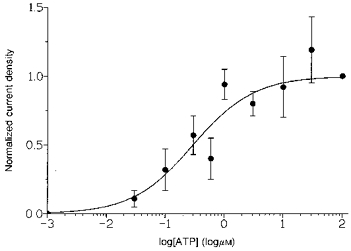
The cells were held at −40 mV and fast application of ATP (30 nm to 100 μm) was done with a puffer pipette next to the cell. Amplitudes of the ATP currents were measured at the peak of the responses and were expressed as current densities. Due to the fast desensitization of the ATP-evoked activation of the cation currents, only the responses to the first application of ATP were measured. As the concentration-response relationship was obtained on 8 different cell preparations, the responses were normalized to that of 100 μm ATP on the same day. Results are expressed as the mean ± s.e.m. and each point is the average of 3–8 responses.
The relative effects of two different adenine nucleotides, AMP and αβ-methylene ATP, on the inward current activation were also investigated. Amplitudes of the current densities at the peak of the response evoked by these nucleotides were compared with that of 100 μm ATP on the same liver cell preparation. One-hundred micromolar αβ-methylene ATP evoked a current of 31 ± 3% (n = 7) of that evoked by 100 μm ATP, 1 μm αβ-methylene ATP evoked a current of 7 ± 7% (n = 3), and 100 μm AMP had no effect.
Sensitivity of the cation conductance to external divalent cations
First, the sensitivity of the cation conductance to external Ca2+ was tested. ATP elicited an inward current when Ca2+ was the only cation present in the external solution (Fig. 1B), and Fig. 3 illustrates the effect of external Ca2+ removal during this response to ATP. The cell was perfused with 10 μm ATP to produce an inward current in the Na+-free, Ca2+-containing external solution. During the response to ATP, and in the continuous presence of the nucleotide, a Na+- and Ca2+-free solution (77 mm NMDG and 214 mm Hepes) was perfused onto the cell, which rapidly abolished the inward current in a reversible manner.
Figure 3. Sensitivity of the ATP-evoked cation current to external Ca2+.
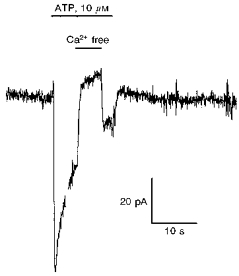
ATP (10 μm, horizontal bar) was perfused onto the cell in an external solution containing Ca2+ only. The ATP-activated inward current was inhibited when Ca2+ was removed from the external solution (77 mm NMDG, 214 mm Hepes, pH 7.3). Holding potential, −40 mV.
The effects of several other divalent cations were tested on the ATP-activated cation conductance in guinea-pig liver cells. Cadmium, nickel or manganese were added to the external solution during a response to ATP. The cell was initially perfused with an external solution containing 75 mm Na+ and 2 mm Ca2+. The external solution was then changed to one containing 10 μm ATP to induce an inward current. After the peak of the response and still in the presence of ATP, the external solution was rapidly changed to a solution containing 75 mm Na+, 2 mm Ca2+ and 2 mm Cd2+ (Fig. 4A), Ni2+ (Fig. 4B), or Mn2+ (Fig. 4C). Cadmium totally inhibited the inward current, nickel induced a partial inhibition and manganese slowed down the inactivation of the current. These effects were all reversible after returning to the Na+- and Ca2+-containing solution.
Figure 4. Block of the ATP-activated cation current by external divalent cations.
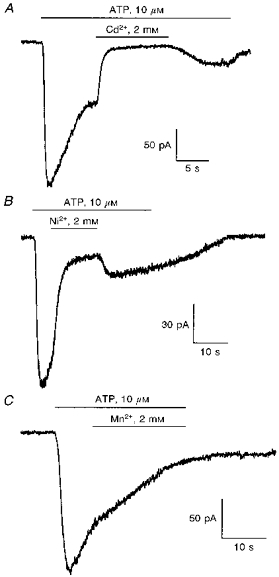
The 3 traces were obtained from 3 different cells held at −40 mV in an external medium containing both 75 mm Na+ and 2 mm Ca2+. ATP (10 μm) applied at the horizontal bar via the perfusion system evoked the activation of an inward current, and 2 mm of the SO4 salts of Cd2+ (A), Ni2+ (B) or Mn2+ (C) were then added to the external solution during the response. Cd2+ totally inhibited the inward current, Ni2+ had an intermediate effect and Mn2+ had no effect. The inhibitory effects on the ATP-activated cation currents were all reversible as soon as the divalent cations Cd2+ and Ni2+ were removed from the perfusion.
Divalent cation entry through the ATP-activated cation conductance
To test whether ATP could activate an inward current carried by these cations, ATP was puffed onto cells superfused with solutions containing 75 mm NMDG and 2 mm Cd2+ (Fig. 5A), Ni2+ (Fig. 5B), Mn2+ (Fig. 5C) or Mg2+ (Fig. 5D). Despite a different effect on the current carried by Ca2+ and Na+, these four divalent cations evoked a large and transient inward current in the presence of ATP. The averaged amplitudes of the inward current densities evoked by 100 μm ATP in the presence of Cd2+, Ni2+, Mn2+ or Mg2+ were 4.2 ± 1.2 (n = 5), 7.9 ± 1.1 (n = 4), 4.7 ± 1.0 (n = 6) and 6.4 ± 1.3 (n = 7) pA pF−1, respectively, at a holding potential of −40 mV.
Figure 5. Permeability of the ATP-activated cation conductance to divalents cations.
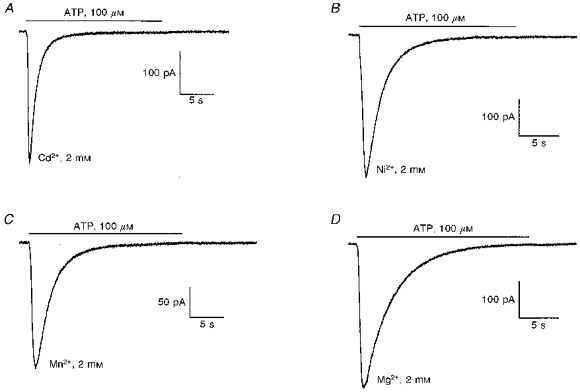
The 4 traces were obtained from 4 different cells held at −40 mV. ATP (100 μm) was applied onto the cells at the horizontal bar in an external solution containing 75 mm NMDG, 2 mm of the SO4 salts of Cd2+ (A), Ni2+ (B), Mn2+ (C) or Mg2+ (D) and 214 mm Hepes (pH 7.3).
Inactivation of the ATP-activated cation current
The inward current activated by ATP rapidly declined after the peak of the response. It seemed obvious from the traces shown in Figs 1 and 5 that the rate of decline of the response to ATP is strongly dependent on the cations present in the external solutions. This decline could be fitted by a single exponential function in every case, and time constants were derived for the different cation currents. Table 1 summarizes the results obtained in the presence of Na+ and Ca2+, Ca2+, Cd2+, Ni2+, Mn2+ or Mg2+ in the external solution. The currents evoked in the presence of 2 mm Cd2+, Ca2+ or Ni2+ showed the fastest rates of decline after the peak of the response produced by 100 μm ATP. The fastest rate of inactivation (1.1 s) was obtained in the presence of 2 mm Cd2+. Currents elicited in 2 mm Mn2+ or Mg2+ had time constants of decline slightly slower than for the previous three cations. The average time constant for Mg2+ was significantly slower (P ≥ 0.05) than those for Cd2+, Ca2+ or Ni2+. In the presence of Na+ and Ca2+, the average time constant for the inactivation of the inward current was significantly slower (P ≥ 0.05) than those for Ca2+, Cd2+, Ni2+, Mn2+ and Mg2+ solutions. Long incubations of guinea-pig liver cells in the absence of divalent cations in the external solution resulted in unstable voltage clamp which recovered immediately when the divalent cations were reintroduced into the perfusate. The large inward current observed at −60 mV when divalent cations were removed from the perfusate probably resulted in the activation of a non-selective ‘leak’ conductance. A similar effect associated with a functional alteration of K+ channels has been described before (Armstrong & Miller, 1990). Thus the study of the inactivation process in the absence of divalent cations was not possible. However, in the presence of 75 mm Na+, the substitution of 2 mm Ca2+ by an equivalent concentration of Mg2+, which was less effective in blocking the cation conductance, resulted in a decreased rate of decline of the ATP-evoked response (data not shown).
Table 1.
Time constants for the inactivation of the ATP-evoked inward currents
| External cation | τ (s) | n |
|---|---|---|
| Na+, 75 mm and Ca2+, 2 mm | 4.33 ± 0.21 | 16 |
| Ca2+, 2 mm | 1.96 ± 0.21 | 5 |
| Cd2+, 2 mm | 1.72 ± 0.31 | 5 |
| Ni2+, 2 mm | 2.10 ± 0.15 | 5 |
| Mn2+, 2 mm | 2.75 ± 0.44 | 6 |
| Mg2+, 2 mm | 3.00 ± 0.28 | 8 |
The currents were best fitted by a mono-exponential equation of the form y = a exp(-t/τ) + b, and time constants (τ) are expressed as the mean ± s.e.m., with n representing the number of cells. ATP (30–100 μm) for Na+ and Ca2+ or ATP (100 μm) for the divalent cations alone was added using the fast perfusion system.
Interactions between P2X- and P2Y-evoked responses
To test whether the ATP-activated Ca2+ entry could alter the kinetics of the InsP3-induced Ca2+ mobilization, the changes in [Ca2+]i and the simultaneous increase in the Ca2+-dependent K+ conductance were monitored after the stimulation of P2X and P2Y purinoceptors in the absence of a high internal Ca2+ buffer concentration. Cells were stimulated with 10 μm ATP and the high affinity Ca2+ indicator fluo-3 was used to detect the variations in [Ca2+]i resulting from the activation of both P2X and P2Y purinoceptors. At −60 mV, an inward current was clearly observed immediately after the addition of 10 μm ATP and was associated with a transient rise in [Ca2+]i. This immediate rise was followed, after a variable delay, by a larger increase in [Ca2+]i and the activation of an outward current (Fig. 6A). At 0 mV on the same cell, only the second phase of the response was observed. Presumably, the early part of the response was linked to the activation of P2X purinoceptors whereas intracellular Ca2+ mobilization underlying the second phase was due to the P2Y type. In the absence of Ca2+ in the external solution and at a test potential of −60 mV, an early inward current but no increase in [Ca2+]i was observed immediately after the addition of 10 μm ATP, whereas the amplitude of the responses related to the stimulation of P2Y purinoceptors was not greatly altered (Fig. 6B). Experiments using the low affinity Ca2+ indicator furaptra gave similar results although the early rise in [Ca2+]i associated with the P2X-evoked inward current could not be detected (data not shown). Similar results were obtained when cells were first stimulated at 0 mV then at −60 mV. When the delays in the P2Y-mediated responses to 10 μm ATP at 0 mV were compared with those at −60 mV in the same cell, only those [Ca2+]i rises elicited in the presence of external Ca2+ (Ca2+ only or Na+ plus Ca2+) were significantly slower. There was no significant difference between the delays seen at 0 mV and those seen at −60 mV for data obtained in external solution with Na+ only. The delays were estimated as the time from the beginning of the ATP application until the fluorescence associated with the P2Y-mediated Ca2+ mobilization and the Ca2+-dependent K+ conductance deviated from baseline. Pooled data combining the results obtained with these two indicators are summarized in Table 2. A significant reduction of the delay in fluorescence (P ≥ 0.05) at −60 mV when compared with those at 0 mV was observed when Ca2+ was present in the external solution.
Figure 6. Effect of the ATP-activated Ca2+ influx on the internal Ca2+ mobilization.
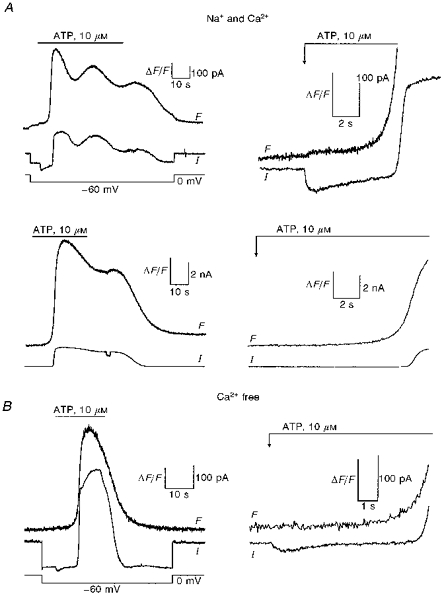
Cells were loaded with 100 μm fluo-3. Fluorescence data expressed as ΔF/F (vertical scale bar, ΔF/F = 1) after the addition of 10 μm ATP. A, full (left) and expanded (right) fluorescence (F) and Ca2+-dependent K+ conductance (I) traces at −60 mV (top) and 0 mV (bottom) in a single guinea-pig hepatocyte. B, lack of increase in fluo-3 fluorescence associated with the ATP-activated inward current at −60 mV in a Ca2+-free solution. Full (left) and expanded (right) traces.
Table 2.
Delays and rates of rises in [Ca2+]i after the stimulation of P2Y purinoceptors by 10 μm ATP in single guinea-pig hepatocytes
| External solution | Delay (%) | d[Ca2+]i/dt (%) |
|---|---|---|
| Na+ and Ca2+ | 56 ± 5 (7) | 78 ± 11 (5) |
| Na+ free | 51 ± 11 (4) | 69 ± 11 (3) |
| Ca2+ free | 94 ± 12 (5) | 88 ± 19 (3) |
Delays at −60 mV are expressed as a percentage of the delay at 0 mV on the same cell. Mean values represent pooled data from fluo-3- and furaptra-loaded cells. Rates of rise in [Ca2+]i (d[Ca2+]i/dt) measured with furaptra at −60 mV are expressed as a percentage of d[Ca2+]i/dt at 0 mV on the same cell. Results are expressed as the mean ± s.e.m. with the number of cells in parentheses.
Previous work has shown that membrane hyperpolarization to −120 mV results in an increase in [Ca2+]i of about 2 μm in furaptra-loaded guinea-pig hepatocytes (Ogden & Capiod, 1997). Under these conditions, the delays in InsP3-evoked Ca2+ release were abolished whereas the rate of rise in Ca2+ were reduced (Ogden & Capiod, 1997). The data presented here for the increase in [Ca2+]i associated with the ATP-evoked inward current were probably in the submicromolar range as judged by the respective amplitude of the two phases of the responses to ATP in fluo-3-loaded cells. The effect of the Ca2+ entry on the rates of rise in [Ca2+]i, d[Ca2+]i/dt, were investigated using the low affinity Ca2+ indicator furaptra. The d[Ca2+]i/dt, estimated as the slope of a straight line fitted to the maximum rate of rise (see Ogden & Capiod, 1997), was compared for potentials at −60 and 0 mV in the same cell after the application of 10 μm ATP (data not shown). Due to cell-to-cell variability, d[Ca2+]i/dt values at −60 mV were expressed as a percentage of those at 0 mV. In contrast to the effects on the delay, summarized data (Table 2) demonstrate that there is no significant difference in d[Ca2+]i/dt at −60 mV in the presence of external Ca2+ when compared with Ca2+-free external medium.
DISCUSSION
The work presented here provides evidence for an ATP-activated cation conductance after stimulation of a P2X subtype of purinergic receptors in guinea-pig hepatocytes. It further demonstrates the physiological relevance of this influx on the InsP3-evoked Ca2+ mobilization in these cells.
The conductance is activated with no detectable delay at ATP concentrations higher than 30 nm ATP. This was confirmed in experiments where ATP, photolytically released from NPE-caged ATP (the (nitrophenyl)ethyl ester form of ATP) to assess the kinetics of activation of the inward current, induced an immediate activation of the inward current at concentrations higher than 2.5 μm (author's unpublished data). To date, seven clones of P2X purinoceptors have been identified and expressed in different tissues (North & Barnard, 1997). They differ in terms of sensitivity to ATP and αβ-methylene ATP, and also in kinetics of inactivation (Evans & Surprenant, 1996; Surprenant, Rassendren, Kawashima, North & Buell, 1996). P2X1 and P2X3 subtypes induce a cation current peaking and declining rapidly, having a similar sensitivity to ATP and αβ-methylene ATP (Evans & Surprenant, 1996). The P2X purinoceptors in guinea-pig hepatocytes have much slower rates of inactivation (ca 2–4 s) than P2X1 (100–300 ms) and P2X3 (< 50 ms) purinoceptors (Evans & Surprenant, 1996). The rise times and rates of inactivation of the P2X-activated cation current in guinea-pig hepatocytes were dependent on the ATP concentration (0.6-100 μm). The rates of inactivation that could be fitted by a single exponential function at all ATP concentrations were about twice as long at 1–3 μm ATP than at 30–100 μm in the presence of 75 mm Na+ and 2 mm Ca2+. The rise times were about 5–6 times slower at 0.6-1 μm ATP than at 30–100 μm. The P2X purinoceptors in guinea-pig hepatocytes are slightly more sensitive to ATP than αβ-methylene ATP and have an EC50 for ATP (ca 0.3 μm) close to that reported for P2X1 and P2X3 purinoceptors (1 and 0.6 μm, respectively; for review see Evans & Surprenant, 1996).
Permeability to divalent cations and inactivation of the ATP-evoked currents
These data provide the first evidence that the ATP-activated cation conductance is permeant to Cd2+, Ni2+, Mn2+ and Mg2+ as well as Ca2+. Cd2+ and Ni2+ also block the ATP-evoked current carried by Ca2+ and Na+, with this type of channel behaviour being likely to represent a pore with multiple ion binding sites (Hagiwara, 1983; Hess & Tsien, 1984; Hille, 1992), although further experiments are clearly needed to demonstrate this point. This behaviour is likely to be related to the inactivation of the currents evoked by ATP. The currents carried by Cd2+, Ni2+ or Ca2+ inactivate faster than those of Mn2+ and Mg2+. No data were obtained in the presence of Na+ alone, but the currents carried by Na+ and Ca2+, or Na+ and Mg2+, had a much slower inactivation than those of Ca2+ or Mg2+ alone. It appears that the ATP-evoked currents inactivate faster in the presence of divalent cations. The fast inactivation of the Cd2+ or Ni2+ currents compared with Mn2+ or Mg2+ are probably related to their inhibitory effects on the ATP-evoked Na+-Ca2+ current and it is likely that Ca2+ has a similar effect on the Na+ current. The inactivation of the P2X1 and P2X3 purinoceptors is related to the conducting pore formed by the two transmembrane domains and adjacent cytoplasmic segments (Werner, Seward, Buell & North, 1996). It is possible that Mn2+ slows down the inactivation of the Na+-Ca2+ current by competing with Ca2+ to enter the channel. The nature of the cation entering the pore is therefore important in the inactivation process and it would be interesting to determine the permeability of the different cations for the different P2X clones, or heteromultimers formed by coexpression of inactivating and non-inactivating P2X purinoceptors. Alternatively, Ca2+ may be interfering with the rate of ATP binding at the P2X purinoceptor (Nakazawa & Hess, 1993). Rise times of the ATP-activated currents were identical (ca 240 ms) in the presence of 75 mm Na+ plus 2 mm Ca2+ or 2 mm Ca2+ only at ATP concentrations of 30–100 μm, although the rate of perfusion of ATP on the whole cell may result in their underestimation. The rates of inactivation and rise times of the current activated by 100 μm ATP were slower (5.7 ± 0.3 s and 440 ± 70 ms, respectively, n = 3) in external solutions containing 59 mm Na+ and 10 mm Ca2+ (author's unpublished data). Rates of inactivation and rise times of the current in the presence of Na+ and Ca2+ were faster at increasing ATP concentrations (0.6 to 100 μm) but there was no correlation between rise times and rates of inactivation in any of the external media at ATP concentrations of 30–100 μm. These results may suggest that divalents cations not only block the channel by binding to a site within the pore, but also probably affect the rate of ATP binding on the P2X purinoceptors.
Interactions between the P2-evoked responses
P2Y and P2X purinoceptors are both present in guinea-pig hepatocytes and have a similar sensitivity to ATP. The half-maximal concentrations of ATP needed to activate the inward current and the production of InsP3 (P2X and P2Y, respectively) were approximately 0.3 μm (this study and Charest et al. 1985). ATP acting through P2Y purinoceptors triggers the release of Ca2+ from internal stores. When ATP was applied to the cell using a puffer pipette next to the cell, the P2Y response had a delay mainly due to the time taken for the production of InsP3 (see Ogden, Capiod, Walker & Trentham, 1990, for discussion). Thus the early increase in [Ca2+]i due to the inward current is likely to modulate both the InsP3 production and the InsP3-evoked Ca2+ release. However, it has been shown that an increase in [Ca2+]i above the resting level (approximately 150 nm) has no effect on the phospholipase C activity in rat liver cells (Renard, Poggioli, Berthon & Claret, 1987). However, an increase in [Ca2+]i could produce a facilitation of the InsP3-induced release of Ca2+ from the stores. InsP3 receptors have a dual sensitivity to changes in [Ca2+]i. Low Ca2+ concentrations (< 600 nm) increase the sensitivity of InsP3 receptors to InsP3 whereas high concentrations (> 600 nm) decrease it (Iino, 1990). Ca2+ entry through voltage-activated channels inhibits the InsP3-evoked rises in [Ca2+]i in Purkinje neurones (Khodakhah & Ogden, 1995) but promotes the regenerative opening of InsP3-sensitive Ca2+ channels in Xenopus oocytes (Yao & Parker, 1994). In guinea-pig hepatocytes, an increase in [Ca2+]i of about 2 μm following the activation of a Ca2+ influx has two main effects: it reduces the rate of rise in [Ca2+]i evoked by photoreleased InsP3 but also abolishes the delay in the response to InsP3 (Ogden & Capiod, 1997). The data presented here show that the ATP-activated Ca2+ entry triggered a significant reduction in the delay but did not modify the rate of rise in [Ca2+]i. The difference between these two effects of Ca2+ entry on the InsP3-evoked Ca2+ release may be related to the amount of Ca2+ that enters the cell during a response. The [Ca2+]i rises due to the entry of Ca2+ were not seen with the low affinity Ca2+ indicator furaptra and were small compared with those corresponding to the release of Ca2+ from the intracellular stores detected with fluo-3. At −60 mV, and in the absence of Na+ in the external solution, the integration of the inward current at peak values gave an estimate of about 10 μm (range, 4–16 μm) for the total Ca2+ entering the cell assuming a cell volume of about 6 pl (Berthon, Claret, Mazet & Poggioli, 1980). If one assumes that the cell-buffering capacity of a single guinea-pig hepatocyte is close to that of chromaffin cells (1:40 free to bound Ca2+, see Zhou & Neher, 1993) giving an approximate total buffering of 1 in 50 in the presence of 500 μm furaptra (Ogden & Capiod, 1997), the resulting increase in free Ca2+ is therefore likely to be less than 1 μm, the same order of magnitude as the increases in [Ca2+]i (ca 300 nm) observed in smooth muscle from rabbit ear artery after the activation of ATP-sensitive Ca2+ channels (Benham, 1989). Thus the [Ca2+]i increases associated with the Ca2+ current may be small enough to result only in the activation of InsP3 receptors as expected from the bell-shaped curve of InsP3 receptor activation in the presence of increased free Ca2+. However, it should still be possible to discriminate between an effect of Ca2+ entry on the InsP3 receptors affinity or an enhanced InsP3 production. By photoreleasing InsP3 from a caged precursor, it has been shown in Purkinje neurones (Khodakhah & Ogden, 1995), endothelial cells (Carter & Ogden, 1997) and guinea-pig hepatocytes (Ogden & Capiod, 1997) that the rate of Ca2+ release from the stores depends on the InsP3 concentration. Thus a comparison of the rates of InsP3-evoked Ca2+ release before and during the ATP-evoked cation influx should reveal a possible regulatory effect of Ca2+ influx in hepatocytes on this process.
Interactions between the ATP-evoked Ca2+ influx and other neurotransmitters
ATP can originate from several sources i.e. sympathetic nerve terminals and non-neuronal cells such as endothelium and smooth muscle (for review, see Von Kugelgen & Starke, 1991). Interestingly, it is now well established that ATP and noradrenaline are simultaneously released from the same synaptic vesicles after the stimulation of sympathetic nerves. In hepatocytes, noradrenaline acts through α1-adrenoceptors to induce InsP3 production and large increases in [Ca2+]i, and via β-adrenoceptors to increase the cell cAMP concentration. The entry of Ca2+ evoked by the activation of P2X purinoceptors is likely to influence the noradrenaline-evoked mobilization of Ca2+ from the internal stores in a similar way as for P2Y purinoceptors.
The results presented here suggest that ATP could potentially have multiple effects on the movements of Ca2+ through different types of purinoceptors, and that the activation of an inward cation current by this neurotransmitter may play a role in the regulation of [Ca2+]i in guinea-pig hepatocytes.
Acknowledgments
I thank David Ogden and Chris Watkins for comments on the manuscript.
References
- Armstrong CM, Miller C. Do voltage-dependent K+ channels require Ca2+? A critical test employing a heterologous expression system. Proceedings of the National Academy of Sciences of the USA. 1990;87:7579–7582. doi: 10.1073/pnas.87.19.7579. [DOI] [PMC free article] [PubMed] [Google Scholar]
- Bean BP. Pharmacology and electrophysiology of ATP-activated ion channels. Trends in Pharmacological Sciences. 1992;13:87–90. doi: 10.1016/0165-6147(92)90032-2. [DOI] [PubMed] [Google Scholar]
- Bear CE, Li CH. Calcium-permeable channels in rat hepatoma cells are activated by extracellular nucleotides. American Journal of Physiology. 1991;261:C1018–1024. doi: 10.1152/ajpcell.1991.261.6.C1018. [DOI] [PubMed] [Google Scholar]
- Benham CD. ATP-activated channels gate calcium entry in single smooth muscle cells dissociated from rabbit ear artery. Journal of Physiology. 1989;419:689–701. doi: 10.1113/jphysiol.1989.sp017893. [DOI] [PMC free article] [PubMed] [Google Scholar]
- Benham CD, Tsien RW. A novel-receptor-operated Ca2+-permeable channel activated by ATP in smooth muscle. Nature. 1987;328:275–278. doi: 10.1038/328275a0. [DOI] [PubMed] [Google Scholar]
- Berthon B, Claret M, Mazet JL, Poggioli J. Volume- and temperature-dependent permeabilities in isolated rat liver cells. Journal of Physiology. 1980;305:267–277. doi: 10.1113/jphysiol.1980.sp013362. [DOI] [PMC free article] [PubMed] [Google Scholar]
- Capiod T. ATP-dependent Ca2+ influx in voltage-clamped guinea-pig hepatocytes. Journal of Physiology. 1993;459:235P. [Google Scholar]
- Capiod T. ATP-activated cation currents in single guinea-pig liver cells. Biophysical Journal. 1995;68:A147. doi: 10.1111/j.1469-7793.1998.795bs.x. [DOI] [PMC free article] [PubMed] [Google Scholar]
- Capiod T, Ogden DC. Properties of membrane ion conductances evoked by hormonal stimulation of guinea-pig and rabbit isolated hepatocytes. Proceedings of the Royal Society. 1989a;B 236:187–201. doi: 10.1098/rspb.1989.0020. [DOI] [PubMed] [Google Scholar]
- Capiod T, Ogden DC. The properties of calcium-activated potassium ion channels in guinea-pig isolated hepatocytes. Journal of Physiology. 1989b;409:285–295. doi: 10.1113/jphysiol.1989.sp017497. [DOI] [PMC free article] [PubMed] [Google Scholar]
- Carter T, Ogden D. Kinetics of Ca2+ release by InsP3 in pig single aortic endothelial cells: evidence for an inhibitory role of cytosolic Ca2+ in regulating hormonally evoked Ca2+ spikes. Journal of Physiology. 1997;504:17–33. doi: 10.1111/j.1469-7793.1997.00017.x. [DOI] [PMC free article] [PubMed] [Google Scholar]
- Charest R, Blackmore PF, Exton JH. Characterization of responses of isolated rat hepatocytes to ATP and ADP. Journal of Biological Chemistry. 1985;260:15789–15794. [PubMed] [Google Scholar]
- Dubyak GR, El-Moatassim C. Signal tranduction via P2-purinergic receptors for extracellular ATP and other nucleotides. American Journal of Physiology. 1993;265:C577–606. doi: 10.1152/ajpcell.1993.265.3.C577. [DOI] [PubMed] [Google Scholar]
- Evans RJ, Lewis C, Virginio C, Lundstrom K, Buell G, Surprenant A, North RA. Ionic permeability of, and divalent cation effects on, two ATP-gated cation channels (P2X receptors) expressed in mammalian cells. Journal of Physiology. 1996;497:413–422. doi: 10.1113/jphysiol.1996.sp021777. [DOI] [PMC free article] [PubMed] [Google Scholar]
- Evans RJ, Surprenant A. P2X receptors in autonomic and sensory neurons. Seminars in the Neurosciences. 1996;8:217–223. 10.1006/smns.1996.0028. [Google Scholar]
- Field AC, Jenkinson DH. The effect of noradrenaline on the ion permeability of isolated mammalian hepatocytes, studied by intracellular recording. Journal of Physiology. 1987;392:493–512. doi: 10.1113/jphysiol.1987.sp016793. [DOI] [PMC free article] [PubMed] [Google Scholar]
- Gardemann A, Puschel GP, Jungermann K. Nervous control of liver metabolism and hemodynamics. European Journal of Biochemistry. 1992;207:399–411. doi: 10.1111/j.1432-1033.1992.tb17063.x. [DOI] [PubMed] [Google Scholar]
- Hagiwara S. Membrane Potential-Dependent Ion Channels in Cell Membrane. Phylogenetic and Developmental Approaches. New York: Raven Press; 1983. p. 118. [Google Scholar]
- Hamill OP, Marty A, Neher E, Sakmann B, Sigworth FJ. Improved patch-clamp techniques for high-resolution current recording from cells and cell-free membrane patches. Pflügers Archiv. 1981;391:85–100. doi: 10.1007/BF00656997. [DOI] [PubMed] [Google Scholar]
- Hess P, Tsien RW. Mechanism of ion permeation through calcium channels. Nature. 1984;309:453–456. doi: 10.1038/309453a0. [DOI] [PubMed] [Google Scholar]
- Hille B. Ionic Channels of Excitable Membranes. 2. Sunderland, MA, USA: Sinauer Associates Inc.; 1992. p. 607. [Google Scholar]
- Iino M. Biphasic Ca2+ dependence of inositol 1,4,5-trisphosphate-induced Ca2+ release in smooth muscle cells of the guinea-pig taenia caeci. Journal of General Physiology. 1990;95:1103–1122. doi: 10.1085/jgp.95.6.1103. [DOI] [PMC free article] [PubMed] [Google Scholar]
- Khodakhah K, Ogden D. Fast activation and inactivation of InsP3-evoked Ca2+ release in rat cerebellar Purkinje neurones. Journal of Physiology. 1995;487:343–358. doi: 10.1113/jphysiol.1995.sp020884. [DOI] [PMC free article] [PubMed] [Google Scholar]
- Kolb HA, Wakelam JO. Transmitter-like action of ATP patched membrane of myoblasts and myotubules. Nature. 1983;303:621–623. doi: 10.1038/303621a0. [DOI] [PubMed] [Google Scholar]
- Konishi M, Hollingworth S, Hawkins AB, Baylor SM. Myoplasmic Ca transients in intact frog skeletal muscle fibres monitored with the fluorescent indicator furaptra. Journal of General Physiology. 1991;97:271–302. doi: 10.1085/jgp.97.2.271. [DOI] [PMC free article] [PubMed] [Google Scholar]
- Krishtal OA, Marchenko SM, Pidoplichko VI. Receptor for ATP in the membrane of mammalian sensory neurons. Neurosciences Letters. 1983;35:41–45. doi: 10.1016/0304-3940(83)90524-4. [DOI] [PubMed] [Google Scholar]
- Nakazawa K, Hess P. Block by calcium of ATP-activated channels in pheochromocytoma cells. Journal of General Physiology. 1993;101:377–392. doi: 10.1085/jgp.101.3.377. [DOI] [PMC free article] [PubMed] [Google Scholar]
- North RA, Barnard EA. Nucleotide receptors. Current Opinion in Neurobiology. 1997;7:346–357. doi: 10.1016/s0959-4388(97)80062-1. [DOI] [PubMed] [Google Scholar]
- Ogden D, Capiod T. Regulation of Ca2+ release by InsP3 in single guinea-pig hepatocytes and rat Purkinje neurons. Journal of General Physiology. 1997;109:741–756. doi: 10.1085/jgp.109.6.741. [DOI] [PMC free article] [PubMed] [Google Scholar]
- Ogden DC, Capiod T, Walker JW, Trentham DR. Kinetics of the conductance evoked by noradrenaline, inositol trisphosphate or Ca2+ in guinea-pig isolated hepatocytes. Journal of Physiology. 1990;422:585–602. doi: 10.1113/jphysiol.1990.sp018002. [DOI] [PMC free article] [PubMed] [Google Scholar]
- Ogden DC, Khodakhah K, Carter TD, Thomas M, Capiod T. Mechanisms of intracellular Ca release during hormone and neurotransmitter action investigated with flash photolysis. Pflügers Archiv. 1995;429:587–591. doi: 10.1007/BF00704165. [DOI] [PubMed] [Google Scholar]
- Pucéat M, Clément O, Vassort G. Extracellular MgATP activates the Cl−/HCO3− exchanger in single rat cardiac cells. Journal of Physiology. 1991;444:241–256. doi: 10.1113/jphysiol.1991.sp018875. [DOI] [PMC free article] [PubMed] [Google Scholar]
- Renard D, Poggioli J, Berthon B, Claret M. How far does phospholipase C activity depend on the cell calcium concentration? Biochemical Journal. 1987;243:391–398. doi: 10.1042/bj2430391. [DOI] [PMC free article] [PubMed] [Google Scholar]
- Surprenant A, Rassendren F, Kawashima E, North RA, Buell G. The cytosolic P2Z receptor for extracellular ATP identified as a P2X receptor (P2X7) Science. 1996;272:735–738. doi: 10.1126/science.272.5262.735. [DOI] [PubMed] [Google Scholar]
- Tokuyama Y, Hara M, Jones EMC, Fan Z, Bell GI. Cloning of rat and mouse P2Y purinoceptors. Biochemical Biophysical Research Communications. 1995;211:211–218. doi: 10.1006/bbrc.1995.1798. [DOI] [PubMed] [Google Scholar]
- Von Kugelgen I, Starke K. Noradrenaline-ATP co-transmission in the sympathetic nervous system. Trends in Pharmacological Sciences. 1991;12:319–324. doi: 10.1016/0165-6147(91)90587-i. [DOI] [PubMed] [Google Scholar]
- Werner P, Seward EP, Buell GN, North RA. Domains of P2X receptors involved in desensitization. Proceedings of the National Academy of Sciences of the USA. 1996;93:15485–15490. doi: 10.1073/pnas.93.26.15485. [DOI] [PMC free article] [PubMed] [Google Scholar]
- Yao Y, Parker I. Ca2+ influx modulation of temporal and spatial patterns of inositol trisphosphate-mediated Ca2+ liberation in Xenopus oocytes. Journal of Physiology. 1994;476:17–28. [PMC free article] [PubMed] [Google Scholar]
- Zhao M, Hollingworth S, Baylor SM. Properties of tri- and tetracarboxylate Ca2+ indicators in frog skeletal muscle fibers. Biophysical Journal. 1996;70:896–916. doi: 10.1016/S0006-3495(96)79633-9. [DOI] [PMC free article] [PubMed] [Google Scholar]
- Zhou Z, Neher E. Mobile and immobile calcium buffers in bovine adrenal chromaffin cells. Journal of Physiology. 1993;469:245–273. doi: 10.1113/jphysiol.1993.sp019813. [DOI] [PMC free article] [PubMed] [Google Scholar]