

Abstract
Arachidonic acid (AA) modulates T-type Ca2+ channels and is therefore a potential regulator of diverse cell functions, including neuronal and cardiac excitability. The underlying mechanism of modulation is unknown. Here we analyze the effects of AA on the T-type Ca2+ channel α1G heterologously expressed in HEK-293 cells. AA inhibited α1G currents within a few minutes, regardless of preceding exposure to inhibitors of AA metabolism (ETYA and 17-ODYA). Current inhibition was also observed in cell-free inside-out patches, indicating a membrane-delimited interaction of AA with the channel. AA action was consistent with a decrease of the open probability without changes in the size of unitary currents. AA shifted the inactivation curve to more negative potentials, increased the speed of macroscopic inactivation, and decreased the extent of recovery from inactivation at −80 mV but not at −110 mV. AA induced a slight increase of activation near the threshold and did not significantly change the deactivation kinetics or the rectification pattern. We observed a tonic current inhibition, regardless of whether the channels were held in resting or inactivated states during AA perfusion, suggesting a state-independent interaction with the channel. Model simulations indicate that AA inhibits T-type currents by switching the channels into a nonavailable conformation and by affecting transitions between inactivated states, which results in the negative shift of the inactivation curve. Slow-inactivating α1G mutants showed an increased affinity for AA with respect to the wild type, indicating that the structural determinants of fast inactivation are involved in the AA–channel interaction.
Keywords: Low voltage–activated calcium channel, fatty acid, kinetic model, inactivation, mutant
INTRODUCTION
T-type Ca2+ channels belong to the family of voltage-dependent Ca2+ channels, within which they are mainly distinguished by a relatively low threshold of activation and inactivation, fast deactivation, and a small single channel conductance. T-type channels are widely expressed and are involved in the regulation of multiple cellular functions, including excitability, development, excitation–contraction and excitation–secretion couplings, and acrosome reaction (Perez-Reyes, 2003). The activity of T-type channels may be affected by multiple neurotransmitters and hormones, extracellular pH, redox agents, and antihypertensive, anesthetic, antiarrythmic, and antiepileptic drugs (Vassort and Alvarez, 1994; Huguenard, 1996; Todorovic et al., 2001; Perez-Reyes, 2003).
Remarkably, it has been shown that two related endogenous compounds, arachidonic acid (AA) (Chesnoy-Marchais and Fritsch, 1994; Schmitt and Meves, 1995; Zhang et al., 2000) and the endocannabinoid anandamide (N-arachidonoylethanolamine [AEA]) (Chemin et al., 2001) modulate T-type channels. Both decrease the time constant of macroscopic inactivation and shift the steady-state inactivation curve to more negative potentials, without striking changes in the activation properties. Based on these data, Zhang et al. (2000) proposed that AA inhibits the T-type channel α1H by acting mainly on a voltage-dependent transition between closed states. However, the support of this hypothesis is quite weak for two reasons. First, in the framework of recent models for T-type channel gating (Serrano et al., 1999; Burgess et al., 2002), the putative effects of AA on voltage-dependent transitions between closed states have to be very pronounced to account for the large decrease in current amplitude, but these would modify the activation curve to a much larger extent than observed experimentally. Second, the characterization of the effects of AA on kinetic properties is still too incomplete to propose a proper model for modulation.
In the present study we examined the mechanism of inhibition of the T-type Ca2+ channel subunit α1G by AA in HEK-293 cells. We investigated whether AA effects were dependent on AA metabolism and performed a detailed characterization of changes induced in the gating kinetics of the channel. In addition, structural determinants of modulation by AA were probed by comparing the effects of AA on slow-inactivating mutants with those on the wild-type channel. Experimental data and model simulations suggest that current inhibition in physiological conditions results from the combination of two factors: the switch of the channels into a nonavailable conformation and the shift of the voltage dependence of the steady-state inactivation, which results from the alteration of transitions between inactivated states.
MATERIALS AND METHODS
Solutions
After mounting in the patch-clamp setup, the cells were allowed to stabilize in Krebs solution, containing (in mM) 150 NaCl, 6 KCl, 1 MgCl2, 1.5 CaCl2, 10 glucose, 10 HEPES, titrated to pH 7.4 with 1 N NaOH. The effects of AA on the gating properties of α1G were investigated with whole-cell recordings using an extracellular solution containing (in mM) 2 CaCl2, 150 NaCl, 5 CsCl, 5 glucose, 1 MgCl2, and 10 HEPES and titrated to 7.4 with HCl. For the comparison of the effects on α1G and slow inactivating mutants and the test for tonic inhibition by AA we used 20 mM CaCl2 and 120 mM NMDG+ instead of NaCl. The intracellular solution contained 102 mM CsCl, 10 mM HEPES, 5 mM MgCl2, 5 mM Na2-ATP, 10 mM TEA-Cl, 10 mM EGTA, titrated to pH 7.4 with 1 N CsOH. For inside-out experiments, the pipette solution contained (in mM) 110 CaCl2, 10 HEPES, pH 7.4, and the bath solution 150 CsCl, 1 MgCl2, 1 Na2ATP, pH 7.2. AA, used in its Na-salt form, was dissolved in water. 5,8,11,14-Eicosatetraenoic acid (ETYA) and 17-octadecanoic acid (17-ODYA) were dissolved in DMSO. All chemicals were purchased from Sigma-Aldrich.
Electrophysiology and Data Analysis
Human embryonic kidney cells (HEK-293) were grown in Dulbecco's modified Eagles medium containing 10% (vol/vol) human serum, 2 mM l-glutamine, 2 U/ml penicillin, and 2 mg/ml streptomycin at 37°C in a humidity controlled incubator with 10% CO2. Transient transfection with the wild-type α1G or different constructs (Marksteiner et al., 2001; Staes et al., 2001) was performed using Trans-IT-293 reagents (Mirus). Currents were recorded using an EPC-7 (LIST Electronics) patch-clamp amplifier and filtered with an eight-pole Bessel-filter (Kemo). For control of voltage-clamp protocols and data acquisition, we used an IBM-compatible PC with TL-1 DMA or Digidata 1322A interfaces (Axon Instruments) and pCLAMP-software (Axon Instruments). Patch pipettes (1–2.5 MΩ) were pulled from Vitrex capillary tubes (Modulohm) using a DMZ-Universal puller (Zeitz Instruments). Series resistance was compensated to the maximum extent possible (40–60%). An Ag-AgCl wire was used as reference electrode. Membrane capacitive transients were electronically compensated and the linear background components were digitally subtracted when possible before data analysis. In the case of tail current measurements, linear background components and capacitive transients were subtracted by the application of a −P/4 protocol. Current traces were filtered at 2–5 kHz and digitized at 5–10 kHz. All experiments were performed at 22–25°C.
The activation curve was determined for each cell and experimental condition by dividing the I/V curve by a function Itail = Itail(V) that describes the open pore conduction (see below). Steady-state inactivation curves were fit by
 |
where V inac is the potential of half-maximal inactivation and sinac the slope factor. Steady-state current inhibition was described by a Hill function of the form
 |
where EC 50 is the effective concentration for 50% current inhibition and N is the Hill coefficient. The voltage dependence of the amplitude of tail currents was described in the range from −80 to 90 mV by a cubic function of the form Itail(V) = G(V − Vr)(V 2 + b · V + c), where G is a scaling factor, V r is the reversal potential and b and c are parameters describing the rectification pattern of the open pore conduction (Talavera et al., 2003a,b).
In whole-cell recordings all voltage protocols, the holding potential was −110 mV except when stated otherwise. The stimulation frequency was adjusted for each particular protocol as to ensure at least 5 s of recovery at −110 mV. In inside-out experiments, the holding potential was −80 mV and the stimulation frequency 0.5 Hz.
The data were analyzed using WinASCD (G. Droogmans, KU Leuven; ftp://ftp.cc.kuleuven.ac.be/pub/droogmans/winascd.zip). For all measurements, pooled data are given as mean ± SEM. We used Student's t test, taking P < 0.05 or P < 0.01 as level of significance. We used MATLAB (MathWorks) to solve and fit a Markov model for the gating of α1G in control and in the presence of 3 μM AA (Fig. 10). Parameter optimization and numerical solution of the differential equations were performed with the built-in functions fmin and expm, respectively. Voltage-dependent rate constants were written in the form
 |
and
 |
where ij and ji represent the transitions between each pair of adjacent states in the forward (activation) and the backward (deactivation) directions, respectively. q i is the gating charge associated with the i-th box of the kinetic scheme and δi account for the coupling between the local electric potential sensed by q i and the membrane potential V. T = 25.4 mV is the thermal energy in electron volts.
Figure 10.

Kinetic model used to describe the gating properties of α1G in control and in the presence of AA. At very negative potentials, the channels are in the resting state, in equilibrium between the closed state C1 and the inactivated state I1. Given a supra-threshold depolarization, T-type channels undergo a sequence of transitions between closed states (C1–C3) and eventually transit through an open state (O) before accumulating in a nearly absorbing inactivated state (IO) (Droogmans and Nilius, 1989; Chen and Hess, 1990). The thick arrows represent the voltage-dependent transitions. The dashed arrows indicate the transitions for which the rate at 0 mV is significantly (approximately twofold) increased (+) or decreased (−) by AA, respectively. The decrease in the rate of the transition C3 → C2 predicts the slight increase in activation near the threshold (Fig. 4 C). The increase of kC1I1 and kC2I2 results in the decrease in current amplitude (Fig. 4 B) due to a reduction in channel availability. Modifications of the transitions between inactivated states in the forward (activation) direction explain the shift of the inactivation curve to more negative potentials (Fig. 4 C) and the modifications in the rates of inactivation from closed states (Fig. 5) and of recovery from inactivation (Fig. 6). Changes in the rates kI2C2, kI3C3, and kIoO resulted from the constraint of the model with the principle microscopic reversibility applied for each box of the model.
RESULTS
Extracellular application of 3 μM AA inhibited α1G currents evoked by depolarizations from −110 to −20 mV to 54 ± 4% (n = 6) of the control value and decreased the time constant of inactivation within a few minutes (Fig. 1 A). Inhibition of α1G current was dose dependent, with an effective concentration (EC 50) of 3.9 ± 0.3 μM and a Hill coefficient (N) of 1.6 ± 0.2 (Fig. 1 B).
Figure 1.

Inhibition of the T-type Ca2+ channel α1G by AA. (A) Time course of the amplitude of peak inward currents evoked by pulses to −20 mV from a 5 s–lasting prepulse to −110 mV (holding potential of −80 mV). Horizontal bars indicate the periods of perfusion with AA and 0.5 mg/ml fraction V of BSA. The current traces shown on top correspond to control (a), steady-state inhibition (b), and washout of AA with BSA (c). (B) Concentration-dependent inhibition of α1G currents evoked by pulses from −100 to 0 mV ([Ca2+]ext = 20 mM). Each point corresponds to at least four determinations.
Membrane-delimited Interaction of Arachidonic Acid with α1G
Fig. 2 A shows that extracellular application of 10 μM ETYA, a nonmetabolizable analogue and inhibitor of AA metabolism, decreased the amplitude of the current to 73 ± 6% of its control value. However, it did not modify the extent of AA-induced inhibition (49 ± 3%; n = 6). Application of 17-ODYA (10 μM), an inhibitor of the AA metabolism through the cytochrome P450 pathway into epoxyeicosatrienoic acids and 19/20 HETE, did not alter the α1G current (99 ± 1 of the control value; n = 5) or the inhibition by AA (2 μM; 21 ± 4% in control [n = 3] and 21 ± 5% in the presence of 17-ODYA [n = 5]; Fig. 2 B).
Figure 2.

ETYA and 17-ODYA do not affect the inhibition of α1G by AA. (A) Time course of the amplitude of peak inward currents evoked by pulses to −20 mV from holding potential of −110 mV. Horizontal bars indicate the periods of perfusion with ETYA, AA, and BSA (0.5 mg/ml for fast recovery from AA inhibition). The current traces shown on top correspond to control (a), steady-state inhibition by 10 μM ETYA (b), and 10 μM ETYA plus 3 μM AA (c). (B) Average percentage of peak current inhibition by AA (3 or 2 μM), ETYA (10 μM), and 17-ODYA (10 μM). Overlapping horizontal bars mark the AA-induced inhibition over the inhibition level induced by previous application of ETYA or 17-ODYA.
AA was able to inhibit the activity of α1G in cell-free inside-out patches with similar potency and time course to those observed in whole-cell experiments. Fig. 3 A shows an example of the AA-induced inhibition of currents evoked by voltage ramps from −80 to +20 mV in an inside-out patch. AA effect was rapidly reversed upon washout using BSA (Fig. 3, A and B). In average, application of 3 μM AA induced a 52 ± 4% peak current inhibition (n = 5). Fig. 3 C exemplifies the inhibitory effect of AA on currents evoked by depolarizing pulses from −80 to −10 mV. AA decreased the open probability and promotes the occurrence of null sweeps. Current inhibition can be confirmed by the comparison of the average of current traces recorded in control and in the presence of AA (Fig. 3 D). Notably, both the extent of current inhibition and the acceleration of the macroscopic inactivation were similar to those observed in whole-cell experiments (see Fig. 1 and Fig. 4, B and E). In summary, these results indicate that the inhibition of α1G by AA is not mediated by any of its metabolites and occurs in a membrane-delimited manner.
Figure 3.
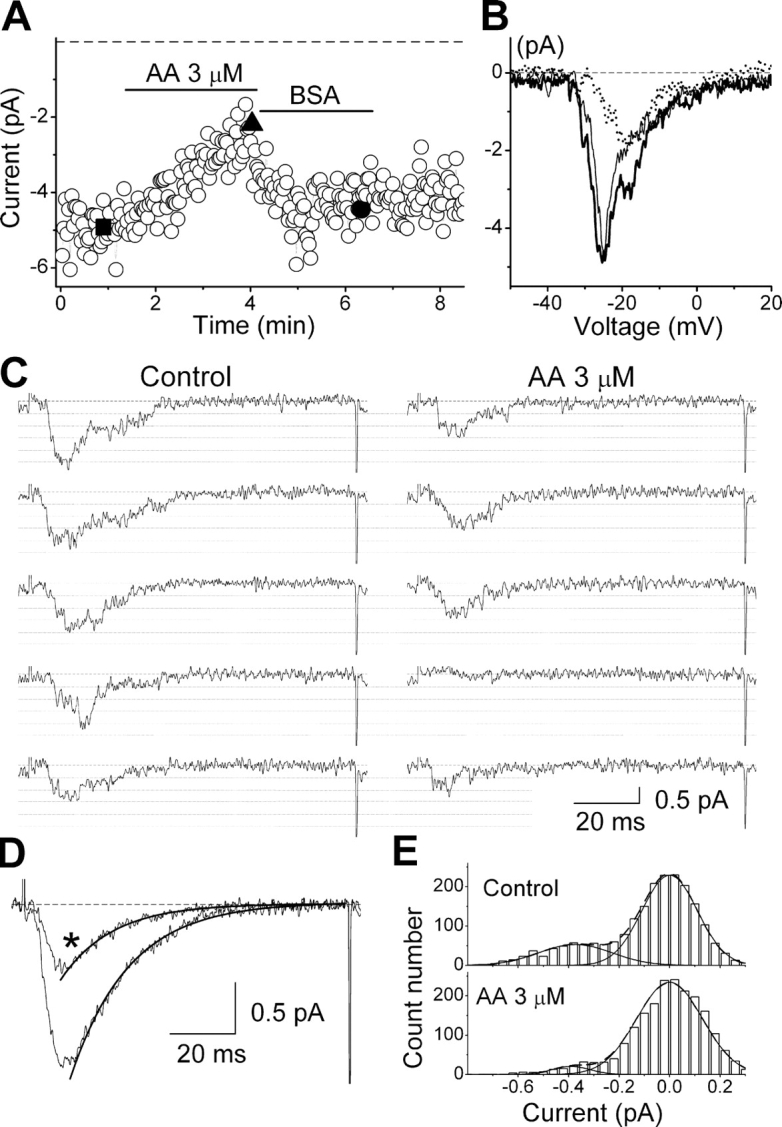
Effects of AA on α1G currents in cell-free inside-out patches. (A) Time course of peak amplitude of currents evoked by 100 ms–lasting voltage ramps from a holding potential of −80 to +20 mV. Horizontal bars indicate the periods of perfusion with 3 μM AA or washout using 0.5 mg/ml BSA. (B) Current traces recorded in control (thick), AA (dotted), and washout (thin), which correspond in A to the points denoted by the filled square, triangle, and circle, respectively. (C) Examples of current traces evoked by voltage pulses from −80 to −10 mV, in control and in the presence of 3 μM AA. Dashed lines indicate the zero-current level, and dotted lines indicate the different levels of current due to the simultaneous opening of up to five channels (unitary amplitude of −0.38 pA). (D) Average of current traces recorded in control and the presence of AA (*). The thick lines represent the fit of the inactivation phase with an exponential function. The time constant of inactivation was 17.8 ± 0.2 ms and 15.7 ± 0.3 ms in control and in AA, respectively. (E) Amplitude histograms built with fragments of current traces including only one channel opening and the zero-current level. The dashed lines represent the fit with the sum of two Gaussian functions (individually represented with continuous lines).
Figure 4.

Effects of 3 μM AA on activation and inactivation properties of α1G. (A) Currents evoked by pulses from −110 mV to −60, −45, −30, or 0 mV in control and in the presence of AA. (B) Average current–voltage relationship in control (filled squares) and in the presence of AA (open circles) (n = 6). For each cell, current amplitudes were normalized to the maximal amplitude in control. The voltage protocol used to obtain the I/V curves is shown in the inset. C–E show average inactivation (n = 5) and activation curves (n = 6), voltage dependence of the time-to-peak (n = 6), and voltage dependence of the time constant of inactivation (n = 6), respectively. In C, the inset in the left shows the voltage protocol used to obtain the inactivation curves. The inset in the right zooms in on the activation curves in the region of the threshold of activation. **, significant difference (P < 0.01) between the values obtained in control and in AA. In panels from B–E, black squares represent control data and open circles those in AA. The lines are the fit with the kinetic model described in discussion.
Both high channel overexpression and clustering made it impossible to observe single channel-containing patches. The size of unitary currents was therefore estimated by the fit of amplitude histograms built with current fragments containing single openings and the zero current level. As shown in Fig. 3 (C and E), the estimated unitary current was not changed by AA (−0.38 ± 0.03 pA in control vs. −0.39 ± 0.03 pA in AA). These results were confirmed by the analysis of histograms built with full current traces containing multiple channel openings (unpublished data).
Arachidonic Acid Effects on the Gating of α1G
To study the effects of AA on the gating properties of α1G we compared whole-cell data obtained in control conditions with those collected at the steady-state level of inhibition after a 3–4-min perfusion with 3 μM extracellular AA.
Activation and Inactivation
In order to study the effects of AA on activation properties of α1G, current–voltage relationships (I/V curves) were determined from the peak amplitude of currents elicited by 200 ms–lasting voltage steps from a holding potential of −110 mV to potentials varying from −80 to 60 mV (Fig. 4 B, inset). Fig. 3 A exemplifies the effects of AA on the current traces elicited by steps to −60, −45, −30, or 0 mV. As can be observed in the I/V curves (Fig. 4 B), AA induced a significant decrease of the current amplitude at potentials positive to −55 mV. Fig. 4 C shows that AA did not significantly modify the activation curve at potentials positive to −55 mV and caused a small but significant increase of activation near the threshold (inset in the right). Steady-state inactivation curves h∞ = h∞(V) were determined from normalized peak amplitudes of currents recorded at −20 mV after 5 s–lasting prepulses to potentials from −110 to −55 mV (Fig. 4 C, left inset). AA shifted the inactivation curve to more negative potentials, with a voltage for half-maximal inactivation V inac = −87.3 ± 1.0 mV compared with −74.2 ± 0.8 mV in control (Fig. 4 C). However, it did not affect the voltage sensitivity of steady-state inactivation (sinac = 4.3 ± 0.2 mV in control and s inac = 4.35 ± 0.09 mV in the presence of AA).
We have assessed the effects of AA on the kinetics of activation and inactivation from the voltage dependences of the time-to-peak (t p) and the time constant of inactivation (τinac). AA significantly decreased t p at potentials negative to −55 mV, but did not significantly alter the values at depolarized potentials (Fig. 4 D). On the other hand, τinac was significantly reduced at all voltages (Fig. 4 E).
Kinetics of Inactivation from Closed States
The results described above indicate that AA speeds up the transition from the open to the inactivated state, but give no clues about the possible effect of AA on the rate of inactivation from closed states. We therefore studied the effects of AA on the time course of the onset of inactivation at potentials below the threshold of channel activation. This was achieved by measuring the amplitude of the currents elicited by pulses to −20 mV, applied after steps of variable duration to −85 or −75 mV (Fig. 5 C, inset). These amplitudes were normalized to that of the current elicited with a pulse to −20 mV from a holding potential of −110 mV. The data were then subtracted from 1 and plotted as a function of the time of sojourn at −85 or −75 mV. Fig. 5 shows that AA increased the steady-state level of inactivation at both −85 and −75 mV, in accordance with the hyperpolarizing shift of the inactivation curve. However, AA only slightly increased the rate of inactivation from closed states, as shown by the comparison of normalized data (Fig. 5 D).
Figure 5.

Effects of 3 μM AA on the kinetics of inactivation from closed states. (A and B) Example currents elicited by pulses to −20 mV, applied after steps of variable duration to −85 and −75 mV, respectively. The thick traces correspond to currents elicited from a holding potential of −110 mV. Thin and dashed traces correspond to currents recorded after 200 ms and 5 s–lasting prepulses (to −85 or −75 mV), respectively. For each condition, the traces were superimposed to allow better comparison. (C) Average time dependence of onset of inactivation at −85 (squares; n = 9) and −75 mV (circles; n = 7) in control (filled symbols) and in the presence of AA (open symbols). Continuous lines represent the fit with the kinetic model described in discussion. The inset shows the voltage protocol used. (D) The datasets shown in panel C were normalized to the values obtained at 5 s for −85 (left) and −75 mV (right).
Reactivation
Membrane repolarization returns T-type Ca2+ channels from inactivated to the resting state, a process known as reactivation or recovery from inactivation. Reactivation kinetics at −110 or −80 mV were determined using a standard double pulse protocol to −20 mV with inter-pulse potential of −110 or −80 mV (Fig. 6 A). Reactivation was calculated as a function of the inter-pulse duration by the ratio between the current amplitude in each pulse (I(pulse2)/I(pulse1)). AA did not affect recovery at −110 mV, but at −80 mV it significantly reduced the level of steady-state recovery (Fig. 6, B and C) and decreased the rate of reactivation, as clear from the comparison of the normalized data (Fig. 6 C, inset). We also examined the effect of AA on the voltage dependence of recovery for a fixed repolarization period (100 ms) (Fig. 6, D and E). The voltage dependence of channel recovery showed a biphasic behavior in control, with an increasing phase up to around −95 mV and a decreasing phase at less negative potentials. The data from −95 to −55 mV was described by the same type of Boltzmann function used for h ∞ (V) with parameters V reac = −76.9 ± 0.7 mV and s reac = 3.4 ± 0.2 mV. AA shifted the voltage dependence of channel recovery to more negative potentials (V reac = −89.3 ± 0.1 mV) and decreased the voltage sensitivity (s reac = 4.02 ± 0.09 mV).
Figure 6.

Modification of reactivation properties by 3 μM AA. (A) Voltage protocol used to obtain the reactivation curves. The interval between the pulses to −20 mV was progressively increased from 3 ms to 10 s and the inter-pulse potential was set to −110 or −80 mV. (B) Typical current traces elicited during the reactivation protocol in control and after application of AA, for inter-pulse potential of −80 mV. The dashed traces correspond to the currents elicited by the first pulse and the continuous traces to the currents elicited by the second pulses. The numbers beside the traces indicate the time interval separating the pulses. The traces were superimposed to allow better comparison. (C) Average time course of recovery from inactivation at −110 (squares; n = 5) and −80 mV (circles; n = 5) in control (filled symbols) and in the presence of AA (open symbols). The inset shows the data for −80 mV, normalized to the values obtained at 10 s. (D) Example of current traces elicited by two pulses to −20 mV, separated by 100 ms at −120, −95, −75, or −55 mV (numbers next to the traces). (E) Average voltage dependence of the reactivation for 100-ms inter-pulse interval. The voltage protocol used is shown in the inset. In D and E, the continuous lines are the result of the fit with the kinetic model described in discussion.
Deactivation and Macroscopic Conduction
When in the open conformation, T-type channels can close back to the nearest closed (noninactivated) state. This transition, known as deactivation, determines the mean open time and the bursting behavior. To study the possible effects of AA on the voltage dependence of the deactivation kinetics, tail currents were recorded during voltage steps between −120 and +110 mV following a 7.5 ms–lasting depolarization to −20 mV (Fig. 7 A, top left inset). We determined the amplitude (I tail) and the time constant of current decay (τdecay) from a single-exponential fit of the time course of the tail currents. τdecay corresponds to the time constant of deactivation (τdeac) at potentials negative to the activation threshold and to the time constant of the macroscopic inactivation (τinac) at supra-threshold potentials. Fig. 7 A shows that AA does not affect the voltage dependency of the time constant of deactivation of α1G (τdeac). On the other hand, AA decreased the time constant of tail current decay at potentials positive to the activation threshold, accordingly with the effects observed for the time constant of macroscopic inactivation (Fig. 4 E). Application of 3 μM AA decreased the amplitude of tail currents to ∼50% without significant effects on the rectification pattern or the reversal potential of the channels (Fig. 7 B). This indicates that AA does not interact with the open state of the channel so as to affect its macroscopic conduction properties.
Figure 7.

AA does not modify the deactivation or the macroscopic conduction properties of α1G. (A) Average time constant of the decay (τdecay) of tail currents through α1G in control (filled squares) and in the presence of 3 μM AA (open circles) (n = 7). The inset in the upper left corner shows the voltage protocol used. The exponential phase at potentials negative to the activation threshold corresponds to the voltage dependence of the time constant of deactivation. The plateau phase at potentials positive to the activation threshold corresponds to the time constant of inactivation from the open state. The continuous lines represent the fit with the kinetic model described in discussion. The inset in the bottom right corner shows examples of tail currents recorded at −80 mV, fit by single-exponential functions, in control and in the presence of AA (*). (B) Amplitude of tail currents evoked in control (filled squares) or in the presence of AA (open circles). For each cell, the amplitudes were normalized to that at −80 mV. The triangles represent the amplitudes obtained in the presence of AA but normalized with respect to the values at −80 mV in control. The inset zooms in on the range from −80 to 90 mV and shows the fit of the data with the function Itail = Itail(V) (see materials and methods). The parameters used to describe the rectification pattern and the reversal potential were not significantly different between control: b = −120 ± 13 mV, c = (7.2 ± 0.9) · 103 mV2, and V r = 42 ± 3 mV; and in the presence of AA: b = −120 ± 20 mV, c = (9.0 ± 1.2) · 103 mV2, and V r = 38 ± 5 mV.
Two Components of AA Effect on the Gating of α1G
The observations that AA significantly inhibited the current at a holding potential of −110 mV, but did not affect the steady-state inactivation (Fig. 4 C) or the recovery (Fig. 6) at this potential, indicate that the modified gating properties are not the main cause of channel inhibition at −110 mV and may suggest that both effects of AA are unrelated. In a way to test this hypothesis we determined whether the current inhibition was temporally correlated with the modification of the inactivation kinetics. Fig. 8 A shows the time course of the amplitude of currents evoked by depolarizing pulses to −20 mV that were applied every 5 s, alternatively from a holding potential of −110 mV (I 1) or from a preceding 120 ms–lasting pulse to −75 mV (I 2). The data points represent interpolated current amplitudes normalized to the maximal current evoked from −110 mV under control condition in each cell. The depolarization to −75 mV, which inactivates a fraction of closed channels, accelerates the time course of AA current inhibition. If we calculate the fraction of inactivated channels at the end of the −75-mV prepulse, which we quantify as Onset(t) = 1 − I2/I1, it becomes clear that this fraction increases during exposure to AA. This increase occurred with a time constant τonset = 14 ± 2 s, which is smaller than that for the inhibition of the current evoked from −110 mV (τinh = 57 ± 2 s), indicating that the changes of current amplitude and of the rate of inactivation from closed states are temporally distinct (see inset). In contrast, the time course of the rate of inactivation from the open state (τ τ inac = 37 ± 2 ms; Fig. 8 C) correlates well with that of the reduction in current amplitude.
Figure 8.

The AA-induced changes in current amplitude and in the onset of inactivation have different time courses. (A) Time course of the amplitude of currents through α1G evoked by pulses to −20 mV that were applied alternatively from a holding potential of −110 mV (I1, circles) or from a 120 ms–lasting pulse to −75 mV (I2, squares) (see inset). To estimate the time course of the onset of inactivation, both datasets were homogenized in time by linear interpolation between each pair of consecutive points. For each cell, the values were normalized with respect to the maximal peak current amplitude in control condition. (B) Increase of the fraction of inactivated channels (Onset) by the application of AA. The inset plots the values of Onset versus the amplitude of currents evoked from the holding potential of −110 mV (I1), corresponding to the same time points. The changes of Onset do not strictly correlate with the changes in peak current amplitude. (C) Time course of the time constant of inactivation from the open state. The inset shows that the AA-induced changes in τinac correlate with the changes in current amplitude. The continuous lines represent the fit of time courses of I1, Onset, and τinac in the presence of AA by single exponential functions.
AA Interacts with Both Resting and Inactivated States of α1G
To test if the interaction of AA with α1G is state dependent, we used the following protocol. First, current amplitude was monitored in control by repetitive depolarizations from −100 to 0 mV. Stimulation was then stopped and cells were incubated with 3 μM AA for 3 min, during which the membrane potential was clamped at either −100 or 0 mV ([Ca2+]ext = 20 mM). Stimulation was then resumed with the same protocol used in control. Tonic inhibition was estimated from the comparison of the peak current in control and the peak current in the first pulse after resuming stimulation. We observed a tonic inhibition of 32 ± 5% (n = 5) and 39 ± 4% (n = 3) for perfusion periods at −100 and 0 mV, respectively, and no further significant decrease of current amplitude. The values of tonic inhibition were not significantly different to the level of steady-state inhibition by AA during repetitive stimulations (37 ± 5%; n = 8).
Molecular Determinants of Macroscopic Inactivation of α1G Modulate the Inhibition by Arachidonic Acid
The results described above indicate that AA modifies the inactivation of α1G. This suggested to us that α1G mutants that show slowed macroscopic inactivation (Marksteiner et al., 2001; Staes et al., 2001) might display different sensitivity to AA. Fig. 9 A shows a representation of the structure of α1G and the mutants investigated. GCΔC4 is a chimera in which the last 409 amino acids of α1G are replaced by the amino acids 1540–2166 of α1C. This chimera conserves the first 23 amino acids of the COOH terminus we have previously reported to be necessary for fast inactivation of α1G (Staes et al., 2001). In GCΔC5 and GΔC1, the first 23 amino acids of the COOH terminus of α1G were substituted by the corresponding stretch of α1C or deleted, respectively. Marksteiner et al. (2001) described what they called a “hot spot” of determinants of fast inactivation in the S6 segment of the third domain of α1G. To diversify the structural determinants of fast inactivation to be tested for AA sensitivity, we also studied the mutant M1510I, which shows an ∼10-fold decrease in the rate of macroscopic inactivation with respect to α1G.
Figure 9.

Comparison of AA effects on α1G and slow-inactivating mutants. (A) Schematic view of the wild-type α1G and the different mutants tested for AA sensitivity. White and black colors correspond to the sequence of α1G and α1C channels, respectively. The arrow in GΔC1 marks the deletion of the first 23 amino acids of the COOH terminus of α1G. The symbols below the channel names refer to the data points in all panels. (B) Examples of currents through α1G and the slow-inactivating mutants recorded in control (thick traces) and in the presence of 3 μM AA (thin traces). Test pulse to 0 mV from a holding potential of −100 mV. Note the different time scale for M1510I. (C) Average time dependency of the inhibition of currents through α1G and the GCΔC5 and M1510I mutants by 3 (empty symbols) or 10 (filled symbols) μM AA. Currents were elicited every 20 s by pulses to 0 mV that were given from a 5 s–lasting prepulse to −100 mV (the holding potential was −70 mV). The lines represent the fit with single exponential functions. (D) Average cumulative dose responses to AA of the peak amplitude of currents through GCΔC4 and the slow-inactivating mutants. Each point corresponds to at least four determinations. The dotted curve is the fit of the data for α1G (Fig. 1 B). Continuous lines are the fit of the data for each mutant. (E) Time constant of the inhibition of currents through α1G (black bars) and the GCΔC5 (white bars) and M1510I (dashed bar) mutants. (F) Values of EC50 (black bars) and Hill coefficients (white bars) obtained from the dose responses shown in D. (G) Effect of AA concentration on the time constant of inactivation of α1G and the mutant channels. The data from α1G and the GCΔC4 mutant were pooled and fit with a Hill function. AA did not alter τinac in the slow-inactivated mutant, for which the horizontal lines represent average values. Filled symbols indicate values in control and were arbitrarily placed at 3 nM [AA].
Fig. 9 B shows examples of the inhibition of currents through α1G and the slow-inactivating mutants GCΔC5, GΔC1, and M1510I by 3 μM AA. All these mutants were inhibited faster and to a larger extent than α1G (Fig. 9, C and E). The higher sensitivity of slow-inactivated mutants was confirmed by the comparison of the dose–response curves (Fig. 9 D). The values of EC 50 and Hill coefficient (N) for GCΔC5, GΔC1, and M1510I were significantly lower than for the wild type (Fig. 9 F). Notably, the GCΔC4 mutant, which inactivates as fast as α1G (Staes et al., 2001), showed a nearly identical sensitivity to that of the wild type. Taken together, these data suggest that the AA sensitivity is modulated by the structural determinants of fast inactivation of α1G.
A typical feature of AA modulation of T-type channels is the decrease of the time constant of inactivation. Remarkably, α1G and the GCΔC4 mutant showed similar reduction of this parameter with increasing doses of AA (Fig. 9 G). The effective concentration and the Hill coefficient describing the pooled data of both channels were 2.4 ± 1.2 μM and 1.5 ± 0.8, respectively. In contrast, AA did not affect the time constant of inactivation of any of the slow-inactivating mutants (Fig. 9 G), indicating that the increase of the rate of inactivation from the open state is not a determinant for AA-induced inhibition.
DISCUSSION
In the present study we investigated the mechanism of modulation of α1G by arachidonic acid as an essential step in understanding its influence on the physiology of T-type channels. To our knowledge, this is the first study applying model simulations to provide for a mechanism of AA modulation of the gating of a voltage-dependent channel and to address directly the structural determinants of AA interaction with voltage-dependent Ca2+ channels. We demonstrate that AA can inhibit α1G currents directly, by exerting two independent effects, (a) reducing channel availability and (b) shifting the voltage dependence of the steady-state inactivation to more negative potentials. We also show that AA interacts with α1G in both resting and inactivated states and that structural determinants of inactivation modulate the affinity for AA.
We show that AA effects on α1G are ∼10-fold faster and more potent than those reported for α1H (Zhang et al., 2000). This difference is probably due to an α1 subunit specificity of AA effects. Schmitt and Meves (1995) reported that in the NG108-15 cell line, which mainly expresses α1H (Chemin et al., 2002), AA produced a continuous and slow decrease of T-type current amplitude with a similar range of potency (25–100 μM) to that observed by Zhang et al. (2000). In contrast, Chesnoy-Marchais and Fritsch (1994) showed that the effects of 2–10 μM AA on the T-type currents of rat osteoblastic cells, which mainly express α1G (Gu et al., 1999), developed within a few minutes, more like the results presented here.
AA Interacts with α1G in a Membrane-delimited Fashion
To fully understand the mechanism of AA inhibition it is important to know whether AA and/or some of its metabolites or PKC activation are responsible for this effect. Zhang et al. (2000) showed that the inhibition of the T-type channel subunit α1H is partially antagonized by the preincubation with the epoxygenase inhibitor 17-ODYA or by the intracellular perfusion of a PKC inhibitor. However, Park et al. (2003) reported the absence of inhibitory effects of PKC in the three T-type isoforms when expressed in HEK-293 cells. We confirmed this result for α1G (unpublished data). Our data indicate that AA is directly responsible for the decrease of the α1G current, as the application of 17-ODYA and ETYA, a nonmetabolizable analogue and inhibitor of the AA metabolism, did not influence the inhibition by AA (see also Schmitt and Meves, 1995). It could be also speculated that AA acts through its conversion to anandamide via the reverse mode of fatty acid amide hydrolase (FAAH). However, this hypothesis can be rejected as AA has stronger effects on α1G than anandamide (Chemin et al., 2001; see below). Furthermore, AA was able to inhibit α1G in cell-free inside-out patches with similar potency and time course to those observed in whole-cell experiments. In addition, FAAH is not expected to produce anandamide from AA in inside-out patches given the lack of ethanolamine in the bath solutions (Arreaza et al., 1997). In summary, we demonstrated that AA inhibits α1G channels in a membrane-delimited manner, though it remains to be elucidated whether this action is exerted by binding to the protein itself or, indirectly, by modifying the lipid environment.
Modulation of α1G Gating by AA: Mechanistic Insights from Kinetic Modeling
Currently available information on the effects of AA on the gating properties of T-type channels is scarce and does not provide solid support to previous hypotheses on the mechanism of modulation (see introduction). We therefore studied the effect of AA on the voltage dependencies of activation and steady-state inactivation, the rate of inactivation from open and closed states, the recovery from inactivation, the deactivation, and on the macroscopic conduction properties of the T-type channel α1G. To analyze these data in a compact and consistent way we used a Markov model that describes the gating properties of α1G (Fig. 10), following a similar approach to that previously used to study the effects of extracellular pH and Ca2+ concentration (Talavera et al., 2003a) and mutations in the selectivity filter (Talavera et al., 2003b) on the gating properties of α1G. Table I lists the optimal values of model parameters that describe the data in control and in the presence of 3 μM AA (Figs. 4–7). The interpretation of these results is given in the following paragraphs.
TABLE I.
Model Parameters Optimized to Fit the Experimental Data
| Value | Value | ||||||
|---|---|---|---|---|---|---|---|
| Parameter | Control | AA 3 μM | Parameter | Control | AA 3 μM | ||
| q1 | 1.95 | δ1 | 0.664 | 0.633 | |||
| q2 | 4.79 | δ2 | 0.013 | ||||
| q3 | 0.799 | δ3 | 0 | ||||
| KC1C2 | 6.55 | 4.86 | KC2C1 | 5.31 | 3.40 | ||
| KC2C3 | 11.9 | 10.3 | KC3C2 | 7.76 × 10⁻⁴ | 3.34 × 10⁻⁴ | ||
| KC3O | 1.79 | KOC3 | 3.82 × 10⁻³ | ||||
| KI1I2 | 0.0523 | 0.108 | KI2I1 | 1.01 × 10⁻³ | 9.63 × 10⁻⁴ | ||
| KI2I3 | 0.325 | 19.3 | KI3I2 | 2.44 × 10⁻⁷ | 3.31 × 10⁻⁷ | ||
| kI3Io | 0.511 | 2.42 × 10⁻³ | kIoI3 | 3.82 × 10⁻³
5.55 × 10⁻⁴ |
|||
| kC1I1 | 2.68 × 10⁻³ | 5.00 × 10⁻³ | kI1C1 | ||||
| kC2I2 | 0.461 | 0.917 | kI2C2 | 2.27 × 10⁻³ | 1.30 × 10⁻³ | ||
| kC3I3 | 9.22 × 10⁻³ | 7.77 × 10⁻³ | kI3C3 | 5.23 × 10⁻⁷ | 5.80 × 10⁻⁹ | ||
| kOIo | 0.11 | 0.125 | kIoO | 2.18 × 10⁻⁵ | 6.09 × 10⁻⁵ | ||
Given the absence of any indication that AA might alter the size of the gating charges (q1–q3), these values were fixed to those obtained for control. Changes in the coupling between the local fields sensed by the gating charges and the membrane potential (δ1–δ3) did not improve the fit of the data obtained in AA. AA shifts the foot of the activation curve of α1G to more negative potentials (Fig. 4 C). This can be accounted for by varying the rate constant of the transitions between the closed states of the activation pathway, especially by decreasing K C3C2 (Table I and Fig. 10). Interestingly, this result may also explain the observations of Zhang et al. (2000), who described the effects on the activation curve of the T-type channel α1H as an increase of the slope factor. More dramatic shifts in the activation curve of T-type channels were described previously (Chesnoy-Marchais and Fritsch, 1994; Schmitt and Meves, 1995), and also for high voltage–activated Ca2+ channels (Barrett et al., 2001; Liu et al., 2001) and Na+ channels (Lee et al., 2002). On the other hand, AA had no significant effect on the deactivation properties of α1G (Fig. 7), indicating that it does not affect the transition from the open to the nearest closed state (O → C3; Fig. 10).
In contrast, AA profoundly modified the inactivation properties by shifting the voltage dependence of steady-state inactivation by ∼13 mV to more negative potentials (Fig. 4 C), an effect that was reflected in the voltage dependence of the recovery from inactivation (Fig. 6 E). However, AA only slightly increased the rate of inactivation from closed states (onset of inactivation) and decreased the rate of recovery from inactivation at −80 mV (Fig. 5 D and inset of Fig. 6 C). These results can be explained by a slight increase of rate of the transition I1 → I2 and a more pronounced increase of the rate of transition I2 → I3, which were partially balanced by a decrease of the rate of the transition I3 → IO (Table I and Fig. 10). We propose that the increase in the rate of transitions between inactivated states in the forward (activation) direction is the basis of the negative shift of the inactivation curve induced by AA and related compounds in voltage-dependent Na+ (Fraser et al., 1993; Xiao et al., 1995; Vreugdenhil et al., 1996; Bendahhou et al., 1997; Lee et al., 1999, 2002; Leifert et al., 1999) and Ca2+ channels (Chesnoy-Marchais and Fritsch, 1994; Schmitt and Meves, 1995; Petit-Jacques and Hartzell, 1996; Unno et al., 1996; Zhang et al., 2000; Chemin et al., 2001).
We also observed a decrease of the time constant of macroscopic inactivation (τinac), but in contrast with Zhang et al. (2000), AA did not affect the voltage sensitivity of this parameter but induced a more uniform reduction over the whole voltage range. This is accounted for by an ∼14% increase in the rate of the transition between the open state and the nearest inactivated state (O → IO; Table I).
One of the most important conclusions that can be derived from the experimental data and the kinetic modeling is that the decrease in current amplitudes for depolarizations from a holding potential of −110 mV (Fig. 4 B) cannot be explained by any of the AA effects on macroscopic gating we observed. Our results demonstrate that this decrease does not result from the modification of the conduction properties of α1G since AA did not change the unitary current and did not significantly modify the rectification pattern of the open pore conduction or the reversal potential of α1G. Notably, AA did not affect the unitary conductance of Ca2+ (Liu and Rittenhouse, 2000), Na+ (Xiao et al., 1995; Bendahhou et al., 1997), Cl− (Anderson and Welsh, 1990; Hwang et al., 1990), K+ (Bringmann et al., 1998; Devor and Frizzell, 1998), and NMDA receptor channels (Miller et al., 1992).
Single channel data from L-type Ca2+ channels of rat sympathetic neurons revealed that the AA-induced reduction of macroscopic current is due to an increased probability of null sweeps (Liu and Rittenhouse, 2000). Our results from inside-out patches are consistent with this mechanism (Fig. 3 B). Within this view, AA induces a fraction of channels to transit to a nonfunctional conformation or, alternatively, an increase in the rate of inactivation from closed states (Fig. 4 B and Table I). We denote, therefore, that AA exerts two different actions on the gating of α1G, one on the transitions between inactivated states and another by which it decreases the fraction of channels that are available to open. The distinct time courses of the decrease of current amplitude and the increased inactivation from closed states (Fig. 8) provide further support for this contention. In addition, this observation indicates that the interaction of AA with the channel is in the range of several seconds, in contrast with the estimate of minutes obtained from the decrease of current amplitude.
We found that AA induced similar tonic inhibition after perfusion periods during which the membrane potential was held at −100 or 0 mV. This proves that AA interacts indistinctively with both the resting and inactivated states of α1G. The analysis of the data by model simulations indicates, however, that this interaction only alters certain gating transitions.
Molecular Determinants of Macroscopic Inactivation Modulate AA Sensitivity
AA effects on the inactivation properties of α1G suggested us to test the effects of AA on several slow-inactivating mutants of α1G (Fig. 9 A) (Marksteiner et al., 2001; Staes et al., 2001). Remarkably, all of them showed an enhanced AA sensitivity with respect to α1G. Furthermore, the GCΔC4 chimera, with a major modification in the COOH terminus but the same fast-inactivation pattern as the wild-type α1G (Staes et al., 2001), showed a similar sensitivity to that of α1G. To explain these results, it could be envisaged that AA inhibits preferentially noninactivated channel conformations. However, this is contradicted by the absence of inhibition of wild-type currents at potentials at which there is a relatively slow rate of inactivation (i.e., close to the activation threshold; Fig. 4 B) and by the tonic inhibition observed after AA was applied at 0 mV (channels in the inactivated state). The simplest explanation for these observations is that the mutations we studied induce an increase in the affinity of a putative AA–channel interaction, independently of the effects on the rate of macroscopic inactivation.
Further analysis of the data obtained for the mutant channels allows us to extract some complementary conclusions. First, the AA–channel interaction is not determined by the specific sequence of the last 409 amino acids of the COOH terminus of α1G. Second, AA does not significantly inhibit α1G by acting on the open state, since it does not modify the rate of inactivation from the open state in the slow-inactivating mutants, in contrast to the case of α1G and the GCΔC4 chimera. And third, the faster inhibition observed for the slow-inactivating mutants (Fig. 9 C) indicates that channel conformation is an important determinant of the rate of inhibition, in contrast with the hypothesis of slow metabolism of AA to other active compounds as the only cause of the slow action of AA (Zhang et al., 2000).
Interestingly, the structural determinants of modulation by AA or analogue compounds have been also mapped in S6 transmembrane segments in the human cardiac Na+ channel hH1α (Xiao et al., 2001) and the intermediate conductance Ca2+-activated K+ channel hIK1 (Hamilton et al., 2003) or in intracellular domains, NH2 terminus of ROMK1 (Macica et al., 1998), and COOH terminus of TREK-2 (Kim et al., 2001), TREK-1 (Patel et al., 1998; Maingret et al., 2000), and Kir3.4 (Rogalski and Chavkin, 2001). Given the low sequence analogy among these channels, including T-type channel α1G, it is likely that fatty acid–channel interactions are determined by analogous tertiary structures rather than by the presence of conserved consensus binding motifs.
Functional Relevance of AA Modulation of T-type Channels
AA is a ubiquitous second messenger that modulates a wide range of cellular processes (Piomelli, 1993). We have shown that AA directly inhibits the opening of α1G, which limits the contribution of this channel to the early depolarization phase in excitable tissues. In addition, AA significantly shifts the inactivation curve to more negative potentials without dramatic effects on the activation curve. Consequently, AA is expected to decrease the window current, thereby limiting the Ca2+ influx through α1G at basal membrane potentials in both nonexcitable and excitable tissues. Therefore, α1G is a possible target for AA-induced cytoprotection and decrease of neuronal and cardiac excitability. Indeed, in parallel to the action of some antiepileptic drugs (Huguenard, 1996; Heady et al., 2001), the inhibition of T-type currents due to accumulation of free AA (Bazan, 1989; Van der Vusse et al., 1997) may underlie a mechanism of protection against neuronal and cardiac damage during epileptic and ischemic episodes. Analogously, the antiarrhythmic (Kang and Leaf, 2000), bradycardic (Mullane et al., 1979), and hypotensive (Damas and Troquet, 1978; Lee and Murthy, 1979; Mullane et al., 1979) effects of AA may be partially due to the inhibition of T-type channels, but further investigation is required to support these hypotheses.
Chemin et al. (2001) reported the inhibition of recombinant and native T-type channels by the endocannabinoid anandamide (AEA) and discussed the possible significance of this modulation in the mechanisms of slow-wave sleep, epilepsy, nociception, heart pacemaking, and cellular proliferation and development. These authors argued for a direct effect of AEA on T-type channels. However, we show here that the product of AEA hydrolysis via the action of FAAH, AA, also has an inhibitory effect on α1G. In fact, in addition to the negative shift of the inactivation curve, AA inhibits this channel at very negative holding potentials, in contrast to the observations with AEA. Chemin et al. (2001) showed that 3 μM AEA produces ∼40% inhibition of α1G current amplitude at a holding potential of −80 mV, while we predict that, at the same concentration, AA induces a 90% inhibition at this holding potential. This indicates that after AEA hydrolysis, the effect on α1G is enhanced through the action of AA. In contrast, comparison with studies on α1H (Schmitt and Meves, 1995; Zhang et al., 2000) suggests that hydrolytic function of FAAH attenuates the effects of AEA, due to the relatively lower sensitivity of this channel to AA.
Acknowledgments
We thank Drs. F. Hofmann and N. Klugbauer for the α1G clone (Technische Universität München, München, Germany). We are also grateful to Drs. T. Voets, J.L. Alvarez, G. Vassort, G. Owsianik, K. Mubagwa, and J. Vereecke for helpful discussions. The expert technical assistance of J. Prenen, M. Crabbé, H. Van Weijenbergh, S. de Swaef, and M. Schuermans is greatly acknowledged.
This work was supported by the Belgian Federal Government (Interuniversity Poles of Attraction Program, Prime Ministers Office, IUAP Nr.3P4/23), the Flemish Government, and the Onderzoeksraad KU Leuven (GOA 99/07, F.W.O. G.0237.95, F.W.O. G.0214.99, F.W.O. G.0136.00).
Olaf S. Andersen served as editor.
Abbreviations used in this paper: AA, arachidonic acid; AEA, N-arachidonoylethanolamine; ETYA, 5,8,11,14-eicosatetraenoic acid; FAAH, fatty acid amide hydrolase.
References
- Anderson, M.P., and M.J. Welsh. 1990. Fatty acids inhibit apical membrane chloride channels in airway epithelia. Proc. Natl. Acad. Sci. USA. 87:7334–7338. [DOI] [PMC free article] [PubMed] [Google Scholar]
- Arreaza, G., W.A. Devane, R.L. Omeir, G. Sajnani, J. Kunz, B.F. Cravatt, and D.G. Deutsch. 1997. The cloned rat hydrolytic enzyme responsible for the breakdown of anandamide also catalyzes its formation via the condensation of arachidonic acid and ethanolamine. Neurosci. Lett. 234:59–62. [DOI] [PubMed] [Google Scholar]
- Barrett, C.F., L. Liu, and A.R. Rittenhouse. 2001. Arachidonic acid reversibly enhances N-type calcium current at an extracellular site. Am. J. Physiol. Cell Physiol. 280:C1306–C1318. [DOI] [PubMed] [Google Scholar]
- Bazan, N.G. 1989. Arachidonic acid in the modulation of excitable membrane function and at the onset of brain damage. Ann. NY Acad. Sci. 559:1–16. [DOI] [PubMed] [Google Scholar]
- Bendahhou, S., T.R. Cummins, and W.S. Agnew. 1997. Mechanism of modulation of the voltage-gated skeletal and cardiac muscle sodium channels by fatty acids. Am. J. Physiol. 272:C592–C600. [DOI] [PubMed] [Google Scholar]
- Bringmann, A., S.N. Skatchkov, B. Biedermann, F. Faude, and A. Reichenbach. 1998. Alterations of potassium channel activity in retinal Muller glial cells induced by arachidonic acid. Neuroscience. 86:1291–1306. [DOI] [PubMed] [Google Scholar]
- Burgess, D.E., O. Crawford, B.P. Delisle, and J. Satin. 2002. Mechanism of inactivation gating of human T-type (low-voltage activated) calcium channels. Biophys. J. 82:1894–1906. [DOI] [PMC free article] [PubMed] [Google Scholar]
- Chemin, J., A. Monteil, E. Perez-Reyes, J. Nargeot, and P. Lory. 2001. Direct inhibition of T-type calcium channels by the endogenous cannabinoid anandamide. EMBO J. 20:7033–7040. [DOI] [PMC free article] [PubMed] [Google Scholar]
- Chemin, J., J. Nargeot, and P. Lory. 2002. Neuronal T-type α1H calcium channels induce neuritogenesis and expression of high-voltage-activated calcium channels in the NG108-15 cell line. J. Neurosci. 22:6856–6862. [DOI] [PMC free article] [PubMed] [Google Scholar]
- Chen, C.F., and P. Hess. 1990. Mechanism of gating of T-type calcium channels. J. Gen. Physiol. 96:603–630. [DOI] [PMC free article] [PubMed] [Google Scholar]
- Chesnoy-Marchais, D., and J. Fritsch. 1994. Concentration-dependent modulations of potassium and calcium currents of rat osteoblastic cells by arachidonic acid. J. Membr. Biol. 138:159–170. [DOI] [PubMed] [Google Scholar]
- Damas, J., and J. Troquet. 1978. Hypotensive action of arachidonic acid in rats and rabbits. Arch. Int. Physiol. Biochim. 86:1147–1151. [DOI] [PubMed] [Google Scholar]
- Devor, D.C., and R.A. Frizzell. 1998. Modulation of K+ channels by arachidonic acid in T84 cells. II. Activation of a Ca2+-independent K+ channel. Am. J. Physiol. 274:C149–C160. [DOI] [PubMed] [Google Scholar]
- Droogmans, G., and B. Nilius. 1989. Kinetic properties of the cardiac T-type calcium channel in the guinea-pig. J. Physiol. 419:627–650. [DOI] [PMC free article] [PubMed] [Google Scholar]
- Fraser, D.D., K. Hoehn, S. Weiss, and B.A. MacVicar. 1993. Arachidonic acid inhibits sodium currents and synaptic transmission in cultured striatal neurons. Neuron. 11:633–644. [DOI] [PubMed] [Google Scholar]
- Gu, Y., M.R. Preston, A.J. el Haj, J. Hamid, G.W. Zamponi, J. Howl, and S.J. Publicover. 1999. Osteoblasts derived from load-bearing bones of the rat express both L- and T-like voltage-operated calcium channels and mRNA for α1C, α1D and α1G subunits. Pflugers Arch. 438:553–560. [DOI] [PubMed] [Google Scholar]
- Hamilton, K.L., C.A. Syme, and D.C. Devor. 2003. Molecular localization of the inhibitory arachidonic acid binding site to the pore of hIK1. J. Biol. Chem. 278:16690–16697. [DOI] [PubMed] [Google Scholar]
- Heady, T.N., J.C. Gomora, T.L. Macdonald, and E. Perez-Reyes. 2001. Molecular pharmacology of T-type Ca2+ channels. Jpn. J. Pharmacol. 85:339–350. [DOI] [PubMed] [Google Scholar]
- Huguenard, J.R. 1996. Low-threshold calcium currents in central nervous system neurons. Annu. Rev. Physiol. 58:329–348. [DOI] [PubMed] [Google Scholar]
- Hwang, T.C., S.E. Guggino, and W.B. Guggino. 1990. Direct modulation of secretory chloride channels by arachidonic and other cis unsaturated fatty acids. Proc. Natl. Acad. Sci. USA. 87:5706–5709. [DOI] [PMC free article] [PubMed] [Google Scholar]
- Kang, J.X., and A. Leaf. 2000. Prevention of fatal cardiac arrhythmias by polyunsaturated fatty acids. Am. J. Clin. Nutr. 71:202S–207S. [DOI] [PubMed] [Google Scholar]
- Kim, Y., C. Gnatenco, H. Bang, and D. Kim. 2001. Localization of TREK-2 K+ channel domains that regulate channel kinetics and sensitivity to pressure, fatty acids and pHi. Pflugers Arch. 442:952–960. [DOI] [PubMed] [Google Scholar]
- Lee, G.Y., Y.K. Shin, C.S. Lee, and J.H. Song. 2002. Effects of arachidonic acid on sodium currents in rat dorsal root ganglion neurons. Brain Res. 950:95–102. [DOI] [PubMed] [Google Scholar]
- Lee, H.C., T. Lu, N.L. Weintraub, M. VanRollins, A.A. Spector, and E.F. Shibata. 1999. Effects of epoxyeicosatrienoic acids on the cardiac sodium channels in isolated rat ventricular myocytes. J. Physiol. 519(1):153–168. [DOI] [PMC free article] [PubMed] [Google Scholar]
- Lee, P.L., and V.S. Murthy. 1979. Hypotensive and other cardiovascular effects of arachidonic acid in rabbits. Clin. Exp. Hypertens. 1:685–701. [DOI] [PubMed] [Google Scholar]
- Leifert, W.R., E.J. McMurchie, and D.A. Saint. 1999. Inhibition of cardiac sodium currents in adult rat myocytes by n-3 polyunsaturated fatty acids. J. Physiol. 520:671–679. [DOI] [PMC free article] [PubMed] [Google Scholar]
- Liu, L., and A.R. Rittenhouse. 2000. Effects of arachidonic acid on unitary calcium currents in rat sympathetic neurons. J. Physiol. 525:391–404. [DOI] [PMC free article] [PubMed] [Google Scholar]
- Liu, L., C.F. Barrett, and A.R. Rittenhouse. 2001. Arachidonic acid both inhibits and enhances whole cell calcium currents in rat sympathetic neurons. Am. J. Physiol. Cell Physiol. 280:C1293–C1305. [DOI] [PubMed] [Google Scholar]
- Macica, C.M., Y. Yang, K. Lerea, S.C. Hebert, and W. Wang. 1998. Role of the NH2 terminus of the cloned renal K+ channel, ROMK1, in arachidonic acid-mediated inhibition. Am. J. Physiol. 274:F175–F181. [DOI] [PubMed] [Google Scholar]
- Maingret, F., A.J. Patel, F. Lesage, M. Lazdunski, and E. Honore. 2000. Lysophospholipids open the two-pore domain mechano-gated K+ channels TREK-1 and TRAAK. J. Biol. Chem. 275:10128–10133. [DOI] [PubMed] [Google Scholar]
- Marksteiner, R., P. Schurr, S. Berjukow, E. Margreiter, E. Perez-Reyes, and S. Hering. 2001. Inactivation determinants in segment IIIS6 of Cav3.1. J. Physiol. 537:27–34. [DOI] [PMC free article] [PubMed] [Google Scholar]
- Miller, B., M. Sarantis, S.F. Traynelis, and D. Attwell. 1992. Potentiation of NMDA receptor currents by arachidonic acid. Nature. 355:722–725. [DOI] [PubMed] [Google Scholar]
- Mullane, K.M., G.J. Dusting, J.A. Salmon, S. Moncada, and J.R. Vane. 1979. Biotransformation and cardiovascular effects of arachidonic acid in the dog. Eur. J. Pharmacol. 54:217–228. [DOI] [PubMed] [Google Scholar]
- Park, J.Y., S.W. Jeong, E. Perez-Reyes, and J.H. Lee. 2003. Modulation of Cav3.2 T-type Ca2+ channels by protein kinase C. FEBS Lett. 547:37–42. [DOI] [PubMed] [Google Scholar]
- Patel, A.J., E. Honore, F. Maingret, F. Lesage, M. Fink, F. Duprat, and M. Lazdunski. 1998. A mammalian two pore domain mechano-gated S-like K+ channel. EMBO J. 17:4283–4290. [DOI] [PMC free article] [PubMed] [Google Scholar]
- Perez-Reyes, E. 2003. Molecular physiology of low-voltage-activated T-type calcium channels. Physiol. Rev. 83:117–161. [DOI] [PubMed] [Google Scholar]
- Petit-Jacques, J., and H.C. Hartzell. 1996. Effect of arachidonic acid on the L-type calcium current in frog cardiac myocytes. J. Physiol. 493(1):67–81. [DOI] [PMC free article] [PubMed] [Google Scholar]
- Piomelli, D. 1993. Arachidonic acid in cell signaling. Curr. Opin. Cell Biol. 5:274–280. [DOI] [PubMed] [Google Scholar]
- Rogalski, S.L., and C. Chavkin. 2001. Eicosanoids inhibit the G-protein-gated inwardly rectifying potassium channel (Kir3) at the Na+/PIP2 gating site. J. Biol. Chem. 276:14855–14860. [DOI] [PMC free article] [PubMed] [Google Scholar]
- Schmitt, H., and H. Meves. 1995. Modulation of neuronal calcium channels by arachidonic acid and related substances. J. Membr. Biol. 145:233–244. [DOI] [PubMed] [Google Scholar]
- Serrano, J.R., E. Perez-Reyes, and S.W. Jones. 1999. State-dependent inactivation of the α1G T-type calcium channel. J. Gen. Physiol. 114:185–201. [DOI] [PMC free article] [PubMed] [Google Scholar]
- Staes, M., K. Talavera, N. Klugbauer, J. Prenen, L. Lacinova, G. Droogmans, F. Hofmann, and B. Nilius. 2001. The amino side of the C-terminus determines fast inactivation of the T-type calcium channel α1G. J. Physiol. 530:35–45. [DOI] [PMC free article] [PubMed] [Google Scholar]
- Talavera, K., A. Janssens, N. Klugbauer, G. Droogmans, and B. Nilius. 2003. a. Extracellular Ca2+ modulates the effects of protons on gating and conduction properties of the T-type Ca2+ channel α1G (Cav3.1). J. Gen. Physiol. 121:511–528. [DOI] [PMC free article] [PubMed] [Google Scholar]
- Talavera, K., A. Janssens, N. Klugbauer, G. Droogmans, and B. Nilius. 2003. b. Pore structure influences gating properties of the T-type Ca2+ channel α1G. J. Gen. Physiol. 121:529–540. [DOI] [PMC free article] [PubMed] [Google Scholar]
- Todorovic, S.M., V. Jevtovic-Todorovic, A. Meyenburg, S. Mennerick, E. Perez-Reyes, C. Romano, J.W. Olney, and C.F. Zorumski. 2001. Redox modulation of T-type calcium channels in rat peripheral nociceptors. Neuron. 31:75–85. [DOI] [PubMed] [Google Scholar]
- Unno, T., S. Komori, and H. Ohashi. 1996. Some evidence against the involvement of arachidonic acid in muscarinic suppression of voltage-gated calcium channel current in guinea-pig ileal smooth muscle cells. Br. J. Pharmacol. 119:213–222. [DOI] [PMC free article] [PubMed] [Google Scholar]
- Van der Vusse, G.J., R.S. Reneman, and M. van Bilsen. 1997. Accumulation of arachidonic acid in ischemic/reperfused cardiac tissue: possible causes and consequences. Prostaglandins Leukot. Essent. Fatty Acids. 57:85–93. [DOI] [PubMed] [Google Scholar]
- Vassort, G., and J. Alvarez. 1994. Cardiac T-type calcium current: pharmacology and roles in cardiac tissues. J. Cardiovasc. Electrophysiol. 5:376–393. [DOI] [PubMed] [Google Scholar]
- Vreugdenhil, M., C. Bruehl, R.A. Voskuyl, J.X. Kang, A. Leaf, and W.J. Wadman. 1996. Polyunsaturated fatty acids modulate sodium and calcium currents in CA1 neurons. Proc. Natl. Acad. Sci. USA. 93:12559–12563. [DOI] [PMC free article] [PubMed] [Google Scholar]
- Xiao, Y.F., J.X. Kang, J.P. Morgan, and A. Leaf. 1995. Blocking effects of polyunsaturated fatty acids on Na+ channels of neonatal rat ventricular myocytes. Proc. Natl. Acad. Sci. USA. 92:11000–11004. [DOI] [PMC free article] [PubMed] [Google Scholar]
- Xiao, Y.F., Q. Ke, S.Y. Wang, K. Auktor, Y. Yang, G.K. Wang, J.P. Morgan, and A. Leaf. 2001. Single point mutations affect fatty acid block of human myocardial sodium channel alpha subunit Na+ channels. Proc. Natl. Acad. Sci. USA. 98:3606–3611. [DOI] [PMC free article] [PubMed] [Google Scholar]
- Zhang, Y., L.L. Cribbs, and J. Satin. 2000. Arachidonic acid modulation of α1H, a cloned human T-type calcium channel. Am. J. Physiol. Heart Circ. Physiol. 278:H184–H193. [DOI] [PubMed] [Google Scholar]