

Abstract
Classical electrophysiology and contemporary crystallography suggest that the activation gate of voltage-dependent channels is on the intracellular side, but a more extracellular “pore gate” has also been proposed. We have used the voltage dependence of block by extracellular Y3+ as a tool to locate the activation gate of the α1G (CaV3.1) T-type calcium channel. Y3+ block exhibited no clear voltage dependence from −40 to +40 mV (50% block at 25 nM), but block was relieved rapidly by stronger depolarization. Reblock of the open channel, reflected in accelerated tail currents, was fast and concentration dependent. Closed channels were also blocked by Y3+ at a concentration-dependent rate, only eightfold slower than open-channel block. When extracellular Ca2+ was replaced with Ba2+, the rate of open block by Y3+ was unaffected, but closed block was threefold faster than in Ca2+, suggesting the slower closed-block rate reflects ion–ion interactions in the pore rather than an extracellularly located gate. Since an extracellular blocker can rapidly enter the closed pore, the primary activation gate must be on the intracellular side of the selectivity filter.
Keywords: channel block, selectivity filter, patch clamp, voltage clamp, permeation
INTRODUCTION
Voltage-dependent channels are crucial for information processing in neurons and other electrically excitable cells (Hille, 2001). Ion flow is regulated by “gates,” coupled allosterically to voltage sensors. In principle, a gate can be any process that regulates ion flux, but physical occlusion of a pore by a local conformational change has long been a popular mechanism. Studies of K+ channel block provided the first evidence for a gate at the intracellular end of the pore (Armstrong, 1971). This classical electrophysiological result has been amply supported by site-directed mutagenesis of Shaker K+ channels (Liu et al., 1997; Del Camino et al., 2000). Even more dramatically, the X-ray crystal structures of bacterial K+ channels exhibit both open and closed conformations, differing in the orientation of transmembrane domains near the cytoplasmic side (Doyle et al., 1998; Jiang et al., 2002). Although an intracellular activation gate seems to be widely accepted, there is evidence for a separate “pore gate” associated with activation of voltage-dependent K+ channels (Chapman et al., 1997; Zheng et al., 2001). For some channels, a pore gate may be the primary barrier to ion flow when the channel is closed, even though there may also be a gating-associated conformational change near the cytoplasmic end of S6 (or TM2): cyclic nucleotide-gated channels (Becchetti et al., 1999; Liu and Siegelbaum, 2000; Flynn and Zagotta, 2001), SK-type Ca2+-dependent K+ channels (Bruening-Wright et al., 2002), and inward rectifier K+ channels (Xiao et al., 2003).
Ca2+ channels are necessary for vital functions such as neurotransmitter release and muscle contraction, and share a distant evolutionary relationship with K+ and Na+ channels (Hille, 2001). Are the mechanisms of Ca2+ channel gating conserved with other voltage-dependent cation channels? Operationally, most of these channels activate in response to depolarization, and most subsequently inactivate, although the kinetics of activation and inactivation vary over orders of magnitude. Molecularly, Ca2+ channels have S4 regions closely resembling those of Na+ and K+ channels, suggesting that the mechanism of voltage sensing is conserved. The pore domain (S5-P-S6) also appears to be homologous to other channels of the superfamily, although sequence identity to K+ channels is low, especially in the P loop (MacKinnon, 1995; Jones, 2003). Fast inactivation involves a cytoplasmic domain in K+ (Hoshi et al., 1990) and Na+ channels (Armstrong et al., 1973), but in contrast to Na+ channels (West et al., 1992), the III-IV linker is not critical for fast inactivation of T-type Ca2+ channels (Staes et al., 2001).
Little is known about the location of the Ca2+ channel activation gate. We have addressed this using Y3+, which blocks Ca2+ channels by binding with high affinity to the selectivity filter (Mlinar and Enyeart, 1993; Beedle et al., 2002), like many tri- and divalent cations (Lansman et al., 1986; Yang et al., 1993). We ask a simple question: can extracellular Y3+ enter a closed channel? Naively, if the activation gate is on the cytoplasmic side of the pore, Y3+ should be able to enter the pore equally well whether that gate is open or not (Fig. 1 A).
Figure 1.

When can an extracellular blocker enter the selectivity filter? (A) An intracellular gate predicts equal access to open and closed channels. The solid circles represent Y3+ ions. Four negative charges are shown in the Ca2+ channel selectivity filter, located near the extracellular side of the ion-conducting pore (Kuo and Hess, 1993; Yang et al., 1993). (B) Ca2+ ions in the pore may slow entry of Y3+ into closed channels. Open circles are Ca2+ ions, at the selectivity filter, and by analogy to K+ channels (Doyle et al., 1998) in the inner vestibule. (C) A conceptual model for Y3+ block of T-channels. Full models for gating of α1G include multiple closed states, and closed-inactivated states (Serrano et al., 1999; Burgess et al., 2002). Solid arrows indicate transitions that are well established for block of calcium channels by di- and trivalent cations. This paper also considers the possible C ↔ CB step, but not OB ↔ IB or I ↔ IB.
We exploit the ability of strong depolarizations to relieve block (Lux et al., 1990; Thévenod and Jones, 1992). For α1G, we show that 1 ms at +200 mV effectively relieves block by Y3+, allowing subsequent analysis of reblocking of open vs. closed channels. We find that Y3+ can enter a closed channel almost as rapidly as if it were open. This result supports the idea that an intracellular activation gate is a conserved feature among the superfamily of voltage-dependent cation channels. It also constrains the role of a possible pore gate in the Ca2+ channel activation process.
MATERIALS AND METHODS
Standard methods were used for culturing HEK 293 cells stably transfected with the rat α1G T-type Ca2+ channel, and for whole-cell recording (Serrano et al., 1999, 2000). The intracellular (pipet) solution contained 120 mM NaCl, 10 mM HEPES, 4 mM MgATP, 1 mM CaCl2, and 10 mM EGTA (free [Ca2+]i ∼ 20 nM), adjusted to pH 7.2 with NaOH. The normal extracellular solution contained 140 mM NaCl, 2 mM CaCl2, 1 mM MgCl2, 10 mM HEPES, 10 mM glucose (pH 7.2 with NaOH). In experiments comparing Ca2+ to Ba2+ (see Fig. 5, A–D, and Fig. 6, B and C), MgCl2 was omitted to avoid Mg2+ block, which is significant in Ba2+ (Serrano et al., 2000). YCl3 (99.999%, Sigma-Aldrich) was applied by local superfusion, and recovery from Y3+ block was aided by 0.2 mM extracellular EGTA.
Figure 5.

Reentry of Y3+ into closed channels. (A) Block by 1 μM Y3+ was reversed by 1 ms at +200 mV, followed by 1 ms at −200 mV, to close channels while minimizing reblock of open channels during the tail current (protocol shown in C). A pulse to +80 mV then tested channel availability, following a variable interval at −100 mV. Intervals of 0, 4, 8, 16, 32, and 64 ms are shown. Currents at +200 and −200 mV are off scale. 2 kHz Gaussian filter. (B) The time course of closed channel block, from the same experiment as A, on a log time scale. The data were fitted to a single exponential (dashed curve) or the sum of two exponentials (solid curve). (C and D) Closed block by 1 μM Y3+, with 2 mM extracellular Ba2+ instead of Ca2+, shown as in A and B, from the same cell.
Figure 6.

Time course of currents at +80 mV in 1 μM Y3+. Currents are shown with (+) vs. without (−) a 1-ms prepulse to +200 mV. The dotted lines are fits to the sum of two exponentials, with time constants constrained to be the same for both records (τ = 5.1 and 30.2 ms). With the prepulse, the channels are primarily in the open state at the start of the fit, and the current then decays by a combination of blocking and inactivation. Without the prepulse, partial relief of block is followed by inactivation. The effect of the prepulse on kinetics at +80 mV is partially visible during the brief test pulses in Fig. 5, A and C. 2 kHz Gaussian filter. Currents at +200 and −200 mV are off scale.
Recordings were made using Axopatch 200 amplifiers and pClamp v. 8 software (Axon Instruments, Inc.). Sylgard®-coated electrodes of 1–2 MΩ produced access resistances of 3–5 MΩ before series resistance compensation (80–90% “correction” and ≥60% “prediction”). Data were analyzed by pClamp, Microsoft Excel, and Visual Basic programs written by S.W. Jones. Current records shown in figures were leak subtracted (P/−4), and dashed lines indicate zero current. Measurements are mean values (except Fig. 5, B and D), and error bars (sometimes obscured by the symbols) are SEM.
Current Isolation
Our experimental protocols include use of extremely strong depolarizations (up to +200 mV), which produces very large outward currents, carried by Na+ in our experimental conditions. Two tests indicate that the outward currents are through T-channels, as we have concluded previously for less extreme depolarizations (Serrano et al., 1999; Frazier et al., 2001).
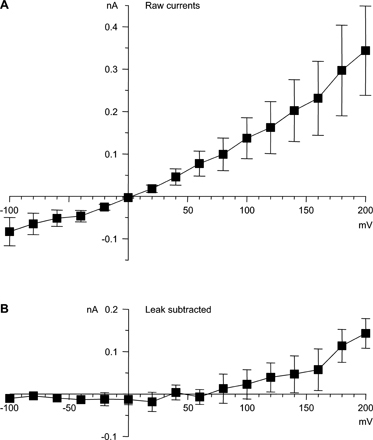
First, in our experimental conditions, currents in untransfected HEK 293 cells were small, 0.14 ± 0.03 nA at +200 mV with the protocol of Fig. 2 (Fig. S1, available at http://www.jgp.org/cgi/content/full/jgp.200409167/DC1). Compared with currents in cells stably transfected with α1G, that is negligible (<1%).
Figure 2.

Voltage-dependent block by Y3+. (A) Currents evoked by moderate depolarizations, recorded before Y3+ (left), in 1 μM Y3+ (middle), and following washout (right). Voltage steps were from −80 to +20 mV, in 20-mV increments. The voltage protocol is shown below the record in Y3+. The Y3+-insensitive transient outward currents at the beginning of the step are gating currents (Burgess et al., 2002); off gating currents are not visible, since channel closing (at −100 mV) is much slower than opening (at +20 mV). 2 kHz Gaussian filter. (B) Currents evoked by strong depolarizations (+40 to +200 mV, in 20-mV increments). Note effects of Y3+ on tail currents (arrow).
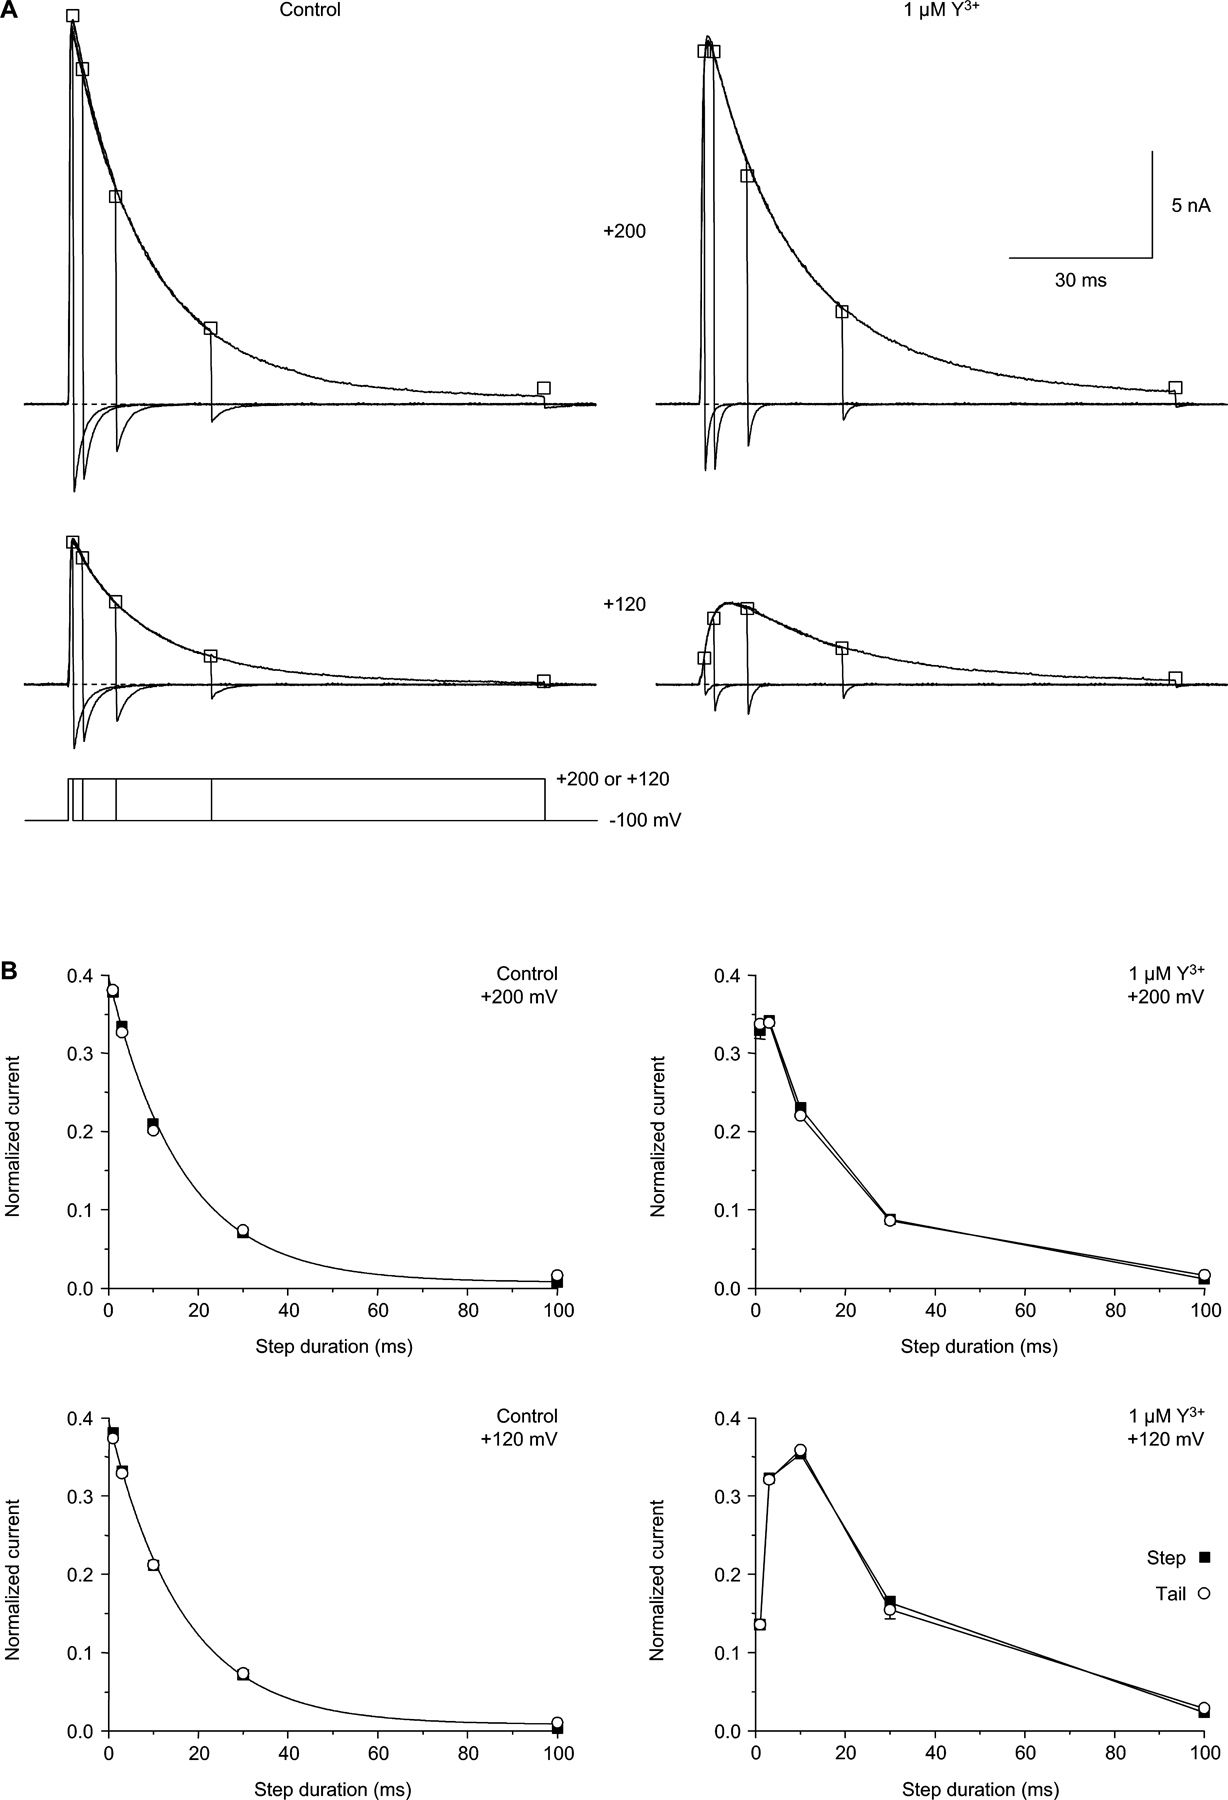
Second, both in control and in Y3+, the increase in outward current during strong depolarization was matched by corresponding inward tail currents (Fig. 2 B, arrow). This is shown quantitatively by the “envelope test” (Fig. S2, available at http://www.jgp.org/cgi/content/full/jgp.200409167/DC1). When the duration of a voltage step to +120 or +200 mV was varied (0.3, 1, 3, 10, and 100 ms), the initial tail current amplitudes changed in parallel with the current at the end of the step.
Throughout this study, tail currents were measured by single exponential fits, beginning near the peak of the tail current (typically 0.3–0.4 ms) following 2 kHz Gaussian filtering. The amplitude was measured at the start of the fit, since extrapolation to zero time would overestimate the tail amplitude, given filtering and the finite voltage clamp speed. This procedure will underestimate the true amplitude, especially for faster tail currents. We estimate that this effect is ∼20% at −100 mV in 1 μM Y3+, where τ = 0.82 ± 0.03 ms (n = 7). The error is less at lower concentrations, so it has a negligible effect on the measured dose–response relationship, or other measurements presented in this study.
We note that current isolation was incomplete in “leaky” cells with >0.2 nA holding current at −100 mV, where the leak current was often nonlinear with voltage. This produced artifactual time-independent outward currents following leak subtraction (also visible as negative shifts in the apparent reversal potential). In such cases, the absolute amplitudes of outward currents were not used for further analysis. However, such cells were included in the analysis of closed-channel block (see Figs. 5 and 7), since a time-independent current would not affect the measured time course. Also, in a small number of cells where leak-subtracted currents were noisy, the time course of closed block was measured from currents without leak subtraction.
Figure 7.

Comparison of open vs. closed block. (A) Rates of open and closed block at −100 mV in 2 mM Ca2+. Rate constants were calculated as in Fig. 4 C (open block), and as the reciprocal of the fast time constant from the protocol of Fig. 5 (closed block). n = 5–7. The solid lines are fits to bimolecular kinetics, with rate constants of (6.4 ± 0.3) × 108 M−1s−1 (open block) and (0.9 ± 0.1) × 108 M−1s−1 (closed block). (B) Effect of Ca2+ and Ba2+ concentration on open and closed block rates at −100 mV with 1 μM Y3+. Open symbols, open-block rates; solid symbols, closed-block rates. For both open block and closed block, statistically significant differences from the rate at 2 mM Ca2+ are shown by single asterisks (unpaired t tests, all P < 0.01). n = 7–13. (C) The ratio of open- to closed-block rates is higher in Ca2+ than in Ba2+, at all concentrations. At 0.5 mM Ba2+, open block was only 2.4 ± 0.2–fold faster than closed block (n = 9).
Online Supplemental Material
Supplemental material for this paper (available at http://www.jgp.org/cgi/content/full/jgp.200409167/DC1) consists of two figures and one table. Fig. S1 shows currents in untransfected HEK 293 cells, and Fig. S2 shows the “envelope test” for isolation of T-type calcium current. Table S1 gives the results of one- and two-exponential fits to the time course of closed-channel block in Y3+.
RESULTS
Voltage-dependent Block by Y3+
We chose to examine Y3+, a group 3 metal that is one of the highest affinity known blockers of T-type Ca2+ channels (Mlinar and Enyeart, 1993; Beedle et al., 2002). The high affinity allows use of low concentrations (∼1 μM), where the rate of block is relatively slow (∼1 ms), thus in the range measurable with whole-cell voltage clamp recording. We first define the voltage dependence of Y3+ block. The primary goal was to determine whether it is possible to use voltage steps to reverse block by Y3+, in the continued presence of extracellular Y3+. If so, it should then be possible to examine the kinetics of reblocking by Y3+, under conditions where the channels are either mostly open, or mostly closed.
Y3+ potently blocked Ca2+ channels activated by moderate depolarizations (Fig. 2 A). 1 μM Y3+ blocked currents to 2.1 ± 0.1% of the control value (n = 8), judged from the reduction in the initial tail current amplitude at −100 mV, following steps to −40 to +40 mV. Dose–response relationships (30 nM to 3 μM Y3+) yielded an IC50 of 25 nM (Fig. 3 B). This is consistent with previous reports of Y3+ block of native (Mlinar and Enyeart, 1993) and cloned (Beedle et al., 2002) T-type Ca2+ channels.
Figure 3.

Relief of Y3+ block at extreme positive voltages. (A) Voltage dependence of block, measured from the initial tail current amplitudes following 5-ms depolarizations (as in Fig. 2). n = 4–6. (B) Dose–response relationship for Y3+, at moderate depolarizations vs. +200 mV, from A. The curves are fits with IC50 = 25 nM (−40 to +40 mV) and 33 μM (+200 mV). Because of the kinetics of Y3+ block, these values are not measured at steady state (see discussion). (C) Current ratios (Y3+/control) illustrate reversal of Y3+ block upon strong depolarization. Ratios are shown from +80 to +200 mV in 20-mV intervals (bottom to top), for the same cell as Fig. 2, for three concentrations of Y3+. Ratios were blanked during the gating currents (0.2–0.7 ms). 4 kHz Gaussian filter. (D) Time constants for unblocking at depolarized voltages, measured from current ratios (see C). For clarity, intermediate concentrations (0.1 and 1 μM) are not shown in A and D. n = 4–7.
However, stronger depolarization produced dramatically different results (Fig. 2 B). At the most positive voltage tested (+200 mV), channel activation appeared to be slightly slower, but the peak outward current was almost unaffected, as was the subsequent decrease in current (inactivation). At intermediate voltages, the apparent slowing of channel activation was more dramatic (e.g., records at +120 mV; Fig. 2 B, asterisks). In the absence of Y3+, channel activation is complete by +40 mV (Serrano et al., 1999), so the initial tail current amplitudes are constant in Fig. 2 B (left and right panels). In Y3+, the tail currents increase from near zero to nearly full amplitude over this voltage region (+40 to +200 mV; Fig. 2 B, arrow).
The level of block depended on both [Y3+] and voltage (Fig. 3 A). Depolarization to +200 mV reduced the IC50 for Y3+ by ∼1,000-fold (Fig. 3 B). The limited concentration range used in these experiments could lead to quantitative error in estimation of IC50 values. Thus, we emphasize two qualitative points, that block at moderate depolarizations is consistent with previous descriptions of Y3+ block of T-channels, but strong depolarization can produce almost complete relief of block.
Y3+ produces complex kinetic effects on T-currents (Fig. 2 B and Fig. 3 A). We propose a simple explanation: Y3+ block is relieved by strong depolarization. It has long been known that block of Ca2+ channels by many di- and trivalent cations can be reversed by strong hyperpolarization (Brown et al., 1983; Swandulla and Armstrong, 1989), where the blocking ion is driven into the cytoplasm. Block can also be reversed by strong depolarization (Lux et al., 1990; Thévenod and Jones, 1992; Kuo and Hess, 1993; Block et al., 1998; Lee et al., 1999), where the blocking ion is driven out. We tested this hypothesis by examining more closely the kinetics of unblock during depolarization, and reblock upon repolarization.
The time and voltage dependence of unblock is well illustrated by current ratios (Y3+/control). Calculated as a function of time, the fractional block by Y3+ is initially strong, reflecting the steady-state block at the holding potential of −100 mV (Fig. 3 C). The initial level of block (extrapolating the current ratios back to time zero) agrees well with the average values from the dose–response relationship for moderate depolarizations (Fig. 2 B). This confirms that closed calcium channels can be blocked (Swandulla and Armstrong, 1989), and demonstrates that closed channels can be strongly blocked at −100 mV. Subsequently, the current ratios change with a nearly exponential time course. At the most positive voltages, the ratios approach 1.0 (i.e., full reversal of block). The time constants of these current ratios depend strongly on voltage (Fig. 3 D). The concentration dependence is more complicated, as expected for a bimolecular blocking reaction between Y3+ and the channel, where 1/τ = kB + kU: near +200 mV, the unblocking rate constant (kU) is very fast and dominates, but at less positive voltages (where relief of block is incomplete), Y3+ can reenter the pore at a significant rate, so the concentration-dependent blocking rate (kB) also affects the kinetics.
Block of Open Channels by Y3+
To examine reblocking by Y3+, channels were first unblocked by a 1-ms step to +200 mV, followed by repolarization to voltages from +80 to −200 mV (Fig. 4). In the absence of Y3+, the “tail” current through T channels decays by a combination of inactivation (O → I) and deactivation (O → C) (Serrano et al., 1999). At depolarized voltages (+80 mV and −40 mV in Fig. 4 A), channels inactivate in a nearly voltage-independent manner (Fig. 4 B, open squares). At more negative voltages, deactivation dominates (−160 mV in Fig. 4 A). T-channel deactivation depends almost exponentially on voltage (Herrington and Lingle, 1992; Serrano et al., 1999), illustrated by a nearly linear relation between log(τ) and voltage from −60 to −200 mV (Fig. 4 B, open squares). The tail current τ's following steps to +200 mV (Fig. 4 B) agree well with values measured previously following steps to +60 mV (Serrano et al., 1999), suggesting that brief steps to +200 mV do not affect channel gating in unexpected ways.
Figure 4.

Reentry of Y3+ into open channels. (A) Effect of 1 μM Y3+ on tail currents. A 1-ms step to +200 mV was used to both activate channels and relieve Y3+ block. Currents are shown following repolarization to +80 mV, −40 mV, and −160 mV. Currents at +200 mV are off scale. 1.5 kHz Gaussian filter. (B) Acceleration of tail currents by Y3+. Tail currents were fitted by single exponentials in control conditions, and in four concentrations of Y3+. Values are not shown at +20 mV, near the reversal potential. n = 4–6. (C) Voltage- and concentration-dependent reblocking. For each cell, at each voltage, the blocking rate was calculated from tail current time constants in Y3+ and in control conditions (Eq. 1).
Reblock by Y3+ speeds tail currents, in a voltage-dependent manner. The effect is modest at +80 mV but strong at −40 mV (Fig. 4 A, middle). Even at −160 mV, where channel closing is already quite rapid in the absence of Y3+, tail currents are visibly faster in Y3+ (Fig. 4 A). The effect on tail currents over a 280-mV range is summarized in Fig. 4 B.
To quantitatively explain the effect of Y3+ on tail currents, we assume that channels can leave the open state either by blocking or by normal gating (inactivation or closing). If so, the net rate of exiting the open state (1/τY) is the sum of the rate in the absence of Y3+ (1/τC) plus the rate of Y3+ block (kB). This allows us to calculate kB from the time constants measured in Y3+ and in control:
 |
(1) |
Note that the control time constant at each voltage (τC) accounts for both inactivation and deactivation. However, this calculation neglects the three “back reactions” (channel opening, recovery from inactivation, and Y3+ unblock). That is reasonable, since currents decay to <2% of the maximal value in control conditions (Serrano et al., 1999), and the Y3+ concentrations are well above the IC50 in the voltage range examined, +80 mV and below (Fig. 3 A). In this voltage range, simulations suggest that this analysis is not very sensitive to possible effects of Y3+ on inactivation (either OB ↔ IB or I ↔ IB pathways; unpublished data). At more positive voltages, where Y3+ block is incomplete, tail currents were biexponential (as expected from a OB ↔ O → I pathway, for example).
Calculated from these assumptions, Y3+ block closely follows bimolecular kinetics over a 30-fold concentration range (Fig. 4 C). The dashed lines in Fig. 4 C are a fit of the entire dataset from −80 to +80 mV to just two parameters: the bimolecular rate constant for Y3+ block at 0 mV (2.8 × 10⁸ M−1s−1) and the voltage dependence of block (e-fold for 76 mV). Y3+ enters the pore more rapidly at negative voltages, as if the barrier to Y3+ entry is ∼10% of the electrical distance through the membrane (Woodhull, 1973). The dependence of the open channel blocking rate on concentration and voltage is strong evidence that Y3+ inhibits the Ca2+ channel by binding within the ion permeation pathway. Alternative explanations, such as modulation by binding to a site outside the pore (Zamponi et al., 1996; Beedle et al., 2002), or binding to surface charge, would produce a relationship that saturates as a function of [Y3+], rather than depending linearly on concentration.
The blocking rate depends exponentially on voltage over a wide range (−80 to +80 mV), but is less voltage dependent at more negative voltages. This may reflect the complexity of ion–ion interactions in a multi-ion pore, where rate constants need not depend on voltage in a simple exponential manner. Alternatively, Y3+ entry into the pore may be diffusion limited at those voltages, since the rate of block is 109 M−1s−1. It should also be noted that tail currents at extreme negative voltages are quite fast (Fig. 4 B), and may be affected quantitatively by series resistance error.
Block of Closed Channels by Y3+
So, following relief of block by strong depolarization, Y3+ can rapidly reenter an open channel. Can extracellular Y3+ also enter a closed channel? That was examined by the protocol of Fig. 5, where an unblocking pulse was followed by a variable period at −100 mV, where channels are strongly closed (Serrano et al., 1999). Surprisingly, subsequent test pulses demonstrated that closed channels are rapidly reblocked by Y3+, over tens of milliseconds (Fig. 5 A). The time course of closed block was typically biexponential (Fig. 5 B), with a predominant fast component (70% amplitude at 1–3 μM Y3+; see Table S1, available at http://www.jgp.org/cgi/content/full/jgp.200409167/DC1). In contrast, when this protocol was run in the absence of Y3+, the unblocking pulse produced 15 ± 1% inactivation, which recovered with τ = 64 ± 8 ms (n = 15), comparable to the recovery observed with more conventional protocols (84 ± 9 ms) (Serrano et al., 1999). The extent of inactivation is not sufficient to explain the slow component of closed block observed in Y3+ as blockade of channels following recovery from inactivation.
The kinetics of currents during the test pulses to +80 mV varied, as expected from the kinetics of open-channel block at that voltage. Immediately following the unblocking pulse, channels start out mostly in the closed state, and then open rapidly upon depolarization to +80 mV (time-to-peak in control = 1.08 ± 0.02 ms, n = 7). The subsequent decay of current during the test pulse results from a combination of open-channel block (kB = 0.11 ± 0.1 ms−1 at +80 mV win 1 μM Y3+; Fig. 4 B) and inactivation (kI = 0.07 ms−1; Serrano et al., 1999). In contrast, the test pulse currents appear to activate slowly following long intervals at −100 mV, and do not exhibit net inactivation (during these 2.5-ms test pulses). In that case, most channels are initially in the closed-blocked state, and the kinetics during the test pulse reflect the partial relief of block at +80 mV (Fig. 3, A and C). The effects of an unblocking pulse on subsequent gating kinetics at +80 mV are shown more fully in Fig. 6, using longer (100 ms) depolarizations to +80 mV.
The fast component of closed block depended on [Y3+] according to bimolecular kinetics (Fig. 7 A). At −100 mV, where open and closed block could be compared directly, open block was faster, but only by 7.7 ± 0.3–fold (n = 19).
Does this result imply an extracellular activation gate, albeit a rather weak one? Another possibility is that ion–ion interactions within the pore affect Y3+ entry (Fig. 1 B). When a channel is open, permeant ions flow rapidly through, so Y3+ can enter at a rate approaching the diffusion limit (Fig. 4 C and Fig. 7 A; see Fig. 1 A). However, if a channel is closed by an intracellular gate, ions will be bound within the pore; given the strong electrostatic forces, an ion-free pore is implausible (Nonner and Eisenberg, 1998). For Y3+ to enter a closed channel, it must wait for an ion to exit to the outside, likely a slow process (especially at −100 mV). We tested this by replacing Ca2+ with Ba2+, which permeates well but binds less strongly to the selectivity filter (Serrano et al., 2000) (Fig. 5, C and D). Open block by 1 μM Y3+ was similar in 2 mM Ca2+ vs. 2 mM Ba2+ (P = 0.5), but closed block was 2.3 ± 0.3–fold faster in Ba2+ (P < 10−4 vs. Ca2+, unpaired t test, n = 11–13). Correspondingly, open block was only 3.2 ± 0.3–fold faster than closed block in 2 mM Ba2+ (Fig. 7 C). This suggests that faster Ba2+ exit allows faster Y3+ entry into a closed channel.
The dependence of the rate of Y3+ block on permeant ions was examined further by varying the concentration of Ca2+ or Ba2+ to 0.5 or 4.0 mM (Fig. 7, B and C). The open block rate was unaffected by the nature of the permeant ion (Ca2+ or Ba2+), but was ∼40% slower at 4 mM than at 2 mM (Fig. 7 B, open symbols). This effect is relatively weak, compared (e.g.) to the effect of ∼110 mM Ba2+ on Cd2+ block of L-channels (Cloues et al., 2000). Closed block was also slower at higher permeant ion concentrations, and was faster in Ba2+ than in Ca2+ at all three concentrations tested.
One attractive explanation is that Y3+ can enter the pore only when there is a vacancy in the outermost cation binding site in the selectivity filter. If so, the effective rate of Y3+ entry is the intrinsic Y3+ entry rate, multiplied by the probability that the outermost site is unoccupied. That site would be occupied often when the channel is closed (assuming the ion must exit to the outside), but not when the channel is open and ions are flowing rapidly through. When the channel is open, at −100 mV, occupancy of the site is limited by the rate of ion flow, which is similar in Ca2+ vs. Ba2+, despite the higher affinity for Ca2+ (Serrano et al., 2000). This is speculative, without data at higher Ca2+ or Ba2+ concentrations, and without a full understanding of ion occupancy in calcium channel pores. However, these results clearly show that permeant ions affect Y3+ entry differently in open vs. closed channels. Thus, the three- to eightfold slower block of closed channels by Y3+ can be explained by ion–ion interactions, without invoking an extracellular gate near the selectivity filter.
DISCUSSION
Y3+ Block
Although we use Y3+ block primarily as a tool to locate the activation gate, some aspects of block will be discussed first. Depolarization beyond +60 mV relieves Y3+ block in a voltage- and concentration-dependent manner (Fig. 2 B and Fig. 3). Although entry of Y3+ into the pore is voltage dependent (Fig. 4 C), relief of block is primarily due to acceleration of Y3+ exit (Fig. 3 D). The voltage dependence can be understood in terms of a Woodhull model (Woodhull, 1973), for a blocker that binds within the electrical field of the membrane. However, for a multi-ion pore, ion–ion interactions can affect the observed voltage dependence (Hille, 2001). Indeed, it has been suggested that the voltage dependence is really current dependence, with outward flow of ions sweeping the pore free of blocker (Kuo and Hess, 1993). On the other hand, blockade of N-type Ca2+ channels is reversed by strong depolarization even in the absence of permeant intracellular ions, arguing for an intrinsic voltage dependence (Thévenod and Jones, 1992; Block et al., 1998). Reversal of Ni2+ block of T-channels by strong depolarization may involve both current and voltage dependence (Lee et al., 1999).
We have not examined whether Y3+ block is also relieved by strong hyperpolarization, as observed for many ions that block Ca2+ channels (Brown et al., 1983; Lansman et al., 1986; Swandulla and Armstrong, 1989; Lansman, 1990; Lux et al., 1990; Kuo and Hess, 1993). If so, that effect could contribute to the effectiveness of a 1-ms step to −200 mV in preventing reblocking of open channels (Fig. 5). We do have preliminary evidence (unpublished data) that La3+ blocks α1G Ca2+ channels more strongly near 0 mV than at −100 mV. However, Mg2+ block of T-channels becomes only stronger with hyperpolarization, at least to −120 mV (Lux et al., 1990; Serrano et al., 2000). Clearly, closed-channel block by Y3+ is strong at −100 mV (Fig. 3 C), and the acceleration of tail currents by Y3+ demonstrates that open channels can be blocked at voltages as negative as −160 mV (Fig. 4).
It is worth noting that the time course of Y3+ block affects interpretation of the dose–response relationship (Fig. 3 B). The rate of block is ≤0.1 ms−1 at 100 nM Y3+ (Fig. 4 C). Block should be even slower at lower concentrations, but this could not be measured directly, because the kinetics of channel gating interfere (e.g., Fig. 4 B). At physiological voltages, near the IC50 (25 nM), Y3+ will not have time to equilibrate with the open channel during the brief 5-ms depolarizations used in Figs. 2 and 3. Longer depolarizations would not help, as the channels would inactivate. Thus, that IC50 value primarily reflects the level of resting block of the channel at −100 mV, rather than steady-state block at the test potential. This can explain the apparent lack of voltage-dependent block at physiological voltages, both here (Fig. 2 A and Fig. 3, A and B) and in previous studies (Mlinar and Enyeart, 1993; Beedle et al., 2002).
The existence of resting block confirms that closed channels can be blocked; that is, a Ca2+ channel can close while occupied by a blocking ion (CB ← OB) (Swandulla and Armstrong, 1989). The time course of currents in Y3+ at extreme positive voltages appears to be rate limited by relief of block (Fig. 3, C and D), which could occur by either CB → OB → O or CB → C → O pathways (see Fig. 1 C). This implies that either the CB → OB step, the CB → C step, or both, must be fast at extreme positive voltages, qualitatively comparable to C → O or OB → O.
We directly compare the rates of Y3+ block of open vs. closed channels, but we do not address whether the affinity for Y3+ depends on the state of the channel. Further studies will also be necessary to determine whether inactivation affects blockade by Y3+ and other cations. Preliminary results suggest that currents in Y3+ inactivate more slowly than in control, at least at +120 mV (Fig. S2) and +80 mV (Fig. 6), which may indicate that binding of Y3+ slows inactivation.
The Location of the Ca2+ Channel Activation Gate
We used a conceptually simple approach, asking whether an extracellular ion can enter the selectivity filter of a Ca2+ channel when the channel is closed. This exploited the ability of brief, strong depolarizations to relieve channel block, allowing subsequent measurement of the rate of Y3+ entry into open vs. closed channels. This comparison was greatly aided by the slow deactivation of α1G T-type Ca2+ channels, where τ = 2.5 ms at −100 mV (Serrano et al., 1999).
One previous attempt to use this approach, for Cd2+ block of N-type Ca2+ channels in sympathetic neurons, produced less clear results. Extracellular Cd2+ could block closed N-channels, but block was slow (∼0.5 s−1) and not clearly concentration dependent (Thévenod and Jones, 1992). Rapid deactivation of N-channels also prevented comparison of open vs. closed block at the same voltage.
Our results raise the question of whether extracellular ions can enter the selectivity filter of other closed channels. This does not appear to have been extensively studied. For Shaker K+ channels, cysteine residues introduced into the selectivity filter by mutagenesis are accessible to extracellular Ag+, apparently even when the channel is closed (Lü and Miller, 1995). One advantage of our approach is that it exploits a naturally occurring ion binding site (the selectivity filter), which avoids the necessity of introducing mutations into a highly conserved region of the protein. The key assumption of our method is that entry of the blocking ion is regulated by the same factors that regulate entry of permeant ions. This method should be applicable to other channels, if pore blockers with appropriate kinetics can be found. Recently, it has been suggested that the Na+ channel single-file pore region is accessible to extracellular ions when the channel is closed (Kuo et al., 2004). However, the results of that study provide evidence for a CB ↔ OB ↔ O pathway, but not for C ↔ CB.
We do not understand the slow component of closed block by Y3+ (Fig. 5, B and D). It is possible that a closed channel slowly converts to a closed state that is less accessible to Y3+, either by a gating process, or by changes in ion occupancy in the pore. For the purposes of this study, we emphasize that most channels can be blocked rapidly by 0.3–3 μM Y3+. This demonstrates that a channel can be firmly closed at −100 mV, in the sense of not allowing ion permeation, with little effect on access of extracellular ions to the selectivity filter. This implies that Ca2+ channel closure need not involve a pore gate. However, a slowly closing pore gate is one possible explanation for the slow component of closed block. We also cannot exclude a gate within the pore loop, but on the cytoplasmic side of the selectivity filter.
A “closed” Ca2+ channel has no detectable permeability to Ca2+, implying that it is closed by a factor much larger than the observed value of 3 or 8 (Fig. 7). We are not aware of a quantitative estimate of this for a Ca2+ channel, but a closed Shaker K+ channel allows K+ flux at a rate 105-fold lower than when the channel is open (Soler-Llavina et al., 2003). We conclude that the primary activation gate of a Ca2+ channel must be on the intracellular side of the selectivity filter.
Supplemental Material
Acknowledgments
We thank Dr. Ed Perez-Reyes (University of Virginia, Charlottesville, VA) for the cell line stably expressing α1G T-type calcium channels.
This work was supported by National Institutes of Health (NIH) grant NS24471 to S.W. Jones and an NIH minority supplement to C.A. Obejero-Paz (sponsor Dr. A.M. Brown, grant HL61642).
Olaf S. Andersen served as editor.
References
- Armstrong, C.M. 1971. Interaction of tetraethylammonium ion derivatives with the potassium channels of giant axons. J. Gen. Physiol. 58:413–437. [DOI] [PMC free article] [PubMed] [Google Scholar]
- Armstrong, C.M., F. Bezanilla, and E. Rojas. 1973. Destruction of sodium conductance inactivation in squid axons perfused with pronase. J. Gen. Physiol. 62:375–391. [DOI] [PMC free article] [PubMed] [Google Scholar]
- Becchetti, A., K. Gamel, and V. Torre. 1999. Cyclic nucleotide-gated channels. Pore topology studied through the accessibility of reporter cysteines. J. Gen. Physiol. 114:377–392. [DOI] [PMC free article] [PubMed] [Google Scholar]
- Beedle, A.M., J. Hamid, and G.W. Zamponi. 2002. Inhibition of transiently expressed low- and high-voltage-activated calcium channels by trivalent metal cations. J. Membr. Biol. 187:225–238. [DOI] [PubMed] [Google Scholar]
- Block, B.M., W.C. Stacey, and S.W. Jones. 1998. Surface charge and lanthanum block of calcium current in bullfrog sympathetic neurons. Biophys. J. 74:2278–2284. [DOI] [PMC free article] [PubMed] [Google Scholar]
- Brown, A.M., Y. Tsuda, and D.L. Wilson. 1983. A description of activation and conduction in calcium channels based on tail and turn-on current measurements in the snail. J. Physiol. 344:549–583. [DOI] [PMC free article] [PubMed] [Google Scholar]
- Bruening-Wright, A., M.A. Schumacher, J.P. Adelman, and J. Maylie. 2002. Localization of the activation gate for small conductance Ca2+-activated K+ channels. J. Neurosci. 22:6499–6506. [DOI] [PMC free article] [PubMed] [Google Scholar]
- Burgess, D.E., O. Crawford, B.P. Delisle, and J. Satin. 2002. Mechanism of inactivation gating of human T-type (low-voltage activated) calcium channels. Biophys. J. 82:1894–1906. [DOI] [PMC free article] [PubMed] [Google Scholar]
- Chapman, M.L., H.M. VanDongen, and A.M. VanDongen. 1997. Activation-dependent subconductance levels in the drk1 K channel suggest a subunit basis for ion permeation and gating. Biophys. J. 72:708–719. [DOI] [PMC free article] [PubMed] [Google Scholar]
- Cloues, R.K., S.M. Cibulsky, and W.A. Sather. 2000. Ion interactions in the high-affinity binding locus of a voltage-gated Ca2+ channel. J. Gen. Physiol. 116:569–586. [DOI] [PMC free article] [PubMed] [Google Scholar]
- Del Camino, D., M. Holmgren, Y. Liu, and G. Yellen. 2000. Blocker protection in the pore of a voltage-gated K+ channel and its structural implications. Nature. 403:321–325. [DOI] [PubMed] [Google Scholar]
- Doyle, D.A., J. Morais Cabral, R.A. Pfuetzner, A.L. Kuo, J.M. Gulbis, S.L. Cohen, B.T. Chait, and R. MacKinnon. 1998. The structure of the potassium channel: Molecular basis of K+ conduction and selectivity. Science. 280:69–77. [DOI] [PubMed] [Google Scholar]
- Flynn, G.E., and W.N. Zagotta. 2001. Conformational changes in S6 coupled to the opening of cyclic nucleotide-gated channels. Neuron. 30:689–698. [DOI] [PubMed] [Google Scholar]
- Frazier, C.J., J.R. Serrano, E.G. George, X. Yu, A. Viswanathan, E. Perez-Reyes, and S.W. Jones. 2001. Gating kinetics of the α1I T-type calcium channel. J. Gen. Physiol. 118:457–470. [DOI] [PMC free article] [PubMed] [Google Scholar]
- Herrington, J., and C.J. Lingle. 1992. Kinetic and pharmacological properties of low voltage-activated Ca2+ current in rat clonal (GH3) pituitary cells. J. Neurophysiol. 68:213–232. [DOI] [PubMed] [Google Scholar]
- Hille, B. 2001. Ion Channels of Excitable Membranes, 3rd edition. Sinauer, Sunderland, MA. 814 pp.
- Hoshi, T., W.N. Zagotta, and R.W. Aldrich. 1990. Biophysical and molecular mechanisms of Shaker potassium channel inactivation. Science. 250:533–538. [DOI] [PubMed] [Google Scholar]
- Jiang, Y., A. Lee, J. Chen, M. Cadene, B.T. Chait, and R. MacKinnon. 2002. The open pore conformation of potassium channels. Nature. 417:523–526. [DOI] [PubMed] [Google Scholar]
- Jones, S.W. 2003. Calcium channels: unanswered questions. J. Bioenerg. Biomembr. 35:461–475. [DOI] [PubMed] [Google Scholar]
- Kuo, C.C., and P. Hess. 1993. Ion permeation through the L-type Ca2+ channel in rat phaeochromocytoma cells: two sets of ion binding sites in the pore. J. Physiol. 466:629–655. [PMC free article] [PubMed] [Google Scholar]
- Kuo, C.C., W.Y. Chen, and Y.C. Yang. 2004. Block of tetrodotoxin-resistant Na+ channel pore by multivalent cations: gating modification and Na+ flow dependence. J. Gen. Physiol. 124:27–42. [DOI] [PMC free article] [PubMed] [Google Scholar]
- Lansman, J.B. 1990. Blockade of current through single calcium channels by trivalent lanthanide cations. Effect of ionic radius on the rates of ion entry and exit. J. Gen. Physiol. 95:679–696. [DOI] [PMC free article] [PubMed] [Google Scholar]
- Lansman, J.B., P. Hess, and R.W. Tsien. 1986. Blockade of current through single calcium channels by Cd2+, Mg2+, and Ca2+. Voltage and concentration dependence of calcium entry into the pore. J. Gen. Physiol. 88:321–347. [DOI] [PMC free article] [PubMed] [Google Scholar]
- Lee, J.H., J.C. Gomora, L.L. Cribbs, and E. Perez-Reyes. 1999. Nickel block of three cloned T-type calcium channels: Low concentrations selectively block α1H. Biophys. J. 77:3034–3042. [DOI] [PMC free article] [PubMed] [Google Scholar]
- Liu, J., and S.A. Siegelbaum. 2000. Change of pore helix conformational state upon opening of cyclic nucleotide-gated channels. Neuron. 28:899–909. [DOI] [PubMed] [Google Scholar]
- Liu, Y., M. Holmgren, M.E. Jurman, and G. Yellen. 1997. Gated access to the pore of a voltage-dependent K+ channel. Neuron. 19:175–184. [DOI] [PubMed] [Google Scholar]
- Lü, Q., and C. Miller. 1995. Silver as a probe of pore-forming residues in a potassium channel. Science. 268:304–307. [DOI] [PubMed] [Google Scholar]
- Lux, H.D., E. Carbone, and H. Zucker. 1990. Na+ currents through low-voltage-activated Ca2+ channels of chick sensory neurones: block by external Ca2+ and Mg2+. J. Physiol. 430:159–188. [DOI] [PMC free article] [PubMed] [Google Scholar]
- MacKinnon, R. 1995. Pore loops: an emerging theme in ion channel structure. Neuron. 14:889–892. [DOI] [PubMed] [Google Scholar]
- Mlinar, B., and J.J. Enyeart. 1993. Block of current through T-type calcium channels by trivalent metal cations and nickel in neural rat and human cells. J. Physiol. 469:639–652. [DOI] [PMC free article] [PubMed] [Google Scholar]
- Nonner, W., and B. Eisenberg. 1998. Ion permeation and glutamate residues linked by Poisson-Nernst-Planck theory in L-type calcium channels. Biophys. J. 75:1287–1305. [DOI] [PMC free article] [PubMed] [Google Scholar]
- Serrano, J.R., E. Perez-Reyes, and S.W. Jones. 1999. State-dependent inactivation of the α1G T-type calcium channel. J. Gen. Physiol. 114:185–201. [DOI] [PMC free article] [PubMed] [Google Scholar]
- Serrano, J.R., S.R. Dashti, E. Perez-Reyes, and S.W. Jones. 2000. Mg2+ block unmasks Ca2+/Ba2+ selectivity of α1G T-type calcium channels. Biophys. J. 79:3052–3062. [DOI] [PMC free article] [PubMed] [Google Scholar]
- Soler-Llavina, G.J., M. Holmgren, and K.J. Swartz. 2003. Defining the conductance of the closed state in a voltage-gated K+ channel. Neuron. 38:61–67. [DOI] [PubMed] [Google Scholar]
- Staes, M., K. Talavera, N. Klugbauer, J. Prenen, L. Lacinova, G. Droogmans, F. Hofmann, and B. Nilius. 2001. The amino side of the C-terminus determines fast inactivation of the T-type calcium channel α1G. J. Physiol. 530:35–45. [DOI] [PMC free article] [PubMed] [Google Scholar]
- Swandulla, D., and C.M. Armstrong. 1989. Calcium channel block by cadmium in chicken sensory neurons. Proc. Natl. Acad. Sci. USA. 86:1736–1740. [DOI] [PMC free article] [PubMed] [Google Scholar]
- Thévenod, F., and S.W. Jones. 1992. Cadmium block of calcium current in frog sympathetic neurons. Biophys. J. 63:162–168. [DOI] [PMC free article] [PubMed] [Google Scholar]
- West, J.W., D.E. Patton, T. Scheuer, Y. Wang, A.L. Goldin, and W.A. Catterall. 1992. A cluster of hydrophobic amino acid residues required for fast Na+-channel inactivation. Proc. Natl. Acad. Sci. USA. 89:10910–10914. [DOI] [PMC free article] [PubMed] [Google Scholar]
- Woodhull, A.M. 1973. Ionic blockage of sodium channels in nerve. J. Gen. Physiol. 61:687–708. [DOI] [PMC free article] [PubMed] [Google Scholar]
- Xiao, J., X.G. Zhen, and J. Yang. 2003. Localization of PIP2 activation gate in inward rectifier K+ channels. Nat. Neurosci. 6:811–818. [DOI] [PubMed] [Google Scholar]
- Yang, J., P.T. Ellinor, W.A. Sather, J.F. Zhang, and R.W. Tsien. 1993. Molecular determinants of Ca2+ selectivity and ion permeation in L-type Ca2+ channels. Nature. 366:158–161. [DOI] [PubMed] [Google Scholar]
- Zamponi, G.W., E. Bourinet, and T.P. Snutch. 1996. Nickel block of a family of neuronal calcium channels: subtype- and subunit-dependent action at multiple sites. J. Membr. Biol. 151:77–90. [DOI] [PubMed] [Google Scholar]
- Zheng, J., L. Vankataramanan, and F.J. Sigworth. 2001. Hidden Markov model analysis of intermediate gating steps associated with the pore gate of Shaker potassium channels. J. Gen. Physiol. 118:547–564. [DOI] [PMC free article] [PubMed] [Google Scholar]
Associated Data
This section collects any data citations, data availability statements, or supplementary materials included in this article.