

Abstract
Proteins, including ion channels, often are described in terms of some average structure and pictured as rigid entities immersed in a featureless solvent continuum. This simplified view, which provides for a convenient representation of the protein's overall structure, incurs the risk of deemphasizing important features underlying protein function, such as thermal fluctuations in the atom positions and the discreteness of the solvent molecules. These factors become particularly important in the case of ion movement through narrow pores, where the magnitude of the thermal fluctuations may be comparable to the ion pore atom separations, such that the strength of the ion channel interactions may vary dramatically as a function of the instantaneous configuration of the ion and the surrounding protein and pore water. Descriptions of ion permeation through narrow pores, which employ static protein structures and a macroscopic continuum dielectric solvent, thus face fundamental difficulties. We illustrate this using simple model calculations based on the gramicidin A and KcsA potassium channels, which show that thermal atomic fluctuations lead to energy profiles that vary by tens of kcal/mol. Consequently, within the framework of a rigid pore model, ion-channel energetics is extremely sensitive to the choice of experimental structure and how the space-dependent dielectric constant is assigned. Given these observations, the significance of any description based on a rigid structure appears limited. Creating a conducting channel model from one single structure requires substantial and arbitrary engineering of the model parameters, making it difficult for such approaches to contribute to our understanding of ion permeation at a microscopic level.
Keywords: crystallographic B factors, continuum electrostatics, Poisson-Boltzmann theory, ion solvation, free energy profile
INTRODUCTION
For the sake of simplicity, proteins often are pictured as rigid entities, corresponding to some average structure, immersed in a featureless solvent continuum. This simplified representation, which may be convenient and useful in some circumstances, should be used with extreme caution when considering ion permeation through narrow molecular pores. It long has been known that proteins have a rather fluid, dynamic structure with rapid conformational fluctuations (Cooper, 1976). In fact, proteins are composed of discrete atoms, which constantly are undergoing thermal fluctuations, from the rapid (picosecond) vibrations, through slower (multi-nanosecond) global reorientations and side chain isomerizations, to long timescale (microsecond to second) conformational changes (Karplus and McCammon, 1981). The reality of these fluctuations is evident in the Protein Data Bank (PDB) structure database, which reports not only a set of fixed coordinates but also the temperature B factors that denote (among other factors) the protein's thermal fluctuations. Understanding how protein dynamics, of all magnitudes and timescales, can influence protein function remains a significant challenge in modern biophysics (Karplus and Petsko, 1990).
In addition to thermal fluctuations, the finite size of solvent water molecules gives rise to structural effects on length scales smaller than 8–10 Å (Israelachvili and Wennerström, 1996), which means that errors may be introduced by approximating water as a continuum solvent. Therefore, even though the simplified views of rigid proteins and continuum solvent can be exceedingly useful in some cases, it is important to know when (and how) these notions break down and become inappropriate. These issues become particularly acute when trying to describe ion permeation through narrow single-file pores, where even small displacements in the atomic coordinates would be expected to have large energetic consequences.
Atomic motions have been shown experimentally to be important for the function of many proteins. Among the first examples of this is the observation by nuclear magnetic resonance (NMR) and computer simulation of side-chain flipping in the bovine pancreatic trypsin inhibitor (BPTI; see Northrup et al., 1982, and references therein). Hemoglobin and myoglobin also offer striking examples, as the crystal structures (Perutz and Mathews, 1966; Takano, 1977) provide no obvious path for O2 moving to the heme pocket, which led to the suggestion that the protein undergoes small fluctuations that allow for transient paths for O2 access (Perutz and Mathews, 1966). This suggestion was supported by the experimental observation that myoglobin undergoes thermal fluctuations (Frauenfelder et al., 1979) and by molecular dynamics simulations that identified a path for O2 movement to the heme pocket (Case and Karplus, 1979). Likewise, numerous simulations have reported significant atomic fluctuations in ion channels such as gramicidin A (gA) (Mackay et al., 1984; Roux and Karplus, 1991) and the KcsA potassium channel (Guidoni et al., 1999; Allen et al., 2000; Åqvist and Luzhkov, 2000; Bernèche and Roux, 2000; Shrivastava and Sansom, 2000; Noskov et al., 2004). Thermal fluctuations long have been acknowledged to be important for channel gating, whereas their quantitative effects on ion–protein interactions and their importance for ion permeation, though recognized, have received less attention (Hille, 1992).
In fact, though everybody “knows” that ion channels, like all other proteins, are flexible macromolecules, and that water molecules are not infinitesimally small, selective ion permeation through narrow pores tends to be discussed, at least at the conceptual level, with the underlying assumption that selective ion solvation implies that channels are quite “rigid” (Hille et al., 1999). Because of its conceptual simplicity, this picture of ion permeability and selectivity has influenced the interpretation of experimental results and the design of many computational models. The exact range of validity of this assumption/approximation and the implications of its breakdown remain poorly understood, however, in cases where the dimensions of the pore are comparable to the ion sizes, as is the case for the cation-selective, voltage-dependent channels (Hille, 1971, 1972, 1973). While some computational approaches, such as molecular dynamics (MD) simulations (Mackay et al., 1984), naturally incorporate the flexibility of macromolecular channel structures, extensive efforts have been spent developing and engineering computational models of ion permeation through narrow pores starting from the approximation of a unique fixed rigid structure with continuum solvent (Kurnikova et al., 1999; Allen and Chung, 2001; Hollerbach et al., 2001; Mashl et al., 2001; Burykin et al., 2002; Edwards et al., 2002; Nadler et al., 2003). The limitations inherent in this approximation are increasingly being recognized and efforts are made to address the worst problems (Mamanov et al., 2003). It also has been stated explicitly that the structure of channels are truly rigid and fixed, i.e., fluctuating by <0.1 Å (Eisenberg, 2003). It thus becomes important to examine critically how narrow pores behave at the microscopic level and on this basis adopt a perspective of ion permeability and selectivity that is in better accord with the physical and chemical characteristics of proteins and solvent.
The purpose of this communication, therefore, is to highlight the significance of protein flexibility and solvent representation for ion permeation through narrow channels. We will conclude that the expected atomic fluctuations (of sub-Angstrom order) in the positions of the pore-lining atoms have major consequences for the energetics of ion permeation. Thus, any description of ion permeation based on a single, rigid structure should be viewed with caution. More generally, the root-mean-square (RMS) thermal fluctuations set a minimal length scale for mechanistically significant differences in atomic sizes and positions.
RELATION BETWEEN FLEXIBILITY AND THERMAL FLUCTUATIONS
What is the magnitude of thermal fluctuations in proteins and what is their importance? To put this question in perspective, let us compare and contrast atomic fluctuations in proteins and various solid materials. Thermal motions typically are reported in terms of the RMS fluctuations of the three-dimensional atomic coordinates  , where r is a three-dimensional position vector such that 〈Δr
2〉 = 〈Δx
2 + Δy
2 + Δz
2〉. For most solids, the RMS fluctuations are small, consistent with their significant structural rigidity; e.g., covalently bonded crystals, such as diamond with RMS fluctuation of 0.07–0.09 Å (Lu et al., 1993) and silicon with RMS fluctuations of 0.13 Å (Flensburg and Stewart, 1999). In contrast, “soft materials,” such as proteins, nucleic acids, and other biological macromolecules, possess more liquid-like features and display larger atomic motions, on the order of 0.5–1.0 Å (Ringe and Petsko, 1986; Zaccai, 2000). Thermal fluctuations of this magnitude are found also in the case of the pore-lining atoms of narrow, cation-selective ion channels. The selectivity filter of the KcsA potassium channel, PDB:1K4C (Zhou et al., 2001), for example, exhibits temperature factors B = 8π2〈Δr
2〉/3 on the order of 15–20 Å2 at liquid nitrogen temperature 140 K, corresponding to RMS fluctuations of at least 0.75 Å. Despite some uncertainty in the interpretation of the temperature factors, which include contributions from static disorder, it seems likely that, at room temperature, excursions of Angstrom order from the average atomic positions can occur frequently and rapidly; in general agreement with the results of MD simulations (Bernèche and Roux, 2000; Noskov et al., 2004).
, where r is a three-dimensional position vector such that 〈Δr
2〉 = 〈Δx
2 + Δy
2 + Δz
2〉. For most solids, the RMS fluctuations are small, consistent with their significant structural rigidity; e.g., covalently bonded crystals, such as diamond with RMS fluctuation of 0.07–0.09 Å (Lu et al., 1993) and silicon with RMS fluctuations of 0.13 Å (Flensburg and Stewart, 1999). In contrast, “soft materials,” such as proteins, nucleic acids, and other biological macromolecules, possess more liquid-like features and display larger atomic motions, on the order of 0.5–1.0 Å (Ringe and Petsko, 1986; Zaccai, 2000). Thermal fluctuations of this magnitude are found also in the case of the pore-lining atoms of narrow, cation-selective ion channels. The selectivity filter of the KcsA potassium channel, PDB:1K4C (Zhou et al., 2001), for example, exhibits temperature factors B = 8π2〈Δr
2〉/3 on the order of 15–20 Å2 at liquid nitrogen temperature 140 K, corresponding to RMS fluctuations of at least 0.75 Å. Despite some uncertainty in the interpretation of the temperature factors, which include contributions from static disorder, it seems likely that, at room temperature, excursions of Angstrom order from the average atomic positions can occur frequently and rapidly; in general agreement with the results of MD simulations (Bernèche and Roux, 2000; Noskov et al., 2004).
The intrinsic flexibility of a protein, and how it responds to external perturbations, is fundamentally related to the magnitude of atomic thermal fluctuations. To illustrate this important concept, we consider a single atom fluctuating in one dimension around a mean position x with mean square amplitude 〈Δx 2〉. At the simplest level, the atom in the protein can be pictured as being attached to its average position by a harmonic spring with effective force constant K eff, which is determined by the average fluctuations (Parak and Knapp, 1984; Zaccai, 2000):
 |
(1) |
where 〈Δx 2〉 = 〈Δr 2〉/3 in the case of isotropic motion in 3D. The concept of an effective thermal restoring constant, and its implications for protein flexibility, has been previously used to analyze experimental data (Parak and Knapp, 1984; Zaccai, 2000; Gabel et al., 2002). If the fluctuations are small, the atom behaves as if it were held near its mean position by a very stiff spring. As the RMS of the fluctuations increases, this effective spring becomes weaker.
Because the atom position fluctuates, the action of an external force F ext, such as that due to the electric field arising from a nearby ion, will perturb the atom and shift its position. From Hooke's law, the atom initially at x 0 will reach a new equilibrium position x 0′ when the restoring force from the effective spring K eff will be equal and opposite to the external perturbative force.
 |
(2) |
 |
That is, the average displacement of the atom in response to an external perturbative force is fundamentally related to the magnitude of the equilibrium thermal fluctuations. While the approximation expressed in Eq. 2 eventually will break down, it remains valid for small (sub-Angstrom) displacements from x. Furthermore, although Eq. 2 was derived without explicit consideration of thermal fluctuations, it is valid also when all thermal fluctuations are taken into account (see appendix ).
Because the effective thermal spring constant K eff is an equilibrium property defined via the atomic RMS fluctuations, Eq. 2 is independent of kinetic factors (see appendix ). Therefore, even though the atom in the unperturbed protein may oscillate around its mean position at some high frequency, ω, the magnitude of the average displacement in response to some external perturbing force depends only on the magnitude of the fluctuations determined from an equilibrium averaging as described by Eq. 2.
To illustrate the importance of protein flexibility in the context of (the strong) ion–protein interactions, we consider a one-dimensional system comprising one K+ interacting with a single carbonyl (C=O) group. We assume that the oxygen atom initially is at a distance x from the fixed ion. The protein is represented by an effective harmonic restoring force, which limits the ability of the carbonyl group to move in response to the field around the cation. The displacement of the carbonyl group in response to its interaction with the ion is plotted in Fig. 1 as a function of the initial separation between the ion and the oxygen.
Figure 1.

The displacement of a carbonyl C=O group due to interactions with a K+ ion. The displacement, Δx 0 = x′0 − x 0, following energy minimization, is plotted against the initial separation distance, x 0, between the oxygen atom and the K+ ion. The carbonyl group has a fixed bond length of 1.23 Å and CHARMM PARAM27 (MacKerell et al., 1998) partial charges (q C = 0:51 e, q O = −0:51 e) and Lennard-Jones parameters (depths and positions of minima being: ɛC = 0:11 kcal/mol, ɛO = 0:12 kcal/mol and σC = 4:0 Å, σO = 3:4 Å, respectively). The six curves correspond to three-dimensional RMS fluctuations of 0 (····), 0.1 (− −), 0.2 (− · −), 0.3 (− ·· −), 0.6 (- -) and 1 Å (—), corresponding to spring constants of K = k B T/〈Δr 2〉= ∞, 178, 45, 20, 5, and 0 kcal/mol/Å2, respectively.
Materials with different various RMS fluctuations are considered: 0.1 Å, similar to a covalently bonded solid, e.g., silicon and diamond (Lu et al., 1993); 0.2 Å, a fairly rigid crystalline solid, e.g., LiF (Butt et al., 2003); 0.3 Å, a more flexible crystalline solid, e.g., KCl (Butt et al., 2003); and 0.6 Å, corresponding to the RMS observed for many proteins (Ringe and Petsko, 1986; Gabel et al., 2002) including the value obtained in the gA simulations (described below). For comparison, perfectly rigid (RMS = 0 Å) and flexible (RMS = ∞) materials are shown as the limiting cases. Rigid solids do not respond significantly to the perturbation. In striking contrast, a protein-like “soft” material (0.6–1.0 Å RMS) behaves almost like an ideally flexible material for sub-Angstrom deformations. For example, if the ion and carbonyl group initially are separated by 3.0 Å, the carbonyl will deflect by 0.39 Å, returning almost to the contact distance (of 2.58 Å). These considerations show that the (atomic) thermal fluctuations in proteins easily allow for sub-Angstrom displacements in response to strong imposed forces, such as those due to the electrostatic field around an ion. Because the elastic energy depends on the square of the strain, the response would be only prohibited for materials having RMS fluctuations close to 0.1 Å, much less than the magnitude of observed protein fluctuations.
Whereas the conformational stability of many proteins implies that proteins can be approximated as rather rigid bodies on the multi-Angstrom to nanometer length scales, the ease with which a protein structure can distort on the sub-Angstrom level has serious implications for understanding the mechanisms underlying ion selectivity in cation-selective channels, such as potassium channels. According to the simple arguments laid out above, assuming RMS fluctuations in the range of 0.75–1.0 Å (corresponding to the results of Zhou et al., 2001, and calculations of Bernèche and Roux, 2000, and Noskov et al., 2004), the displacement of a single carbonyl group by 0.4 Å (corresponding to the size difference between K+ and Na+) will incur an elastic strain energy of only a fraction of a kcal/mol. In contrast, the energy of interaction between a K+ and a single N-methylacetamide (NMA) molecule differs from the energy of interactions between a Na+ and a single NMA by 5–10 kcal/mol (Bernèche and Roux, 2002, and references therein). That is, the flexibility of proteins allows for small (local) displacements in response to the perturbing influence of an ion. In order for the strain energy to become comparable to the electrostatic energy, the channel would have to be about as rigid as diamond or silicon!
These considerations indicate that explanations of ionic selectivity in terms of the precise geometry of a (rigid) pore perfectly adapted to snugly fit K+, but not Na+ (Doyle et al., 1998; Hille et al., 1999; Yellen, 2002), are incomplete and unlikely to be correct. This conclusion raises fundamental questions about the physical mechanism enabling potassium channels to maintain a high selectivity and compels us to seek alternatives to the snug-fit hypothesis. Clearly, the spatial organization of the pore-lining groups is important (Doyle et al., 1998; Zhou et al., 2001), as it provides for an environment that both energetically and kinetically is well adapted to solvate (and desolvate) the permeating ions. It has long been recognized that channels use a combination of geometric, chemical, and energetic factors to select among different ions, and that the size of the ion and a narrow ion channel protein pore must be similar in order to allow for selective ion permeation (Mullins, 1960; Hille, 1973); but descriptions of ion selectivity must be consistent with the dynamic and atomistic nature of proteins. This entails considering alternative perspectives that also include the properties of the microscopic interactions and their influence on solvation and selectivity (Eisenman, 1961; Eisenman and Horn, 1983; Yamashita et al., 1990). Developing further the original ideas of G. Eisenman, an attractive possibility is that selectivity might arise locally, from the intrinsic dynamical and electrostatic properties of the microscopic interactions between the cation and the carbonyl groups (Noskov et al., 2004).
IMPLICATIONS FOR CALCULATING ENERGY PROFILES
In the following, we consider two ion channels (gA and KcsA) to further illustrate quantitatively the importance of protein flexibility for understanding ion permeability. To focus the presentation, we will highlight the limitations of rigid pore models in studies of ion permeation. We further will show that it is necessary to treat the pore water molecules as molecular entities, as opposed to a continuum solvent.
Gramicidin A Channels
The amount of experimental information together with the channel's relative simplicity (Andersen and Koeppe, 1992; Busath, 1993; Koeppe and Andersen, 1996) have motivated numerous computational studies of ion permeation through gA channels (Roux, 2002), including several studies that employ rigid protein models and approximate electrostatic representations (Kurnikova et al., 1999; Edwards et al., 2002; Nadler et al., 2003).
The most fundamental limitation in setting up a model in which the solvent is represented as a continuum dielectric, with the goal of studying ion permeation through a narrow pore, is the obvious problem of trying to define macroscopic dielectric constants for microscopic length scales (on the order of Å). This problem is exemplified well in the case of gA channels, which clearly demonstrate the fundamental and well-documented difficulties associated with attributing a uniform macroscopic dielectric constant (of any value) to water molecules organized in single file along a narrow pore (Partenskii and Jordan, 1992; Dorman and Jordan, 2004). The simplest (and most commonly used) choice is to assume a bulk-like value for the dielectric constant of the solvent region, such that ɛw = 80. At the microscopic level, however, there is no justification for this or any other fixed value (Partenskii and Jordan, 1992; Dorman and Jordan, 2004), a situation that already was perceived by K. Wilson and collaborators (Mackay et al., 1984). Similarly, there is uncertainty concerning the protein dielectric constant ɛp. Experimental determinations on dry polypeptides range from 4 to 10 (Tredgold and Hole, 1976), and a value of 4 was deduced from the effects of side chain dipoles on the conductance of gA channels (Koeppe et al., 1990). A priori calculations suggest values ranging from 2 to 5 depending on the situation (Simonson and Brooks, 1996; Pitera et al., 2001; Schutz and Warshel, 2001), though a value of 2 has been used in many theoretical studies. One may note that the value of ɛp has a small effect for large and medium-sized pores (Bastug and Kuyucak, 2003), where one can approximate the pore water to resemble bulk water; but a large effect in the case of narrow pores (Corry et al., 2003), where the application of continuum models is questionable anyway.
Nevertheless, assuming that one is willing to use continuum dielectric approximations, as has been done in numerous studies of ion permeation, a second difficulty arises from the need to define the dielectric boundary separating the protein and solvent regions, i.e., to decide which region of space that will be assigned the different dielectric constants (ɛw or ɛp). Conceptually, the dielectric boundary corresponds more or less to the van der Waals envelope of the protein, which defines the volume from which the water molecules are physically excluded. For example, if all the atoms of the protein are represented as hard spheres, the solvent-accessible region corresponds to the region of space that is located outside any of those hard spheres. The advantage of this procedure is that it is operationally well defined and very easy to implement. The disadvantage is that it ignores the basic fact that the water molecule itself has a physical dimension and that the solvent is not a continuous medium of infinitesimal points (able to fill the tiniest cavities and cracks in the interior of the protein). Therefore, a more sophisticated method consists of also representing the water molecule as a hard sphere. The dielectric boundary between the solvent and the protein then is defined by “rolling” the chosen water probe onto the protein, mapping all the regions of space that are physically accessible to the solvent. The procedure is illustrated schematically in Fig. 2; it is the standard procedure used in applications of Poisson-Boltzmann theory to globular proteins (Davis et al., 1991; Sitkoff et al., 1994; Nina et al., 1997). This procedure is intrinsically more physical because it avoids the spurious effects of assigning a high dielectric value of ɛw to small spatial regions in the interior of the protein that are not even able to contain a single water molecule.
Figure 2.
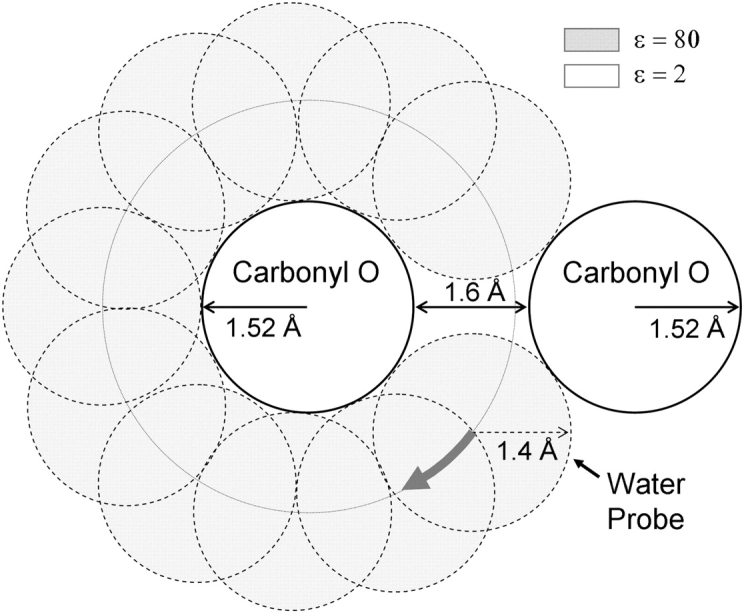
Assigning regions of different dielectric constant with a probe. A simplified example of two carbonyl oxygen atoms (of Born radius 1.52 Å), separated by a distance of 4.64 Å (center to center) such that there is a 1.6 Å gap between the two. A 1.4 Å water probe is rotated around each protein atom. Any volume traced by the probe is assigned a high dielectric constant of ɛ = 80, whereas regions not traced are assigned a low dielectric constant of 2. There is a space between the oxygen atoms where the dielectric constant is low. In much of the gA and KcsA channel pores this is the case (see text for more detail).
We performed Poisson equation solutions with the PBEQ module (Nina et al., 1997) of CHARMM (Brooks et al., 1983) for a single gA ion channel structure, PDB:1GRM (Arseniev et al., 1986), embedded in continuous dielectric membrane and water, to demonstrate the difficulties in assigning dielectrics. A schematic, resembling the model gA system, is illustrated in Fig. 3.
Figure 3.
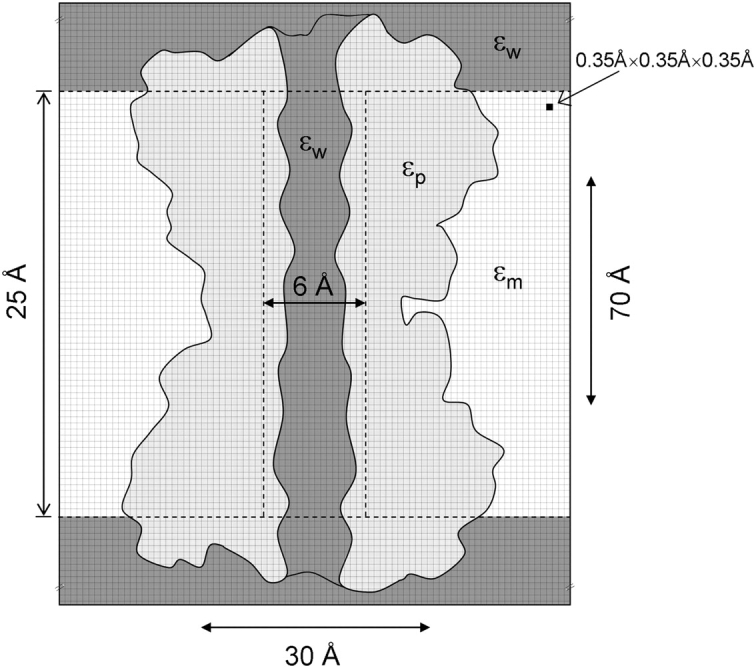
Schematic representation of the model gA system. A two-dimensional drawing of the gA channel (based on the approximate shape and dimensions of the channel), embedded in a continuous membrane and water, is shown cut along a plane containing the z axis. The protein is assigned a dielectric constant of ɛp; it is surrounded by a 25 Å thick membrane of dielectric constant ɛm (representing the hydrophobic core of the bilayer), and by bulk water and channel water with dielectric constant ɛw. The channel water dielectric constant was assigned by underlaying a 6 Å diameter cylinder of length 25 Å beneath the gA channel, but over the membrane slab, meaning that the dielectric constant for any point is assigned with the following priority: bulk water < membrane slab < pore water < protein. A 0.35 Å grid spanning ∼30 Å in the x and y directions, and 70 Å in the z direction, was used.
Fig. 4 A shows the effect of probe size on the assignment of dielectric constants throughout the pore of the PDB:1GRM gA structure. Though water can permeate gA channels (Rosenberg and Finkelstein, 1978), a water probe of 1.4 Å radius will not fit throughout most of the gA pore, an artifact that results from choosing a single rigid set of atomic coordinates (see Fig. 3). This contradiction illustrates well the significance of thermal fluctuations of the protein and reveals (again) the problems associated with the concept of a rigid structure. As a consequence, most of the lumen will not be assigned the high dielectric constant of water. Potential energy profiles (also referred to as the static field or fixed charge field) were obtained from single solutions to Poisson's equation, in the absence of an ion, and reported as the electric potential along the z axis, multiplied by the unit charge e. Fig. 4 B shows that the effect of the probe size on the electrostatic potential energy may be as much as 8 kcal/mol, emphasizing the difficulties/uncertainties associated with using a continuum solvent model in a narrow pore. The significance of defining dielectric boundaries where one has difficulties fitting even a single water molecule is unclear.
Figure 4.

(A) Effect of probe radius on the assignment of the dielectric constant along the channel z axis (ɛaxis) for the PDB:1GRM structure. For illustrative purposes, we assign a value of 80 to water and 2 to the protein. (B) The effect of probe size on the potential profile (expressed as potential energy) for the PDB:1GRM structure. Water probe radii of 0.0 (—), 0.8 (·····), 1.0 (- · -), and 1.4 Å (- -) have been used to identify the high and low dielectric regions.
In the procedure described above, channel atoms, ions, and water molecules were represented as simple hard spheres. Additional difficulties therefore arise when choosing the particular value of the radius that should be assigned to the various atom types. Those atomic radii are required for the construction of the dielectric boundary, and their values have a very significant impact on the results of any model based on macroscopic electrostatics. In the present calculations, we employ the atomic radii of Nina et al. (1997), which were optimized from MD free energy calculations with explicit water molecules to accurately reproduce the solvation free energy of all amino acids. In this library, the backbone atomic radii are 1.52 Å for O, 2.04 Å for C, 2.23 Å for N, and 2.38–2.86 Å for Cα. Furthermore, a water probe radius of 1.4 Å was used to determine the dielectric boundary. In contrast, Nadler et al. (2003) arbitrarily used a unique value of 1.5 Å for all nonhydrogen atoms, providing no justification to explain why all atoms can be treated as having the same size. Edwards et al. (2002) used atomic radii derived from atomic contact distances (Li and Nussinov, 1998). Those radii are somewhat smaller than the radii of Nina et al. (1997), and their ability to accurately reproduce solvation free energies is not known. In addition, those previous studies constructed the protein–solvent dielectric boundary without using a water probe (i.e., assuming that water molecules are infinitesimal “points”). The specific choice can lead to a factor of two difference in the calculation of the dielectric self-energy (also referred to as the reaction-field energy, electrostatic barrier, image charge repulsion, and dielectric boundary force) contributions to the energy profile that are reported below, again reinforcing the limitations of the continuum solvent approach.
Once a model based on a unique rigid channel structure and continuum solvent has been adopted, the results are extremely sensitive to the slightest variations in atomic coordinates. Fig. 5 A shows the potential profile along the channel z-axis for the available high resolution NMR structures of the single-stranded β6.3-helical bilayer– or micelle-incorporated gA dimer: PDB:1GRM (blue; Arseniev et al., 1986); PDB:1MAG (green; Ketchem et al., 1997); and PDB:1JNO (red; Townsley et al., 2001).
Figure 5.

Energy profiles for reported experimental structures: PDB:1GRM (blue); PDB:1MAG (green); and PDB:1JNO (red). The potential and self energy profiles and their sum are plotted in A, C, and E, respectively, using a water probe radius of 0.0 Å (no probe). B, D, and F show the corresponding results obtained using a probe radius of 1.4 Å. For comparison with the profiles calculated for the static structures, the one-dimensional PMF of Allen et al. (2004) is plotted (—) in E and F.
These profiles were calculated without using a water probe (i.e., probe radius 0.0 Å) to define the dielectric interface and differ by as much as 6 kcal/mol. Fig. 5 B shows that profiles obtained using a 1.4 Å probe differ by as much as 14 kcal/mol. Electrostatic self energy profiles (Fig. 5, C and D) were calculated by solving Poisson's equation for each position of a K+ ion, placed at regular points along the channel z-axis, with the protein charges set to zero. These self energy profiles reveal the sensitivity to the precise shape of the protein–water dielectric boundary when an ion is brought inside the narrow pore from the bulk. For probe radii 0.0 Å and 1.4 Å, the self energies differ by up to 2.2 kcal/mol and 2.7 kcal/mol, respectively. Moreover, the total energies (Fig. 5, E and F) show that there is no cancellation of errors between the potential and self energy components. Of particular importance, the PDB:1GRM and PDB:1JNO coordinates correspond to essentially the same structure (based on NMR observables and backbone pitch; Woolf and Roux, 1996; Allen et al., 2003), yet they yield quite different potential profiles. The problem only becomes accentuated by noting (Fig. 5 F) that the total energies, calculated using any of the rigid structures, are significantly above the one-dimensional potential of mean force (PMF) profiles obtained from MD simulations with explicit solvent (Allen et al., 2004).
But gA channels are not rigid. Based on MD simulations, the RMS fluctuations in carbonyl oxygen atomic coordinates vary between 0.4 and 0.65 Å (Fig. 6). The fluctuations are lowest for residues 6–8, in general agreement with experimental solid-state NMR studies (Lee et al., 1995), and larger near the COOH-ethanolamide termini where the cations spend most of their time (thus the value of 0.6 Å used in the earlier illustration) and the formyl-NH2 termini where the two subunits join. These fluctuations in the absence of an ion, also are evidenced by 7–13° fluctuations in backbone φ and ψ dihedral angles, in agreement with experimental estimates (North and Cross, 1995). The corresponding flexibility of the protein (and response to an imposed force) is revealed by MD simulations with a K+ placed near the entrance of the channel, which causes the backbone φ and ψ dihedral angles to deviate by 2–8°, relative to the empty channel; estimates that are within the range deduced experimentally (Tian et al., 1996).
Figure 6.

RMS fluctuations in residues of the gA channel during 4 ns of MD simulation. The RMS fluctuations in carbonyl oxygen positions are plotted against residue number (residue 0 corresponds to the carbonyl oxygen at the formyl-NH2 terminus).
These small, Angstrom-scale fluctuations in structure that result from thermal motions produce large variations in the energetics of ion permeation, when used in models based on any one rigid structure and continuum electrostatics. To illustrate the effect of thermal fluctuations on ion energetics, we also report Poisson solutions for multiple frames from an MD trajectory. Simulations were initiated with the PDB:1JNO gA structure, as described previously (Allen et al., 2004). Each sample was oriented such that the channel axis coincides, as closely as possible, with the fixed z-axis of the system. A total of 200 samples were taken from 4 ns of MD simulation (six of which were excluded because protein atom centers came within 1.4 Å of the fixed z axis). The variations in the potential profile are as much as 15 kcal/mol with no probe (Fig. 7 A), and 39 kcal/mol with a 1.4 Å probe (Fig. 7 B).
Figure 7.

The effect of thermal fluctuations on energy profiles. (A) Potential profiles expressed as potential energy) for 194 samples taken from MD simulations using no water probe. (B) The corresponding potential energy profiles obtained using a probe radius of 1.4 Å. C and D show the self energy profiles for 40 samples plotted using probe radii of 0 Å (C) and 1.4 Å (D), respectively.
The self-energy profiles calculated with 0.0 and 1.4 Å probes are plotted in Fig. 6 (C and D). They vary by up to 3.6 kcal/mol when calculated with no probe, and by up to 6.0 kcal/mol with a 1.4 Å probe. Similar variations in continuum energetics (of up to 20 kcal/mol) were calculated from MD trajectories with an ion included within the pore (Mamanov et al., 2003). These variations are an order of magnitude too large to permit meaningful analysis of ion permeation. In contrast, when the atomic fluctuations, which are intrinsic features of any molecular system, are integrated into the equilibrium PMF calculated from MD simulations (Allen et al., 2004), the resulting PMF (Fig. 5, E and F) is well converged and well defined because it corresponds to the reversible work done by the mean force. The PMF is well behaved because it is the force that is properly Boltzmann-weighted averaged over a large number of configurations for each ion position; hence, the name potential of mean force. A properly constructed PMF thus becomes a critical first step in the formulation of nonequilibrium permeation models (Roux et al., 2004). In particular, the PMF is consistent among modern all-atom force fields, and integrating over 1 or 2 ns of simulation does not alter the profile by more than a fraction of a kcal/mol (unpublished data). Lastly, one should stress that a key structural feature of the equilibrium PMF such as the binding sites near the entrance of the channel (Fig. 5, E and F) cannot be reproduced by the continuum model, regardless of the chosen coordinates or probe size, as shown in Fig. 5.
KcsA Potassium Channels
As a second example of a narrow pore, we consider the KcsA channel. Since the structure of this channel was reported by Doyle et al. (1998) and at higher resolution by Zhou et al. (2001), KcsA channels have been the focus of many simulation studies, including continuum electrostatic approximations that do not consider the consequences of protein thermal fluctuations (Allen and Chung, 2001; Mashl et al., 2001; and Burykin et al., 2002). As would be expected from the preceding analysis of the importance of thermal fluctuations in gA channels, atomic fluctuations also are important in KcsA. To illustrate the inherent problems faced by models based on a rigid structure and continuum electrostatics, we compare the Poisson solutions obtained with the two available X-ray structures.
Fig. 8 shows the potential profile calculated for the 3.2 Å PDB:1BL8 (Doyle et al., 1998) and 2.0 Å PDB:1K4C (Zhou et al., 2001) resolution KcsA potassium channel structures. The positions of the carbonyl oxygen atoms in the selectivity filter differ by an RMS of 0.7 Å. This difference is similar to the RMS thermal fluctuations of the selectivity filter backbone atoms (Zhou et al., 2001), indicating that the two structures are essentially identical (Bernèche and Roux, 2000). The electrostatic potential profile along the channel axis through the selectivity filter with a probe of radius 0 Å (no probe), is plotted in Fig. 8 A. The potential profiles differ by as much as 15 kcal/mol. With a probe radius of 1.4 Å (Fig. 8 B), these differences can be as large as 47 kcal/mol.
Figure 8.

Potential energy profiles for the 3.2 Å resolution PDB:1BL8 (- -) and 2.0 Å resolution PDB:1K4C (—) KcsA potassium channel structures. In A, the probe radius was 0.0 Å (no probe) in the Poisson solutions, whereas a probe radius of 1.4 Å was used in B. The axis of fourfold symmetry was aligned with the z axis and the center of the cavity below the selectivity filter placed at the origin.
As was the case for the gA channel, fundamental difficulties arise when attempting to define the dielectric interface in the narrow selectivity filter of the KcsA channel. In both the 3.2 Å and 2.0 Å resolution structures, the 1.4 Å water probe, and even a smaller 0.8 Å probe, could not fit at many positions within the selectivity filter. For example, the Val76 carbonyl oxygen atoms on opposite subunits are separated by <4.6 Å in 1K4C, corresponding to an approximate pore diameter of 1.8 Å (pore radius of 0.9 Å). This is too narrow for either a water molecule or a K+ to pass, implying that the selectivity filter must be flexible to permit conduction. Comparison of Fig. 7 (A and B) reveals that the effect of the probe size on the potential profile for the KcsA structures can be as large as 83 kcal/mol. Thus, even the simple task of assigning the dielectric regions cannot be resolved. As in the case for the gA channel, such extreme sensitivity to a unique structure is avoided in the PMF calculated from MD (Bernèche and Roux, 2001, 2003).
CONCLUSION
Though the simplified representation of proteins in terms of their average structures (neglecting the thermal fluctuations) provides invaluable insight, it also causes major difficulties for the analysis of ion movement through narrow pores. Considering only the average structure of an ion channel leads to serious problems because it ignores not only the thermal fluctuations but also the distortion of the average structure in response to the presence of an ion, both of which are essential ingredients in a proper description of selectivity (Noskov et al., 2004) and channel function generally (Immke et al., 1999; Boccaccio et al., 2004).
The reason why there are problems associated with an analysis based on any unique, fixed structure may be illustrated in simple terms in the case of the electrostatic interactions, which plays a dominant role in permeation and selectivity. Though Coulomb's law between two charges varies instantaneously as 1/r, then 〈1/r〉 ≠ 1/〈r〉 whenever r undergoes (thermal) fluctuations. Moreover, the inequality is independent of the chosen timescale. Using a unique fixed structure may be an acceptable approximation in the case of very wide pores, such as Escherichia coli OmpF porin (Im and Roux, 2002) where 〈1/r〉 ≈ 1/〈r〉; but the situation is very different when the dimensions of the pore are comparable to the ion sizes. This is why, despite the sub-Angstrom fluctuations being much faster (picoseconds) than the timescale for ion conduction (nanoseconds), a representation based on a single static structure, even one corresponding to the average position of the atoms, cannot provide a valid model for ion permeation through a narrow pore. Experimental results on thermal fluctuations in proteins (Frauenfelder et al., 1979; Parak and Knapp, 1984; Ringe and Petsko, 1986; Gabel et al., 2002), the ion-induced reorganization of the KcsA pore (Zhou et al., 2001) as well as simulation-based calculations (including those presented here), show that proteins are flexible on sub-Angstrom length scales. This means that the protein's response to perturbative forces, such as those arising between permeant ions and the charged or dipolar groups lining the pore, cannot be neglected in narrow ion channels.
The present analysis indicates that ionic selectivity in K+ channels cannot be a property of a rigid channel structure, in which the selected ion “fits” particularly well, such that the oxygens lining the pore coordinate the selected cation with sub-Angstrom precision. Although the conserved residues surrounding the selectivity filter are essential for the overall stability of the three-dimensional fold (within 1 Å, or so), the MD calculations show that the architectural sub-Angstrom rigidity of the protein is not a key factor in making the channel selective for K+ over Na+. Rather, selectivity is controlled by the dynamical and electrostatic properties of the carbonyl ligands surrounding the ion (Noskov et al., 2004), a perspective that shares some of the basic ideas originally proposed by Eisenman (1961).
The huge variation in electrostatic profiles, over the ensemble of structures sampled by MD, shows that calculations based on static structures and continuum solvent can lead to vastly differing energy profiles, even for surprisingly small variations in atomic coordinates. In addition to these difficulties, the implementation of strategies for defining electrostatic continuum regions encounters severe unresolved problems, such as whether a high dielectric constant should be used where a single water molecule cannot fit.
Though it is possible to “engineer” simplified models to yield (seemingly) reasonable results, this involves making numerous arbitrary decisions about dielectric constants, atomic radii, charge distribution, diffusion coefficients, and channel structure. By arbitrary decision, we mean that the values of the microscopic parameters of the model are adjusted so as to “fit” the final outcome of the model (e.g., the channel conductance) to the experimental results, as opposed to being chosen on the basis of more fundamental chemical and physical knowledge. The microscopic insights into the mechanisms of ion permeation and selectivity are severely limited in such models. It becomes necessary to treat explicitly the atomic interactions and thermal motions and deformations upon ion binding, as is done in MD simulations. The use of a rigid protein model leads to extreme sensitivity to the precise (sub-Angstrom) values of the atomic coordinates, for example, but such spurious problems disappear when one considers an equilibrium thermal average corresponding to a PMF calculated by MD to describe ion permeation.
Acknowledgments
We thank Drs. Peter C. Jordan, Zhe Lu, and Chris Miller for stimulating discussions and suggestions.
This work was supported by the Revson Foundation (T.W. Allen) and National Institutes of Health grants GM21342 (O.S. Andersen) and GM62342 (B. Roux).
Ted Begenisich served as guest editor.
APPENDIX
We wish to establish a connection between atomic thermal fluctuations of a protein and its flexibility in response to a perturbing force. Consider a solvated protein in a membrane with coordinates and velocities in the system denoted by R and V, respectively. According to Maxwell-Boltzmann statistics, the joint probability P(R,V) for the velocities configuration is given by
 |
(A1) |
where  is the total kinetic energy and U(R) is the potential energy. We assume that there is a constant external force acting on the ith atom in the x direction, such that the external perturbation can be written as u(x
i) = −F
ext(x
i − 〈x
i〉(0)), where 〈x
i〉(0) is the average equilibrium position of the atom in the unperturbed reference system. The average position of the ith atom is, keeping only the lowest order in the perturbation,
is the total kinetic energy and U(R) is the potential energy. We assume that there is a constant external force acting on the ith atom in the x direction, such that the external perturbation can be written as u(x
i) = −F
ext(x
i − 〈x
i〉(0)), where 〈x
i〉(0) is the average equilibrium position of the atom in the unperturbed reference system. The average position of the ith atom is, keeping only the lowest order in the perturbation,
 |
(A2) |
 |
 |
 |
where <Δxi 2>(0)=<xi 2>(0)−<xi>(0) 2 is the RMS fluctuation of the ith atom along the x direction in the unperturbed system. Eq. A2 shows that the average position of the perturbed atom will shift in response to the external force, by an amount that is proportional to the magnitude of the RMS fluctuations in the unperturbed system. This illustrates the intimate link between thermal fluctuations and structural flexibility. Comparison with Eq. 2 reveals that the inverse mean square thermal fluctuation acts as an effective spring constant to maintain the atomic positions, and thus the protein structure. It may be noted that kinetic energy factors do not contribute to this equilibrium average and therefore cancel out. That is, the magnitude of the deflection due to a perturbation from equilibrium statistical mechanics bears no direct relation to the frequency of the vibration, but only to its amplitude.
The above argument can be extended to any multidimensional case of perturbation affecting the set of coupled coordinates of the protein atoms,
 |
(A3) |
where X γ denotes the Cartesian coordinate (x, y, z) of protein atom γ. The average for the coordinate X α is then
 |
(A4) |
Eq. A4 also can be written in terms of a set of cross-correlation matrix elements
 |
(A5) |
such that
 |
(A6) |
Comparison with Eq. 2 shows that the inverse of the matrix C acts as effective spring constants maintaining the protein structure.
T.W. Allen's present address is Department of Chemistry, University of California, Davis, Davis, CA 95616-5295.
Abbreviations used in this paper: gA, gramicidin A; MD, molecular dynamics; NMR, nuclear magnetic resonance; PMF, potential of mean force; RMS, root-mean-square.
References
- Allen, T.W., and S.-H. Chung. 2001. Brownian dynamics study of an open-state KcsA potassium channel. Biochim. Biophys. Acta. 1515:83–91. [DOI] [PubMed] [Google Scholar]
- Allen, T.W., A. Bliznyuk, A.P. Rendell, S. Kuyucak, and S.-H. Chung. 2000. The potassium channel: structure, selectivity and diffusion. J. Chem. Phys. 112:8191–8204. [Google Scholar]
- Allen, T.W., O.S. Andersen, and B. Roux. 2003. The structure of gramicidin A in a lipid bilayer environment determined using molecular dynamics simulations and solid-state NMR data. J. Am. Chem. Soc. 125:9868–9878. [DOI] [PubMed] [Google Scholar]
- Allen, T.W., O.S. Andersen, and B. Roux. 2004. Energetics of ion conduction through the gramicidin channel. Proc. Natl. Acad. Sci. USA. 101:117–122. [DOI] [PMC free article] [PubMed] [Google Scholar]
- Andersen, O.S., and R.E. Koeppe II. 1992. Molecular determinants of channel function. Physiol. Rev. 72:S89–S158. [DOI] [PubMed] [Google Scholar]
- Åqvist, J., and V. Luzhkov. 2000. Ion permeation mechanism of the potassium channel. Nature. 404:881–884. [DOI] [PubMed] [Google Scholar]
- Arseniev, A.S., A.L. Lomize, I.L. Barsukov, and V.F. Bystrov. 1986. Gramicidin A transmembrane ion-channel. Three-dimensional structure reconstruction based on NMR spectroscopy and energy refinement. Biol. Membr. 3:1077–1104. [Google Scholar]
- Bastug, T., and S. Kuyucak. 2003. Role of the dielectric constants of membrane proteins and channel water in ion permeation. Biophys. J. 84:2871–2882. [DOI] [PMC free article] [PubMed] [Google Scholar]
- Bernèche, S., and B. Roux. 2000. Molecular dynamics of the KcsA K+ channel in a bilayer membrane. Biophys. J. 78:2900–2917. [DOI] [PMC free article] [PubMed] [Google Scholar]
- Bernèche, S., and B. Roux. 2001. Energetics of ion conduction through the K+ channel. Nature. 414:73–77. [DOI] [PubMed] [Google Scholar]
- Bernèche, S., and B. Roux. 2002. The ionization state and the conformation of Glu-71 in the KcsA K+ channel. Biophys. J. 82:772–780. [DOI] [PMC free article] [PubMed] [Google Scholar]
- Bernèche, S., and B. Roux. 2003. A microscopic view of ion conduction through the K+ channel. Proc. Natl. Acad. Sci. USA. 100:8644–8648. [DOI] [PMC free article] [PubMed] [Google Scholar]
- Boccaccio, A., F. Conti, B.M. Olivera, and H. Terlau. 2004. Binding of κ-conotoxin PVIIA to Shaker K+ channels reveals different K+ and Rb+ occupancies within the ion channel pore. J. Gen. Physiol. 124:71–81. [DOI] [PMC free article] [PubMed] [Google Scholar]
- Brooks, B.R., R.E. Bruccoleri, B.D. Olafson, D.J. States, S. Swaminathan, and M. Karplus. 1983. CHARMM: a program for macromolecular energy, minimization, and dynamics calculations. J. Comp. Chem. 4:187–217. [Google Scholar]
- Burykin, A., C.N. Schutz, J. Villa, and A. Warshel. 2002. Simulations of ion current in realistic models of ion channels: the KcsA potassium channel. Proteins. 47:265–280. [DOI] [PubMed] [Google Scholar]
- Busath, D.D. 1993. The use of physical methods in determining gramicidin channel structure and function. Annu. Rev. Physiol. 55:473–501. [DOI] [PubMed] [Google Scholar]
- Butt, N.M., J. Bashir, and M.N. Khan. 2003. Compilation of temperature factors of cubic compounds. Acta Cryst. A49:171–174. [Google Scholar]
- Case, D.A., and M. Karplus. 1979. Dynamics of ligand binding to heme proteins. J. Mol. Biol. 132:343–368. [DOI] [PubMed] [Google Scholar]
- Cooper, A. 1976. Thermodynamic fluctuations in protein molecules. Proc. Natl. Acad. Sci. USA. 73:2740–2741. [DOI] [PMC free article] [PubMed] [Google Scholar]
- Corry, B., S. Kuyucak, and S.H. Chung. 2003. Dielectric self-energy in Poisson-Boltzmann and Poisson-Nernst-Planck models of ion channels. Biophys. J. 84:3594–3606. [DOI] [PMC free article] [PubMed] [Google Scholar]
- Davis, M.E., J.D. Madura, B. Luty, and J.A. McCammon. 1991. Electrostatic and diffusion of molecules in solution: simulations with the University of Houston Brownian Dynamics program. Comp. Physiol. Comm. 62:187–197. [Google Scholar]
- Dorman, V.L., and P.C. Jordan. 2004. Ionic permeation free energy in gramicidin: a semimicroscopic perspective. Biophys. J. 86:3529–3541. [DOI] [PMC free article] [PubMed] [Google Scholar]
- Doyle, D.A., J. Morais Cabral, R.A. Pfuetzner, A. Kuo, J.M. Gulbis, S.L. Cohen, B.T. Chait, and R. MacKinnon. 1998. The structure of the potassium channel: molecular basis of K+ conduction and selectivity. Science. 280:69–77. [DOI] [PubMed] [Google Scholar]
- Edwards, S., B. Corry, S. Kuyucak, and S.-H. Chung. 2002. Continuum electrostatics fails to describe ion permeation in the gramicidin channel. Biophys. J. 83:1348–1360. [DOI] [PMC free article] [PubMed] [Google Scholar]
- Eisenberg, R.S. 2003. Ion channels as devices. J. Comp. Electron. 2:245–249. [Google Scholar]
- Eisenman, G. 1961. On the elementary origin of equilibrium ion specificity. In Symposium on Membrane Transport and metabolism. A. Kleinzeller and A. Kotyk, editors. Academic Press, New York. 163–179.
- Eisenman, G., and R. Horn. 1983. Ionic selectivity revisited: the role of kinetic and equilibrium processes in ion permeation through channels. J. Membr. Biol. 76:197–225. [DOI] [PubMed] [Google Scholar]
- Flensburg, C., and R.F.R. Stewart. 1999. Lattice dynamical Debye-Waller factor for silicon. Phys. Rev. B. 60:284–291. [Google Scholar]
- Frauenfelder, H., G.A. Petsko, and D. Tsernoglou. 1979. Temperature-dependent X-ray diffraction as a probe of protein structural dynamics. Nature. 280:558–563. [DOI] [PubMed] [Google Scholar]
- Gabel, F., D. Bicout, U. Lehnert, M. Tehei, M. Weik, and G. Zaccai. 2002. Protein dynamics studied by neutron scattering. Q. Rev. Biophys. 35:327–367. [DOI] [PubMed] [Google Scholar]
- Guidoni, L., V. Torre, and P. Carloni. 1999. Potassium and sodium binding to the outer mouth of the K+ channel. Biochemistry. 38:8599–8604. [DOI] [PubMed] [Google Scholar]
- Hille, B. 1971. The permeability of the sodium channel to organic cations in myelinated nerve. J. Gen. Physiol. 58:599–619. [DOI] [PMC free article] [PubMed] [Google Scholar]
- Hille, B. 1972. The permeability of the sodium channel to metal cations in myelinated nerve. J. Gen. Physiol. 59:637–658. [DOI] [PMC free article] [PubMed] [Google Scholar]
- Hille, B. 1973. Potassium channels in myelinated nerve: selective permeability to small cations. J. Gen. Physiol. 61:669–686. [DOI] [PMC free article] [PubMed] [Google Scholar]
- Hille, B. 1992. Ionic Channels of Excitable Membranes. 2nd ed. Sinauer Associates, Sunderland, MA. 607 pp.
- Hille, B., C.M. Armstrong, and R. MacKinnon. 1999. Ion channels: from idea to reality. Nat. Med. 5:1105–1109. [DOI] [PubMed] [Google Scholar]
- Hollerbach, U., D. Chen, and R.S. Eisenberg. 2001. Two- and three-dimensional Poisson-Nernst-Planck simulations of current flow through gramicidin A. J. Sci. Comput. 16:373–409. [Google Scholar]
- Im, W., and B. Roux. 2002. Ion permeation and selectivity of OmpF porin: a theoretical study based on molecular dynamics, Brownian dynamics, and continuum electrodiffusion theory. J. Mol. Biol. 322:851–869. [DOI] [PubMed] [Google Scholar]
- Immke, D., M. Wood, L. Kiss, and S.J. Korn. 1999. Potassium-dependent changes in the conformation of the Kv2.1 potassium channel pore. J. Gen. Physiol. 113:819–836. [DOI] [PMC free article] [PubMed] [Google Scholar]
- Israelachvili, J., and H. Wennerström. 1996. Role of hydration and water structure in biological and colloidal interactions. Nature. 379:219–225. [DOI] [PubMed] [Google Scholar]
- Karplus, M., and J.A. McCammon. 1981. The internal dynamics of globular proteins. CRC Crit. Rev. Biochem. 9:293–349. [DOI] [PubMed] [Google Scholar]
- Karplus, M., and G.A. Petsko. 1990. Molecular dynamics simulations in biology. Nature. 347:631–639. [DOI] [PubMed] [Google Scholar]
- Ketchem, R.R., B. Roux, and T.A. Cross. 1997. High-resolution polypeptide structure in a lamellar phase lipid environment from solid state NMR derived orientational constraints. Structure. 5:1655–1669. [DOI] [PubMed] [Google Scholar]
- Koeppe, R.E., II, and O.S. Andersen. 1996. Engineering the gramicidin channel. Annu. Rev. Biophys. Biomol. Struct. 25:231–258. [DOI] [PubMed] [Google Scholar]
- Koeppe, R.E., II, J.-L. Mazet, and O.S. Andersen. 1990. Distinction between dipolar and inductive effects in modulating the conductance of gramicidin channels. Biochemistry. 29:512–520. [DOI] [PubMed] [Google Scholar]
- Kurnikova, M.G., R.D. Coalson, P. Graf, and A. Nitzan. 1999. A lattice relaxation algorithm for three-dimensional Poisson-Nernst-Planck theory with application to ion transport through the gramicidin A channel. Biophys. J. 76:642–656. [DOI] [PMC free article] [PubMed] [Google Scholar]
- Lee, K.C., S. Huo, and T.A. Cross. 1995. Lipid-peptide interface: valine conformation and dynamics in the gramicidin channel. Biochemistry. 34:857–867. [DOI] [PubMed] [Google Scholar]
- Li, A.J., and R. Nussinov. 1998. A set of van der Waals and coulombic radii of protein atoms for molecular and solvent-accessible surface calculation, packing evaluation, and docking. Proteins. 32:111–127. [PubMed] [Google Scholar]
- Lu, Z.W., A. Zunger, and M. Deutsch. 1993. Electronic charge distribution in crystalline diamond, silicon and germanium. Phys. Rev. B. 47:9385–9410. [DOI] [PubMed] [Google Scholar]
- Mackay, D.H.J., P.H. Berens, K.R. Wilson, and A.T. Hagler. 1984. Structure and dynamics of ion transport through gramicidin A. Biophys. J. 46:229–248. [DOI] [PMC free article] [PubMed] [Google Scholar]
- MacKerell, A.D., Jr., D. Bashford, M. Bellott, R.L. Jr. Dunbrack, J.D. Evanseck, M.J. Field, S. Fischer, J. Gao, H. Guo, S. Ha, et al. 1998. All-atom empirical potential for molecular modeling and dynamics studies of proteins. J. Phys. Chem. B. 102:3586–3616. [DOI] [PubMed] [Google Scholar]
- Mamanov, A.B., R.D. Coalson, A. Nitzan, and M.G. Kurnikova. 2003. The role of the dielectric barrier in narrow biological channels: a novel composite approach to modeling single-channel currents. Biophys. J. 84:3646–3661. [DOI] [PMC free article] [PubMed] [Google Scholar]
- Mashl, R.J., Y. Tang, J. Schnitzer, and E. Jakobsson. 2001. Hierarchical approach to predicting permeation in ion channels. Biophys. J. 81:2473–2483. [DOI] [PMC free article] [PubMed] [Google Scholar]
- Mullins, L.J. 1960. An analysis of pore size in excitable membranes. J. Gen. Physiol. 43:105–117. [DOI] [PMC free article] [PubMed] [Google Scholar]
- Nadler, B., U. Hollerbach, and R.S. Eisenberg. 2003. Dielectric boundary force and its crucial role in gramicidin. Phys Rev. E Stat. Nonlin. Soft Matter Phys. 68:021905. [DOI] [PubMed] [Google Scholar]
- Nina, M., D. Beglov, and B. Roux. 1997. Atomic radii for continuum electrostatics calculations based on molecular dynamics free energy simulations. J. Phys. Chem. B. 101:5239–5248. [Google Scholar]
- North, C.L., and T.A. Cross. 1995. Correlations between function and dynamics: time scale coincidence for ion translocation and molecular dynamics in the gramicidin channel backbone. Biochemistry. 34:5883–5895. [DOI] [PubMed] [Google Scholar]
- Northrup, S.H., M.R. Pear, C.Y. Lee, J.A. McCammon, and M. Karplus. 1982. Dynamical theory of activated processes in globular proteins. Proc. Natl. Acad. Sci. USA. 79:4035–4039. [DOI] [PMC free article] [PubMed] [Google Scholar]
- Noskov, S.Y., S. Bernèche, and B. Roux. 2004. Control of ion selectivity in potassium channels by dynamical and electrostatic of the carbonyl ligands. Nature. In press. [DOI] [PubMed] [Google Scholar]
- Parak, F., and E.W. Knapp. 1984. A consistent picture of protein dynamics. Proc. Natl. Acad. Sci. USA. 81:7088–7092. [DOI] [PMC free article] [PubMed] [Google Scholar]
- Partenskii, M.B., and P.C. Jordan. 1992. Nonlinear dielectric behavior of water in transmembrane ion channels: ion energy barriers and the channel dielectric constant. J. Phys. Chem. 96:3906–3910. [Google Scholar]
- Perutz, M.F., and F.S. Mathews. 1966. An x-ray study of azide methaemoglobin. J. Mol. Biol. 21:199–202. [DOI] [PubMed] [Google Scholar]
- Pitera, J.W., M. Falta, and W.F. van Gunsteren. 2001. Dielectric properties of proteins from simulation: the effects of solvent, ligands, pH, and temperature. Biophys. J. 80:2546–2555. [DOI] [PMC free article] [PubMed] [Google Scholar]
- Ringe, D., and G.A. Petsko. 1986. Study of protein dynamics by X-ray diffraction. Methods Enzymol. 131:389–433. [DOI] [PubMed] [Google Scholar]
- Rosenberg, P.A., and A. Finkelstein. 1978. Water permeability of gramicidin A-treated lipid bilayer membranes. J. Gen. Physiol. 72:341–350. [DOI] [PMC free article] [PubMed] [Google Scholar]
- Roux, B. 2002. Computational studies of the gramicidin channel. Acc. Chem. Res. 35:366–375. [DOI] [PubMed] [Google Scholar]
- Roux, B., and M. Karplus. 1991. Ion transport in a model gramicidin channel. Structure and thermodynamics. Biophys. J. 59:961–981. [DOI] [PMC free article] [PubMed] [Google Scholar]
- Roux, B., T.W. Allen, W. Bernèche, and W. Im. 2004. Theoretical and computational models of biological ion channels. Q. Rev. Biophys. 37:15–103. [DOI] [PubMed] [Google Scholar]
- Schutz, C.N., and A. Warshel. 2001. What are the dielectric “constants” of proteins and how to validate electrostatic models? Proteins. 44:400–417. [DOI] [PubMed] [Google Scholar]
- Shrivastava, I.H., and M.S. Sansom. 2000. Simulations of ion permeation through a potassium channel: molecular dynamics of KcsA in a phospholipid bilayer. Biophys. J. 78:557–570. [DOI] [PMC free article] [PubMed] [Google Scholar]
- Simonson, T., and C.L. Brooks III. 1996. Charge screening and the dielectric constant of proteins: insights from molecular dynamics. J. Am. Chem. Soc. 118:8452–8458. [Google Scholar]
- Sitkoff, D., K.A. Sharp, and B. Honig. 1994. Accurate calculation of hydration free energies using macroscopic solvent models. J. Phys. Chem. 98:1978–1988. [Google Scholar]
- Takano, T. 1977. Structure of myoglobin refined at 2.0 Å resolution. I. Crystallographic refinement of metmyoglobin from sperm whale. J. Mol. Biol. 110:537–568. [DOI] [PubMed] [Google Scholar]
- Tian, F., K.C. Lee, W. Hu, and T.A. Cross. 1996. Monovalent cation transport: lack of structural deformation upon cation binding. Biochemistry. 35:11959–11966. [DOI] [PubMed] [Google Scholar]
- Townsley, L.E., W.A. Tucker, S. Sham, and J.F. Hinton. 2001. Structures of gramicidins A, B, and C incorporated into sodium dodecyl sulfate micelles. Biochemistry. 40:11676–11686. [DOI] [PubMed] [Google Scholar]
- Tredgold, R.H., and P.N. Hole. 1976. Dielectric behaviour of dry synthetic polypeptides. Biochim. Biophys. Acta. 443:137–142. [DOI] [PubMed] [Google Scholar]
- Woolf, T.B., and B. Roux. 1996. Structure, energetics, and dynamics of lipid-protein interactions: a molecular dynamics study of the gramicidin A channel in a DMPC bilayer. Proteins. 24:92–114. [DOI] [PubMed] [Google Scholar]
- Yamashita, M.M., L. Wesson, G. Eisenman, and D. Eisenberg. 1990. Where metal ions bind in proteins. Proc. Natl. Acad. Sci. USA. 87:5648–5652. [DOI] [PMC free article] [PubMed] [Google Scholar]
- Yellen, G. 2002. The voltage-gated potassium channels and their relatives. Nature. 419:35–42. [DOI] [PubMed] [Google Scholar]
- Zaccai, G. 2000. How soft is a protein? A protein dynamics force constant measured by neutron scattering. Science. 288:1604–1607. [DOI] [PubMed] [Google Scholar]
- Zhou, Y., J.H. Morais-Cabral, A. Kaufman, and R. MacKinnon. 2001. Chemistry of ion coordination and hydration revealed by a K+ channel-Fab complex at 2.0 Å resolution. Nature. 414:43–48. [DOI] [PubMed] [Google Scholar]