Abstract
We have applied in situ atomic force microscopy to directly observe the aggregation of Alzheimer’s β-amyloid peptide (Aβ) in contact with two model solid surfaces: hydrophilic mica and hydrophobic graphite. The time course of aggregation was followed by continuous imaging of surfaces remaining in contact with 10–500 μM solutions of Aβ in PBS (pH 7.4). Visualization of fragile nanoscale aggregates of Aβ was made possible by the application of a tapping mode of imaging, which minimizes the lateral forces between the probe tip and the sample. The size and the shape of Aβ aggregates, as well as the kinetics of their formation, exhibited pronounced dependence on the physicochemical nature of the surface. On hydrophilic mica, Aβ formed particulate, pseudomicellar aggregates, which at higher Aβ concentration had the tendency to form linear assemblies, reminiscent of protofibrillar species described recently in the literature. In contrast, on hydrophobic graphite Aβ formed uniform, elongated sheets. The dimensions of those sheets were consistent with the dimensions of β-sheets with extended peptide chains perpendicular to the long axis of the aggregate. The sheets of Aβ were oriented along three directions at 120° to each other, resembling the crystallographic symmetry of a graphite surface. Such substrate-templated self-assembly may be the distinguishing feature of β-sheets in comparison with α-helices. These studies show that in situ atomic force microscopy enables direct assessment of amyloid aggregation in physiological fluids and suggest that Aβ fibril formation may be driven by interactions at the interface of aqueous solutions and hydrophobic substrates, as occurs in membranes and lipoprotein particles in vivo.
An increasing amount of evidence points to abnormal protein folding and aggregation as a general mechanism behind a diverse group of disorders such as Alzheimer’s disease (1–5), Huntington’s disease (6), prion diseases (1–3, 5, 7, 8), and amyloidoses (9). It has been proposed recently to include such diseases as conformational diseases in the classification of disorders based on their pathology (10). A common feature of most conformational diseases is conversion of soluble proteins into insoluble quaternary structures with extensive β-sheet content (10–13). Involvement of β-sheets in pathological processes adds to the urgency of achieving a deeper understanding of the physiological and physicochemical aspects of their formation. Although β-sheets constitute a second major structural element in globular proteins, their folding mechanism is poorly understood in comparison with that of α-helices. There are indications that conversion of water-soluble, mainly α-helical species into insoluble β-sheet-rich structures is facilitated by environmental factors, one example being partially denaturing conditions (12, 13). It can be expected that, because of the highly nonlocal character of interactions in β-sheets, their formation should be fundamentally different from α-helices (14). However, recent studies failed to reveal any fundamental differences between folding kinetics of the two structural forms (11).
Herein, we present the results of direct observations that point to a unique feature of β-sheet formation, i.e., the possibility of its induction through interactions with a hydrophobic solid surface. In our study, we focused on β-amyloid (Aβ). Aβ is a 39- to 43-residue peptide (Fig. 1) that is a product of cleavage of a larger (677–770 amino acids) membrane protein, referred to as the amyloid precursor protein (15).
Figure 1.
The sequence of Aβ peptide.
Aβ is found in body fluids in a soluble form (16), which is partially α-helical (12, 17). In Alzheimer’s disease, Aβ undergoes conformational change and deposits in the extracellular space of the brain and in walls of cerebral blood vessels as amyloid plaques (1). Although the causative role of Aβ deposition in amyloid deposits in Alzheimer’s disease has not been definitively established, a significant amount of evidence suggests that Aβ deposition is in some way central to Alzheimer’s disease pathogenesis. Thus, there have been considerable efforts to understand the mechanism leading to Aβ deposition (1, 18). The primary motivation of these efforts is the expectation that they may aid in the development of a treatment of Alzheimer’s disease based on inhibition of amyloid formation (19–21). Extensive x-ray diffraction and electron microscopy studies revealed that Aβ forms characteristic, β-sheet-rich fibrils, 6–8 nm in diameter, in which the direction of peptide chains is perpendicular to the axis of a fibril (22–24). Interestingly, this type of structure is often adopted by other amyloids, despite the absence of significant homology (12, 13). So far, physicochemical studies of Aβ aggregation have relied primarily on the quantitation of the soluble or insoluble fraction as a function of time (18). Such studies pointed to the importance of nucleation in the formation of amyloid fibrils. Aggregation in the presence of preformed fibrils or plaques followed first-order kinetics, which has been interpreted as an indication that growth proceeded by consecutive association of Aβ onto the ends of existing fibrils (25–27). Conversely, in the absence of preformed substrates, the aggregation occurred only after an incubation time and exhibited higher order kinetics, suggesting a nucleation-dependent mechanism (1, 28, 29).
Additional insights were provided recently by ex situ atomic force microscopy (AFM) observations of species isolated from solutions of Aβ incubated for different times (30). The species isolated at the early stages of aggregation were characterized as protofibrillar aggregates, 20–70 nm in length and ≈3 nm in diameter. Such aggregates disappeared abruptly from the samples isolated after longer incubation times; instead, amyloid fibrils with various discrete morphologies were observed. More recent results (31) indicated that such transition of protofibrils to fibrils could be seeded by preformed protofibrils.
Previous work focused predominantly on the ex situ structural studies of Aβ aggregates and on the overall kinetics of their formation in solution (18). Such “free solution” conditions constitute a far departure from physiological environments, where the course of processes is largely dictated by interfacial phenomena (most notably hydrophobic effects). In contrast, the present study represents a successful attempt to observe directly the structure of aggregates forming in situ in contact with model surfaces. In this study we used AFM to observe in situ the deposition of Aβ on two model surfaces of opposite physicochemical character: hydrophilic mica and hydrophobic graphite. The 42-residue version of a peptide, Aβ-(1–42) was chosen for this study because it is known to form fibrils faster than a 40-residue version (28, 29). Mica and graphite have been traditionally the substrates of choice for AFM studies because they can be easily cleaved to produce clean, atomically smooth surfaces. In solution, the surface of mica bears negative charge, and as such, it can be considered a model of surfaces of cell membranes composed predominantly of anionic phospholipids. The hydrophobic graphite may be viewed as a model substrate corresponding to the interior of lipid bilayers and lipoprotein particles, a location in which Aβ has been shown to localize in both plasma and cerebrospinal fluid in vivo (32, 33). In our work, we took advantage of a unique ability of AFM, i.e., its ability to produce nanoscale-resolution images of surfaces immersed under liquids (34). Noninvasive AFM imaging of weakly adsorbed species became possible only recently with the introduction of the so-called tapping mode of operation, which virtually eliminates the lateral forces between the probe tip and the sample (35–37).
MATERIALS AND METHODS
Sample Preparation.
Aβ(1–42) was purchased as a lyophilized solid from K-biologicals (Rancho Cucamonga, CA) as well as from U.S. Peptide (Fullerton, CA). Mica was purchased from New York Mica Company; highly oriented pyrolitic graphite (ZYB grade) was purchased from Advanced Ceramics (Lakewood, OH). Aqueous solutions of Aβ(1–42), were prepared by diluting an 8 mM solution in DMSO into PBS (pH 7.4) and then Vortex mixing for 60 s. Solutions in a concentration range from 10 to 500 μM were prepared and imaged after incubation at room temperatures for periods ranging from a few minutes to 120 h. Dry samples for ex situ imaging were prepared by placing 1 μl of a previously stirred solution on freshly cleaved mica, washing it with 200 μl of ultrapure water, and drying under a stream of nitrogen.
AFM Imaging Conditions.
AFM observations were carried out with the aid of Nanoscope III-M system (Digital Instruments, Santa Barbara CA), equipped with a vertical-engage J scanner. Ex situ imaging of dry samples was performed under the atmosphere of dry helium with standard silicon TESP cantilevers (nominal spring constant, 50 N/m; resonance frequency, ≈300 kHz) with cantilever oscillation amplitude not exceeding 10 nm, to further minimize the tip–sample interactions. In situ tapping mode imaging under buffer was performed by using a standard contact mode fluid cell and 100-mm, wide-legged silicon nitride cantilevers (nominal spring constant, 0.58 N/m). The cantilever was oscillated by applying a sinusoidal voltage across the Z direction of a scanner, which required minor modification of an instrument, performed according to the instructions from the manufacturer. Best imaging results were obtained in the frequency range corresponding to a broad maximum of cantilever oscillation amplitude centered around 8–9 kHz; similar observations were published recently by other groups (38, 39). Imaging was carried out with the typical value of a signal corresponding to cantilever oscillation between 0.05 and 0.2 V, with set points corresponding to more than 90% of free oscillation amplitude; the values of proportional and integral gains were equal respectively to 0.3 and 2 (arbitrary units used by Nanoscope software), typical scan frequencies were between 1 and 4 Hz, and the original images were sampled at the resolution of 512 × 512 points. In all presented figures, the height was color coded, with lighter tones corresponding to taller features.
Quantitative Analysis of AFM Images.
Size distributions and total volume of particulate aggregates of Aβ on mica were determined with the aid of a custom-written computer program, capable of automatically identifying individual particles by thresholding and edge detection. Objects with volumes of less than 500 nm3 were ignored because of the high incidence of noisy features below this size in the AFM images of highly mobile, pseudomicellar aggregates. The height of sheets of Aβ on graphite was determined with bearing or section analysis routines of the Nanoscope image analysis package. The total area occupied by the sheets on graphite was determined with the aid of an image tool package (http://ddsdx.uthscsa.edu/). The volume measurements were not corrected to take into account the finite size of an AFM tip.
RESULTS AND DISCUSSION
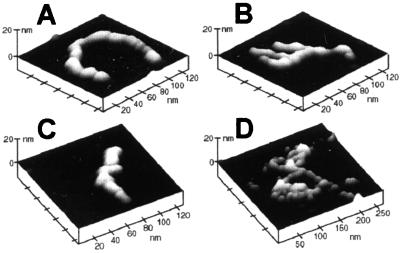
Tapping mode AFM imaging of dry samples prepared a few hours after dissolution of Aβ in PBS revealed the presence of protofibrillar linear and branched aggregates such as those shown in Fig. 2.
Figure 2.
Ex situ tapping mode AFM images of individual protofibrillar aggregates of Aβ(1–42) deposited on mica. The height in these and all subsequent images was color coded, with lighter tones corresponding to taller features.
The aggregates exhibited a wide variety of shapes, ranging from linear assemblies (Fig. 2 A and C) to forms with different extents of branching (Fig. 2 B and D). The height of the aggregates rarely exceeded 5 nm, and their apparent width was typically between 10 and 15 nm (this value is overestimated by at least 5 nm because of the contribution from the finite radius of the AFM tip). The length of linear aggregates typically did not exceed 100 nm. All aggregates had a characteristic domain texture, suggesting that they were formed by association of smaller, globular, or ellipsoidal species. Similar protofibrillar species of Aβ, occurring at the early stages of aggregation, were described recently (30, 31).
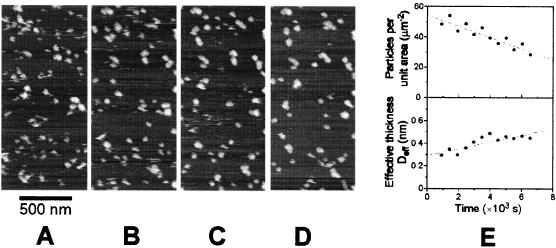
When a 10 μM solution of Aβ(1–42) was initially brought into contact with the surface of freshly cleaved mica, in situ AFM imaging revealed the presence of only nonfibrillar, globular aggregates such as those shown in Fig. 3 A–D.
Figure 3.
Aggregation of Aβ on mica. (A–D) Tapping mode AFM images acquired in situ in a 10 μM solution of Aβ in PBS. The images correspond to the same area of mica and were digitally zoomed-in from 3- × 3-μm datasets. The images were aligned with respect to the features located in the upper left corner as well as with respect to additional reference points located outside the zoomed-in field of view. Nanoparticulate aggregates of Aβ appeared on the surface almost immediately after immersion in solution. They behaved as nanodroplets of a substance poorly wetting the substrate, exhibiting marked lateral mobility and a tendency to coalesce. The time interval between the images was 2,048 s. (E) Results of quantitative analysis of aggregation. As a function of time the number of particles per unit area decreased (top), whereas the volume of material deposited per unit area, i.e., the effective thickness Deff increased (bottom). Such behavior indicates the coalescence of nanodroplets. The analysis was performed on a 4.5-μm2 area of original 3- × 3-μm images.
The aggregates appeared on the surface within the first few minutes after submersion and exhibited considerable lateral mobility (Fig. 3 A–D). The nanodroplets of Aβ were easily displaced by the AFM probe. To prevent this effect, the AFM had to be operated at extremely low “free” cantilever amplitudes, not exceeding 20 mV (noncalibrated value of a signal). Quantitative analysis of AFM images revealed that, during the observation period, the total volume of aggregates per unit area increased slowly with time (Fig. 3E, bottom), whereas the number of aggregates per unit area markedly decreased (Fig. 3E, top). These two observations indicate that, after appearing rapidly on the surface of mica, the aggregates were undergoing slow coalescence. As a result of this process, their average apparent volume increased from ≈1.0 × 10⁴ to ≈1.6 × 10⁴ nm3. Distributions of the apparent volume of aggregates were highly skewed toward the larger sizes (data not shown). In all cases, there was a significant population of aggregates with volumes of less than 1,000 nm3. With time, the upper boundary of volume distributions increased from ≈2 × 10⁴ to ≈4 × 10⁴ nm3. The average height of aggregates remained in the range of 5–6 nm.
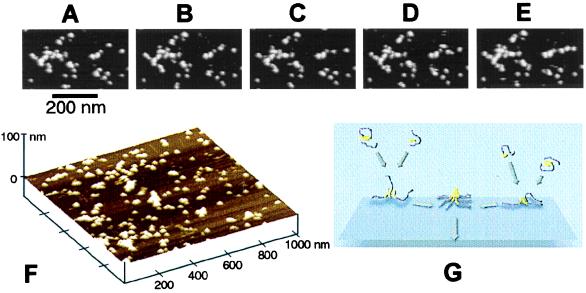
The shape and size of globular aggregates forming on mica resembled the size and shape of individual domains in protofibrillar species isolated from Aβ solutions after a short incubation (Fig. 2). This observation supports the hypothesis that protofibrils were formed through the association of globular species. Although such an association was not apparent in 10 μM solutions of Aβ within the time scale of our in situ AFM observations (up to 2 h), it was readily observed in experiments with much higher concentrations of Aβ (500 μM), as shown in Fig. 4 A–F.
Figure 4.
In situ tapping mode AFM images of aggregation of Aβ in contact with mica at high peptide concentration (500 μM). All images were digitally zoomed in from a 3- × 3-μm scan. (A–E) Time course of the process of assembly of globular aggregates into a linear protofibril located on the right side of an image. Notice that the branched protofibrillar assembly located on the left side remained mostly static over the same period. The time interval between the images was 256 s. (F) Three-dimensional rendering of the surface of mica covered with globular and protofibrillar aggregates of Aβ. (G) Schematic of the proposed mechanism of the early stages of formation of pseudomicellar aggregates of an amphipathic peptide on a hydrophilic substrate. (The hydrophilic and hydrophobic portions of peptide chains are colored, respectively, in purple and in yellow.)
The flattened globular shape of Aβ aggregates forming on mica, their high lateral mobility, and the tendency to coalesce, without spreading, all resemble the behavior of liquid droplets on a poorly wettable surface. Such behavior of Aβ when adsorbed on mica can be rationalized by the amphipathic character of the peptide. The affinity of Aβ toward the lightly anionic surface of mica is undoubtedly driven by lysines, histidines, and arginine located in the hydrophilic block (residues 1–29). Because contact of a hydrophobic block with the surface of mica is unfavorable energetically, a compromise is reached by formation of drop-like, pseudomicellar species (Fig. 4G). Although most of the past studies of Aβ were focused on fibrillar aggregates, the occurrence of oligomeric and micellar forms of Aβ in an aqueous environment (and their potential neurotoxicity) have been discussed recently by several authors (40–43). Our results indicate that anionic, hydrophilic surfaces, such as cell membrane surfaces, may induce the formation of such aggregates.
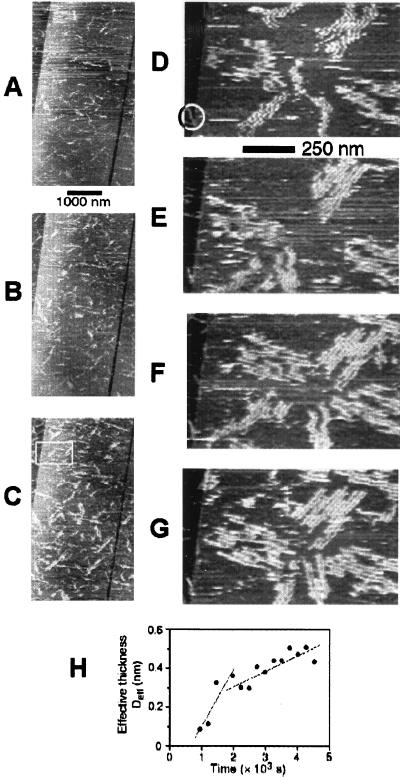
Aggregates of Aβ forming in contact with graphite were markedly different (Fig. 5). After a solution of Aβ was placed in contact with graphite, the surface became covered within several minutes with numerous aggregates with a characteristic narrow, elongated appearance. (Fig. 5 A–C).
Figure 5.
Aggregation of Aβ on graphite observed with in situ tapping mode AFM in a 10 μM solution of Aβ(1–42) in PBS. (A–C) The first phase of aggregation i.e., rapid appearance of highly elongated, narrow, sheet-like aggregates. The images were digitally zoomed in from 10- × 10-μm consecutive original scans; the time interval between the images is equal to 256 s. (D–G) The second phase of aggregation i.e., formation of parallel assemblies of sheets. The images correspond to the area marked with a rectangle in C. The images were digitally zoomed in from 4- × 4-μm original scans and were aligned with respect to the feature marked with a circle in D; the time interval between the images is equal to 512 s. (H) Quantitative analysis of aggregation. The effective thickness of adsorbed material, Deff, is shown as a function of time. Notice the presence of an incubation time and two regimes of growth.
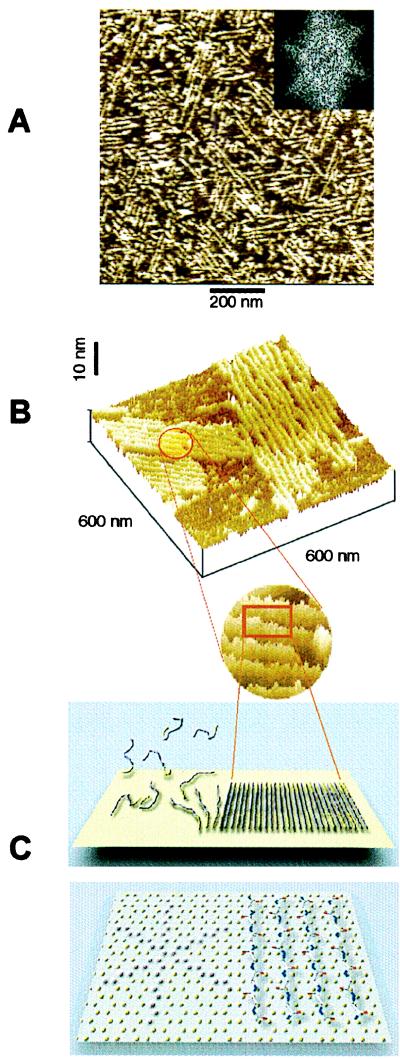
Because the height of these aggregates barely exceeded 1 nm, they can be best characterized as narrow elongated sheets. The narrow sheets tended to form in the vicinity of each other, leading to the appearance and growth of larger assemblies, in which the sheets remained parallel to each other (Fig. 5 D–G). Formation of aggregates proceeded in two distinct phases, as reflected in the kinetics of deposition of Aβ on graphite (Fig. 5H). After an incubation period of ≈1,000 s, the effective thickness of adsorbed material increased rapidly for another 1,000 s and continued to grow at a reduced rate. Such behavior and a tendency of the elongated aggregates to form the assemblies of parallel sheets are consistent with a nucleation-controlled growth. Interestingly, the assemblies of sheets were oriented preferentially along three directions at 120° to one another (Fig. 6).
Figure 6.
(A) An example of preferential orientation of sheet-like aggregates of Aβ and their assemblies forming on graphite. The orientation of aggregates along the three directions at 120° to one another is reflected in the characteristic 6-fold symmetry of the two-dimensional Fourier transform of the image (Inset). The average lateral spacing between the sheets, determined from the radial position of spots in Fourier transform patterns of images from different experiments, was equal to 18.8 ± 1.8 nm. (B) Higher magnification view of two assemblies of Aβ aggregates on graphite (top) and a schematic model illustrating the orientation of peptide chains in the aggregates based on their dimensions (bottom). The height of the aggregates above the graphite surface, measured from their profiles ranged from 1.0 to 1.2 nm. Dimensions of Aβ aggregates on graphite provide a strong indication that they have a β-sheet character, with peptide chains perpendicular to the aggregate long axis. (C) The properly scaled model of peptide backbones in an antiparallel β-sheet arrangement, superimposed on the crystal structure of graphite surface. We propose that the orientation of Aβ aggregates on graphite is driven by a hydrophobic effect and reflects an attempt of the peptide chains to cover the rows of the most densely packed carbon atoms (highlighted in the left portion of the drawing).
Formation of elongated, narrow sheets of Aβ on graphite and their characteristic orientation were observed consistently in numerous independent experiments. Whereas the average length of sheets varied from one sample preparation to another, they always exhibited the characteristic orientation along three preferred directions, which was reflected in the characteristic 6-fold symmetry of the two-dimensional Fourier transforms of the images (Fig. 6A Inset). The average lateral spacing between the sheets, determined from the radial position of spots in Fourier transform patterns of images from different experiments, was equal to 18.8 ± 1.8 nm. In comparison, the expected length of a fully extended 42-residue peptide, based on the 0.695-nm distance between Cαi and Cαi+2 carbons in a β-pleated sheet (44), is equal to ≈15 nm. The height of the sheets, measured from the tallest point to the graphite substrate, ranged from 1.0 to 1.2 nm. X-ray diffraction studies indicate that face-to-face separation of β-sheets in amyloid fibers is typically equal to ≈1 nm (24). Comparison of the dimension of aggregates of Aβ forming on graphite with the expected dimensions of a β-sheet provides a strong indication that the elongated aggregates indeed correspond to single β-sheets (parallel or antiparallel) with fully extended peptide chains perpendicular to the long axis of the aggregate (Fig. 6B).
Preferential ordering of β-sheets on the surface of graphite resembles epitaxy, i.e., the effect of oriented growth of a guest crystal on the surface of a host crystal of another phase. Oriented growth is caused by the structural analogy between the planes of contact of two species (45). A relevant example of epitaxial orientation of molecular species is the orientation of alkane chains on graphite, observed commonly with scanning tunneling microscopy (46, 47). Superposition of the model of antiparallel β-sheet with the structure of graphite surface (Fig. 6C) suggests the presence of some commensurability between both structures (a similar observation is true for a parallel β-sheet). However, the exact structural match cannot be invoked to explain the observed orientation of β-sheets, because the β-sheet surface consists of a variety of residues of different sizes and shapes. The more likely explanation involves the anisotropy of intermolecular forces associated with the crystal structure of graphite, in particular, the anisotropy of hydrophobic interactions. For example, the orientation of peptide chains such as indicated in Fig. 6C facilitates the maximum contact between the hydrophobic rows of carbon atoms on graphite and hydrophobic residues along the extended peptide chains. Similar interactions between Aβ and hydrophobic surfaces may be important under physiological conditions within membranes and within lipoprotein particles because a significant amount of soluble Aβ is localized to lipoproteins in both plasma and the cerebrospinal fluid (32, 33).
The results of this study point to the need of focusing physicochemical studies of the aggregation of Aβ on the nature of surfaces (interfaces) present in the environment and illustrate the suitability of solution AFM for such studies. We expect that in situ AFM studies of Aβ aggregation from this perspective will be especially useful in evaluating and elucidating the role of cosolutes, such as metal ions (48, 49), apolipoproteins (41, 50–54), and “β-sheet breakers” (20, 21). Our direct observation of the formation of β-sheets of Aβ on graphite has more general implications. We believe that it illustrates the fundamental difference between the formation of β-sheets and α-helices. The essence of this difference is that the formation of β-sheets is dominated by intermolecular (or nonlocal) interactions and bears some resemblance to the crystallization of linear (macro)molecules. Further study of β-sheet formation from this perspective may provide important, general insights into the mechanism of protein folding, with particular impact in the area dedicated to “conformational diseases.” It may also result in applications in materials science, because the substrate-directed assembly of specifically tailored peptides can be envisioned as an approach to generation of functional nanostructures.
Acknowledgments
This work was supported by National Institutes of Health Grants P50AG05681 and GM51554 (to T.K.) and AG13956 and AG05681 (to D.M.H) and a Paul Beeson Physician Faculty Scholar Award from the American Federation for Aging Research (to D.M.H.).
ABBREVIATIONS
- Aβ
β-amyloid
- AFM
atomic force microscopy
References
- 1.Lansbury P T., Jr Acc Chem Res. 1996;29:317–321. [Google Scholar]
- 2.Selkoe D. Science. 1997;275:630–631. doi: 10.1126/science.275.5300.630. [DOI] [PubMed] [Google Scholar]
- 3.Yankner B. Neuron. 1996;16:921–932. doi: 10.1016/s0896-6273(00)80115-4. [DOI] [PubMed] [Google Scholar]
- 4.Wisniewski T, Ghiso J, Frangione B. Neurobiol Dis. 1997;4:313–328. doi: 10.1006/nbdi.1997.0147. [DOI] [PubMed] [Google Scholar]
- 5.Geula C, Wu C-K, Saroff D, Lorenzo A, Yuan M, Yankner B A. Nat Med. 1998;4:827–832. doi: 10.1038/nm0798-827. [DOI] [PubMed] [Google Scholar]
- 6.Perutz M. Curr Opin Struct Biol. 1996;6:848–858. doi: 10.1016/s0959-440x(96)80016-9. [DOI] [PubMed] [Google Scholar]
- 7.Prusiner S. Trends Biochem Sci. 1996;21:482–487. doi: 10.1016/s0968-0004(96)10063-3. [DOI] [PubMed] [Google Scholar]
- 8.Prusiner S. Science. 1997;278:245–251. doi: 10.1126/science.278.5336.245. [DOI] [PubMed] [Google Scholar]
- 9.Sipe J. Annu Rev Biochem. 1992;61:947–975. doi: 10.1146/annurev.bi.61.070192.004503. [DOI] [PubMed] [Google Scholar]
- 10.Carrell R, Lomas D. Lancet. 1997;350:134–138. doi: 10.1016/S0140-6736(97)02073-4. [DOI] [PubMed] [Google Scholar]
- 11.Capaldi A P, Radford S E. Curr Opin Struct Biol. 1998;8:86–92. doi: 10.1016/s0959-440x(98)80014-6. [DOI] [PubMed] [Google Scholar]
- 12.Kelly J W. Curr Opin Struct Biol. 1998;8:101–106. doi: 10.1016/s0959-440x(98)80016-x. [DOI] [PubMed] [Google Scholar]
- 13.Kelly J. Proc Natl Acad Sci USA. 1998;95:930–932. doi: 10.1073/pnas.95.3.930. [DOI] [PMC free article] [PubMed] [Google Scholar]
- 14.Finkelstein A. Proteins. 1991;9:23–27. doi: 10.1002/prot.340090104. [DOI] [PubMed] [Google Scholar]
- 15.Selkoe D. Trends Neurosci. 1993;16:403–409. doi: 10.1016/0166-2236(93)90008-a. [DOI] [PubMed] [Google Scholar]
- 16.Golde T E, Cai X D, Shoji M, Younkin S G. Ann NY Acad Sci. 1993;695:103–108. doi: 10.1111/j.1749-6632.1993.tb23036.x. [DOI] [PubMed] [Google Scholar]
- 17.Smith M A. Int Rev Neurobiol. 1998;42:1–54. doi: 10.1016/s0074-7742(08)60607-8. [DOI] [PubMed] [Google Scholar]
- 18.Maggio J E, Mantyh P W. Brain Pathol. 1996;6:147–162. doi: 10.1111/j.1750-3639.1996.tb00797.x. [DOI] [PubMed] [Google Scholar]
- 19.Kisilevsky R. Drugs Aging. 1996;8:75–83. doi: 10.2165/00002512-199608020-00001. [DOI] [PubMed] [Google Scholar]
- 20.Ghanta J, Shen C L, Kiessling L L, Murphy R M. J Biol Chem. 1996;271:29525–29528. doi: 10.1074/jbc.271.47.29525. [DOI] [PubMed] [Google Scholar]
- 21.Soto C, Sigurdsson E M, Morelli L, Kumar R A, Castaño E M, Frangione B. Nat Med. 1998;4:822–827. doi: 10.1038/nm0798-822. [DOI] [PubMed] [Google Scholar]
- 22.Inouye H, Fraser P, Kirschner D. Biophys J. 1993;64:502–519. doi: 10.1016/S0006-3495(93)81393-6. [DOI] [PMC free article] [PubMed] [Google Scholar]
- 23.Sunde M, Serpell L, Bartlam M, Fraser P, Pepys M, Blake C. J Mol Biol. 1997;273:729–739. doi: 10.1006/jmbi.1997.1348. [DOI] [PubMed] [Google Scholar]
- 24.Sunde M, Blake C. Adv Protein Chem. 1997;50:123–159. doi: 10.1016/s0065-3233(08)60320-4. [DOI] [PubMed] [Google Scholar]
- 25.Esler W, Stimson E, Ghilardi J, Vinters H, Lee J, Mantyh P, Maggio J. Biochemistry. 1996;35:749–757. doi: 10.1021/bi951685w. [DOI] [PubMed] [Google Scholar]
- 26.Maggio J, Stimson E, Ghilardi J, Allen C, Dahl C, Whitcomb D, Vigna S, Vinters H, Labenski M, Mantyh P. Proc Natl Acad Sci USA. 1992;89:5462–5466. doi: 10.1073/pnas.89.12.5462. [DOI] [PMC free article] [PubMed] [Google Scholar]
- 27.Naiki H, Nakakuki K. Lab Invest. 1996;74:374–383. [PubMed] [Google Scholar]
- 28.Jarrett J T, Berger E P, Lansbury P T. Biochemistry. 1993;32:4693–4697. doi: 10.1021/bi00069a001. [DOI] [PubMed] [Google Scholar]
- 29.Cai X D, Golde T E, Younkin S G. Science. 1993;259:514–516. doi: 10.1126/science.8424174. [DOI] [PubMed] [Google Scholar]
- 30.Harper J D, Wong S S, Lieber C M, Lansbury P T. Chem Biol. 1997;4:119–125. doi: 10.1016/s1074-5521(97)90255-6. [DOI] [PubMed] [Google Scholar]
- 31.Harper J D, Lieber C M, Lansbury P T. Chem Biol. 1997;4:951–959. doi: 10.1016/s1074-5521(97)90303-3. [DOI] [PubMed] [Google Scholar]
- 32.Biere A L, Ostaszewski B, Stimson E R, Hyman B T, Maggio J E, Selkoe D J. J Biol Chem. 1996;271:32916–32922. doi: 10.1074/jbc.271.51.32916. [DOI] [PubMed] [Google Scholar]
- 33.Koudinov A R, Koudinova N V, Kumar A, Beavis R C, Ghiso J. Biochem Biophys Res Commun. 1996;223:592–597. doi: 10.1006/bbrc.1996.0940. [DOI] [PubMed] [Google Scholar]
- 34.Bustamante C, Rivetti C, Keller D. Curr Opin Struct Biol. 1997;7:709–716. doi: 10.1016/s0959-440x(97)80082-6. [DOI] [PubMed] [Google Scholar]
- 35.Zhong Q, Inniss D, Kjoller K, Elings V B. Surface Sci Lett. 1993;290:L688–L692. [Google Scholar]
- 36.Hansma P K, Cleveland J P, Radmacher M, Walters D A, Hillner P E. Appl Phys Lett. 1994;64:1738–1740. [Google Scholar]
- 37.Putman C A J, Van Der Werf K O, De Grooth B G, Van Hulst N F, Greve J. Appl Phys Lett. 1994;64:2454–2456. [Google Scholar]
- 38.Yip C, Ward M. Biophys J. 1996;71:1071–1078. doi: 10.1016/S0006-3495(96)79307-4. [DOI] [PMC free article] [PubMed] [Google Scholar]
- 39.Lyubchenko Y, Shlyakhtenko L. Proc Natl Acad Sci USA. 1997;94:496–501. doi: 10.1073/pnas.94.2.496. [DOI] [PMC free article] [PubMed] [Google Scholar]
- 40.Lomakin A, Chung D, Benedek G, Kirschner D, Teplow D. Proc Natl Acad Sci USA. 1996;93:1125–1129. doi: 10.1073/pnas.93.3.1125. [DOI] [PMC free article] [PubMed] [Google Scholar]
- 41.Oda T, Wals P, Osterburg H H, Johnson S A, Pasinetti G M, Morgan T E, Rozovsky I, Stine W B, Snyder S W, Holzman T F, et al. Exp Neurol. 1995;136:22–31. doi: 10.1006/exnr.1995.1080. [DOI] [PubMed] [Google Scholar]
- 42.Roher A E, Chaney M O, Kuo Y M, Webster S D, Stine W B, Haverkamp L J, Woods A S, Cotter R J, Tuohy J M, Krafft G A, et al. J Biol Chem. 1996;271:20631–20635. doi: 10.1074/jbc.271.34.20631. [DOI] [PubMed] [Google Scholar]
- 43.Hu J, Akama K T, Krafft G A, Chromy B A, Van Eldik L J. Brain Res. 1998;785:195–206. doi: 10.1016/s0006-8993(97)01318-8. [DOI] [PubMed] [Google Scholar]
- 44.Marsh R E, Corey R B, Pauling L. Biochim Biophys Acta. 1955;16:1–34. doi: 10.1016/0006-3002(55)90178-5. [DOI] [PubMed] [Google Scholar]
- 45.Bonev I. Acta Crystallogr A. 1972;28:508–512. [Google Scholar]
- 46.Rabe J P, Buchholz S. Science. 1991;253:424–426. doi: 10.1126/science.253.5018.424. [DOI] [PubMed] [Google Scholar]
- 47.Yeo Y H, McGonigal G C, Yackoboski K, Guo C X, Thomson D J. J Phys Chem. 1992;96:6110–6111. [Google Scholar]
- 48.Huang X, Atwood C S, Moir R D, Hartshorn M A, Vonsattel J P, Tanzi R E, Bush A I. J Biol Chem. 1997;272:26464–26470. doi: 10.1074/jbc.272.42.26464. [DOI] [PubMed] [Google Scholar]
- 49.Atwood C S, Moir R D, Huang X, Scarpa R C, Bacarra N M, Romano D M, Hartshorn M A, Tanzi R E, Bush A I. J Biol Chem. 1998;273:12817–12826. doi: 10.1074/jbc.273.21.12817. [DOI] [PubMed] [Google Scholar]
- 50.Evans K C, Berger E P, Cho C G, Weisgraber K H, Lansbury P T., Jr Proc Natl Acad Sci USA. 1995;92:763–767. doi: 10.1073/pnas.92.3.763. [DOI] [PMC free article] [PubMed] [Google Scholar]
- 51.Wood S, Chan W, Wetzel R. Chem Biol. 1996;3:949–956. doi: 10.1016/s1074-5521(96)90183-0. [DOI] [PubMed] [Google Scholar]
- 52.Chan W, Fornwald J, Brawner M, Wetzel R. Biochemistry. 1996;35:7123–7130. doi: 10.1021/bi952852v. [DOI] [PubMed] [Google Scholar]
- 53.Wood S, Chan W, Wetzel R. Biochemistry. 1996;35:12623–12628. doi: 10.1021/bi961074j. [DOI] [PubMed] [Google Scholar]
- 54.Hammad S M, Ranganathan S, Loukinova E, Twal W O, Argraves W S. J Biol Chem. 1997;272:18644–18649. doi: 10.1074/jbc.272.30.18644. [DOI] [PubMed] [Google Scholar]


