Abstract
The plant organelles database (PODB; http://podb.nibb.ac.jp/Organellome) was built to promote a comprehensive understanding of organelle dynamics, including organelle function, biogenesis, differentiation, movement and interactions with other organelles. This database consists of three individual parts, the organellome database, the functional analysis database and external links to other databases and homepages. The organellome database provides images of various plant organelles that were visualized with fluorescent and nonfluorescent probes in various tissues of several plant species at different developmental stages. The functional analysis database is a collection of protocols for plant organelle research. External links give access primarily to other databases and Web pages with information on transcriptomes and proteomes. All the data and protocols in the organellome database and the functional analysis database are populated by direct submission of experimentally determined data from plant researchers and can be freely downloaded. Our database promotes the exchange of information between plant organelle researchers for the comprehensive study of the organelle dynamics that support integrated functions in higher plants. We would also appreciate contributions of data and protocols from all plant researchers to maximize the usefulness of the database.
INTRODUCTION
Since the completion of the genomic sequencing of various plant species, including Arabidopsis (1) and rice (2,3), postgenomic approaches such as microarrays and mass spectrometry-based proteomics have been used extensively in the field of plant science, and results acquired by these high-throughput techniques are publicly accessible through various genome-wide databases. Integrative biological and genome information databases established for Arabidopsis and rice provide significant insights into genetic composition, gene expression and the prediction of protein localization (4–8). Recently, databases for individual organelles, including chloroplasts (9,10), mitochondria (11), vacuoles (12), nuclei (13), peroxisomes (14,15) and cell walls (16), have been made available to provide information on organellar proteins identified in proteomic and/or sequence-based analyses. However, these databases are limited to individual organelles and provide only still images of each organelle. It is now widely known that plant organelles dramatically change their shape, number, size and localization in cells depending on tissue type, developmental stage and environmental stimuli, and that such flexible organelle dynamics support the integrated functions of higher plants. The availability of a database that surveyed such flexible organelle dynamics would assist in the progress of plant science.
In this article, we present the plant organelles database (PODB), a database of visualized plant organelles and protocols for plant organelle research. The joint research project of ‘Organelle Differentiation as the Strategy for Environmental Adaptation in Plants’ started with a Grant-in-Aid for Scientific Research of Priority Areas to clarify the molecular mechanisms underlying the induction, differentiation and interaction of organelles and to understand the integrated function of individual plants through organelle dynamics (http://www.nibb.ac.jp/organelles/). The PODB (http://podb.nibb.ac.jp/Organellome) is a publicly available database that was built to accelerate plant organelle research as one part of this joint research project. Since its public release at the end of September 2006, this database has provided information on plant organelles that are labeled with fluorescent and/or nonfluorescent probes, as well as useful protocols for plant organelle research.
Unlike the protein localization databases available for Arabidopsis (17–20), mouse (21), Saccharomyces cerevisiae (22) and several other eukaryotic organisms (23,24), which collect annotations of the subcellular localization of proteins, the aim of the PODB is to provide information on the dynamics of plant organelles in addition to the localizations of specific proteins.
We expect that this database will be a useful tool to help researchers gain greater knowledge about plant organelles, as well as an easily accessible platform for both biologists and members of the general public who might want to explore the basics of plant cell biology.
DESIGN AND IMPLEMENTATION
The database was designed and implemented using the PHP server-side scripting language (version 4.4.4) and the Web-based Java applet on a Mac OS X server running FileMaker Server 8 Advanced (Tokyo, Japan). The database consists of a number of functionality codes written in JavaScript that interact with the tables in FileMaker Server 8 Advanced that house the data. All buttons and text areas outside of the applet were created using the PHP and XML languages.
Each datum in the results tables is hyperlinked to a flat file that displays further information and provides links to related resources, such as NCBI (http://www.ncbi.nlm.nih.gov/).
CONTENTS OF THE DATABASE
The PODB is publicly available through the Website. This database consists of three individual parts, the organellome database, the functional analysis database and a compilation of external links to other databases and homepages.
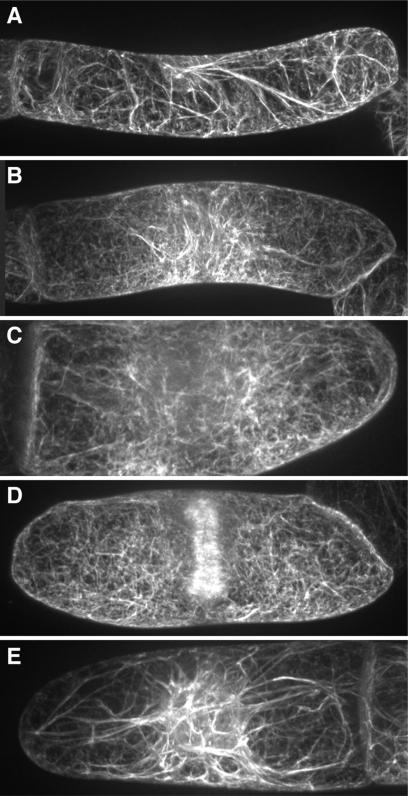
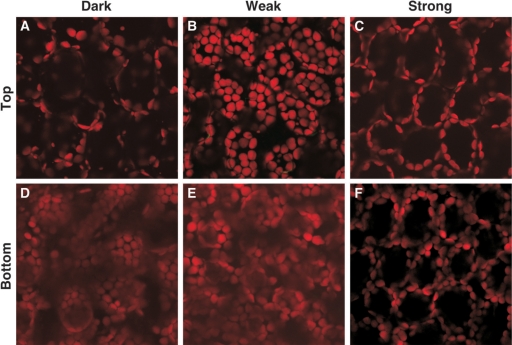
The organellome database is a searchable database of plant organelle images visualized with fluorescent and nonfluorescent probes in various tissues at different developmental stages. The term ‘organellome’ is a coined word that means the comprehensive understanding of organelle dynamics. We do not limit the term ‘organellome’ to membrane-enclosed organelles (the endoplasmic reticulum, mitochondria, chloroplasts and so on), and we accept images of all kinds of cellular compartments, including cytoskeleton components, such as microtubules and microfilaments, the plasma membrane and the cell wall. We also accept organelle images of any plant species. In contrast to several of the protein localization databases, our database has been populated by experimental data submitted directly by plant researchers, rather than by sequence-based prediction data based on primary amino acid sequences. Through the organellome database, users can easily examine the dynamics of organelles, such as movements and morphological changes, as well as protein localization at the various developmental stages. For example, our database provides a series of pictures of changes in actin filaments through the progression of the cell cycle in suspension-cultured tobacco cells (Figure 1), showing that actin filaments drastically change in shape, length, thickness, number and position (25). Another example (Figure 2) shows the positions of chloroplasts in Arabidopsis mesophyll cells in response to changes in light conditions (26,27). By comparing these images, users can grasp the sequence of photorelocation of chloroplasts: dark-adapted chloroplasts are localized on the bottom of cells (compare Figure 2A with D), chloroplasts group together near the cell surface and cell bottom in the weak-light condition (Figure 2B and E) and chloroplasts move away from the cell surface to avoid photodamage from strong light (Figure 2C and F).
Figure 1.
Different patterns of actin filaments visualized with GFP-fimbrin over the course of the cell cycle in suspension-cultured tobacco cells. Five images were drawn from the organellome database and arranged. Each image shows a different stage of the cell cycle. (A) interphase, (B) prophase, (C) metaphase, (D) telophase and (E) S phase.
Figure 2.
The positions of chloroplasts in response to changing light conditions. Six images were drawn from the organellome database and arranged. Images near the top (A–C) and the bottom (D–F) of mesophyll cells are shown. (A and D) dark condition, (B and E) weak-light condition, (C and F) strong-light condition.
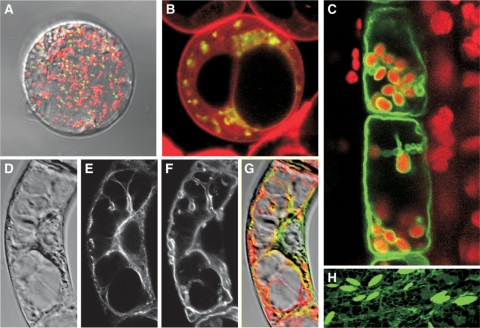
It is additionally expected that the organellome database will have great utility when researchers come across unidentified organelles, or when the localization of a protein of interest is unclear, because the organellome database will assist users by comparing their results with the deposited data. The ER-derived organelles ER bodies (Figure 3H) are a good representative of organelles that were identified by comparison of unknown structures with known images, in this case visualization of the ER using ER-targeted GFP (28). ER bodies were originally described as mystery organelles (29), but the morphology of the unidentified GFP-labeled organelles triggered their identification as ER bodies (28). Although it would be very difficult and time-consuming to search for references relevant to unidentified organelles, users can easily examine several organelles through the organellome database. For this purpose, we are now updating the organellome database for the use of image-based data mining (see the Future Plans for Database Development Section).
Figure 3.
Examples of submitted images with multiple-staining information. Each image was downloaded from the organellome database and arranged after trimming and changing sizes for consistency. (A) A merged image of the protoplast from Arabidopsis leaf cells. Green and red signals show peroxisomes and mitochondria, respectively. (B) A merged image of cultured Arabidopsis cells. Cells expressing the fusion gene GFP-SYP21 (At5g16830) were treated with FM4-64. Green and red signals represent GFP-SYP21 in the prevacuolar compartment and FM4-64 on the tonoplast, respectively. (C) A merged image of a longitudinal section of the elongation zone of the inflorescence stem from Arabidopsis. Green signals show tonoplasts visualized with GFP-gamma TIP, and red signals indicate the autofluorescence from chloroplasts. (D–G) Suspension-cultured tobacco cells expressing GFP-fimbrin were treated with FM4-64. (D) Difference interference contrast, (E) GFP-fimbrin labeling actin filaments, (F) FM4-64 labeling the tonoplast, (G) a merged image of (D–F). (H) ER and ER-derived vesicles, ER bodies, are visualized with a fusion protein of GFP and an ER-retention signal.
The functional analysis database is a collection of protocols for plant organelle research. Most laboratories have their own protocols, including tips for running the experiments effectively, which are suitable for their own research projects. Unfortunately, these protocols are scattered across the literature in research papers, books and the homepages of individual scientists. Our functional analysis database provides such protocols in one place, where users can easily find several protocols that were developed and established in different laboratories in addition to information on person(s) who are familiar with such approaches and techniques. When users want to introduce novel approaches and techniques, they can access the reference for a protocol, download protocols as PDF files (if provided), and contact submitters to obtain more detailed information. If several protocols are provided for one technique, users can compare such protocols and adopt them for their own experiments. For example, four protocols for the isolation of intact vacuoles have been deposited. One is suitable for cultured Arabidopsis cells, another two for Arabidopsis leaves and the other for suspension-cultured Catharanthus cells. Users can draw on these protocols and test the protocols in their own laboratories.
Our database also contains an external links page with links to other biological databases and homepages. The links are limited to transcriptomics and proteomics, because the microarray and mass spectrometry techniques are also endorsed as part of our joint research project. To provide our users with more comprehensive resources, links to several other databases are included in this page as well.
The PODB provides more features than other existing databases. Many plant researchers are interested in specific organelle(s) and use various plants as materials for their research. However, integrated functions in higher plants require biological and metabolic processes involving several organelles. Investigators often have to address organelles and plants that have not previously been part of their research programs. To meet this need to compare plant species, we do not restrict the species for which we accept data. Thus, the PODB contains all kinds of organelles from several plant species and can provide a good starting resource for this information.
Our database serves only to provide biological information, and does not collect, generate or distribute genetic resources such as the DNA, seeds and transgenic plants that were used to produce the data (see Data Submission section about donation). To request such genetic resources, users should contact the submitter directly; a contact person is listed in each entry.
SEARCHING THE ORGANELLOME DATABASE
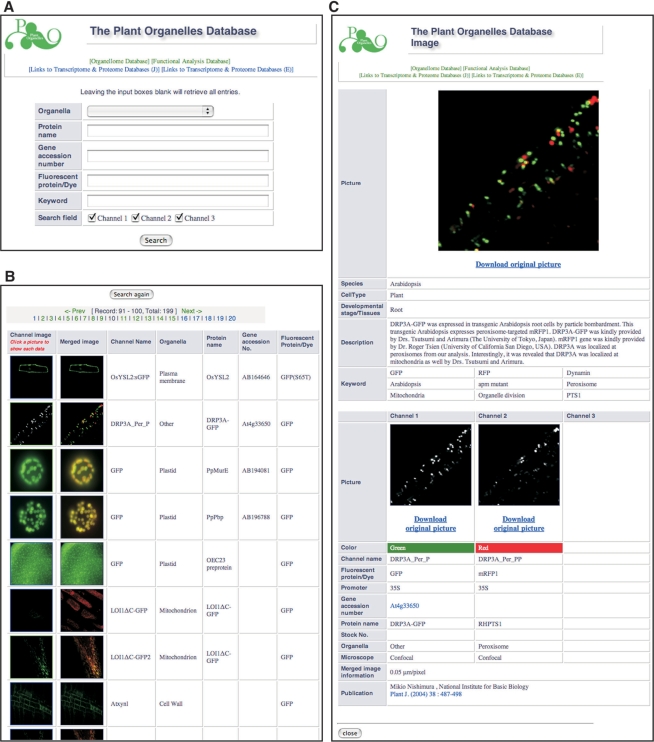
The organellome database is a fully searchable database. Users can access the ‘Search’ page by clicking on the term ‘Organellome database’ located on the homepage (http://podb.nibb.ac.jp/Organellome/) and at the top of each page in the database. From the ‘Search’ page in the organellome database (Figure 4A), users may search for specific data using five parameters for queries: organelle name, protein name, gene accession number, fluorescent probes and keywords. By combining these different search parameters, more complex searches can be performed. Leaving the input boxes empty retrieves all entries. To choose an organelle name, users must specify one organelle from the pull-down menu. Currently, the organellome database encompasses the following 18 organelles: apoplast, cell wall, endoplasmic reticulum, endosome, Golgi apparatus, microfilament, microtubule, mitochondrion, mitochondrion and plastid (for cases of dual localization), nucleus, peroxisome, plasma membrane, plastid, prevacuolar compartment, tonoplast, trans-Golgi network, vacuole and ‘other’. The term ‘other’ describes labeling of unidentified organelles. Upon requests from submitters and users, we will include additional organelle names in this pull-down menu. In addition to the specific labeling, we accept bright field and differential interference contrast images to provide important information on the positions of organelles in cells (Figure 3A, D and G). When a submitter provides double- or triple-staining data (Figure 3A–G), the information on each stain is stored individually, providing up to three channels for each image. Users can select which channel(s) to search in the ‘Search field’ on the bottom in the ‘Search’ page.
Figure 4.
The organellome database graphical user interface. (A) A search window provides five parameters for queries. Users can select an organelle name from the pull-down menu and/or enter text in the text boxes for other parameters. (B) A result window shows a table containing thumbnail images of visualized organelles as well as annotations. Clicking on the image in the left column gives access to the detailed information page. (C) Detailed information on At3g33650 is shown as a representative data page.
The entries matching the query are displayed in the ‘Search result’ page as a table with thumbnails of each channel image and a merged image and annotations of the channel name, organelle name, protein name (if provided), gene accession number (if provided) and fluorescent probe used (Figure 4B). By clicking a thumbnail image on the left, users can access the page containing the biological information (Figure 4C). The biological information on each data page has two main sections. One section, which is shown in the upper part of each data page, contains information on species, cell type, developmental stage/tissues, description, keywords and the main picture. The main picture shows a merged image when the data contains information on double or triple staining. Any comments related to the data are provided in the ‘Description’ field. The other section, which is shown in the lower part of each data page, contains each picture used to make the merged image along with information for each of these pictures on color, channel name, fluorescent probe/dye, promoter, gene accession number, protein name, stock number, organelle, type of microscope and merged image information, which gives the scale of the main picture in the upper part. The ‘Publication’ field on the bottom identifies a contact person and provides publication information relevant to the data shown. The ‘Color’ entry, which is highlighted with a colored bar, indicates what each color represents in the merged image displayed in the upper part; it does not identify the color of the fluorescent probe used for each channel. For example, when GFP-derived signals are shown in red in the merged image, the color bar is red, not green. Information on nucleotide sequences and relevant references can be obtained via links to external information resources in NCBI (http://www.ncbi.nlm.nih.gov/) when the gene accession number and/or publication information are provided. Pictures in the main image and each channel can be easily downloaded as original high-resolution image files by clicking the ‘Download original picture’ message below each image (Figure 4C).
Several experimental approaches are currently being used to visualize organelles, such as the use of a chimeric protein that joins the protein of interest with a fluorescent protein, organelle-specific dyes and indirect immunofluorescence techniques. Of the data submitted to the organellome database so far, most of the images were obtained by using chimeric proteins in which a fluorescent protein was linked to a full-length or partial organellar protein containing targeting information. Of course, the observation of autofluorescence from chlorophylls is most convenient and useful for the identification of chloroplasts, and specific dyes such as MitoTracker for Mitochondria and ER-tracker for ER are potent chemicals for staining specific organelles. In addition, bright field observations using neutral red is an effective and efficient approach to observing vacuoles in vegetative cells. The organellome database currently contains about 200 pictures using such fluorescent and nonfluorescent probes.
SEARCHING THE FUNCTIONAL ANALYSIS DATABASE
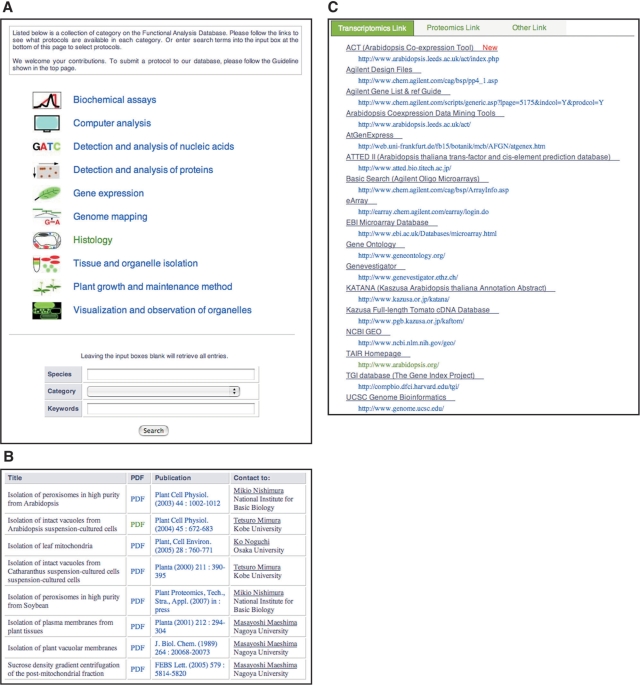
The functional analysis database offers information on protocols for plant organelle research. Like the organellome database, the functional analysis database is fully searchable. The Web interface provides 10 categories: biochemical assays, computer analysis, detection and analysis of nucleic acids, detection and analysis of proteins, gene expression, histology, genome mapping, tissue and organelle isolation, plant growth and maintenance methods and visualization and observation of organelles (upper part in Figure 5A). Users can view protocols that are classified in each category by clicking the category name on the right of each icon. In addition, the Web interface of the functional analysis database contains a ‘Search’ field providing three search parameters: the species name, category title and keywords (lower part in Figure 5A). Leaving the input boxes blank retrieves all entries. Upon requests from submitters and users, we will include additional categories.
Figure 5.
The graphical user interface for the functional analysis database and external links. (A) In the functional analysis database, protocols are classified into 10 categories. Users can show protocols in each category by clicking on the category title. In addition, users can search for data using the plant species name, category title and/or keywords in the search field on the bottom. (B) Protocols in each category are displayed as a table including links to PDF files and related references. (C) On the external links page, users can change the category by clicking on the tabs at the top.
Protocols in each category are presented as a table with annotations of title, link to PDF file, publication and name and affiliation of a contact person (Figure 5B). Publication information provides access to PubMed in NCBI (http://www.ncbi.nlm.nih.gov/). When a file containing a detailed method is provided from a submitter, users can download it as a PDF file.
USING EXTERNAL LINKS
The external links page is classified into three categories, transcriptomics links, proteomics links and other links, all arranged under tabs. Clicking on the tabs changes the content view (Figure 5C). The categorization is occasionally in disagreement with the content in some databases, because some databases are integrative and include several types of content. Upon requests from users, we will change the category of a URL and include additional links.
DATA SUBMISSION
The PODB continues to collect and post new information. As stated above, all the data and protocols in our database are populated by direct submission of experimentally determined data from plant researchers. Therefore, we welcome data submissions from plant researchers; however, there are differences in the way data should be submitted to the organellome database and the functional analysis database.
We constructed a Web-based data submission system for the organellome database. Only registered users are able to log in to the submission site using a username and password. Those who want to submit data to the organellome database must complete a one-time registration to obtain the username and password in advance. A registration form can be downloaded as an MS-Word file from the homepage (http://podb.nibb.ac.jp/Organellome/). The username, password and information about the data submission site will be issued after a submitter has sent a completed registration form to podb@nibb.ac.jp. After registration, submitters can submit their data electronically through the data submission site.
Registration is NOT required to submit information and protocols to the functional analysis database. Submitters just send the title of the method and MS-Word files containing detailed protocols (if available) directly to podb@nibb.ac.jp with a completed application form, which is available as an MS-Word file on the homepage (http://podb.nibb.ac.jp/Organellome/).
Data submission does not mean that submitted data and protocols will automatically be published to the databases. To maintain the accuracy of the data deposited, submitted data are evaluated for sufficient quality prior to addition to the database, including whether peer-refereed papers have been published that contain the submitted data, and/or whether appropriate measurements, such as double staining with organellar proteins whose localization has been characterized, are included in the submitted data. We ask the submitter to make revisions and resubmit when the submitted data and protocols are considered not to be of sufficient quality.
Corrections, revisions or updates of submitted data and protocols to the PODB can be made at any time, but users are NOT able to correct, revise or update the data by themselves. In such cases, please contact podb@nibb.ac.jp.
The database would be more useful if genetic resources such as individual lines and plasmid constructs used are available for public. We encourage the submitters to donate these genetic resources to an international stock center such as ABRC and NARC if the situation allows. When these resources are available from the stock center, please send the stock number to podb@nibb.ac.jp. A link to the stock catalog page will be added to the corresponding data page of our database.
FUTURE PLANS FOR DATABASE DEVELOPMENT
To further support plant organelle research and enhance the value of our database, we have been improving the organization and layout of the databases to facilitate the ongoing expansion of information. We are also currently working to develop the next version of this database, which will incorporate time-lapse, 3-dimensional (3D) and electron-microscopic images. These devices will enable us to cover and compile information on organelle movement and more detailed suborganellar structures that will become available with the rapid development of instruments (such as microscopes) and novel techniques. In addition, we are developing a system that allows users to perform image-based data mining to identify organelles when researchers find unidentified organelles, or when the protein localization of interest is unclear. Toward this aim, the submitter is requested to submit high-resolution images and scale information (µm/pixel).
DATABASE ACCESS
All of the data in the PODB are available at the Website (http://podb.nibb.ac.jp/Organellome) at the National Institute for Basic Biology. User support may be obtained by contacting podb@nibb.ac.jp for any problems, including all technical questions, comments, suggestions, revision and updates of data and concerns. When referencing the PODB, please cite this article.
ACKNOWLEDGEMENTS
We thank Ms Yuko Kuboki in the Department of Cell Biology and the staff in the Strategic Planning Department of the National Institute for Basic Biology for their assistance in checking English and for maintaining the Website. This work was supported by a Grant-in-Aid for Scientific Research of Priority Areas from the Japanese Ministry of Education, Sports, Culture, Science and Technology on ‘Organelle Differentiation as the Strategy for Environmental Adaptation in Plants’. Funding to pay the Open Access publication charges for this article was provided by a Grant-in-Aid for Scientific Research of Priority Areas from the Japanese Ministry of Education, Sports, Culture, Science, and Technology on ‘Organelle Differentiation as the Strategy for Environmental Adaptation in Plants’ (no.1685101).
Conflict of interest statement. None declared.
REFERENCES
- 1.Kaul S, Koo HL, Jenkins J, Rizzo M, Rooney T, Tallon LJ, Feldblyum T, Nierman W, Benito M-I, et al. Analysis of the genome sequence of the flowering plant Arabidopsis thaliana. Nature. 2000;408:796–815. doi: 10.1038/35048692. [DOI] [PubMed] [Google Scholar]
- 2.Goff SA, Ricke D, Lan T-H, Presting G, Wang R, Dunn M, Glazebrook J, Sessions A, Oeller P, et al. A draft sequence of the rice genome (Oryza sativa L. ssp. japonica) Science. 2002;296:92–100. doi: 10.1126/science.1068275. [DOI] [PubMed] [Google Scholar]
- 3.Yu J, Hu S, Wang J, Wong GK-S, Li S, Liu B, Deng Y, Dai L, Zhou Y, et al. A draft sequence of the rice genome (Oryza sativa L. ssp. indica) Science. 2002;296:79–92. doi: 10.1126/science.1068037. [DOI] [PubMed] [Google Scholar]
- 4.Schoof H, Zaccaria P, Gundlach H, Lemcke K, Rudd S, Kolesov G, Arnold R, Mewes HW, Mayer KFX. MIPS Arabidopsis thaliana database (MAtDB): an integrated biological knowledge resource based on the first complete plant genome. Nucleic Acids Res. 2002;30:91–93. doi: 10.1093/nar/30.1.91. [DOI] [PMC free article] [PubMed] [Google Scholar]
- 5.Rhee SY, Beavis W, Berardini TZ, Chen G, Dixon D, Doyle A, Garcia-Hernandez M, Huala E, Lander G, et al. The Arabidopsis Information Resource (TAIR): a model organism database providing a centralized, curated gateway to Arabidopsis biology, research materials and community. Nucleic Acids Res. 2003;31:224–228. doi: 10.1093/nar/gkg076. [DOI] [PMC free article] [PubMed] [Google Scholar]
- 6.Haas BJ, Wortman JR, Ronning CM, Hannick LI, Smith JRK, Maiti R, Chan AP, Yu C, Farzad M, et al. Complete reannotation of the Arabidopsis genome: methods, tools, protocols and the final release. BMC Biol. 2005;3:7. doi: 10.1186/1741-7007-3-7. [DOI] [PMC free article] [PubMed] [Google Scholar]
- 7.Tokimatsu T, Sakurai N, Suzuki H, Ohta H, Nishitani K, Koyama T, Umezawa T, Misawa N, Saito K, et al. KaPPA-View. A web-based analysis tool for integration of transcript and metabolite data on plant metabolic pathway maps. Plant Physiol. 2005;138:1289–1300. doi: 10.1104/pp.105.060525. [DOI] [PMC free article] [PubMed] [Google Scholar]
- 8.Kurata N, Yamazaki Y. Oryzabase. An integrated biological and genome information database for rice. Plant Physiol. 2006;140:12–17. doi: 10.1104/pp.105.063008. [DOI] [PMC free article] [PubMed] [Google Scholar]
- 9.Frisoa G, Giacomellia L, Ytterberga AJ, Peltiera J-B, Rudellaa A, Sunb Q, van Wijka KJ. In-depth analysis of the thylakoid membrane proteome of Arabidopsis thaliana chloroplasts: new proteins, new functions, and a plastid proteome database. Plant Cell. 2004;16:478–499. doi: 10.1105/tpc.017814. [DOI] [PMC free article] [PubMed] [Google Scholar]
- 10.Cui L, Veeraraghavan N, Richter A, Wall K, Jansen RK, Leebens-Mac J, Makalowska I, dePamphili CW. ChloroplastDB: the chloroplast genome database. Nucleic Acids Res. 2006;34:D692–D696. doi: 10.1093/nar/gkj055. [DOI] [PMC free article] [PubMed] [Google Scholar]
- 11.Heazlewood JL, Tonti-Filippini JS, Gout AM, Day DA, Whelan J, Millar AH. Experimental analysis of the Arabidopsis mitochondrial proteome highlights signaling and regulatory components, provides assessment of targeting prediction programs, and indicates plant-specific mitochondrial proteins. Plant Cell. 2004;16:241–256. doi: 10.1105/tpc.016055. [DOI] [PMC free article] [PubMed] [Google Scholar]
- 12.Shimaoka T, Ohnishi M, Sazuka T, Mitsuhashi N, Hara-Nishimura I, Shimazaki K-I, Maeshima M, Yokota A, Tomizawa K.-I, et al. Isolation of intact vacuoles and proteomic analysis of tonoplast from suspension-cultured cells of Arabidopsis thaliana. Plant Cell Physiol. 2004;45:672–683. doi: 10.1093/pcp/pch099. [DOI] [PubMed] [Google Scholar]
- 13.Brown JWS, Shaw PJ, Shaw P, Marshall DF. Arabidopsis nucleolar protein database (AtNoPDB) Nucleic Acids Res. 2005;33:D633–D636. doi: 10.1093/nar/gki052. [DOI] [PMC free article] [PubMed] [Google Scholar]
- 14.Reumann S, Ma C, Lemke S, Babujee L. AraPerox. A database of putative Arabidopsis proteins from plant peroxisomes. Plant Physiol. 2004;136:2587–2608. doi: 10.1104/pp.104.043695. [DOI] [PMC free article] [PubMed] [Google Scholar]
- 15.Schlüter A, Fourcade S, Domènech-Estévez E, Gabaldón T, Huerta-Cepas J, Berthommier G, Ripp R, Wanders RJA, Poch O, et al. PeroxisomeDB: a database for the peroxisomal proteome, functional genomics and disease. Nucleic Acids Res. 2007;35:D815–D822. doi: 10.1093/nar/gkl935. [DOI] [PMC free article] [PubMed] [Google Scholar]
- 16.Girke T, Lauricha J, Tran H, Keegstra K, Raikhel N. The cell wall navigator database. A systems-based approach to organism-unrestricted mining of protein families involved in cell wall metabolism. Plant Physiol. 2004;136:3003–3008. doi: 10.1104/pp.104.049965. [DOI] [PMC free article] [PubMed] [Google Scholar]
- 17.Cutler SR, Ehrhardt DW, Griffitts JS, Somerville CR. Randam GFP::cDNA fusions enable visualization of subcellular structures in cells of Arabidopsis at a high frequency. Proc. Natl Acad. Sci. USA. 2000;97:3718–3723. doi: 10.1073/pnas.97.7.3718. [DOI] [PMC free article] [PubMed] [Google Scholar]
- 18.Koroleva OA, Tomlinson ML, Leader D, Shaw P, Doonan JH. High-throughput protein localization in Arabidopsis using Agrobacterium-mediated transient expression of GFP-ORF fusions. Plant J. 2004;41:162–174. doi: 10.1111/j.1365-313X.2004.02281.x. [DOI] [PubMed] [Google Scholar]
- 19.Li S, Ehrhardt DW, Rhee SY. Systematic analysis of Arabidopsis organelles and a protein localization database for facilitating fluorescent tagging of full-length. Arabidopsis proteins. Plant Physiol. 2006;141:527–539. doi: 10.1104/pp.106.078881. [DOI] [PMC free article] [PubMed] [Google Scholar]
- 20.Heazlewood JL, Verboom RE, Tonti-Filippini J, Small I, Millar AH. SUBA: the Arabidopsis subcellular database. Nucleic Acids Res. 2007;35:D213–D218. doi: 10.1093/nar/gkl863. [DOI] [PMC free article] [PubMed] [Google Scholar]
- 21.Fink JL, Aturaliya RN, Davis MJ, Zhang F, Hanson K, Teasdale MS, Kai C, Kawai J, Carninci P, et al. LOCATE: a mouse protein subcellular localization database. Nucleic Acids Res. 2006;34:D213–D217. doi: 10.1093/nar/gkj069. [DOI] [PMC free article] [PubMed] [Google Scholar]
- 22.Nash R, Weng S, Hitz B, Balakrishnan R, Christie KR, Costanzo MC, Dwight SS, Engel SR, Fisk DG, et al. Expanded protein information at SGD: new pages and proteome browser. Nucleic Acids Res. 2007;35:D468–D471. doi: 10.1093/nar/gkl931. [DOI] [PMC free article] [PubMed] [Google Scholar]
- 23.Pierleoni A, Martelli PL, Fariselli P, Casadio R. eSLDB: eukaryotic subcellular localization database. Nucleic Acids Res. 2007;35:D208–D212. doi: 10.1093/nar/gkl775. [DOI] [PMC free article] [PubMed] [Google Scholar]
- 24.Wiwatwattana N, Landau CM, Cope GJ, Harp GA, Kumar A. Organelle DB: an updated resource of eukaryotic protein localization and function. Nucleic Acids Res. 2007;35:D810–D814. doi: 10.1093/nar/gkl1000. [DOI] [PMC free article] [PubMed] [Google Scholar]
- 25.Kumagai-Sano F, Hayashi T, Sano T, Hasezawa S. Cell cycle synchronization of tobacco BY-2 cells. Nat. Protocol. 2006;1:2621–2627. doi: 10.1038/nprot.2006.381. [DOI] [PubMed] [Google Scholar]
- 26.Oikawa K, Kasahara M, Kiyosue T, Kagawa T, Suetsugu N, Takahashi F, Kanegae T, Niwa Y, Kadota A, et al. CHLOROPLAST UNUSUAL POSITIONING1 is essential for proper chloroplast positioning. Plant Cell. 2003;15:2805–2815. doi: 10.1105/tpc.016428. [DOI] [PMC free article] [PubMed] [Google Scholar]
- 27.Wada M, Kagawa T, Sano Y. Chloroplast movement. Annu. Rev. Plant Biol. 2003;54:455–468. doi: 10.1146/annurev.arplant.54.031902.135023. [DOI] [PubMed] [Google Scholar]
- 28.Hayashi Y, Yamada K, Shimada T, Matsushima R, Nishizawa NK, Nishimura M, Hara-Nishimura I. A proteinase-storing body that prepares for cell death or stresses in the epidermal cells of Arabidopsis. Plant Cell Physiol. 2001;42:894–899. doi: 10.1093/pcp/pce144. [DOI] [PubMed] [Google Scholar]
- 29.Gunning BES. The identity of mystery organelles in Arabidopsis plants expressing GFP. Trends Plant Sci. 1998;3:417. doi: 10.1016/s1360-1385(01)01980-x. [DOI] [PubMed] [Google Scholar]


