Abstract
A critical evaluation of the performance of X-ray refinement protocols using various energy functions is presented using the bovine pancreatic trypsin inhibitor (BPTI) protein. The four potential energy functions we explored include: (1) fully quantum mechanical calculations; (2) one based on an incomplete molecular mechanics (MM) energy function employed in the Crystallography and NMR System (CNS) with empirical parameters developed by Engh and Huber (EH), which lacks electrostatic and attractive van der Waals terms; (3) one based on a complete MM energy function (AMBER ff99 parameter set); and (4) the same as 3, with the addition of a Generalized Born (GB) implicit solvation term. The R, R free, real space R values of the refined structures and deviations from the original experimental structure were used to assess the relative performance. It was found that at 1 Å resolution the physically based energy functions 1, 3, and 4 performed better than energy function 2, which we attribute to the better representation of key interactions, particularly electrostatics. The observed departures from the experimental structure were similar for the refinements with physically based energy functions and were smaller than the structure refined with EH. A test refinement was also performed with the reflections truncated at a high-resolution cutoff of 2.5 Å and with random perturbations introduced into the initial coordinates, which showed that low-resolution refinements with physically based energy functions held the structure closer to the experimental structure solved at 1 Å resolution than the EH-based refinements.
Keywords: quantum mechanics, molecular mechanics, protein structures, X-ray structure refinement, linear-scaling, Generalized Born
X-ray crystallography is an indispensable tool in structural biology that has supplied the majority of three-dimensional structures of macromolecules to the scientific community. Despite the various technological advances during the past few decades that have tremendously improved the capabilities of X-ray crystallography, it is still very difficult to obtain ultra-high resolution protein structures with full atomic level detail (Jelsch et al. 2000; Ko et al. 2003). This contrasts with the situation for small molecule crystals and is attributed to the poor observation-to-parameter ratio problem, which arises because the amount of observed diffraction data is insufficient compared with the large number of structural variables required in order to model the positional and thermal parameters of all the atoms in protein crystals.
In the X-ray crystallographic community, this problem has been traditionally dealt with through the introduction of constraints or restraints (Jack and Levitt 1978; Hendrickson 1985; Tronrud et al. 1987) during refinement. The purpose of the former is to reduce the number of adjustable parameters, whereas the latter essentially increases the number of observations by supplementing the X-ray data with stereochemical information. Although both approaches were introduced to address the same problem, the energetically restrained refinement (EREF) formalism (Jack and Levitt 1978) has gained more popularity in protein structure refinements because of the convenience of combining it with simulation techniques such as Molecular Dynamics (MD) and Simulated Annealing (SA). In the EREF formalism, an energy function based on physical interactions is combined with an X-ray target function (Jack and Levitt 1978):
where E total is the function to be minimized during the refinement, E chem is the energy function, E X-ray is the X-ray target function, and w X-ray is the weight that balances the contributions from the energy function E chem and the pseudoenergy function E X-ray.
Brunger and coworkers (Brunger et al. 1987, 1989, 1990; Weis et al. 1990) pioneered the SA refinement approach, in which MD simulations were utilized with a function of the form given in Equation 1 as the potential energy function to explore conformational space during refinement. Their approach demonstrated remarkable strengths in improving the radius of convergence of crystallographic refinements because it can overcome local minima in an automatic fashion, which makes it superior to the conventional approach that requires many cycles of manual refitting. In the early SA refinement studies (Brunger et al. 1987, 1989, 1990; Weis et al. 1990), the energy function took the form of a typical molecular mechanics (MM) potential, i.e,
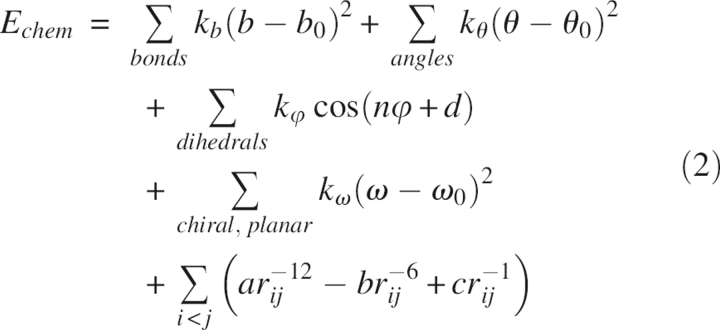 |
where the various terms represent the contributions to the total energy from bond lengths, bond angles, dihedral torsion angles, chiral centers, planarity of aromatic rings, van der Waals, and electrostatic interactions (Brunger et al. 1989). The parameters for these terms were taken from the force field reported by Brooks et al. (1983) with some modifications (Brunger et al. 1989). It was found later in the SA refinement of the influenza virus hemagglutinin (Weis et al. 1990) that fully charged residues behaved abnormally during molecular dynamics simulations; e.g., oppositely charged surface residues spuriously formed salt bridges with one another or formed hydrogen bonds with main chain atoms. Often these structures would cause significant peaks in the difference density maps and were thus deemed incorrect. In light of these artifacts, Brunger and Adams (2002) decided to leave the electrostatics and attractive van der Waals terms out of the energy function in routine X-ray structure refinements. In the commonly used refinement force fields such as the one in the Crystallography and NMR System (CNS) program, E chem has the following simplified form:
 |
where the parameters of the stereochemical terms are derived from a statistical analysis of the chemical moieties of proteins and polynucleotides from the Cambridge Structural Database (CSD) by Engh and Huber (1991). It must be stressed that if sufficient experimental signals were available, structures solved with X-ray crystallography should not be influenced by the choice of E chem. However, in reality, especially in medium- and low-resolution refinements, the final structures reflect the energy restraints employed in the refinement processes.
One of the problems of adopting the simplified potential shown in Equation 3 is that it creates difficulties in refining the coordinates for hydrogen atoms. This limitation has not been met with widespread resistance by the X-ray crystallographic community since X-ray diffraction itself is insensitive to hydrogen atoms, and thus their coordinates are usually not solved. However, electrostatic interactions are important for resolving the conformations of certain side chains, e.g., those of glutamines and asparagines, for which the incomplete energy function is disadvantaged. With structural information playing an increasingly important role in studying biological problems, there is a continuing demand for improvements in current refinement methodologies. (Schiffer et al. 1995; Schiffer and van Gunsteren 1999; Fabiola et al. 2002; Priestle 2002; Moulinier et al. 2003; Korostelev et al. 2004) Recently, Schiffer and Hermans (2003) reviewed the major developments in simulation techniques that hold promise of improving the existing methodologies, and the use of quantum mechanical (QM) calculations was viewed as a major improvement from molecular mechanics approximations represented by Equations 2 or 3. Compared with an MM energy function that uses fixed atomic charges to model electrostatic interactions, QM has the advantage that it can represent charge fluctuations and dynamic polarization. In addition, a QM description is superior to an MM one when the regions of interest involve structures that differ substantially from those found in the gas phase (e.g., covalent complexes, systems with unusually close contacts, etc.), where QM can represent these interactions more reliably than MM. Lastly, QM is advantageous in modeling structures of reaction intermediates because it can inherently reflect breaking/making of chemical bonds through changes in the electronic structure.
A major obstacle that has hindered the application of QM-based energy restraints is the relatively high computational cost of electronic structure calculations. For this reason, the earliest applications of QM in X-ray structure refinement inevitably involved the hybrid quantum mechanical/molecular mechanical (QM/MM) method (Ryde et al. 2002; Nilsson et al. 2003, 2004; Ryde and Nilsson 2003a,b; Nilsson and Ryde 2004; Yu et al. 2006), where only a small fraction of the system was treated with QM while the majority of the protein atoms, ions, and solvent atoms were represented with MM. Although the current computational machinery has limited the applications of most ab initio and Density Functional Theory (DFT) methods to molecules of up to a couple hundred atoms, there have been continuous developments in electronic structure methods whose computational costs scale linearly with system sizes. (Yang 1991; Yang and Lee 1995; Dixon and Merz 1996, 1997; Lee et al. 1996) These developments have enabled quantum mechanical calculations on full protein systems of a few thousand atoms and made routine refinements of protein crystal structures with QM energy restraints a feasible task.
In a recent paper (Yu et al. 2005), we presented a study where we combined X-ray diffraction data with linear-scaling QM calculations to refine the crystal structure of a small protein molecule, bovine pancreatic trypsin inhibitor (BPTI). Through comparisons with the structures refined with the simplified EH potential, we demonstrated that the QM energy restraints were capable of maintaining reasonable stereochemistry to the extent that the resultant R and free R values are comparable to those of the EH ones. These encouraging initial results called for more extensive research that explores additional aspects of this novel approach, which is the subject of the present paper. Indeed, in order to make the calculations tractable and facilitate the comparisons, several simplifications were adopted in the initial study, which included omission of alternate conformations with lower occupancies and removal of all the solvent molecules and ions. In this paper, we modify these simplifications to keep them at a minimal level and reexamine the structures refined with our approach.
Results and Discussion
To compare the results obtained with QM restraints with other approaches, we performed the refinements using four protocols: in Protocol 1 (termed QM hereafter), the restraints were derived from the QM/MM energy function, as detailed in the Materials and Methods section; in Protocol 2 (EH), the energy restraints were derived from the simplified MM energy function (Equation 3) with the Engh and Huber parameters as implemented in CNS; in Protocol 3 (AMBER/GAS), the restraints were derived from the standard MM energy function (Equation 2) with the ff99 force field (Wang et al. 2000) as implemented in AMBER 8; and in Protocol 4 (AMBER/GB/SA), the restraints were derived from the same energy function as in Protocol 3 supplemented with an implicit description of the solvent using the Generalized Born/Surface Area (GB/SA) model (Still et al. 1990; Hawkins et al. 1995, 1996; Tsui and Case 2001). The electrostatic solvation term in the GB model adopts a concise form with an analytical expression for the gradient:
 |
where ɛ is the dielectric constant of the bulk solvent, q i and q j are atomic charges of atoms i and j, and f GB is a function of the distance between atoms i and j and of the Born radii of them. The GB model we employed was the one developed by Hawkins et al. (1995, 1996).
Using the restraints derived from the energy functions, we carried out energetically restrained structure refinements on the four starting models defined in the Materials and Methods section. The weighting factor, w X-ray, in Equation 1 is an arbitrary quantity and, as Brunger and Adams (2002) pointed out, the optimal choice for w X-ray should minimize the R free value. CNS has an automatic procedure to obtain a quick estimate of w X-ray by running a short MD simulation and matching the amplitudes of the X-ray gradients with those of the energy gradients. This procedure suggested w X-ray = 0.1, which was used as a preliminary guess for all the refinement protocols. We then varied w X-ray by two orders of magnitude around 0.1 and carried out a systematic search for the optimal weighting factors. The runs for each of the four models started from the same initial coordinates and were independent of one another.
R and Rfree values at different weights
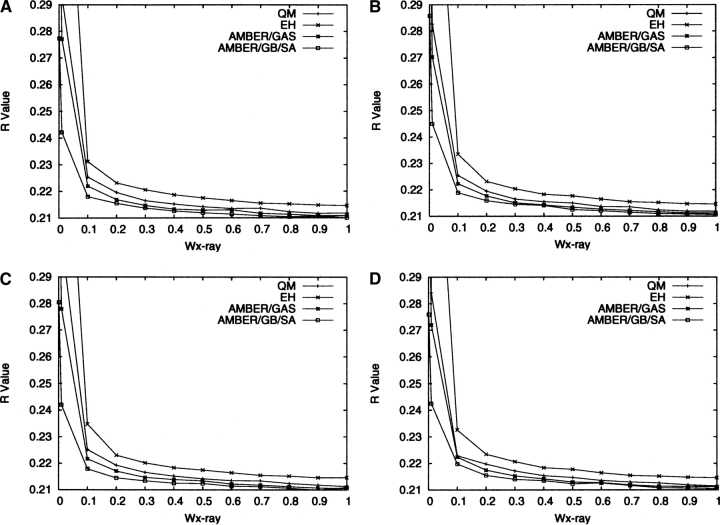
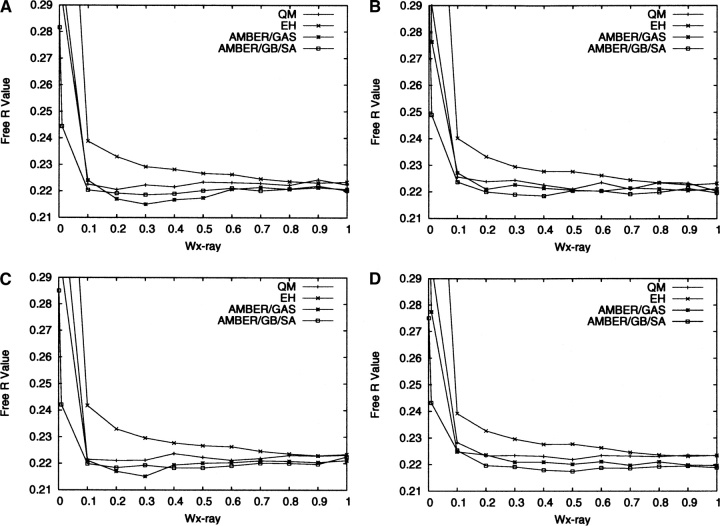
The final R and R free values of the refined structures are shown in Figures 1 and 2, respectively, for all four protocols as defined in the previous section. From Figure 1, it appears that throughout the range of w X-ray the best R values are obtained for AMBER/GB/SA, followed by AMBER/GAS. The QM R values are slightly worse than the AMBER/GAS ones, but are better than the EH ones. Figure 2 shows a similar pattern, but when w X-ray is between 0.1 and 0.7, the R free values for QM, AMBER/GAS, and AMBER/GB/SA refinements fall within a narrow range with no obvious trend. This may be because the differences between the R free values become statistically less significant, as the free R set consists of much fewer reflections. The EH R free values at these w X-ray values are higher than those of the other three protocols by a statistically significant amount. The fact that the QM R and R free values are slightly worse than the AMBER/GAS ones is most likely due to the systematic deficiencies of the AM1 parameter set, as we have discussed in our previous paper (Yu et al. 2005). Correcting these deficiencies will require possibly a complete re-parameterization of the AM1 Hamiltonian, the addition of Poisson-Boltzmann solvation, or the introduction of additional restraints and is outside the scope of the current study.
Figure 1.
R values for the final structures refined with the four protocols (Protocol 1, QM; Protocol 2, EH; Protocol 3, AMBER/GAS; Protocol 4, AMBER/GB/SA) for Model 1 (A), Model 2 (B), Model 3 (C), and Model 4 (D).
Figure 2.
R free values for the final structures refined with the four protocols for Model 1 (A), Model 2 (B), Model 3 (C), and Model 4 (D).
It is interesting to note that, in the limit of very low w X-ray, for example 0.01, the R and R free values increase sharply for all the refinements except AMBER/GB/SA, which yielded R values of 0.242–0.245 and R free values of 0.242–0.249. The explanation for the increase in the R values for QM and AMBER/GAS refinements is that when the weight of the X-ray restraint is reduced, the parts of a protein structure that are mostly affected are the regions with poorly resolved electron densities, e.g., surface residues and discrete solvent molecules. In these regions, minimizing the structure on a potential energy function containing electrostatic interactions without modeling the solvent can cause significant artifacts in the structure. Similar issues were also observed previously during SA refinements and were rationalized in the same way (Weis et al. 1990). This finding echoes the previous observations by Moulinier et al. (2003), who were the first to reintroduce electrostatics into structure refinement with a GB model treatment of the bulk solvent. Their work investigated three systems where the resolutions of the crystal structures ranged from 1.95 to 3.2 Å, and the modified energy function was shown to yield structures with comparable R values as those refined with the conventional energy function, signaling a considerable improvement from the earlier refinements that included electrostatics interactions but did not incorporate solvation (Weis et al. 1990). Korostelev and co-workers (2004) explored the impact of a Poisson-Boltzmann electrostatic restraint on protein structures refined at medium resolutions, and demonstrated that their approach led to better R free factors, less overfitting, and improved interactions for salt bridges and between polar and charged groups and the solvent. These previous studies and the results from the AMBER/GB/SA refinements in this work clearly attest to the importance of modeling the solvation effects when electrostatic interactions are included in structure refinements. It is also clear that the inclusion of the few discrete solvent molecules is far from sufficient in representing the effects generated by a continuum of bulk solvent. On the other hand, the abrupt rise in the R and R free values for EH refinements must be due to deficiencies in the other MM parameters in EH than the electrostatic ones, most likely the dihedral angle parameters (Priestle 2002).
Given that the R free values and differences between the R free and R values appear to be optimal for the majority of the refinement protocols using physically based energy functions (QM, AMBER/GAS, and AMBER/GB/SA) at w X-ray = 0.2, in the following we will restrict the discussion of the structures refined with these protocols to this particular weight. Similarly, we will select w X-ray = 0.9 as the optimal weight for EH refinements as it yielded the lowest R free factors for most of the models. The large difference in the optimal w X-ray between physically and empirically based energy functions has previously been witnessed by Ryde et al. (2002), who suggested the average magnitude of the EH forces were roughly three times the average of forces derived from physically based energy functions. In our experience, this simple empirical relationship has not been observed to hold consistently for all the refinements that we have performed (Yu et al. 2005). Fortunately, neither the R free factors nor the refined structures change significantly in the vicinity of the “optimal” w X-ray we identified, justifying our choice of not trying to locate the precise optimum of the w X-ray parameter. Likewise, since the results for the four individual models are quite similar, we will limit the subsequent presentation of the results to model 4 only using the four protocols (QM, EH, AMBER/GAS, and AMBER/GB/SA).
Stereochemical quality
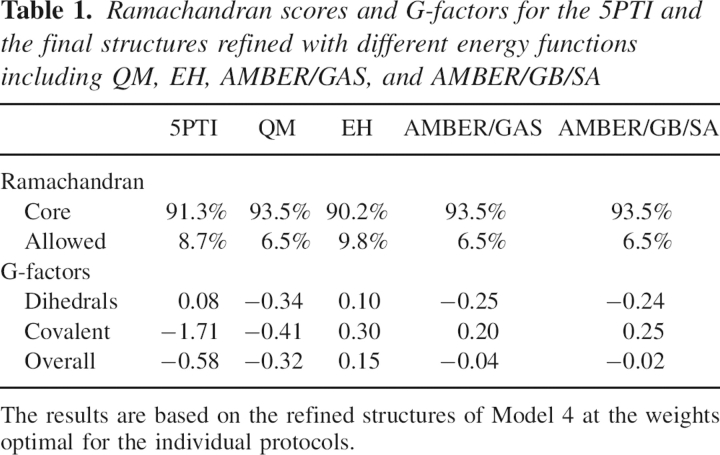
The stereochemical quality of the refined structures was examined with the PROCHECK program (Laskowski et al. 1993), and the results are shown in Table 1. Here, we focus on two indicators from this analysis: the Ramachandran plot and the G-factors. It appears from Table 1 that the QM, AMBER/GAS, and AMBER/GB/SA refinements improve the percentage of residues in the core region of the Ramachandran plot over EH and the 5PTI structure.
Table 1.
Ramachandran scores and G-factors for the 5PTI and the final structures refined with different energy functions including QM, EH, AMBER/GAS, and AMBER/GB/SA
The G-factor is an indicator of the plausibility of a stereochemical property, and a low G-factor means the property corresponds to a low-probability conformation. The G-factor of dihedrals is based on the deviations of φ-ψ combinations, ω torsion angles, side chain dihedral angles, and their combinations from the statistical averages derived from 163 protein structures solved by X-ray crystallography to a resolution of 2.0 Å or better and an R-factor of no larger than 20%; the G-factor of covalent geometry is based on the deviations of main chain bond lengths and angles from the Engh and Huber parameters. The G-factors of dihedrals in Table 1 indicate the dihedral angles of the QM-, AMBER/GAS-, and AMBER/GB/SA-refined structures show larger deviations from the statistical averages, whereas EH seems to improve this property. The plausibility of the main chain bond lengths and angles of the structures from all the refinements was improved relative to the 5PTI structure. However, the improvement of the QM-refined structure was not as significant as those of EH, AMBER/GAS, and AMBER/GB/SA, probably because of the systematic deficiencies of the AM1 method (Yu et al. 2005).
The deterioration of the dihedral G-factor by QM refinements, however, is rather surprising and worth further discussion. Interestingly, the dihedral G-factors of AMBER/GAS- and AMBER/GB/SA-refined structures were also worse than those of the EH-refined structure and the 5PTI structure, despite the fact that the AMBER force field parameters have been validated extensively (Cornell et al. 1995; Ponder and Case 2003). This latter observation can be ascribed to a few possible explanations: One is that the AMBER parameters place emphasis on giving reasonable conformational energies rather than being consistent with crystal structures; another one is that the 163 crystal structures used to derive the parameters for the dihedral G-score in PROCHECK contained some biases because they were solved using refinement programs that employed empirical parameters. It is interesting to note that the parameters for the dihedral angle restraints in CNS have been questioned in a recent study by Priestle (2002), who analyzed 46 ultra-high resolution protein structures (resolutions better than 1.2 Å) and found many discrepancies between the dihedral angle restraints in CNS and the actual distributions in the surveyed structures. Since ultra-high resolution structures are mostly solved without energy restraints, the distributions reported by Priestle (2002) are likely more reliable than the PROCHECK ones. Therefore, it is expected that a program based on the statistical averages found by Priestle (2002), if available, will be a better test of the quality of dihedrals of the structures refined with physically based energy restraints.
Local fits to density
The real space R values (Jones et al. 1991) have been calculated for the refined structures using the following expression:
 |
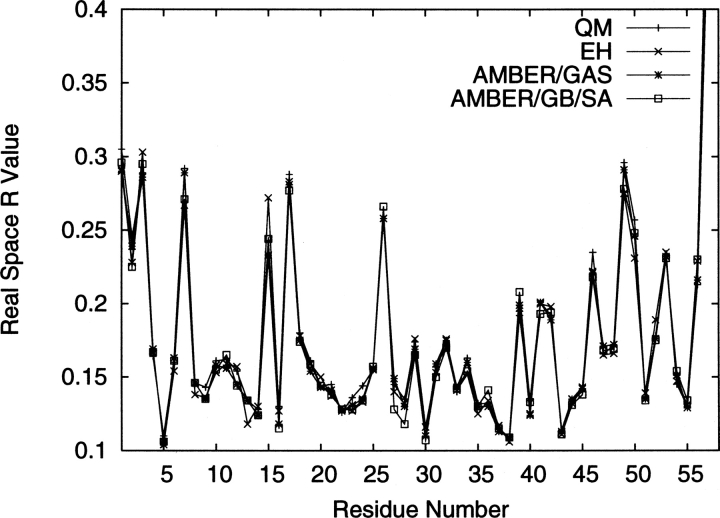
where α labels the residue number, ρobs is the electron density calculated by combining the amplitudes of the observed structure factors with the phases from the σA-weighted electron density maps, and ρcalc is the model-predicted electron density. As a supplement to the reciprocal space R value that indicates the discrepancy between a set of observed and calculated structure factor amplitudes, the real space R value shows the local goodness-of-fit of a refined structure to the observed density. The real space R values for the four refined structures are plotted in Figure 3. The residues that have high real space R values (R real space > 0.18) are mostly charged ones located on the surface (e.g., Arg1, Asp3, Glu7, Lys15, Arg17, Lys26, Arg39, Lys41, Arg42, Lys46, Glu49, Asp50, Arg53, etc.) and at the termini. From Figure 3, it appears the real space R values among different refinement protocols follow a similar trend across all the residue numbers, and the real space R values at the peaks are comparable between the physically based energy functions (QM, AMBER/GAS, and AMBER/GB/SA) and the empirically based energy function (EH). Nevertheless, EH seems to yield better real space R values for well-resolved residues (R real space < 0.18).
Figure 3.
Real-space R values for the structures refined by QM, EH, AMBER/GAS, and AMBER/GB/SA at their ideal w X-ray for Model 4 only.
Deviations from the 5PTI structure
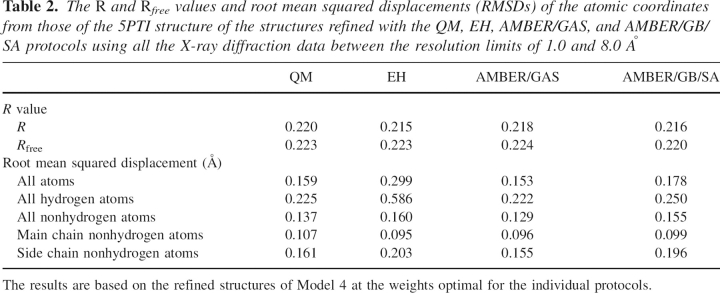
The 5PTI structure was solved by a joint refinement of X-ray and neutron diffraction data, and all the energy restraints were removed in the last several cycles (Wlodawer et al. 1984). Even though there exist regions where some bond angles deviate considerably from the Engh and Huber parameters, as we have shown in our previous paper (Yu et al. 2005), the remainder of the structure both should present a near optimal fit to the observed electron density and should contain very accurate coordinates for hydrogen atoms. Thus, it would be useful to compare the deviations in atomic coordinates, especially in hydrogen atom coordinates, of the refined structures from those of the crystal structure, as these differences are not reflected in the R value analyses. The R and R free values and root mean squared displacements (RMSDs) of the atomic coordinates from those of the 5PTI structure of the structures refined with the QM, EH, AMBER/GAS, and AMBER/GB/SA protocols are shown in Table 2, where it appears that even though the R and R free values are similar among different protocols, the EH-refined structure deviates more from the 5PTI structure than all the physically based protocols, especially in the coordinates of the hydrogen atoms.
Table 2.
The R and Rfree values and root mean squared displacements (RMSDs) of the atomic coordinates from those of the 5PTI structure of the structures refined with the QM, EH, AMBER/GAS, and AMBER/GB/SA protocols using all the X-ray diffraction data between the resolution limits of 1.0 and 8.0 Å
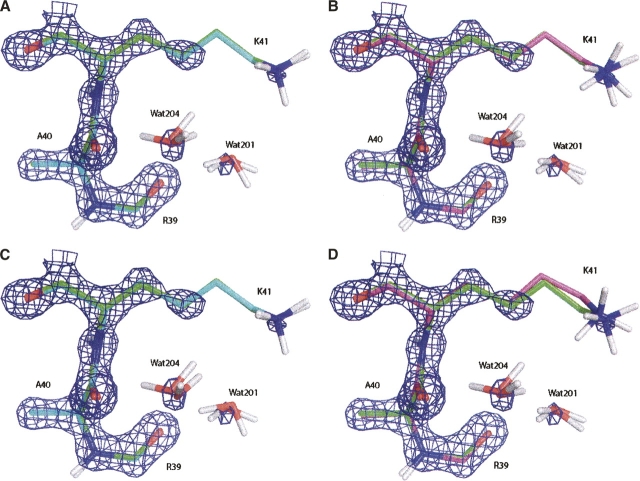
The structures for the residues Ala40, Lys41, part of Arg39, and two discrete water molecules refined with QM and EH are displayed in Figure 4, together with the σA-weighted electron density maps. The AMBER/GAS- and AMBER/GB/SA-refined structures for this region are very similar to the QM-refined structure and, hence, are omitted from the presentation. Since the optimal R free values for the QM and EH refinements were attained at different weights, in Figure 4, A and B, we compare the structures refined at w X-ray = 0.9, and in Figure 4, C and D, we compare those refined at w X-ray = 0.2. The polar interactions worth noticing here are the hydrogen bonds made between the Nζ of Lys41 and Wat201, between Wat201 and Wat204, and between Wat201 and the carbonyl of Arg39. Comparing Figure 4, A and B, it appears that the inclusion of the electrostatics in the QM refinement allowed the polar hydrogen on Nɛ of Lys41 to be oriented accurately in excellent agreement with the 5PTI structure, whereas the omission of electrostatics in the EH refinement caused significant deviations in hydrogen atom coordinates. This situation worsens significantly for EH refinements when w X-ray is dropped to 0.2, as shown by the movement of the entire side chain of Lys41 from the 5PTI structure in Figure 4D, yielding a coordinate RMSD of ∼0.55 Å. In contrast, the QM restraints did not cause as much change to the structure, and the structure refined with the reduced w X-ray is still not too far from the 5PTI structure.
Figure 4.
Refined structures for the residues Ala40, Lys41, part of Arg39, and two discrete water molecules superimposed with the 5PTI structure, together with the σA-weighted electron density maps contoured at 2.3σ level. (A) Structure refined with QM (cyan) at w X-ray = 0.9; (B) structure refined with EH (magenta) at w X-ray = 0.9; (C) structure refined with QM (cyan) at w X-ray = 0.2; (D) structure refined with EH (magenta) at w X-ray = 0.2. All the aliphatic hydrogen atoms are omitted for clarity.
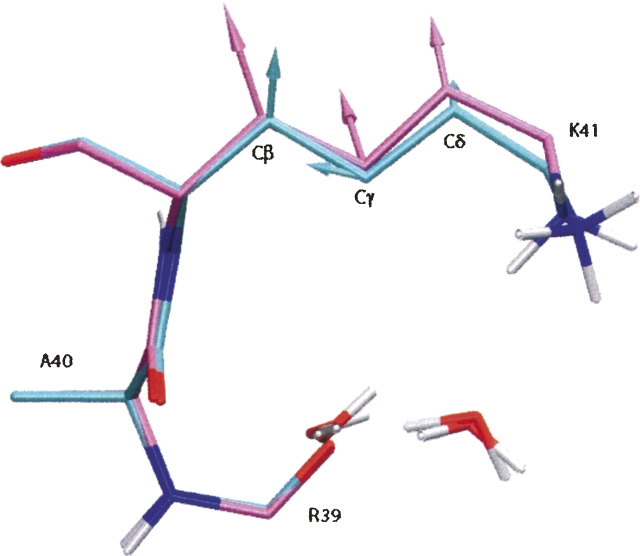
The difference between the QM and EH refinements is particularly revealing when the restraining forces derived from E chem are compared. According to Equation 1, when the refinements reach the stationary point, the forces based on E chem on the individual atoms should nearly cancel the gradient of the X-ray target so that the net forces are close to zero. However, the better E chem represents the actual physical interactions, the smaller the magnitudes of its forces in the refined structure should be. In Figure 5 we superimpose the structures refined with QM and EH at w X-ray = 0.2 together with the forces on the Cβ, Cγ, and Cδ atoms of Lys41 derived from E chem calculated with QM and EH. The amplitudes of the force vectors are represented on a relative scale, but with the same scaling factor. It can be seen that not only are the magnitudes of the EH forces slightly larger than the QM ones, but also their directions are approximately the same as their deviations from the 5PTI structure. Increasing w X-ray from 0.2 to 0.9 clearly helps placing the nonhydrogen atoms better in EH refinement, as the comparison between Figure 4, B and D, and the R value analyses show. However, the coordinates for the hydrogen atoms are still not as accurate as those by QM refinement. Based on these results, we suggest that the QM restraints are more consistent with the experimental information than the EH ones.
Figure 5.
Structures for the residues Ala40, Lys41, part of Arg39, and two discrete water molecules refined with QM (cyan) and EH (magenta) at w X-ray = 0.2, together with the forces (cyan and magenta cylinders with arrowheads) on the Cβ, Cγ, and Cδ atoms of Lys41 derived from the respective E chem. All the aliphatic hydrogen atoms are omitted.
Refinements with low-resolution data
In order to assess the utility of physically based energy restraints in practical refinement applications, we performed a test with the X-ray reflection data truncated at a high-resolution cutoff of 2.5 Å, as described in the Materials and Methods section. This is expected to mimic the situation of real-world low-resolution protein crystallography to some extent. However, important distinctions must be drawn between truncating the high-resolution reflections and reducing w X-ray: The former removes the portion of the reflection data that dictates the stereochemical details of the structure, while still enforcing the structure to fit into an electron density envelope that is now more blurry; the latter, on the other hand, reduces the X-ray constraint uniformly for all the resolutions, allowing changes on a larger scale to take place.
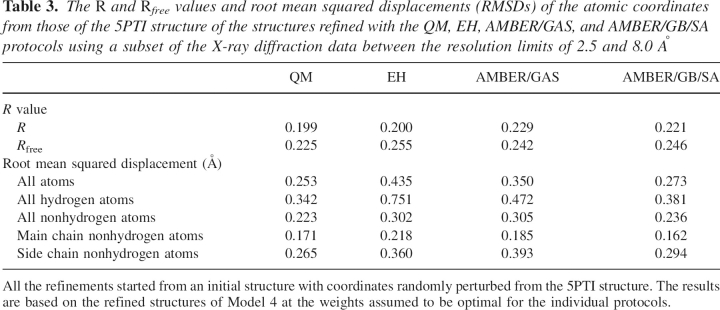
Refinements were carried out using this artificially constructed “low-resolution” data set starting from the perturbed initial structures as detailed in the Materials and Methods section. The purpose of this exercise is to explore the influence of the energy restraints on the deviations of the structures refined at a lower resolution from the would-be high-resolution structure. In principle, we should be able to adopt the same protocol as the one employed for the high-resolution refinements to identify the optimal weights. However, due to the much smaller pool of reflections, the differences in the R and R free values are statistically much less meaningful than those shown in Figures 1 and 2. In light of the fact that the R free values can offer only very limited guidance here, we have to resort to the assumption that the ideal w X-ray values remain the same as those determined from high-resolution refinements, which are 0.2 for refinements with physically based parameters (QM, AMBER/GAS, and AMBER/GB/SA) and 0.9 for refinements with empirically based parameters (EH). The departures from the 5PTI structure, measured as RMSDs, as well as the R and R free values of the refined structures are shown in Table 3. Clearly, all the physically based protocols give better R free values and lower coordinate RMSDs than the empirically based EH refinement. The low R value of the EH-refined structure is probably a result of the heavy w X-ray associated with that protocol. Among the physically based energy restraints, QM performed the best in terms of both the final R and R free values. The RMSDs of these refinements are considerably larger than those of the previous runs shown in Table 2, because in the absence of the high-resolution data the approximate energy restraints move the structures further away from the “true” structure. However, the RMSDs of all the structures refined with physically based energy restraints are lower than the EH-refined one, and the differences are amplified compared with those in Table 2. Furthermore, among the physically based protocols, the “low-resolution” refinement restrained with QM shows the smallest deviation from the 5PTI structure than all the other protocols, consistent with the R and R free values and suggesting the utility of involving QM energy restraints to enhance the accuracy of structures refined at low resolutions.
Table 3.
The R and Rfree values and root mean squared displacements (RMSDs) of the atomic coordinates from those of the 5PTI structure of the structures refined with the QM, EH, AMBER/GAS, and AMBER/GB/SA protocols using a subset of the X-ray diffraction data between the resolution limits of 2.5 and 8.0 Å
Conclusions
In this paper, we have applied the QM refinement method to a system at a level of detail that is comparable to what is typically used to develop the final models of protein crystal structures. The performance of this approach has been evaluated critically by comparisons with EH refinements (using the Engh and Huber MM parameters as implemented in CNS), in addition to other refinement methods that involve a complete MM energy function and implicit solvation. Compared with EH, QM refinements yielded at least comparable or slightly better crystallographic R, R free, and real space R values, as well as better consistency with the high-resolution structure. Part of the reason for this improvement is attributed to the more accurate representation of some of the key interactions in the QM calculations. Similar to the previous studies that introduced solvation effects or hydrogen bond restraints to the refinement process, the improvement in the R and R free values by our approach is relatively moderate. However, we suggest that the caliber of a refinement approach is measured not only by the resultant R and R free values, but also by its ability to elucidate the physical interactions in a way consistent with a correct picture of the underlying chemistry. Finally, the results of the refinement experiments we conducted with the data set truncated at a lower resolution suggest the potential utility of physically based energy restraints to further enhance the accuracy of low-resolution crystal structures.
The level of QM used in the present study (the semiempirical AM1 method) represents one QM Hamiltonian that is currently available. The choice of a semiempirical approach has to do with the ready availability of a linear-scaling methodology, which gives us an appropriate level of computational efficiency to carry out X-ray refinement studies. As more advanced “ab initio” or density functional theory (DFT) methods achieve suitable computational efficiency, it will be straightforward to apply these methods to refinement problems. Given the ability of QM based methods to model the physical interactions within a biological macromolecule, the use of QM approaches could supplant the use of empirical potentials, especially in the final stages of structure refinement.
Materials and methods
All the calculations in this work were carried out with the Assisted Model Building with Energy Refinement (AMBER, version 8; Case et al. 2004) and Crystallography and NMR System (CNS, version 1.1; Brunger et al. 1998) software using a small interface program linking the two packages. The SANDER module is the main energy minimization/molecular dynamics driver in the AMBER package. The component that handles the QM calculations within SANDER is our linear-scaling semiempirical electronic structure program DivCon, which employs an efficient divide-and-conquer approach to enable fully quantum mechanical energetics calculations and geometry optimizations on macromolecules. For more details on our linear-scaling approach, the reader is referred to previous theoretical work (Dixon and Merz 1996, 1997; Lee et al. 1996; van der Vaart et al. 2000; Yu et al. 2005). We modified the routines in SANDER that compute forces to make an additional call to the interface program, where the atomic coordinates are output to a scratch file. CNS is then invoked via a system call to calculate the X-ray target function and its gradient in Cartesian space based on the coordinates in the scratch file. In practice, this is accomplished by modifying the CNS input script, minimize.inp, in the same way as Ryde et al. (2002). Next, the X-ray target function and the gradient deposited in scratch files are read into SANDER and added to the physical energy and gradient according to Equation (1). The SANDER refinement proceeds by minimizing the total target function using either the steepest descent or the conjugate gradient method.
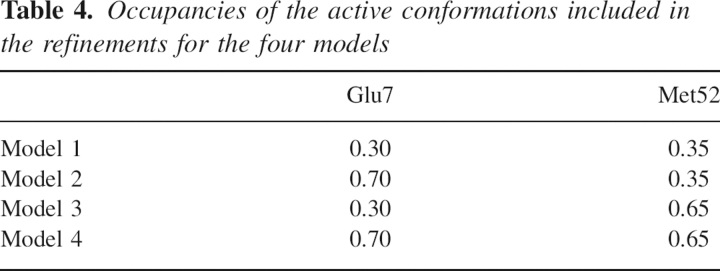
The initial model of BPTI and the diffraction data were taken from the Protein Database Bank (PDB ID 5PTI). Since this initial model contains some crystallographic features that arise from the ensemble average nature of X-ray signals, and QM modeling at the present can handle only single static structures, it has to be modified to make QM refinement amenable. Specifically, the unknown ion at site 324, which was hypothesized to be potassium (Wlodawer et al. 1984), was deleted, and the 63 water molecules, of which 34 are partially occupied, were removed. Next, we used the CNS input script water_pick.inp to rebuild the coordinates for some of the waters that have substantial electron densities. At a threshold level of 4σ in the σA-weighted difference density map, this procedure extracted 34 waters with unitary occupancies. The new system, including 58 residues, the phosphate ion, and 34 water molecules, was used as the starting point for the refinements. The 5PTI structure also contains two disordered residues, Glu7 and Met52, each of which is modeled with two distinct conformations. For Glu7, the two conformations in the 5PTI structures have occupancies of 0.30 and 0.70, while those for Met52 are 0.35 and 0.65. We constructed four models representing the four possible combinations of the alternate conformations, as shown in Table 4. Finally, the deuterium atoms in the 5PTI structure were converted to hydrogen atoms for the same reasons given in our previous work (Yu et al. 2005). Each of the four initial structures contains a total of 999 atoms.
Table 4.
Occupancies of the active conformations included in the refinements for the four models
The subsequent structure refinement was carried out in a hybrid quantum mechanical/molecular mechanical (QM/MM) fashion, where the protein chain and the phosphate were treated with quantum mechanics at the semiempirical AM1 level of theory and the water molecules were represented with the TIP3P model (Jorgensen et al. 1983). This approach was first adopted by Liu et al. (2001) in their QM based MD study, and an alternative here would involve treating the entire system quantum mechanically. However, since in this work the coordinates of the water molecules were rebuilt from the water picking procedure, the comparison of their coordinates between the 5PTI structure and the refined structures is not meaningful. Hence, even though this alternative is perfectly feasible, the benefits gained from it did not seem to outweigh the additional computational expense. Since the QM/MM boundary does not bisect any chemical bonds, link atoms were not necessary. The active conformations of the disordered residues were treated with the energy functions and their coordinates were refined. The inactive conformations were included in the calculation of the structure factors because they account for a substantial amount of the total density and are thus important for maintaining the accuracy of the phases. Nevertheless, their coordinates were not refined during the runs. The occupancies of the disordered residues and the phosphate ion were held fixed at their values in the 5PTI structure. The individual isotropic temperature factors were likewise not refined, as in previous studies (Brunger et al. 1987, 1989), and the motivation of this treatment has been thoroughly explained in our earlier paper (Yu et al. 2005). The X-ray target function used in all the refinements was the one based on the maximum likelihood formalism (Read 1986, 1990; Pannu and Read 1996; Adams et al. 1997; Brunger and Adams 2002).
The X-ray diffraction data include 17,615 reflections between the resolution limits of 1.0 and 8.0 Å. The experimental paper reports an R value of 0.200 based on a model with individual anisotropic temperature factors (Wlodawer et al. 1984), which are not available from the PDB. Hence, the R value computed for a model with the equivalent isotropic temperature factors (B factors) with bulk solvent correction is slightly higher, 0.208, for all the observed reflections. Since the original data set does not label the reflections used in cross-validation, we randomly selected 892 (5%) reflections to form our own free R set (Brunger 1992). Before water picking was performed, the R and R free values for the partial structure are 0.245 and 0.249, respectively; after water picking, the R and R free values for the starting models are 0.215 and 0.217.
All the choices made for the MM energy functions and the minimization protocol were based on the defaults unless otherwise indicated. For all the protocols except Protocol 2, the coordinates of all the atoms were refined, while for Protocol 2 the disordered Glu7 and Met52 had to be fixed because of known issues with refining alternate conformations in CNS.
To explore the utility of the physically based energy restraints in refining low-resolution crystal structures, we also carried out a computational test in which we truncated the X-ray reflection data at a high-resolution cutoff of 2.5 Å. The truncated data set contains 1740 reflections, out of which 1666 are in the work set and 74 in the test set. Considering the fact that in the original refinement the work set contained all the experimental data, random coordinate perturbations were introduced to the initial structure except for the disorder residues in order to effectively reduce the “memory” effects of the newly created free R set by the 5PTI structure. After this randomization process, the R free value should be a more reliable indicator of the quality of the refined structures. The Cartesian components of these random perturbations had a Gaussian distribution, and 96% of them fell within the range of ±0.005Å. For the full data set, the R and R free values of the perturbed structure were almost unchanged from the starting structure for the previous runs; however, for the truncated set the R and R free values of the perturbed structure were 0.184 and 0.181, respectively.
Acknowledgments
We thank the NSF (MCB-0211639) and the NIH (GM 44974) for financial support of this research.
Footnotes
Reprint requests to: Kenneth M. Merz, Department of Chemistry, Quantum Theory Project, University of Florida, 2328 New Physics Building, P.O. Box 118435, Gainesville, FL 32611-8435, USA; e-mail: merz@qtp.ufl.edu; fax: (352) 392-8722.
Article and publication are at http://www.proteinscience.org/cgi/doi/10.1110/ps.062343206.
References
- Adams, P.D., Pannu, N.S., Read, R.J., and Brunger, A.T. 1997. Cross-validated maximum likelihood enhances crystallographic simulated annealing refinement. Proc. Natl. Acad. Sci. 94: 5018–5023. [DOI] [PMC free article] [PubMed] [Google Scholar]
- Brooks, B.R., Bruccoleri, R.E., Olafson, B.D., States, D.J., Swaminathan, S., and Karplus, M. 1983. CHARMM: A program for macromolecular energy, minimization, and dynamics calculations. J. Comput. Chem. 4: 187–217. [Google Scholar]
- Brunger, A.T. 1992. Free R-value—A novel statistical quantity for assessing the accuracy of crystal-structures. Nature 355: 472–475. [DOI] [PubMed] [Google Scholar]
- Brunger, A.T. and Adams, P.D. 2002. Molecular dynamics applied to X-ray structure refinement. Acc. Chem. Res. 35: 404–412. [DOI] [PubMed] [Google Scholar]
- Brunger, A.T., Kuriyan, J., and Karplus, M. 1987. Crystallographic R-factor refinement by molecular-dynamics. Science 235: 458–460. [DOI] [PubMed] [Google Scholar]
- Brunger, A.T., Karplus, M., and Petsko, G.A. 1989. Crystallographic refinement by simulated annealing—Application to crambin. Acta Crystallogr. A 45: 50–61. [Google Scholar]
- Brunger, A.T., Krukowski, A., and Erickson, J.W. 1990. Slow-cooling protocols for crystallographic refinement by simulated annealing. Acta Crystallogr. A 46: 585–593. [DOI] [PubMed] [Google Scholar]
- Brunger, A.T., Adams, P.D., Clore, G.M., DeLano, W.L., Gros, P., Grosse-Kunstleve, R.W., Jiang, J.S., Kuszewski, J., Nilges, M., and Pannu, N.S., et al. 1998. Crystallography & NMR system: A new software suite for macromolecular structure determination. Acta Crystallogr. D Biol. Crystallogr. 54: 905–921. [DOI] [PubMed] [Google Scholar]
- Case, D.A., Darden, T.A., Cheatham III, T.E., Simmerling, C.L., Wang, J., Duke, R.E., Luo, R., Merz, K.M., Wang, B., and Pearlman, D.A., et al. 2004. AMBER 8. University of California, San Francisco.
- Cornell, W.D., Cieplak, P., Bayly, C.I., Gould, I.R., Merz Jr., K.M., Ferguson, D.M., Spellmeyer, D.C., Fox, T., Caldwell, J.W., and Kollman, P.A. 1995. A second generation force field for the simulation of proteins, nucleic acids, and organic molecules. J. Am. Chem. Soc. 117: 5179–5197. [Google Scholar]
- Dixon, S.L. and Merz, K.M. 1996. Semiempirical molecular orbital calculations with linear system size scaling. J. Chem. Phys. 104: 6643–6649. [Google Scholar]
- Dixon, S.L. and Merz, K.M. 1997. Fast, accurate semiempirical molecular orbital calculations for macromolecules. J. Chem. Phys. 107: 879–893. [Google Scholar]
- Engh, R.A. and Huber, R. 1991. Accurate bond and angle parameters for X-ray protein-structure refinement. Acta Crystallogr. A 47: 392–400. [Google Scholar]
- Fabiola, F., Bertram, R., Korostelev, A., and Chapman, M.S. 2002. An improved hydrogen bond potential: Impact on medium resolution protein structures. Protein Sci. 11: 1415–1423. [DOI] [PMC free article] [PubMed] [Google Scholar]
- Hawkins, G.D., Cramer, C.J., and Truhlar, D.G. 1995. Pairwise solute descreening of solute charges from a dielectric medium. Chem. Phys. Lett. 246: 122–129. [Google Scholar]
- Hawkins, G.D., Cramer, C.J., and Truhlar, D.G. 1996. Parametrized models of aqueous free energies of solvation based on pairwise descreening of solute atomic charges from a dielectric medium. J. Phys. Chem. 100: 19824–19839. [Google Scholar]
- Hendrickson, W.A. 1985. Stereochemically restrained refinement of macromolecular structures. Methods Enzymol. 115: 252–270. [DOI] [PubMed] [Google Scholar]
- Jack, A. and Levitt, M. 1978. Refinement of large structures by simultaneous minimization of energy and R factor. Acta Crystallogr. A. 34: 931–935. [Google Scholar]
- Jelsch, C., Teeter, M.M., Lamzin, V., Pichon-Pesme, V., Blessing, R.H., and Lecomte, C. 2000. Accurate protein crystallography at ultra-high resolution: Valence electron distribution in crambin. Proc. Natl. Acad. Sci. 97: 3171–3176. [DOI] [PMC free article] [PubMed] [Google Scholar]
- Jones, T.A., Zou, J.Y., Cowan, S.W., and Kjeldgaard, M. 1991. Methods for building protein models in electron density maps and the location of errors in these models. Acta Crystallogr. A 47: 110–119. [DOI] [PubMed] [Google Scholar]
- Jorgensen, W.L., Chandrasekhar, J., Madura, J.D., Impey, R.W., and Klein, M.L. 1983. Comparison of simple potential functions for simulating liquid water. J. Chem. Phys. 79: 926–935. [Google Scholar]
- Ko, T.-P., Robinson, H., Gao, Y.-G., Cheng, C.-H.C., Devries, A.L., and Wang, A.H.-J. 2003. The refined crystal structure of an eel pout type III antifreeze protein Rd1 at 0.62-Å resolution reveals structural microheterogeneity of protein and solvation. Biophys. J. 84: 1228–1237. [DOI] [PMC free article] [PubMed] [Google Scholar]
- Korostelev, A., Fenley, M.O., and Chapman, M.S. 2004. Impact of a Poisson-Boltzmann electrostatic restraint on protein structures refined at medium resolution. Acta Crystallogr. D Biol. Crystallogr. 60: 1786–1794. [DOI] [PubMed] [Google Scholar]
- Laskowski, R.A., Macarthur, M.W., Moss, D.S., and Thornton, J.M. 1993. Procheck—A program to check the stereochemical quality of protein structures. J. Appl. Crystallogr. 26: 283–291. [Google Scholar]
- Lee, T.S., York, D.M., and Yang, W.T. 1996. Linear-scaling semiempirical quantum calculations for macromolecules. J. Chem. Phys. 105: 2744–2750. [Google Scholar]
- Liu, H.Y., Elstner, M., Kaxiras, E., Frauenheim, T., Hermans, J., and Yang, W.T. 2001. Quantum mechanics simulation of protein dynamics on long timescale. Proteins 44: 484–489. [DOI] [PubMed] [Google Scholar]
- Moulinier, L., Case, D.A., and Simonson, T. 2003. Reintroducing electrostatics into protein X-ray structure refinement: Bulk solvent treated as a dielectric continuum. Acta Crystallogr. D Biol. Crystallogr. 59: 2094–2103. [DOI] [PubMed] [Google Scholar]
- Nilsson, K. and Ryde, U. 2004. Protonation status of metal-bound ligands can be determined by quantum refinement. J. Inorg. Biochem. 98: 1539–1546. [DOI] [PubMed] [Google Scholar]
- Nilsson, K., Lecerof, D., Sigfridsson, E., and Ryde, U. 2003. An automatic method to generate force-field parameters for hetero-compounds. Acta Crystallogr. D Biol. Crystallogr. 59: 274–289. [DOI] [PubMed] [Google Scholar]
- Nilsson, K., Hersleth, H.P., Rod, T.H., Andersson, K.K., and Ryde, U. 2004. The protonation status of compound II in myoglobin, studied by a combination of experimental data and quantum chemical calculations: Quantum refinement. Biophys. J. 87: 3437–3447. [DOI] [PMC free article] [PubMed] [Google Scholar]
- Pannu, N.S. and Read, R.J. 1996. Improved structure refinement through maximum likelihood. Acta Crystallogr. A 52: 659–668. [Google Scholar]
- Ponder, J.W. and Case, D.A. 2003. Force fields for protein simulations. Adv. Protein Chem. 66: 27–85. [DOI] [PubMed] [Google Scholar]
- Priestle, J.P. 2002. Improved dihedral-angle restraints for protein structure refinement. J. Appl. Crystallogr. 36: 34–42. [Google Scholar]
- Read, R.J. 1986. Improved Fourier coefficients for maps using phases from partial structures with errors. Acta Crystallogr. A 42: 140–149. [Google Scholar]
- Read, R.J. 1990. Structure-factor probabilities for related structures. Acta Crystallogr. A 46: 900–912. [Google Scholar]
- Ryde, U. and Nilsson, K. 2003a. Quantum chemistry can locally improve protein crystal structures. J. Am. Chem. Soc. 125: 14232–14233. [DOI] [PubMed] [Google Scholar]
- Ryde, U. and Nilsson, K. 2003b. Quantum refinement—A combination of quantum chemistry and protein crystallography. J. Mol. Struct. 632: 259–275. [Google Scholar]
- Ryde, U., Olsen, L., and Nilsson, K. 2002. Quantum chemical geometry optimizations in proteins using crystallographic raw data. J. Comput. Chem. 23: 1058–1070. [DOI] [PubMed] [Google Scholar]
- Schiffer, C. and Hermans, J. 2003. Promise of advances in simulation methods for protein crystallography: Implicit solvent models, time-averaging refinement, and quantum mechanical modeling. Methods Enzymol. 374: 412–461. [DOI] [PubMed] [Google Scholar]
- Schiffer, C.A. and van Gunsteren, W.F. 1999. Accessibility and order of water sites in and around proteins: A crystallographic time-averaging study. Protein Struct. Funct. Genet. 36: 501–511. [PubMed] [Google Scholar]
- Schiffer, C.A., Gros, P., and Vangunsteren, W.F. 1995. Time-averaging crystallographic refinement—Possibilities and limitations using α-cyclodextrin as a test system. Acta Crystallogr. D Biol. Crystallogr. 51: 85–92. [DOI] [PubMed] [Google Scholar]
- Still, W.C., Tempczyk, A., Hawley, R.C., and Hendrickson, T. 1990. Semianalytical treatment of solvation for molecular mechanics and dynamics. J. Am. Chem. Soc. 112: 6127–6129. [Google Scholar]
- Tronrud, D.E., Teneyck, L.F., and Matthews, B.W. 1987. An efficient general-purpose least-squares refinement program for macromolecular structures. Acta Crystallogr. A 43: 489–501. [Google Scholar]
- Tsui, V. and Case, D.A. 2001. Theory and applications of the generalized Born solvation model in macromolecular simulations. Biopolymers 56: 275–291. [DOI] [PubMed] [Google Scholar]
- van der Vaart, A., Suarez, D., and Merz, K.M. 2000. Critical assessment of the performance of the semiempirical divide and conquer method for single point calculations and geometry optimizations of large chemical systems. J. Chem. Phys. 113: 10512–10523. [Google Scholar]
- Wang, J., Cieplak, P., and Kollman, P.A. 2000. How well does a restrained electrostatic potential (RESP) model perform in calculating conformational energies of organic and biological molecules? J. Comput. Chem. 21: 1049–1074. [Google Scholar]
- Weis, W.I., Brunger, A.T., Skehel, J.J., and Wiley, D.C. 1990. Refinement of the influenza-virus hemagglutinin by simulated annealing. J. Mol. Biol. 212: 737–761. [DOI] [PubMed] [Google Scholar]
- Wlodawer, A., Walter, J., Huber, R., and Sjolin, L. 1984. Structure of bovine pancreatic trypsin inhibitor. Results of joint neutron and X-ray refinement of crystal form II. J. Mol. Biol. 180: 301–329. [DOI] [PubMed] [Google Scholar]
- Yang, W.T. 1991. Direct calculation of electron-density in density functional theory. Phys. Rev. Lett. 66: 1438–1441. [DOI] [PubMed] [Google Scholar]
- Yang, W.T. and Lee, T.S. 1995. A density-matrix divide-and-conquer approach for electronic-structure calculations of large molecules. J. Chem. Phys. 103: 5674–5678. [Google Scholar]
- Yu, N., Yennawar, H.P., and Merz, K.M. 2005. Refinement of protein crystal structures using energy restraints derived from linear-scaling quantum mechanics. Acta Crystallogr. D Biol. Crystallogr. 61: 322–332. [DOI] [PubMed] [Google Scholar]
- Yu, N., Hayik, S.A., Wang, B., Liao, N., Reynolds, C.H., and Merz, K.M. 2006. Assigning the protonation states of the key aspartates in β-secretase using QM/MM X-ray structure refinement. J. Chem. Theory Comput. 2: 1057–1069. [DOI] [PMC free article] [PubMed] [Google Scholar]


