Abstract
The SPRY domain was identified originally as a sequence repeat in the dual-specificity kinase splA and ryanodine receptors and subsequently found in many other distinct proteins, including more than 70 encoded in the human genome. It is a subdomain of the B30.2/SPRY domain and is believed to function as a protein–protein interaction module. Three-dimensional structures of several B30.2/SPRY domain–containing proteins have been reported recently: murine SSB-2 in solution by NMR spectroscopy, a Drosophila SSB (GUSTAVUS), and human PRYSPRY protein by X-ray crystallography. The three structures share a core of two antiparallel β-sheets for the B30.2/SPRY domain but show differences located mainly at one end of the β-sandwich. Analysis of SSB-2 residues required for interactions with its intracellular ligands has provided insights into B30.2/SPRY binding specificity and identified loop residues critical for the function of this domain. We have investigated the backbone dynamics of SSB-2 by means of Modelfree analysis of its backbone 15N relaxation parameters and carried out coarse-grained dynamics simulation of B30.2/SPRY domain–containing proteins using normal mode analysis. Translational self-diffusion coefficients of SSB-2 measured using pulsed field gradient NMR were used to confirm the monomeric state of SSB-2 in solution. These results, together with previously reported amide exchange data, highlight the underlying flexibility of the loop regions of B30.2/SPRY domain–containing proteins that have been shown to be important for protein–protein interactions. The underlying flexibility of certain regions of the B30.2/SPRY domain–containing proteins may also contribute to some apparent structural differences observed between GUSTAVUS or PRYSPRY and SSB-2.
Keywords: backbone dynamics, conformational exchange, normal mode analysis, NMR, 15N relaxation, SOCS protein, B30.2/SPRY domain, translational diffusion
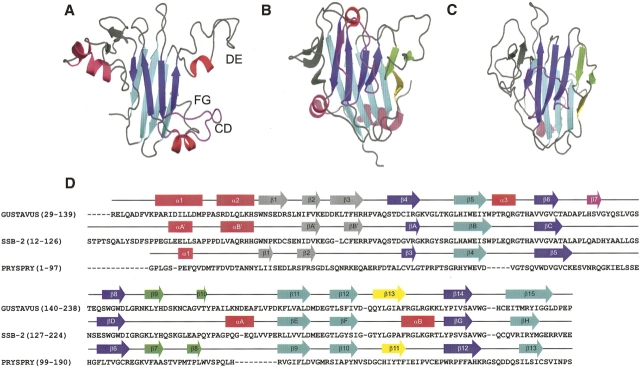
The SPRY domain–containing SOCS box protein 2 (SSB-2) is one of four proteins (SSB-1 to -4) that have a central region of homology termed the SPRY domain and share a C-terminal SOCS box motif with other members of the SOCS protein family (Hilton et al. 1998). The SPRY domain was identified originally as a sequence repeat in the dual-specificity kinase splA and ryanodine receptors (Ponting et al. 1997). Currently, >300 SPRY domains can be found in the SMART database (Letunic et al. 2004), with >70 encoded in the human genome. More than half of the known SPRY domains have a conserved N-terminal extension (PRY domain), which, together with the SPRY domain, creates the B30.2 domain (Henry et al. 1997). The three-dimensional structures of three B30.2/SPRY domain–containing proteins have recently become available. The structure of murine SSB-2 was determined in solution by NMR spectroscopy (Masters et al. 2006), while the structure of the Drosophila SSB-1/-4 homolog (GUSTAVUS) in complex with elongins B and C was determined by X-ray crystallography (Woo et al. 2006). The structure of PRYSPRY was also determined by X-ray crystallography; this protein is encoded in the human gene 19q13.4.1 and appears most similar to the tripartite motif (TRIM) protein RFPL1 (Grütter et al. 2006). Ribbon diagrams of these B30.2/SPRY domain–containing proteins together with sequence alignments and experimentally observed secondary structures are shown in Figure 1.
Figure 1.
Ribbon diagrams of B30.2/SPRY domain–containing proteins SSB-2 (A), GUSTAVUS (B), and PRYSPRY (C). The CD loop of SSB-2 and the corresponding regions of GUSTAVUS and PRYSPRY are highlighted in purple. Two additional short β-strands observed for GUSTAVUS and PRYSPRY (corresponding to regions within the DE loop of SSB-2) are highlighted in green. The other short β-strand observed in GUSTAVUS and PRYSPRY is yellow. (D) Sequence alignments of SSB-2, GUSTAVUS, and PRYSPRY with experimentally observed secondary structures sketched on top of the sequences with the same color schemes used as in the ribbon diagrams (A–C). This diagram was created using the program PyMOL (DeLano 2004; http://pymol.sourceforge.net).
SSB-2 has been shown to be important for the maintenance of platelet count and blood urea nitrogen levels in the mouse (Masters et al. 2005). The presence of the C-terminal SOCS box motif suggests that SSB-2 may function as an E3 ubiquitin ligase, with the central B30.2/SPRY domain determining the substrates for ubiquitination. The B30.2/SPRY domains of all four SSBs, as well as those of both RanBP9 and RanBP10, have been shown to interact with c-Met, the hepatocyte growth factor (HGF) receptor (Wang et al. 2005). In addition, SSB-1, SSB-2, and SSB-4, but not SSB-3, interact with prostate apoptosis response protein-4 (Par-4) (Masters et al. 2006). Par-4 is up-regulated in prostate cancer cells undergoing apoptosis and primarily appears to sensitize cells to various apoptotic stimuli such as UV, cytokines, hormone deprivation, and cytotoxins (Sells et al. 1994; Gurumurthy and Rangnekar 2004). Structurally, the B30.2/SPRY domain has also been shown to mediate protein–protein interactions by virtue of conserved residues in the loop regions of its structure (Masters et al. 2006). While all three structures show a broadly similar β-sandwich core for the B30.2/SPRY domain, there are obvious differences (Fig. 1). These include regions where SSB-2 exhibits extended loops (some of which contain helices) but GUSTAVUS and PRYSPRY display additional β-strands packed alongside the central β-sandwich core. Some of these loop regions in SSB-2 have been shown to be important for protein binding (Masters et al. 2006). It was also observed that residues forming one distinctive β-strand in GUSTAVUS (observed as an extended loop in PRYSPRY) correspond to residues in SSB-2 proximal to those with missing resonances as a consequence of underlying conformational exchange at the intermediate timescale.
Protein dynamics are critical for various biological functions and may occur over a wide range of timescales and motional amplitudes (Frauenfelder et al. 2001; Eisenmesser et al. 2005). NMR relaxation measurements provide a powerful means for characterizing molecular dynamics and have been used extensively to characterize protein dynamics in different biological systems (Wand 2001; Mittermaier and Kay 2006). Complementary to protein dynamics probed by NMR relaxation measurements, coarse-grained normal mode analysis (NMA) has been applied to predict biologically relevant motions of proteins by their structure-encoded collective dynamics (Bahar and Rader 2005; Liu et al. 2006). The normal modes of a protein describe the collective displacements of its atoms near their equilibrium positions (physical intrinsic modes of motion encoded in a protein structure). For the study of collective dynamics and molecular elasticity, coarse-grained dynamics provides theoretical precision comparable to NMR dynamics and with superior time and size scales compared with NMR relaxation measurements and explicit molecular simulations (Temiz et al. 2004).
Preliminary 15N relaxation parameters of SSB-2 have indicated that some parts of the molecule, including loops important for its binding interactions with c-Met and Par-4 (Masters et al. 2006), may be involved in large amplitude motions on the picosecond-to-nanosecond timescale. In this study we have investigated the dynamical properties of SSB-2 in solution by carrying out Modelfree analysis of the 15N relaxation parameters. 15N relaxation dispersion measurements were also carried out to examine potential motions at submillisecond-to-millisecond timescales. As there were no experimentally measured dynamics data available for GUSTAVUS and PRYSPRY, coarse-grained dynamics simulations using normal mode analysis with an elastic network model were performed based on the three-dimensional structures of SSB-2, GUSTAVUS, and PRYSPRY to probe their intrinsic and collective dynamics. The local intrinsic elasticity and regional fluctuations of these B30.2/SPRY domain–containing proteins were identified and compared.
Results
Translational diffusion of SSB-2
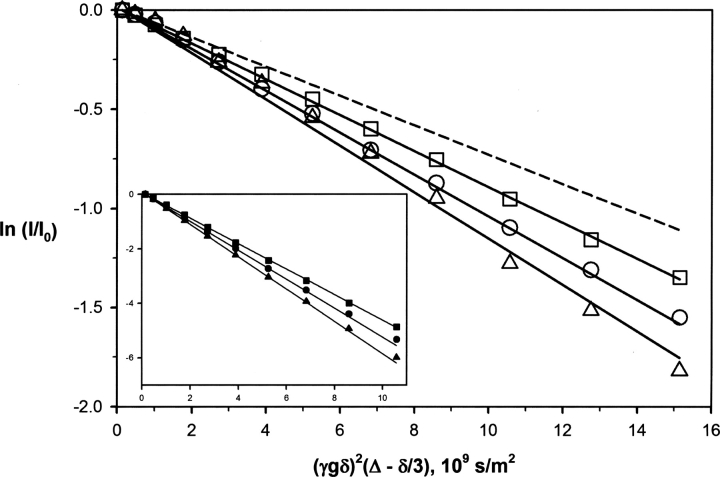
In order to confirm the monomeric state of SSB-2 in solution, translational diffusion coefficients of SSB-2 at several different solution conditions were measured. Experimentally measured values were converted to values at a common reference condition (a buffer solution of H2O containing 5% 2H2O with SSB-2 concentration of 20 μM) using Equation 2 (see Materials and Methods) in order to facilitate a direct comparison of translational diffusion coefficients at different solution conditions (Fig. 2; Table 1). The translational diffusion coefficients for SSB-2 were found to be independent of protein concentration over the range of 20 μM to 500 μM and of a value comparable to other monomeric proteins of a similar size (Krishnan 1997; Viles et al. 2001).
Figure 2.
Molecular translational diffusion induced signal attenuation in the presence of bipolar pulsed field gradients. Logarithmic (normalized) intensities of SSB-2 at 0.02 mM (▵) and 0. 35 mM (○) in H2O buffer and at 0.50 mM in 2H2O buffer (□) versus the strength of diffusion encoding, γ2 g 2δ2(Δ − δ/3). (Inset) Corresponding logarithmic intensities of EDTA signals from samples with SSB-2 concentrations of 0.02 mM (▴) and 0.35 mM (•) in H2O buffer, and 0.50 mM in 2H2O buffer (▪). As expected, they attenuated much more quickly than the protein signals. All the lines represent the results of nonlinear regression to Equation 1. The dashed line represents the calculated attenuation of a 25% increase in the translational diffusion coefficient of SSB-2 measured at 0.02 mM in H2O buffer, which corresponds to the change of translational diffusion coefficient for a spherical molecule upon dimerization in the ideal situation (Teller et al. 1979).
Table 1.
Translational diffusion coefficients of SSB-2 measured at 22°C by PFGNMR
15N relaxation data and overall rotational motion of SSB-2
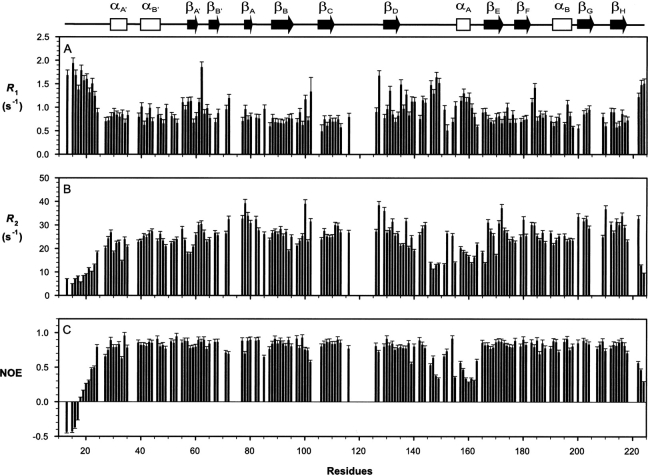
After the exclusion of missing/unassigned and overlapped resonances, R 1, R 2, and steady-state 15N-{1H} NOE values were measured at 60.8 MHz for a total of 157 of the possible 197 backbone amides of SSB-2 (12–224), giving averaged values of 0.92 ± 0.30 sec−1, 23.91 ± 6.90 sec−1, and 0.73 ± 0.25 for R 1, R 2, and steady-state 15N-{1H} NOE, respectively (Fig. 3; representative R 1 and R 2 decay curves are shown in Supplemental Fig. S1). Corresponding averaged values for the eight-strand β-sandwich core are 0.76 ± 0.14 sec−1, 27.40 ± 4.86 sec−1, and 0.83 ± 0.05, respectively. Of these 157 residues, 121 satisfy the criteria of steady-state 15N-{1H} NOE ≥ 0.6 and |(T 1/T 2) −〈T 1/T 2〉| ≤ SD, indicating that those nuclear spins are less likely to participate in either slow internal motion or chemical/conformational exchange processes (Kay et al. 1989; Yao et al. 1998). This gave an initial estimation of the isotropic global correlation time of 18.4 ± 1.4 nsec. From the structure of SSB-2 (closest-to-mean), the principal moments of its inertia tensor were calculated to be 1:00:0.774:0.675, suggesting that an asymmetric model of global reorientation may be more appropriate. Relaxation data were therefore analyzed with a fully anisotropic rotational model using the program TENSOR2 (Dosset et al. 2000). Three principal components of the anisotropic rotational diffusion tensor were estimated to be Dxx = 0.68 ± 0.03, Dyy = 0.91 ± 0.04, and Dzz = 1.20 ± 0.05 × 10⁷ sec−1 (corresponding to an effective correlation time of τm, 17.9 nsec) using a group of 90 backbone amides whose R 1 and R 2 values satisfy both steady-state 15N-{1H} NOE ≥ 0.65 and |(T 1/〈T 1〉) − (T 2/〈T 2〉)| ≤ 1.5 SD (Tjandra et al. 1995). As expected, the axis of maximum inertia approximately coincides with that of slowest diffusion, and the axis of minimal inertia with that of fastest diffusion.
Figure 3.
Backbone 15N relaxation parameters of SSB-2 (12–224) measured at 22°C and 15N frequency 60.81 MHz. (A) R 1, (B) R 2, and (C) steady-state 15N-{1H} NOE. A schematic representation of the SSB-2 secondary structure elements is shown at the top.
Modelfree parameters and millisecond timescale motion
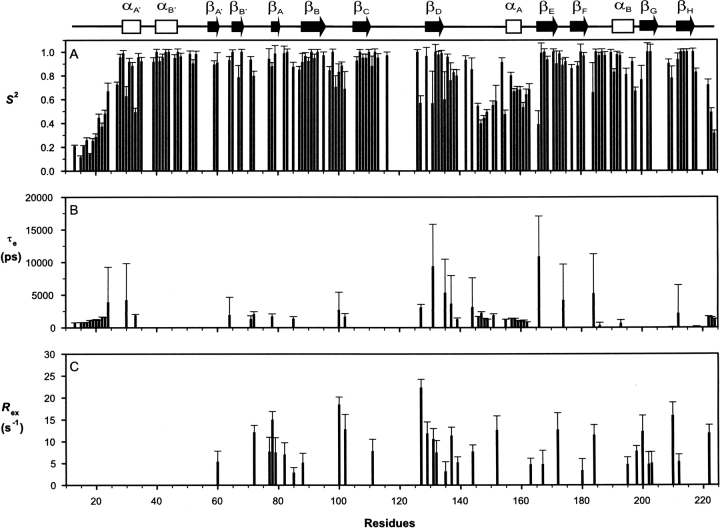
Using a fully anisotropic model for the global rotational reorientation motion of SSB-2, Modelfree parameters (S 2, τf/τs, and R ex) of individual residues were obtained from fits of the 15N relaxation data (R 1, R 2, and steady-state 15N-{1H} NOE) for a total of 137 residues (Fig. 4). The numbers of residues fitted satisfactorily to each combination of Modelfree parameters were 67 (S 2), 17 (S 2 and τf), 18 (S 2 and R ex), 17 (S 2, τf and R ex), and 18 (S f 2, S s 2, and τs), respectively. Averaged S 2 values over the central β-sandwich core (β-strands A–H), the B30.2/SPRY domain (residues 75–224), loop DE (residues 135–165), and loop FG (containing a well-defined two-turn helix, residues 183–199) are 0.93 ± 0.12, 0.84 ± 0.18, 0.67 ± 0.16, and 0.89 ± 0.13, respectively. The corresponding value for loop CD (residues 111–128, which contains a fragment with missing assignments) is 0.89 ± 0.17 (over six backbone amides).
Figure 4.
Modelfree parameters of SSB-2 (12–224). (A) The order parameter, S 2; (B) effective internal correlation time, τe; (C) apparent chemical/conformational exchange contribution R ex to the transverse relaxation rate R 2.
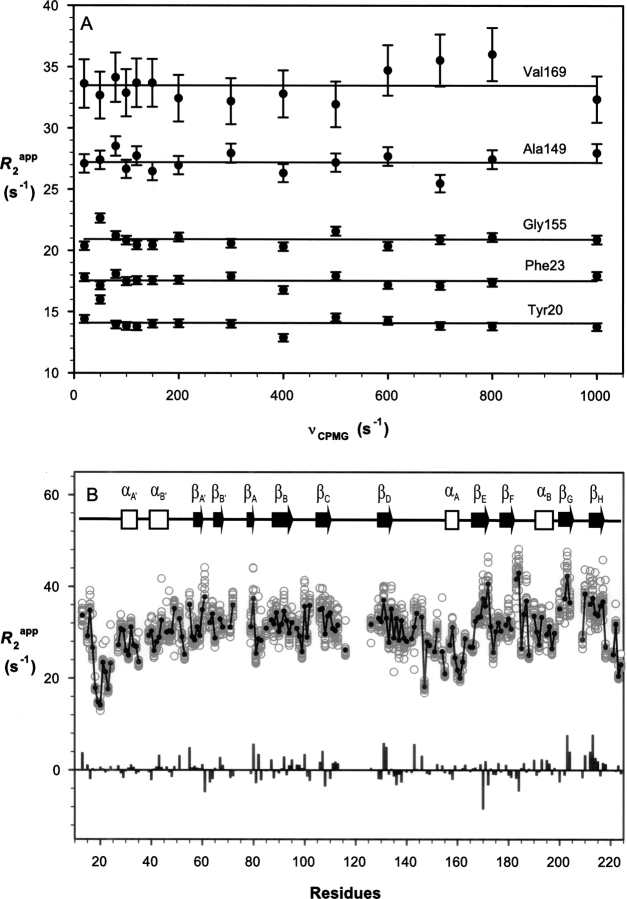
Relaxation dispersion values of R 2 app for several residues measured as a function of the CPMG field strengths are shown in Figure 5A. Figure 5B shows the distribution of R 2 app values over the range of the CPMG field strengths measured. Two of the 1H–15N HSQC spectra obtained at CPMG field strengths of 50 and 1000 sec−1 and the difference spectrum of the two as well as the reference spectrum used to calculate the R 2 app values are shown in Supplemental Figure S2. While there are fluctuations in terms of R 2 app distribution against the CPMG field strengths, particularly for residues with large R 2 app values, the lack of significant and consistent changes in R 2 app values with the CPMG field strength indicates there are no significant regions of SSB-2 undergoing conformational exchange at submillisecond-to-millisecond timescales under the present conditions.
Figure 5.
15N relaxation dispersion of SSB-2 (12–224) measured at CPMG field strengths ranging from 20 to 1000 sec−1. (A) R 2 app as a function of the CPMG field strengths for residues Tyr20, Phe23, Ala149, Gly155, and Val169. (B) Distribution of R 2 app values as measured at CPMG field strengths ranging from 20 to 1000 sec−1 versus SSB-2 residue number (○) with the solid line connecting consecutive residues through their averaged values (•) of R2 app. Values of ΔR 2 app = R 2 app (20 sec−1) − R 2 app (1000 sec−1) are shown as the bar chart.
Normal mode analysis of elasticity and fluctuations
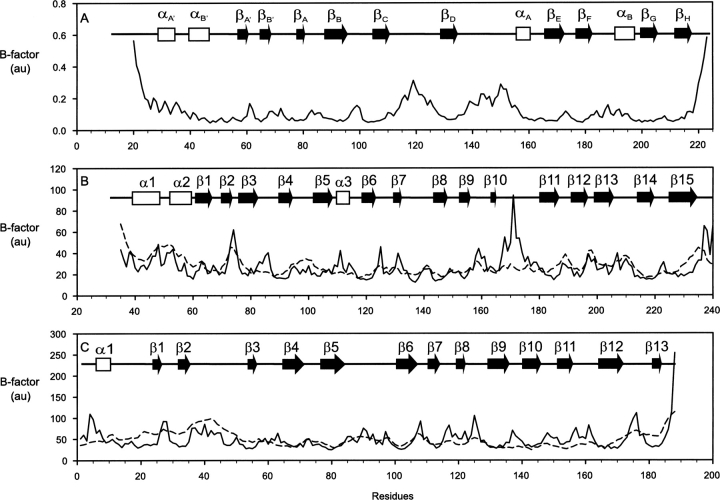
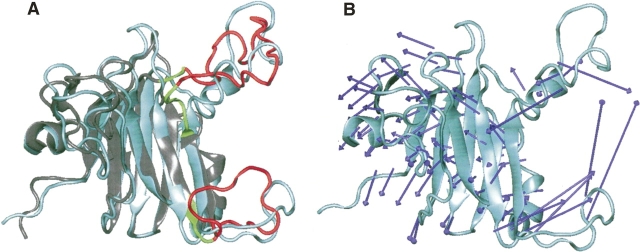
The collective dynamical fluctuations and flexibility of the B30.2/SPRY domain–containing proteins SSB-2, GUSTAVUS, and PRYSPRY are indicated by temperature factors and shown in Figure 6. Apart from the N and C termini, for SSB-2, the largest magnitude fluctuations are found in loops CD (residues 111–128) and DE (residues 135–165). The latter (loop DE) also agrees in principle with the results from NMR relaxation measurements, which show that this loop is flexible. For GUSTAVUS and PRYSPRY, where experimental B-factors are available, good agreement is generally observed between theoretical predictions and experimental values, with a few exceptions in some loop regions, for example, the loop between strands 10 and 11 of GUSTAVUS (Fig. 6B,C). The results of a dynamical subdomain analysis within SSB-2 at different normal modes indicates that possible internal subdomain motions also take place around loops CD and DE (Fig. 7). Using the DynDom algorithm, a fixed internal subdomain (formed dynamically as a rigid internal subdomain by residues with the least probability of motion) is identified to consist of ∼130 residues (residues 46–110, 135–138, 163–219). In contrast, the motional internal subdomain consists mainly of loops CD and DE, which dominate potential conformational changes and structural transitions. These motional internal subdomains typically undergo rotation (>20° between different models) rather than translation. The mechanical bending residues (key residues responsible for potential conformational changes) are 110–111, 134–135/137–138, and 162–163. Finally, high-frequency modes of motion also indicate potential uncorrelated motion in loop DE rather than in loop CD.
Figure 6.
Relative residue fluctuations (temperature factors, solid lines) for the overall normal modes of motions for SSB-2 (A), GUSTAVUS (B), and PRYSPRY (C). Schematic diagrams of secondary structure elements of each molecule are shown inside each panel. For comparison, the experimental B-factors of Cα values are shown as dashed lines for GUSTAVUS and PRYSPRY.
Figure 7.
(A) Dominant motion and possible dynamical internal subdomains of SSB2. (Cyan) The reference structure as of closest-to-mean of SSB-2; (gray) a random structure (i.e., model 10); (red) the motional internal subdomain; (green) the bending residues shown to be important for internal subdomain motion and SSB-2 interactions with c-Met and Par-4. (B) Force vectors (blue arrows, indicating direction and amplitude of acting forces on residues) of the dominant mode motion from normal mode analysis of SSB2, where cyan indicates the closest-to-mean state of SSB-2. These diagrams were prepared using Visual Molecular Dynamics (VMD) (Humphrey et al. 1996).
Discussion
SSB-2 is monomeric in solution
PRYSPRY, a B30.2 domain–containing protein, has been reported to form dimers in solution, in a concentration-dependent manner, and the structure was determined by X-ray crystallography as two nearly identical dimers (Grütter et al. 2006). Translational diffusion coefficients of PRYSPRY calculated from its X-ray structure using the program HYDRONMR (de la Torre et al. 2000) give values of 0.992 × 10⁻¹⁰ m2/sec and 0.718 × 10⁻¹⁰ m2/sec at 22°C for the monomer and dimer, respectively, representing a decrease of 27.6% of its translational diffusion coefficient upon dimerization. In contrast, translational diffusion coefficients for SSB-2 were independent of concentration over the range of 0.02 mM to 0.5 mM, indicating that SSB-2 exists as a monomer under the present conditions (Nesmelova et al. 2002). Furthermore, an effective rotational correlation time of 17.9 nsec at 22°C (corresponding to a value of 16.9 nsec at 25°C) obtained from 15N relaxation measurements is also in excellent agreement with what would be expected for a 226-residue construct in monomeric form (Maciejewski et al. 2000).
Residues in loop CD of SSB-2 exhibiting intermediate conformational exchange
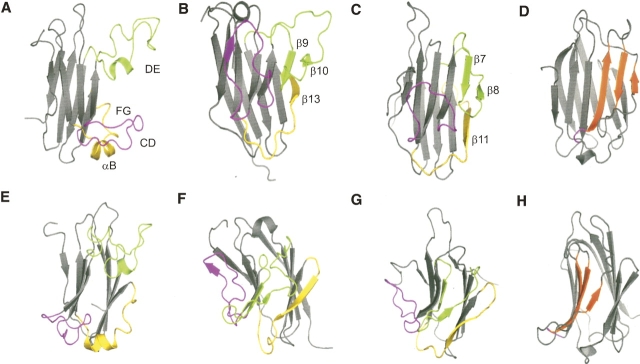
Among those backbone amides for which assignments were not made owing to cross-peak absence, there is a seven-residue fragment (119–125) within loop CD (residues 111–128) located immediately downstream from the β-strand 7 in the GUSTAVUS structure (Fig. 8). Our SSB-2 construct was soluble and stable only within narrow ranges of temperature and pH (temperature >22°C and pH <6.5 causing precipitation of SSB-2). 15N HSQC spectra acquired at 5°C and 15°C (500 MHz) and at 800 MHz (22°C) did not give rise to any additional peaks. Furthermore, spectra recorded using the CLEANEX sequence (Hwang et al. 1998), designed for the detection of amides undergoing rapid solvent exchange, did not recover additional peaks in the HSQC spectrum (Supplemental Fig. S3). This suggests that the cross-peak absence of those backbone amides is not a consequence of protons exchanging rapidly with solvent. The explanation for the missing cross-peaks in this seven-residue fragment is, therefore, likely to be conformational exchange on an intermediate timescale, as frequently encountered for NMR studies of protein in solution (Seeliger et al. 2005).
Figure 8.
Ribbon diagrams showing the β-sheet core of the B30.2/SPRY domain–containing proteins SSB-2 (residues 72–220, A,E), GUSTAVUS (residues 82–238, B,F), and PRYSPRY (residues 45–188, C,G), with characteristic loop/β-strand regions highlighted and labeled. E–G are the same as A–C after a near 90° rotation around the vertical axis, to show the relative position of the loop CD (SSB-2) and corresponding region of GUSTAVUS and PRYSPRY against the β-sandwich core. (D,H) Ribbon diagrams of galectin-3 (PDB 1A3K) (Seetharaman et al. 1998) with the short loop corresponding to loop CD in SSB-2 highlighted in purple as in A–C. Strands involved in lactose and N-acetyllactosamine binding are highlighted in orange. This diagram was created using the program PyMOL (DeLano 2004; http://pymol.sourceforge.net).
As a consequence, the geometry of loop CD (Fig. 8A, highlighted in purple) of SSB-2 is largely undefined in its solution structure, whereas the geometry described in the X-ray crystal structure of GUSTAVUS (Fig. 8B,E) might represent one of its preferred conformers that is favored by crystal packing (Woo et al. 2006). This is also supported by the observation that this short β-strand sitting on top of the central β-sandwich in GUSTAVUS is only part of an extended loop in PRYSPRY and is located farther apart from the central β-sandwich core (Fig. 8C,G) than in GUSTAVUS (Fig. 8B,F). Interestingly, this side of the β-sandwich, fully occupied by one of its loops containing the additional β-strand 7 in GUSTAVUS (Woo et al. 2006) (Fig. 8B,F), corresponds to previously identified carbohydrate binding sites of gallectin-3 (Seetharaman et al. 1998) and congerin I (Shirai et al. 1999). Gallectin-3 and congerin I have similar structures and folding topologies to the B30.2/SPRY proteins (even though they are not members of the B30.2/SPRY domain–containing protein family), but lack the extended loop/β-strand present in SSB-2, PRYSPRY, and GUSTAVUS (Fig. 8A–D, highlighted in pink). Both gallectin-3 and congerin I bind lactose and N-acetyllactosamine via their primary carbohydrate binding site corresponding to strands 8, 9, and 10 in GUSTAVUS and strands 6, 7, and 8 in PRYSPRY, respectively (Fig. 8D,H) (Seetharaman et al. 1998; Shirai et al. 1999). This is facilitated by the fact that neither of these proteins has a loop obstructing this face of the β-sheet, in contrast to GUSTAVUS and PRYSPRY. Indeed, some residues (Y141, H142, Q143, Q151, and Y152) shown to be important for binding c-Met and Par-4 are located in the corresponding region of SSB-2 (Masters et al. 2006), even though two of three β-strands (Figs. 1, 8, highlighted in green) were not observed for SSB-2 in solution. The ability of loop CD in SSB-2 to adopt multiple conformations in solution indicates that this side of the β-sandwich is also potentially available for protein binding in SSB-2.
Large amplitude motion of loop DE of SSB-2 on the picosecond-to-nanosecond timescale
To extract residue-specific motional parameters using the model-free formalism, an initial estimation of molecular overall reorientation is commonly obtained from experimentally measured R 1 and R 2 values, together with the structure if an asymmetric rotational diffusion model is considered to be appropriate. The global rotational diffusion tensor model estimated from the closest-to-mean structure may not be as representative of backbone amides from less well-defined loop regions as it is for those in the core of the molecule, as is likely to be the case for SSB-2. This may, therefore, induce errors in apparent R ex terms in the Modelfree analysis (Pawley et al. 2001). Fortunately, effects on the order parameters, S2, are likely to be less significant when compared with R ex, as it has been shown previously that backbone order parameters derived from anisotropic model are only marginally different from those obtained using an isotropic rotational diffusion tensor model (Tjandra et al. 1996).
One of the differences between the solution structure of SSB-2 and those of GUSTAVUS or PRYSPRY occurs in loop DE of SSB-2 (Fig. 8A, highlighted in green), which contains critical residues for SSB2 interaction with c-Met and Par-4. In SSB-2, loop DE was observed as an extended loop containing a transient single turn of helix (present in 12 of 20 final structures and with backbone amides showed relatively lower-order parameters, S 2). In contrast, GUSTAVUS and PRYSPRY were found to have two additional short β-strands packed along the side of the central β-sandwich (Fig. 8B,C). Among those three β-strands that were absent from SSB-2 (9, 10, and 13 in GUSTAVUS, and 7, 8, and 11 in PRYSPRY), only several residues analogous to strand 9 of GUSTAVUS (or strand 7 of PRYSPRY) are weakly consistent with a β-strand, but the characteristic cross-strand NOE pattern was not observed. Furthermore, for SSB-2 in solution, faster amide exchange rates were observed for residues corresponding to the positions of these two additional β-strands in comparison with β-strands in the central β-sandwich. Low backbone order parameters (similar to those observed for the N and C termini of the molecule), particularly for residues containing the outermost β-strand (corresponding to strand 10 in GUSTAVUS and strand 8 in PRYSPRY, respectively), have an averaged S 2 value of 0.50 ± 0.07 (over residues 146–152), indicating large amplitude motion at the picosecond-to-nanosecond timescale. This large amplitude motion within loop DE may contribute to the observed structural differences between SSB-2 and GUSTAVUS or PRYSPRY.
Dynamics of B30.2/SPRY domain–containing proteins
Normal mode analysis indicates that conformational changes in their respective loops dominate the dynamics of B30.2/SPRY domain–containing proteins. While there is good agreement between theoretical predictions and experimental values in general for GUSTAVUS and PRYSPRY (Fig. 6B,C), several local regions within the molecules show underlying significant noncollective or uncorrelated internal motions. For example, residues in GUSTAVUS corresponding to loop DE in SSB-2 show pronounced large amplitude of fluctuations (Fig. 6B, loop between strands 10 and 11). This dynamic property of GUSTAVUS agrees in principle with the findings from the backbone dynamics of loop DE in SSB-2 obtained from NMR relaxation analysis (see above), indicating that this part of the molecule may be inherently flexible. This observation is also in line with a recent study of the functional dynamics of a PDZ binding domain using normal mode analysis, where good agreement between normal mode analysis and NMR data was observed (De Los Rios et al. 2005). The dominant mode of motions in SSB-2 (Fig. 7) shows that loops CD and DE could move toward each other. As mentioned earlier, loop CD of SSB-2 adopts multiple conformations in solution, suggesting that loop CD in SSB-2 could shift close to positions seen in GUSTAVUS and PRYSPRY to be near its β-sandwich core. In addition, high-frequency modes of motion also indicate that the uncorrelated motion is likely to occur in loop DE rather than loop CD.
Multiple sequence alignment of loops CD and DE of SSB-2 with corresponding regions of GUSTAVUS, PRYSPRY, and six other representative members of the B30.2/SPRY domain–containing protein family is given in Supplemental Figure S4. It is clear that the sequence similarity in this region among members of the B30.2/SPRY family (except for SSB-2 and GUSTAVUS) is quite low. Whether the flexible nature of B30.2/SPRY proteins reported here represents a common feature of B30.2/SPRY domain–containing proteins remains to be determined.
The other difference between SSB-2, GUSTAVUS, and PRYSPRY is the orientation of the N terminus in relation to the β-sandwich core of the domain. For both GUSTAVUS and PRYSPRY, the β-strands in the N terminus pack alongside the β-sandwich core, although this is somewhat distorted. In contrast, these strands are not as closely packed with the β-sandwich core in SSB-2 (Fig. 1). Unfortunately, unambiguous constraints were insufficient to better define the relative orientation between the N terminus and the SPRY domain of SSB-2. Both order parameters, S 2 (Fig. 4A), and the temperature factors from normal mode analysis (Fig. 6A) of SSB-2 indicate an absence of significant motion between the N-terminal region and the central core of the domain. This implies that the relative orientation between these two regions may be closer than presented in Figure 1A.
In summary, SSB-2 exists in solution as a monomer, and its backbone dynamics indicate that one of its extended loops in solution (loop DE) exhibits large amplitude motions on the picosecond-to-nanosecond timescale. Normal mode analysis has indicated that the corresponding region in GUSTAVUS also has extensive noncollective or uncorrelated internal motions. Together, these data suggest that the B30.2/SPRY domains contain regions of inherent flexibility. As a consequence of residues within the loop undergoing conformational/chemical exchange on the intermediate timescale, loop CD in SSB-2 may also have the potential to adopt multiple conformations relative to the central β-sandwich core of the SPRY domain. Flexibility of some loops appears to be a key feature of B30.2/SPRY domain–containing proteins and may facilitate their ability to interact with different partners.
Materials and methods
Sample preparation
The expression and purification of SSB-2 (12–224) used for structural and dynamics studies have been described previously (Yao et al. 2005). All SSB-2 samples were in H2O containing 5% 2H2O, 10 mM sodium phosphate, 50 mM sodium chloride, 2 mM EDTA, and 0.02% (w/v) sodium azide (pH 7.0), except for the sample used to identify slowly exchanging backbone amides, which was prepared in 100% 2H2O in the same buffer conditions.
Translational diffusion measurements
Translational self-diffusion coefficients of SSB-2 were measured on several samples used for the structural and dynamics studies at different solution conditions on a Bruker DRX600 spectrometer at 22°C. Details of the pulsed field gradient strength calibration, the pulse sequence used, and the data analysis procedures have been described previously (Yao et al. 2000a). In brief, a series of 12 diffusion-weighted 1D spectra was recorded in a 2D manner using gradient pulses of 6 msec duration, a separation of 46.8 msec, and gradient strengths ranging from 3.4 to 36.5 G/cm. Diffusion coefficients, D, were then obtained by fitting intensities of several peaks in the aromatic and aliphatic regions to the following equation using the program Simfit in XWINNMR (Version 3.5, Bruker BIOSPIN):
where γ is the gyromagnetic ratio, and g, δ, and Δ are the amplitude, duration, and separation of the single pair of gradient pulses, respectively.
In order to facilitate the comparison of the diffusion coefficients measured at different protein concentrations and buffer conditions, diffusion coefficients of EDTA present in the buffer solution were also measured and used as a reference (Chen et al. 1995). Experimentally measured translational diffusion coefficients were corrected for the solution conditions using the following relationship:
where D M and D EDTA 1 are the translational self-diffusion coefficients of SSB-2 and EDTA for a given sample, and D EDTA 2 is the translational self-diffusion coefficient of EDTA measured under the conditions used as a reference, from the sample with the SSB-2 concentration of 20 μM.
15N relaxation measurements and analysis
The 15N relaxation parameters of SSB-2 were first measured on a Bruker Avance500 spectrometer equipped with a cryoprobe, where most of the spectra used for the structure determination were acquired (Masters et al. 2006). While the 15N relaxation parameters clearly indicated that some loop regions of SSB-2 are significantly flexible compared with the central β-sandwich core, attempts to fit the data with the Modelfree formalism were unsuccessful. This was later attributed to errors in experimentally measured R 1 values arising from insufficient relaxation durations used (up to 700 msec because of the power limit of the cryoprobe). The backbone 15N relaxation parameters of SSB-2, as reported here, were subsequently measured using a uniform-15N-labeled sample of 0.35 mM at 600 MHz on a Bruker DRX600, as described previously (Yao et al. 2000b, 2004). 15N relaxation data were acquired in an interleaved manner, that is, a 3D data set was acquired for R 1 and R 2, respectively, with the pulse sequence stepping through the relaxation durations prior to the time increments of the indirectly detected dimension of the spectra. Relaxation durations ranging from 10 msec to 2.4 sec for R 1 and 15.5–619.5 msec for R 2 were used. A complex data matrix of 2048 × 144 together with 32 scans per t 1 increment for R 1 and R 2 and 128 for the NOE were used. The recycle times were 2.8 sec for R1 and R2 and 3.8 s for the steady-state 15N-{1H} NOE, respectively. All NMR spectra were processed using XWINNMR (Version 3.5, Bruker BIOSPIN) and analyzed with XEASY software (Version 1.3; Bartels et al. 1995).
NMR relaxation dispersion experiments were carried out by measuring in-phase and anti-phase coherence-averaged 15N transverse relaxation rates (R 2 app) as a function of CPMG field strengths (20, 50, 80, 100, 120, 150, 200, 300, 400, 500, 600, 700, 800, and 1000 Hz) with a delay for the CMPG segment of 40 msec (Loria et al. 1999; Tollinger et al. 2001). A recycle time of 2.5 sec was used, and all other acquisition and spectral parameters were similar to those used in the 15N R 2 measurements described above. R 2 app values were calculated from the ratio of peak intensity at a given CPMG field strength with a relaxation duration of 40 msec and peak intensity resulting from the same pulse sequence but with the CPMG relaxation segment removed (Tollinger et al. 2001).
15N relaxation rates R 1 and R 2 were obtained by fitting peak intensities at a series of relaxation durations to a three- and two-parameter single exponential decay curve for R 1 and R 2, respectively, using the program curvefit (A.G. Palmer, Columbia University, New York). Errors in the relaxation rates were determined by the program curvefit using a Monte Carlo simulation with designated uncertainties of 5% for all peak intensities (from duplicated spectra). The steady-state 15N-{1H} NOE values were calculated from peak intensity ratios obtained from spectra acquired in the presence and absence of proton saturation, with uncertainties of 5% for all peak intensities estimated from background noise of the spectra (Farrow et al. 1994).
Modelfree analysis
An initial estimate of the global reorientation time of SSB-2 was obtained, assuming the global reorientation to be isotropic, by analyzing R 2/R 1 ratios of residues satisfying the criteria of both steady-state 15N-{1H} NOE ≥ 0.6 and |(T 1/T 2) − 〈T 1/T 2〉| ≤ SD (Kay et al. 1989). The ratio of three principal moments of the inertial tensor of SSB-2 was obtained from its solution structure using the program pdbinertial (A.G. Palmer, Columbia University, New York). The program TENSOR2 (Dosset et al. 2000) was used for estimating the asymmetric rotational diffusion tensor of the SSB-2 and subsequent Modelfree analysis. A group of backbone amides that had steady-state 15N-{1H} NOE ≥ 0.65 and |T 1/〈T 1〉 − T 2/〈T 2〉| ≤ 1.5 SD was included in the estimate of the global rotational diffusion model. 15N relaxation data of R 1, R 2, and steady-state 15N-{1H} NOE were fitted to one of five combinations of Modelfree parameters, similar to the model selection approach (Mandel et al. 1995). An N–H bond length of 1.02 Å and an amide 15N chemical anisotropy of −170 ppm were used for the analysis.
Normal mode analysis
Structure coordinates of SSB-2, GUSTAVUS, and PRYSPRY were taken from the Protein Data Bank (PDB IDs 2AFJ, 2FNJ, and 2FBE, respectively). For SSB-2, the closest-to-mean coordinates were used. For GUSTAVUS, only the N terminus and the SPRY domain were included in the computation (residues 35–240, excluding the SOCS box and elongins B and C). For PRYSPRY, the monomeric structure (unit A) was used. The structures were first relaxed by molecular mechanics (MM) minimization before the normal mode analysis. The MM minimization was done in ∼1000 steps by NAMD (Kalé et al. 1999) using a CHARMM force field with threshold energy of 10−3 kcal mol−1 Å−1. The normal mode dynamics were performed using an improved Gaussian Network Model (GNM) (Bahar et al. 1997), where the protein structure is coarse-grained as an elastic network of Cα.
For the GNM calculations of SSB-2, the cutoff distance in the harmonic potential for interaction of the amino acid pairs was set at 10 Å, and the constant parameter is typically 0.07–0.15 kcal mol−1 Å−2 at T = 300 K. In a dynamical domain analysis by the DynDom algorithm (Hayward and Berendsen 1998), the window length was set initially at five residues until successful domain decomposition (≤15 residues). The RMSD of the best-fit of motional internal subdomain was in the range of 0.9 ∼ 1.5 Å, and was 0.4∼0.9 Å for the fixed domains. The subdomain matches and mismatches (e.g., hinge residues) were determined with pairwise sequence identities above 80%. The dynamics minimization, normal modes calculation, and dynamical domain analysis were carried out on a cluster of HP7500 workstations. All visualization graphics were processed by Visual Molecular Dynamics (VMD) (Humphrey et al. 1996).
Electronic supplemental material
Four figures and two tables containing NMR relaxation parameters and output of Modelfree analysis are available electronically as Supplemental Material.
Acknowledgments
We thank Peter Czabotar, Richard Sadus, and Billy Todd for helpful discussions. This work was supported in part by the National Health and Medical Research Council (NHMRC), Australia (Program grant 257500 to N.A.N. and R.S.N.) and the Australian Research Council (M.S.L.). S.E.N. was supported by an NHMRC Biomedical Career Development Award.
Footnotes
Supplemental material: see www.proteinscience.org
Reprint requests to: Shenggen Yao, The Walter and Eliza Hall Institute of Medical Research, 1G Royal Parade, Parkville 3050, Victoria, Australia; e-mail: syao@wehi.edu.au; fax: 61-3-93470852.
Abbreviations: HSQC, heteronuclear single quantum coherence; MD, molecular dynamics; NMA, normal mode analysis; NMR, nuclear magnetic resonance; NOE, nuclear Overhauser effect; SOCS, suppressor of cytokine signaling; SPRY, a sequence repeat in the dual-specificity kinase splA and ryanodine receptors; SSB-2, SPRY domain–containing SOCS box protein 2.
Article published online ahead of print. Article and publication date are at http://www.proteinscience.org/cgi/doi/10.1110/ps.062477806.
References
- Bahar, I. and Rader, A.J. 2005. Coarse-grained normal mode analysis in structural biology. Curr. Opin. Struct. Biol. 15: 586–592. [DOI] [PMC free article] [PubMed] [Google Scholar]
- Bahar, I., Atilgan, A.R., and Erman, B. 1997. Direct evaluation of thermal fluctuations in proteins using a single-parameter harmonic potential. Fold. Des. 2: 173–181. [DOI] [PubMed] [Google Scholar]
- Bartels, C., Xia, T.H., Billeter, M., Güntert, P., and Wüthrich, K. 1995. The Program XEASY for computer-supported NMR spectral-analysis of biological macromolecules. J. Biomol. NMR 6: 1–10. [DOI] [PubMed] [Google Scholar]
- Chen, A.D., Wu, D.H., and Johnson, C.S. 1995. Determination of the binding isotherm and size of the bovine serum albumin-sodium dodecyl-sulfate complex by diffusion-ordered 2D NMR. J. Phys. Chem. 99: 828–834. [Google Scholar]
- DeLano, W.L. 2004. Use of PyMOL as a communications tool for molecular science. Abstr. Pap. Am. Chem. Soc. 228: U313–U314. [Google Scholar]
- de la Torre, J.G., Huertas, M.L., and Carrasco, B. 2000. HYDRONMR: Prediction of NMR relaxation of globular proteins from atomic-level structures and hydrodynamic calculations. J. Magn. Reson. 147: 138–146. [DOI] [PubMed] [Google Scholar]
- De Los Rios, P., Cecconi, F., Pretre, A., Dietler, G., Michielin, O., Piazza, F., and Juanico, B. 2005. Functional dynamics of PDZ binding domains: A normal-mode analysis. Biophys. J. 89: 14–21. [DOI] [PMC free article] [PubMed] [Google Scholar]
- Dosset, P., Hus, J.C., Blackledge, M., and Marion, D. 2000. Efficient analysis of macromolecular rotational diffusion from heteronuclear relaxation data. J. Biomol. NMR 16: 23–28. [DOI] [PubMed] [Google Scholar]
- Eisenmesser, E.Z., Millet, O., Labeikovsky, W., Korzhnev, D.M., Wolf-Watz, M., Bosco, D.A., Skalicky, J.J., Kay, L.E., and Kern, D. 2005. Intrinsic dynamics of an enzyme underlies catalysis. Nature 438: 117–121. [DOI] [PubMed] [Google Scholar]
- Farrow, N.A., Muhandiram, R., Singer, A.U., Pascal, S.M., Kay, C.M., Gish, G., Shoelson, S.E., Pawson, T., Formankay, J.D., and Kay, L.E. 1994. Backbone dynamics of a free and a phosphopeptide-complexed Src homology-2 domain studied by 15N NMR relaxation. Biochemistry 33: 5984–6003. [DOI] [PubMed] [Google Scholar]
- Frauenfelder, H., McMahon, B.H., Austin, R.H., Chu, K., and Groves, J.T. 2001. The role of structure, energy landscape, dynamics, and allostery in the enzymatic function of myoglobin. Proc. Natl. Acad. Sci. 98: 2370–2374. [DOI] [PMC free article] [PubMed] [Google Scholar]
- Grütter, C., Briand, C., Capitani, G., Mittl, P.R.E., Papin, S., Tschopp, E., and Grütter, M.G. 2006. Structure of the PRYSPRY-domain: Implications for autoinflammatory diseases. FEBS Lett. 580: 99–106. [DOI] [PubMed] [Google Scholar]
- Gurumurthy, S. and Rangnekar, V.M. 2004. Par-4 inducible apoptosis in prostate cancer cells. J. Cell. Biochem. 91: 504–512. [DOI] [PubMed] [Google Scholar]
- Hayward, S. and Berendsen, H.J.C. 1998. Systematic analysis of domain motions in proteins from conformational change: New results on citrate synthase and T4 lysozyme. Proteins 30: 144–154. [PubMed] [Google Scholar]
- Henry, J., Ribouchon, M.T., Offer, C., and Pontarotti, P. 1997. B30.2-like domain proteins: A growing family. Biochem. Biophys. Res. Commun. 235: 162–165. [DOI] [PubMed] [Google Scholar]
- Hilton, D.J., Richardson, R.T., Alexander, W.S., Viney, E.M., Willson, T.A., Sprigg, N.S., Starr, R., Nicholson, S.E., Metcalf, D., and Nicola, N.A. 1998. Twenty proteins containing a C-terminal SOCS box form five structural classes. Proc. Natl. Acad. Sci. 95: 114–119. [DOI] [PMC free article] [PubMed] [Google Scholar]
- Humphrey, W., Dalke, A., and Schulten, K. 1996. VMD—Visual Molecular Dynamics. J. Mol. Graph. 14: 33–38. [DOI] [PubMed] [Google Scholar]
- Hwang, T.L., van Zijl, P.C.M., and Mori, S. 1998. Accurate quantitation of water-amide proton exchange rates using the Phase-Modulated CLEAN chemical EXchange (CLEANEX-PM) approach with a Fast-HSQC (FHSQC) detection scheme. J. Biomol. NMR 11: 221–226. [DOI] [PubMed] [Google Scholar]
- Kalé, L., Skeel, R., Bhandarkar, M., Brunner, R., Gursoy, A., Krawetz, N., Phillips, J., Shinozaki, A., Varadarajan, K., and Schulten, K. 1999. NAMD2: Greater scalability for parallel molecular dynamics. J. Comput. Phys. 151: 283–312. [Google Scholar]
- Kay, L.E., Torchia, D.A., and Bax, A. 1989. Backbone dynamics of proteins as studied by 15N inverse detected heteronuclear NMR spectroscopy—Application to staphylococcal nuclease. Biochemistry 28: 8972–8979. [DOI] [PubMed] [Google Scholar]
- Krishnan, V.V. 1997. Determination of oligomeric state of proteins in solution from pulsed-field-gradient–self-diffusion measurements. A comparison of experimental, theoretical, and hard-sphere approximated values. J. Magn. Reson. 124: 468–473. [Google Scholar]
- Letunic, I., Copley, R.R., Schmidt, S., Ciccarelli, F.D., Doerks, T., Schultz, J., Ponting, C.P., and Bork, P. 2004. SMART 4.0: Towards genomic data integration. Nucleic Acids Res. 32: D142–D144. [DOI] [PMC free article] [PubMed] [Google Scholar]
- Liu, M.S., Todd, B.D., and Sadus, R.J. 2006. Dynamic and coordinating domain motions in the active subunits of the F1-ATPase molecular motor. Biochim. Biophys. Acta 1764: 1553–1560. [DOI] [PubMed] [Google Scholar]
- Loria, J.P., Rance, M., and Palmer III, A.G. 1999. A relaxation-compensated Carr-Purcell-Meiboom-Gill sequence for characterizing chemical exchange by NMR spectroscopy. J. Am. Chem. Soc. 121: 2331–2332. [Google Scholar]
- Maciejewski, M.W., Liu, D.J., Prasad, R., Wilson, S.H., and Mullen, G.P. 2000. Backbone dynamics and refined solution structure of the N-terminal domain of DNA polymerase β. Correlation with DNA binding and dRP lyase activity. J. Mol. Biol. 296: 229–253. [DOI] [PubMed] [Google Scholar]
- Mandel, A.M., Akke, M., and Palmer III, A.G. 1995. Backbone dynamics of Escherichia coli ribonuclease Hi—Correlations with structure and function in an active enzyme. J. Mol. Biol. 246: 144–163. [DOI] [PubMed] [Google Scholar]
- Masters, S.L., Palmer, K.R., Stevenson, W.S., Metcalf, D., Viney, E.M., Sprigg, N.S., Alexander, W.S., Nicola, N.A., and Nicholson, S.E. 2005. Genetic deletion of murine SPRY domain-containing SOCS box protein 2 (SSB-2) results in very mild thrombocytopenia. Mol. Cell. Biol. 25: 5639–5647. [DOI] [PMC free article] [PubMed] [Google Scholar]
- Masters, S.L., Yao, S., Willson, T.A., Zhang, J.G., Palmer, K.R., Smith, B.J., Babon, J.J., Nicola, N.A., Norton, R.S., and Nicholson, S.E. 2006. The SPRY domain of SSB-2 adopts a novel fold that presents conserved Par-4-binding residues. Nat. Struct. Mol. Biol. 13: 77–84. [DOI] [PubMed] [Google Scholar]
- Mittermaier, A. and Kay, L.E. 2006. New tools provide new insights in NMR studies of protein dynamics. Science 312: 224–228. [DOI] [PubMed] [Google Scholar]
- Nesmelova, I.V., Skirda, V.D., and Fedotov, V.D. 2002. Generalized concentration dependence of globular protein self-diffusion coefficients in aqueous solutions. Biopolymers 63: 132–140. [DOI] [PubMed] [Google Scholar]
- Pawley, N.H., Wang, C.Y., Koide, S., and Nicholson, L.K. 2001. An improved method for distinguishing between anisotropic tumbling and chemical exchange in analysis of 15N relaxation parameters. J. Biomol. NMR 20: 149–165. [DOI] [PubMed] [Google Scholar]
- Ponting, C., Schultz, J., and Bork, P. 1997. SPRY domains in ryanodine receptors (Ca2+-release channels). Trends Biochem. Sci. 22: 193–194. [DOI] [PubMed] [Google Scholar]
- Seeliger, M.A., Spichty, M., Kelly, S.E., Bycroft, M., Freund, S.M., Karplus, M., and Itzhaki, L.S. 2005. Role of conformational heterogeneity in domain swapping and adapter function of the Cks proteins. J. Biol. Chem. 280: 30448–30459. [DOI] [PubMed] [Google Scholar]
- Seetharaman, J., Kanigsberg, A., Slaaby, R., Leffler, H., Barondes, S.H., and Rini, J.M. 1998. X-Ray crystal structure of the human galectin-3 carbohydrate recognition domain at 2.1-Å resolution. J. Biol. Chem. 273: 13047–13052. [DOI] [PubMed] [Google Scholar]
- Sells, S.F., Wood Jr., D.P., Joshi-Barve, S.S., Muthukumar, S., Jacob, R.J., Crist, S.A., Humphreys, S., and Rangnekar, V.M. 1994. Commonality of the gene programs induced by effectors of apoptosis in androgen-dependent and -independent prostate cells. Cell Growth Differ. 5: 457–466. [PubMed] [Google Scholar]
- Shirai, T., Mitsuyama, C., Niwa, Y., Matsui, Y., Hotta, H., Yamane, T., Kamiya, H., Ishii, C., Ogawa, T., and Muramoto, K. 1999. High-resolution structure of the conger eel galectin, congerin I, in lactose-liganded and ligand-free forms: Emergence of a new structure class by accelerated evolution. Structure 7: 1223–1233. [DOI] [PubMed] [Google Scholar]
- Teller, D.C., Swanson, E., and de Haen, C. 1979. The translational friction coefficient of proteins. Methods Enzymol. 61: 103–124. [DOI] [PubMed] [Google Scholar]
- Temiz, N.A., Meirovitch, E., and Bahar, I. 2004. Escherichia coli adenylate kinase dynamics: Comparison of elastic network model modes with mode-coupling 15N-NMR relaxation data. Proteins 57: 468–480. [DOI] [PMC free article] [PubMed] [Google Scholar]
- Tjandra, N., Feller, S.E., Pastor, R.W., and Bax, A. 1995. Rotational diffusion anisotropy of human ubiquitin from 15N NMR relaxation. J. Am. Chem. Soc. 117: 12562–12566. [Google Scholar]
- Tjandra, N., Wingfield, P., Stahl, S., and Bax, A. 1996. Anisotropic rotational diffusion of perdeuterated HIV protease from 15N NMR relaxation measurements at two magnetic fields. J. Biomol. NMR 8: 273–284. [DOI] [PubMed] [Google Scholar]
- Tollinger, M., Skrynnikov, N.R., Mulder, F.A.A., Forman-Kay, J.D., and Kay, L.E. 2001. Slow dynamics in folded and unfolded states of an SH3 domain. J. Am. Chem. Soc. 123: 11341–11352. [DOI] [PubMed] [Google Scholar]
- Viles, J.H., Donne, D., Kroon, G., Prusiner, S.B., Cohen, F.E., Dyson, H.J., and Wright, P.E. 2001. Local structural plasticity of the prion protein. Analysis of NMR relaxation dynamics. Biochemistry 40: 2743–2753. [DOI] [PubMed] [Google Scholar]
- Wand, A.J. 2001. Dynamic activation of protein function: A view emerging from NMR spectroscopy. Nat. Struct. Biol. 8: 926–931. [DOI] [PubMed] [Google Scholar]
- Wang, D.K., Li, Z.B., Messing, E.M., and Wu, G. 2005. The SPRY domain-containing SOCS box protein 1 (SSB-1) interacts with MET and enhances the hepatocyte growth factor-induced Erk-Elk-1-serum response element pathway. J. Biol. Chem. 280: 16393–16401. [DOI] [PubMed] [Google Scholar]
- Woo, J.S., Imm, J.H., Min, C.K., Kim, K.J., Cha, S.S., and Oh, B.H. 2006. Structural and functional insights into the B30.2/SPRY domain. EMBO J. 25: 1353–1363. [DOI] [PMC free article] [PubMed] [Google Scholar]
- Yao, S., Hinds, M.G., and Norton, R.S. 1998. Improved estimation of protein rotational correlation times from 15N relaxation measurements. J. Magn. Reson. 131: 347–350. [DOI] [PubMed] [Google Scholar]
- Yao, S., Howlett, G.J., and Norton, R.S. 2000a. Peptide self-association in aqueous trifluoroethanol monitored by pulsed field gradient NMR diffusion measurements. J. Biomol. NMR 16: 109–119. [DOI] [PubMed] [Google Scholar]
- Yao, S., Smith, D.K., Hinds, M.G., Zhang, J.G., Nicola, N.A., and Norton, R.S. 2000b. Backbone dynamics measurements on leukemia inhibitory factor, a rigid four-helical bundle cytokine. Protein Sci. 9: 671–682. [DOI] [PMC free article] [PubMed] [Google Scholar]
- Yao, S., Headey, S.J., Keizer, D.W., Bach, L.A., and Norton, R.S. 2004. C-terminal domain of insulin-like growth factor (IGF) binding protein 6: Conformational exchange and its correlation with IGF-II binding. Biochemistry 43: 11187–11195. [DOI] [PubMed] [Google Scholar]
- Yao, S., Masters, S.L., Zhang, J.G., Palmer, K.R., Babon, J.J., Nicola, N.A., Nicholson, S.E., and Norton, R.S. 2005. Backbone 1H, 13C and 15N assignments of the 25 kDa SPRY domain-containing SOCS box protein 2 (SSB-2). J. Biomol. NMR 31: 69–70. [DOI] [PubMed] [Google Scholar]


