

Abstract
Although core residues can sometimes be replaced by shorter ones without introducing significant changes in protein structure, the energetic consequences are typically large and destabilizing. Many efforts have been devoted to understand and predict changes in stability from analysis of the environment of mutated residues, but the relationships proposed for individual proteins have often failed to describe additional data. We report here 17 apoflavodoxin large-to-small mutations that cause overall protein destabilizations of 0.6–3.9 kcal.mol−1. By comparing two-state urea and three-state thermal unfolding data, the overall destabilizations observed are partitioned into effects on the N-to-I and on the I-to-U equilibria. In all cases, the equilibrium intermediate exerts a “buffering” effect that reduces the impact of the overall destabilization on the N-to-I equilibrium. The performance of several structure-energetics relationships, proposed to explain the energetics of hydrophobic shortening mutations, has been evaluated by using an apoflavodoxin data set consisting of 14 mutations involving branching-conservative aliphatic side-chain shortenings and a larger data set, including similar mutations implemented in seven model proteins. Our analysis shows that the stability changes observed for any of the different types of mutations (LA, IA, IV, and VA) in either data set are best explained by a combination of differential hydrophobicity and of the calculated volume of the modeled cavity (as previously observed for LA and IA mutations in lysozyme T4). In contrast, sequence conservation within the flavodoxin family, which is a good predictor for charge-reversal stabilizing mutations, does not perform so well for aliphatic shortening ones.
Keywords: protein stability, hydrophobic interaction, protein intermediate, protein folding, protein cavity
Globular proteins are organized around well-packed hydrophobic cores that play important roles in protein folding and stability (Chan and Dill 1990; Dill 1990). Tight packing optimizes van der Waals interactions and allows for the minimization of the presence of cavities in proteins. Although small perturbations of core packing arising from mutations are often tolerated by proteins and give rise to small structural readjustments, they may result in large energetic effects (Milla et al. 1994; Munson et al. 1996; Vlassi et al. 1999). Understanding the contribution of buried hydrophobic residues to protein stability is not trivial, and toward that end, considerable experimental work has been carried out to analyze large-to-small side-chain substitutions (Yutani et al. 1987; Matsumura et al. 1988; Kellis et al. 1989; Shortle et al. 1990; Baase et al. 1992; Eriksson et al. 1992b; Serrano et al. 1992; Takano et al. 1997; Xu et al. 1998, 2002; Chen and Stites 2001a). One goal in these studies has been to find out relationships between local protein structural features and the concomitant stability changes observed. For the staphylococcal nuclease, the change in stability upon mutation (ΔΔG) was related to local packing density (Shortle et al. 1990); for barnase, a linear relationship was proposed between ΔΔG and an averaged measure of structural perturbations in neighboring atoms (Buckle et al. 1996); for chymotrypsin inhibitor 2 (CI2), ΔΔG was related to the number of methyl and methylene groups within 6 Å from the mutated residues (Otzen et al. 1995). Subsequent studies have nevertheless shown that the correlations proposed were difficult to generalize to other proteins (Xu et al. 1998). A somewhat simpler approach was proposed in a T4 lysozyme study, where ΔΔG was approximated by a constant term, related to differences in hydrophobicity between the exchanged residues, plus a term proportional to cavity size (Eriksson et al. 1992b; Xu et al. 1998). As with the other relationships, this one was later shown not to hold in a different protein (ROP [Vlassi et al. 1999]). It thus seems clear that further investigation and assessment are required to determine whether general relationships can be established between local protein characteristics and the ΔΔG associated with buried mutations.
On the other hand it should be noticed that, as in many other mutational analyses, the contribution of buried hydrophobic residues to protein stability has been mainly studied using two-state proteins, where stability differences can be best determined (Pace and Laurents 1989). While two-state small proteins are very convenient models, they might not be very representative of average proteins, which are larger (i.e., 86% of the human proteins documented in Swiss-Prot [Bairoch and Apweiler 1997] are >15 kDa) and therefore more likely to display equilibrium-folding intermediates. For a three- (or more) state protein, it is useful to distinguish between the free-energy difference of the N-to-I equilibrium, which has been termed relevant stability (Sancho et al. 2002), and the residual stability associated with the I-to-U equilibrium. In previous work on charge-reversal mutations (Campos et al. 2004b), we showed that large overall stabilization of the native state relative to the unfolded one can be obtained using charge-reversal mutations without significantly increasing the relevant stability of the protein. Conversely, it can be anticipated that destabilizations arising from hydrophobic deletions in the core of three-state proteins can be partitioned in various ways, the extremes being the specific destabilization of the native state relative to the intermediate and that of the intermediate relative to the denatured state.
To reassess the contribution of hydrophobic residues to the overall stability of two-state proteins and to investigate how it is partitioned in three-state proteins, we analyze here a set of 17 hydrophobic (Fig. 1; Table 1), large-to-small mutations that have been implemented in the core of the apoflavodoxin from Anabaena PCC7119 (169 residues, 19 kDa) (Maldonado et al. 1998; Sancho 2006). The structure, stability, folding, and cofactor binding of this protein are well characterized (Genzor et al. 1996a,b; Fernandez-Recio et al. 1999; Lostao et al. 2000, 2003; Irun et al. 2001b; Langdon et al. 2001; Campos et al. 2005); the protein has been used to investigate different types of side-chain interactions (Fernandez-Recio et al. 1999; Campos et al. 2005); and it displays the interesting feature of behaving as a two-state protein toward chemical denaturation and as a three-state one toward thermal unfolding (Irun et al. 2001a). Our data indicate that all of the mutations tested induce large overall destabilizations that are unevenly distributed between the N-to-I and I-to-U equilibria in a way that can be fully explained on the basis of the available low-resolution structure of the apoflavodoxin thermal intermediate (Campos et al. 2004a). Moreover, 14 of the 17 apoflavodoxin mutants, together with mutants reported in staphylococcal nuclease, barnase, CI2, ROP, and T4 and human lysozyme, have been jointly analyzed to test the overall performance of the various correlations proposed between structural features and stability changes. According to our analysis, the best predictor of the observed stability changes is cavity volume.
Figure 1.
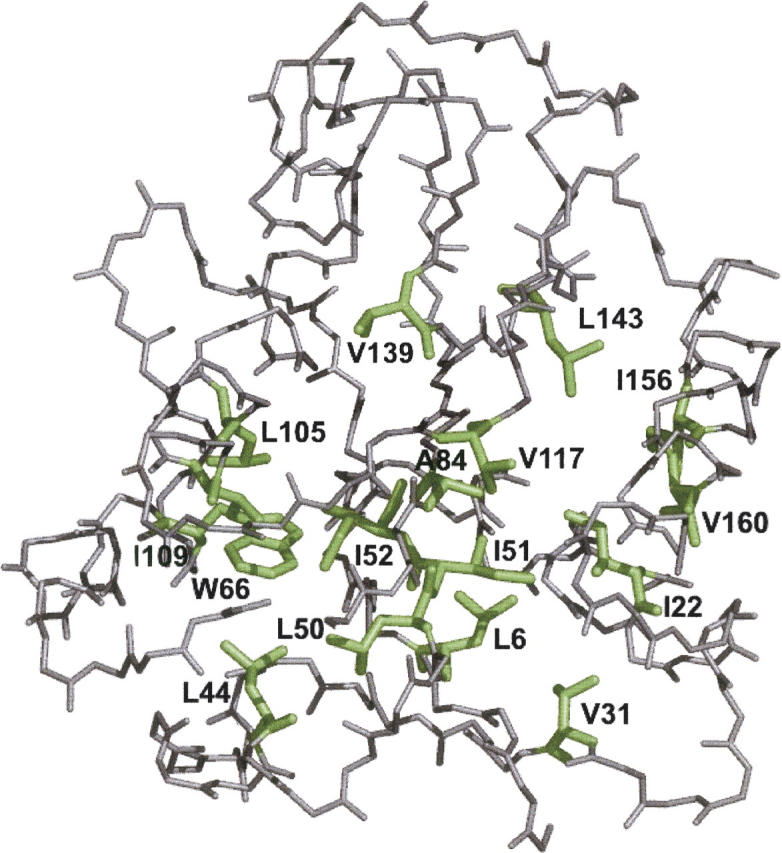
Cα trace of Anabaena apoflavodoxin (PDB code 1FTG) showing, in green, the mutated side-chains.
Table 1.
Summary of the location, solvent accessibility, and contacts made by the replaced groups in the different apoflavodoxin mutants

Results and Discussion
Spectroscopic characterization of mutants
Structural perturbations associated with mutations may sometimes be detected in the near-UV CD spectra of proteins. For apoflavodoxin, there is a contribution of aromatic residues to the far-UV CD spectra that can also be used to detect departures from the native structure. As Figure 2 shows, the spectra of the mutants (except those of I109A) cannot be distinguished from those of the wild-type protein. This indicates that the tertiary interactions involving aromatic residues are basically the same in all of the proteins, except for I109A. The emission fluorescence spectra of the mutants (data not shown) display the same intensity and wavelength of maximal emission as that of the wild-type protein, except that of I109A, which displays a lower intensity and a red-shifted maximum. The additional mutants used in this work—L6A, V31A, I51V, I52V, A84G, V117A, V139A, L143A, and I156A—display CD and fluorescence emission spectra very similar to those of wild type (Campos et al. 2004a).
Figure 2.
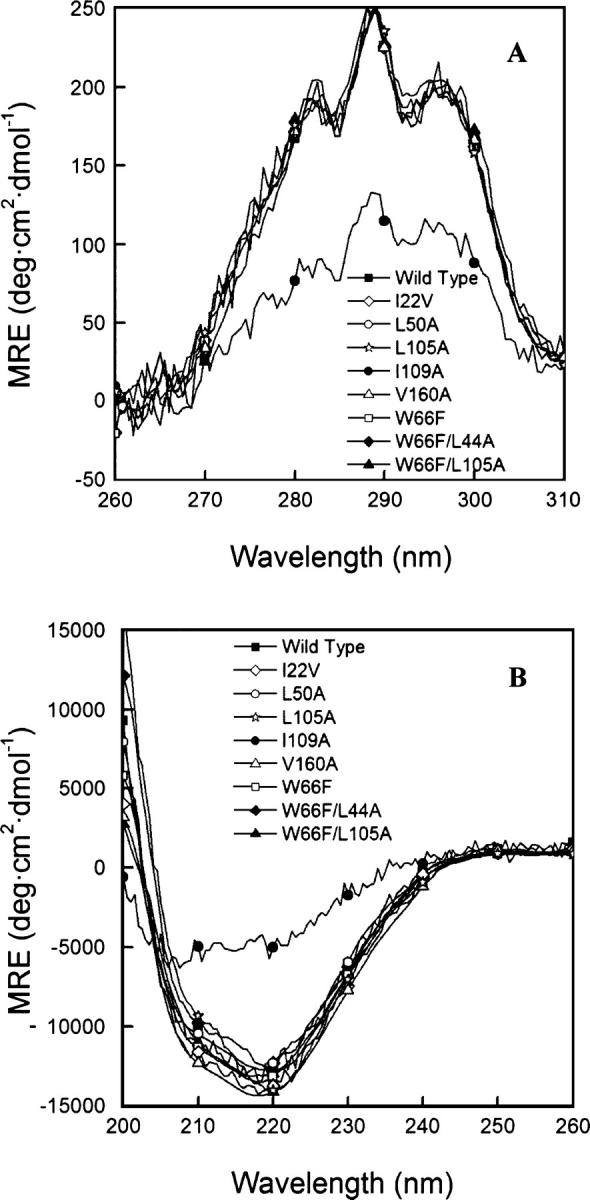
Circular dichroism spectra of wild type and some of the mutants analyzed (see Campos et al. 2004a for the rest of the mutants) at 25.0° ± 0.1°C. (A) Near-UV, in 50 mM MOPS (pH 7.0). (B) Far-UV, in 5 mM MOPS (pH 7.0), with 15 mM NaCl. Signals of the W66F mutant (and derived) are shown normalized, for the sake of comparison.
Overall (N-to-U) stability of cavity bearing mutants
Apoflavodoxin urea unfolding is two-state (Genzor et al. 1996a). The stability consequences of replacing buried residues by smaller ones have been investigated by urea denaturation equilibrium unfolding (Table 2). Seventeen cavity-creating mutants within the hydrophobic core of Anabaena apoflavodoxin were studied (L6A, I22V, V31A, L50A, I51V, I52V, A84G, L105A, I109A, V117A, V139A, L143A, I156V, V160A, W66F, W66F/L44A, and W66F/L105A). Of the eight newly made mutants, four (L105A, L50A, W66F/L105A, and I109A) can be unfolded with mid-concentrations of denaturant lower than 1 M, while three (V160A, I22V, and W66F/L44A) exhibit a urea concentration of mid-denaturation slightly above 1 M, and just one (W66F) is only slightly less stable than wild type. All of the fluorescence transition curves (Fig. 3) can be fitted to two-state transitions using Equation 2. The slopes of the observed transitions (m in Equation 2) are similar except for W66F/L44A, I109A, V160A, and I22V (which display lower m values). Comparison of the calculated ΔG values in water shows that all of the mutants are less stable than the wild-type protein, with destabilizations ranging from 0.6 to 3.9 kcal.mol−1. By far, the I109A mutant is the most destabilized variant. The other nine mutants (Campos et al. 2004), showed m values similar to that of wild type and are less stable.
Table 2.
Destabilization of wild-type apoflavodoxin by cavity creating mutations, as measured by urea denaturationa

Figure 3.

Urea denaturation curves of wild-type and mutant apoflavodoxins at 25.0° ± 0.1°C (pH 7.0), 50 mM MOPS. The fluorescence signal of the W66F mutant is shown normalized, for the sake of comparison.
The structures of the mutants were modeled from the wild-type structure as described in Machicado et al. (2002). They reveal the presence of protein cavities ranging from 14 Å3 for I51V to 118 Å3 for I109A in single aliphatic mutants (Table 3), and of 209 Å3 for the W66F/L44A double mutant (data not shown). In most cases, the modeled cavities are smaller than the theoretical cavities that would have appeared in the mutant protein in the absence of relaxation, but in one case, I156V, the modeled cavity is larger. Incidentally, this mutant shows one of the largest global destabilizations.
Table 3.
Various parameters that describe the environment surrounding the mutated aliphatic residues

The W66F, L105A, and W66F/L105A mutants allow evaluation of the cooperativity or structural independence of two mutations that face the same cavity. The sum of the destabilization observed in W66F and L105A (2.99 ± 0.12 kcal.mol-1) is very close to the ΔΔG observed in the double mutant (2.78 ± 0.11 kcal.mol-1). In addition, the sum of the volume of the cavities in the single mutants (111 Å3 and 86 Å3 for W66F and L105A, respectively) is almost the same as that of the cavity calculated for the double mutant (205 Å3). It seems that the two mutations are independent and thus additive, which could be a reflection of their fairly rigid local environment as suggested by the B factors (Genzor et al. 1996b; Eyal et al. 2003).
One of the earliest and most straightforward structure–energetics relationships proposed to account for the destabilization arising from replacing buried aliphatic residues by shorter ones is that of Kellis et al. (1989). From the analysis of two Ile to Val barnase mutants (I88V, I96V) the protein was found to be destabilized by 1.0–1.6 kcal.mol−1/methyl group removed. This value was subsequently refined to 1.5 ± 0.6 kcal.mol−1 (Serrano et al. 1992) by considering two additional barnase mutants (I5V, I76V), one (I72V) from staphylococcal nuclease (Shortle et al. 1990) and one (I47V) from the gene V protein from bacteriophage f1 (Sandberg and Terwilliger 1991). An additional calculation of the ΔΔG value per –CH2-group was performed by Pace (1992) adding to the previous set of mutants, four staphylococcal nuclease mutants (I15V, I18V, I92V, and I139V) and a T4 lysozyme (I3V) mutation. A value of 1.3 ± 0.4 kcal.mol−1 was obtained (Pace 1992). An analogous calculation using only four apoflavodoxin Ile-to-Val mutations (Table 2) gives a value of 2.0 ± 1.0 kcal.mol−1/methylene group removed, and if all of the 15 Ile-to-Val mutations are jointly considered, the estimation of the contribution to protein stability of a buried methyl/methylene group is set at 1.5 ± 0.8 kcal.mol−1.
Relevant (N-to-I) and residual (I-to-U) stability of cavity bearing mutants: An energetic “buffering” effect exerted by protein equilibrium intermediates
The thermal unfolding of apoflavodoxin is three-state (Irun et al. 2001a), which allows for investigation of the specific energetics of N-to-I and I-to-U equilibria (Campos et al. 2004a,b, 2005). The thermal unfolding data corresponding to the hydrophobic apoflavodoxin substitutions is summarized in Table 4. All mutations destabilize the two equilibria. For the N-to-I equilibrium, the fall in Tm values ranges from 0.4° to 14.5° and for the I-to-U equilibrium, from 2.2° to 19.9°. As observed in the chemical denaturation, the I109A mutant appears as the most globally (N-to-U) destabilized protein.
Table 4.
Thermodynamic parameters of the three-state unfolding equilibrium of wild-type and mutant apoflavodoxins

The thermal and chemical denaturation data can be compared. By adding the ΔΔGNI and ΔΔGIU values calculated at the reference temperature of 317.3 K (Table 4), a ΔΔGNU change is obtained at that temperature. On the other hand, an equivalent magnitude is calculated at 298.2 K from the urea unfolding curves (Table 2). If the thermal and urea-denatured states are energetically equivalent and the stability differences between protein variants are retained going from 317.3 K to 298.2 K, the two-data set should be correlated. In fact, the correlation obtained for the available cavity mutants (Fig. 4) is good (ΔΔGNUthermal = 0.3 + 0.9ΔΔGNUurea; r = 0.9), as previously found for different sets of apoflavodoxin mutants (Campos et al. 2004).
Figure 4.

Comparison of ΔΔGNU values obtained for wild-type apoflavodoxin and mutants thereof by adding the ΔΔGNI and ΔΔGIU terms calculated from global analysis of three-state thermal unfolding curves (Table 3) with those directly measured from two-state urea denaturation (Table 1). The filled circle represents data from mutant I156V, excluded for the correlation due to possible structural relaxations (see text). The dotted line is a unity fit.
The three-state global analysis provides information on the stability of the intermediate relative to the native and denatured states, which determines both its temperature of maximal accumulation and its highest molar fraction. The wild-type thermal intermediate accumulates at 323 K, where it constitutes 64% of the population (Campos et al. 2004a,b). The mutant intermediates tend to accumulate at the same or lower temperatures and in a lower percentage (data not shown), reflecting a larger destabilization of the second transition compared with the initial one (Table 4), which narrows the temperature window where the intermediate is stable. This is clearly seen in the changes brought about by the mutations in the relevant and residual stabilities of the protein (ΔΔGNI and ΔΔGIU) (Sancho et al. 2002). While the relevant stability is decreased by 0.5–1.0 kcal.mol−1 in most mutants, the thermal intermediates are destabilized, relative to the denaturated state by 1.0–2.0 kcal.mol−1 in most cases (see Table 4). The differential impact of the mutations in the stability of the native and the intermediate conformations (both likely suffering from the same loss of hydrophobic stability relative to wild type because the mutations are located in the native-like region of the intermediate; see below) might be due to collapse (at least partial), in the more flexible intermediate of the cavities appearing in the native state (see discussion below on the relationship between destabilization, hydrophobicity, and cavity size). However, the occurrence of an intermediate in the thermal unfolding of the protein buffers the destabilization of the native state caused by the mutations because—since they also significantly destabilize the intermediate—the destabilizing effect in the first transition is reduced.
This fortunate characteristic, which is likely to be general for proteins displaying equilibrium intermediates, does not come without its negative side. In principle, since proteins are destabilized by hydrophobic cavity-created mutations, they could also be stabilized by the reverse, i.e., by implementing mutations to fill existing cavities. This strategy has been explored in two-state proteins, where it has sometimes led to overall N-to-U stabilization (Ishikawa et al. 1993; Akasako et al. 1997; Lassalle et al. 2001; Ohmura et al. 2001). If the 17 apoflavodoxin mutants are thought of in an inverse manner, as different proteins whose cavities can be filled to yield the largely stabilized wild-type apoflavodoxin, it is clear that most of the stabilization that is achieved (∼65% on average) goes to increasing the stability of the intermediate against its full unfolding (Table 5; Fig. 5). Only one-third of the stabilization actually increases the relevant stability of the native state against its partial unfolding. In practical terms, this means that the overall stabilization of a protein displaying equilibrium intermediates that can be achieved by cavity filling will probably have, on average, a small impact on the specific stabilization of the N-to-I equilibrium. This effect has already been observed in apoflavodoxin using charge-reversal stabilizing mutations that, in most cases, left the relevant stability unchanged (Campos et al. 2004b). However, when the charge-reversal mutations were introduced in the region of the protein that appears unstructured in the thermal intermediate (Campos et al. 2004), significant increases of the relevant stability were obtained. Similarly, a close look at how the destabilizations associated to aliphatic deletions are partitioned into the two equilibria (Fig. 5) shows that in the two instances where the mutations are introduced in the unstructured region of the intermediate (V139A and L143A) (Campos et al. 2004a), the largest destabilization is also associated to the N-to-I transition. In a recent work (Bueno et al. 2006), several cavities in apoflavodoxin have been filled, and one of the mutants that retain the native conformation is significantly more stable than wild type toward full unfolding. However, as the filling mutation is located in the region where the intermediate displays a native-like conformation, the relevant stability of the mutant is not greater than that of wild type.
Table 5.
Residue distribution and conservation data for the studied flavodoxin positions

Figure 5.
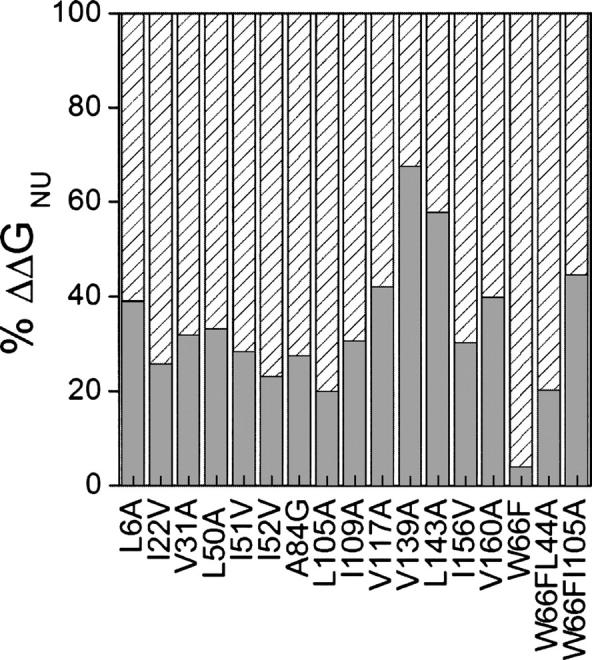
Partitioning of the global destabilization (N-to-U equilibrium) associated to the mutations implemented into the N-to-I equilibrium, relevant destabilization (gray bar), and the I-to-U equilibrium, residual destabilization (white hatched bar).
The apoflavodoxin thermal unfolding intermediate has been investigated in detail, and a low-resolution structure (Fig. 6; Table 1) has been obtained by equilibrium Φ-analysis and confirmed by NMR (Campos et al. 2004). We report here Φ-values of additional interactions (Table 4), which are consistent with the reported structure. They probe the integrity of the packing between the central β-sheet and the layer formed by helices α2, α3, and α4. According to the Φ-values obtained, the N-terminal region of α3 is close to natively packed against the central residues of the β-sheet (W66F); the interface between the central region of α4 and the loop connecting α4 and β4 is mostly formed (I109A); and there is also significant packing between the parallel β-sheet and helices α3 and α4 (L105A). Double mutants have been used to check the packing between the three helices and the central parallel β-sheet, and their Φ-values indicate substantial packing. All of these mutations confirm that in the thermal intermediate, the interactions of the α2–α3–α4 helical layer onto the central β-sheet are close to native.
Figure 6.

Apoflavodoxin secondary structure cartoon showing new (continuous thick lines) and previously reported (Campos et al. 2004a) (discontinuous thin lines) ϕ-values reporting on the integrity of native side-chain interactions in the equilibrium thermal unfolding intermediate at 317.3 K. The native-like region of the intermediate is formed by the packing of helices 1–5, and strands 1–4 (where the ϕ-values are >0.6) and possibly strand 5a. In contrast, the long loop splitting strands 5a and 5b (which contains a small three-stranded b-sheet comprising strands 6, 7, and 8), and two additional loops, are markedly weakened (all ϕ-values <0.4) (Campos et al. 2004a). The ϕ-values are colored from dark green (native interactions) to red (lost interactions). ID numbers of helices (circles) and strands (rectangles) are marked in light gray, and the positions analyzed in this work are indicated in black.
Are cavities solvated? Contribution of buried water molecules to apoflavodoxin stability
Despite the efficient packing of protein cores, most proteins contain small cavities that can be empty or contain water molecules (Rashin et al. 1986; Hubbard and Argos 1994; Williams et al. 1994). Solvated cavities are larger (mean volume of 39.4 Å3) than empty ones (20.7 Å3) (Hubbard et al. 1994). In fact, most empty cavities (66%) are <20 Å3 (Hubbard et al. 1994). The extent and nature of hydration of the interior regions of proteins continues to be a subject of great interest and considerable controversy (Yu et al. 1999). The probability of finding a single water molecule in a small hydrophobic cavity has been estimated to be about one in 20,000 (Wolfenden ande Radzicka 1994). Clearly, for a water molecule to be stable within a protein cavity, the environment therein must be energetically favorable relative to liquid water. Two factors that correlate closely with the ordered water content in interior and interfacial protein cavities are the number of polar atoms lining the cavity and cavity size (Adamek et al. 2005). Generally, larger and more polar cavities are more hydrated (Hubbard and Argos 1994). Several studies have focused on the structural and energetic consequences of creating cavities (Eriksson et al. 1992b; Buckle et al. 1993, 1996; Jackson et al. 1993; Xu et al. 1998), but few have reported the hydration of the new cavity even though the cavities are generally lined with some polar atoms (Adamek et al. 2005).
To evaluate whether the cavities created in apoflavodoxin are likely solvated or not, we have selected two different criteria: first, a volume cutoff, and second, an energetic cutoff. Hubbard et al. (1994) demonstrated that most cavities with volumes >50 Å3 are hydrated. On the other hand, Takano et al. (2003) showed that buried water molecules stabilize a protein structure. Tight packing of buried water molecules in the interior of proteins provides better van der Waals interactions than those in an empty cavity (Takano et al. 1997), and thus a solvated cavity is more stable than an empty one. The reported average destabilization of Ile/Leu to Ala mutations in a solvated cavity is of 1.5 kcal.mol−1, much less than the same type of mutation in empty cavities: 3.4 kcal.mol−1 (Takano et al. 2003). Of all of the apoflavodoxin mutants considered in this work, only mutants L6A, L50A, L105A, I109A, and I156V present cavities >50 Å3 and could be thus solvated, but all of them show destabilizations >2.5 kcal.mol−1 (see Table 2). Accordingly, the probability of finding water molecules in the apoflavodoxin mutant cavities is low and they will be considered as empty cavities.
Performance of different structure/energetics relationships for hydrophobic large-to-small mutations in protein cores
The relationship between structural characteristics of protein cores and stability changes arising from large-to-small substitutions is not well understood. Different correlations have been proposed for different data sets corresponding to mutations located in several proteins. Here we reassess, in two ways, the performance of those correlations. First (Fig. 7), we tested them on 14 apoflavodoxin mutants corresponding to single mutations involving aliphatic residues; second (Fig. 8), we tested them on a larger data set comprising mutations from seven different proteins: 14 mutants from apoflavodoxin, two from ROP protein (Vlassi et al. 1999), four from barnase (Serrano et al. 1992), eight from T4 lysozyme (Eriksson et al. 1992a; Xu et al. 1998), three from staphylococcal nuclease (Shortle et al. 1990), three from CI2 (Otzen and Fersht 1995), and two from human lysozyme (Takano et al. 1995, 1997). All of these protein variants are also single mutants involving aliphatic residues completely buried from solvent.
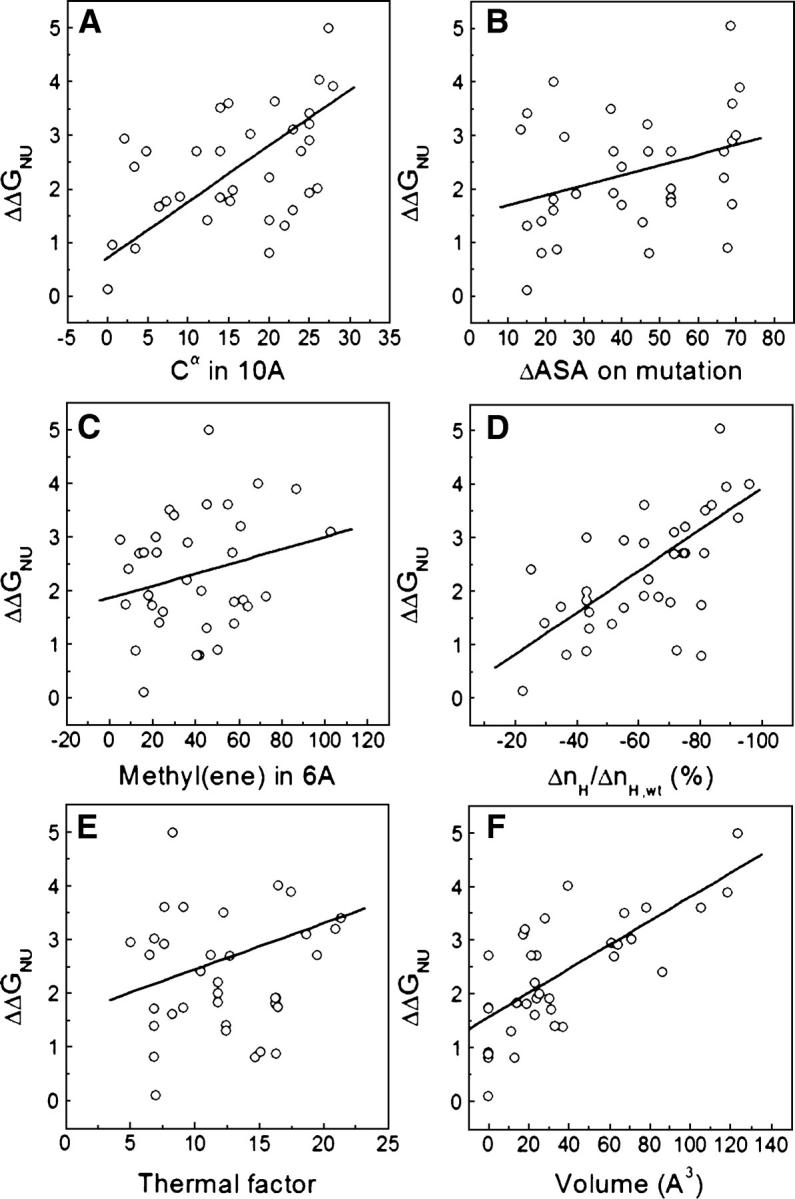
Figure 7.

Plots of ΔΔG (wild-type apoflavodoxin free energy of unfolding minus that of mutants) vs. different parameters that describe the environment of the mutated residues. (A) Number of Cα groups within a sphere of 10 Å radius centered in the Cα of the mutated residue, (B) differences in side-chain solvent-accessible area buried between wild type and mutant, (C) number of methyl or methylene side-chain groups surrounding (within a sphere of 6 Å radius) the methyl or methylene group deleted upon mutation, (D) change of contacts (calculated as contact parameter nH) relative to the wild-type protein, (E) thermal factors of the mutated residues, as extracted from the PDB file 1FTG, and (F) cavity volume created by the amino acid substitution.
Figure 8.
Plots of ΔΔG of unfolding vs. different parameters that describe the surrounding environment of mutated residues in seven different proteins: apoflavodoxin, ROP (Vlassi et al. 1999), barnase (Serrano et al. 1992), T4 lysozyme (Eriksson et al. 1992a; Xu et al. 1998), staphylococcal nuclease (Shortle et al. 1990), CI2 (Otzen and Fersht 1995), and human lysozyme (Takano et al. 1995, 1997). (A) Number of Cα groups within a sphere of 10 Å radius centered in the Cα of the mutated residue; (B) differences in side-chain solvent-accessible area buried between wild type and mutant; (C) number of methyl or methylene side-chain groups surrounding (within a sphere of 6 Å radius) the methyl or methylene group deleted upon mutation; (D) change of contacts (calculated as contact parameter nH) relative to the wild-type protein; (E) thermal factors of the mutated residues as extracted from the PDB file of the wild-type protein; (F) cavity volume created by the amino acid substitution.
For staphylococcal nuclease (Shortle et al. 1990), a correlation was found between ΔΔG and the number of Cα groups within a sphere of 10 Å radius centered in the Cα of the mutated residue (r = 0.67). This correlation does not work either for the apoflavodoxin data set (r = 0.25) (Fig. 7A) or for the larger data set of seven proteins (r = 0.44) (Fig. 8A). For barnase, two correlations were proposed (Serrano et al. 1992) that related ΔΔG with differences in the side-chain solvent-accessible area between the residue in the wild type and the mutant (r = 0.83) or with the number of methyl or methylene side-chain groups surrounding the group deleted (r = 0.91). The latter relationship was also reported to perform well (r = 0.93) for CI2 mutants (Otzen et al. 1995). However, these correlations do not work for the apoflavodoxin data set (r = 0.34 for ΔASA; r = 0.25 for number of methyl/ene) (see Fig. 7, B and C, respectively) and do not perform so well in the data set of seven proteins (r = 0.59 for ΔASA; r = 0.49 for number of methyl/ene) (see Fig. 8, B and C, respectively). Vlassi et al. (1999) introduced a contact parameter (ΔnH) as a measure of the number of van der Waals contacts lost and for a set of ROP, barnase, and T4 lysozyme mutants, they found a good correlation between ΔnH and ΔΔG (r = 0.81). The correlation observed for the 14 apoflavodoxin mutants (r = 0.52) (Fig. 7D) and for the data set of seven proteins (r = 0.68) (Fig. 8D) are lower. Mutations that substantially destabilized T4 lysozyme were traced to environments with low thermal motions (Alber et al. 1987; Matthews 1993). Takano et al. (1995) showed in human lysozyme an inverse correlation between residue mobility and destabilization (r = 0.84). This correlation does not hold either for apoflavodoxin (r = 0.14) (Fig. 7E) or for the complete data set (r = 0.38) (Fig. 8E). It seems thus that most correlations described for a given protein or set of proteins perform poorly on different or simply larger data sets, which stresses the fact that the energetics of cavity-creating mutations in protein hydrophobic cores are, at least to some extent, site- or type-dependent.
A further attempt to relate the structure and energetics of hydrophobic large-to-small replacements was carried out on T4 lysozyme mutants for which ΔΔG was found to correlate (r = 0.96) to the size of the engineered cavities (Eriksson et al. 1992b) with a slope of 22 cal.mol−1Å−3 (Xu et al. 1998). This linear correlation was roughly confirmed in other proteins (Takano et al. 1995; Buckle et al. 1996), but more recently it was claimed to be not so general (r = 0.51 for ROP [Vlassi et al. 1999]). However, the correlation performs quite well in the apoflavodoxin data set (r = 0.87) (Fig. 7F) with a slope of 21 cal.mol−1Å−3 and an intercept of +1.9 kcal.mol−1. For the set of seven proteins, the correlation is still reasonable (r = 0.72) (Fig. 8F), with a very similar slope of 22 cal.mol−1Å−3 and an intercept of +1.6 kcal.mol−1.
The work by Matthews’ lab (Eriksson et al. 1992b; Xu et al. 1998) showed that the energetic effect of both Leu or Ile to Ala mutations could be correlated to the volume of the created cavity at a rate of 22 cal.mol−1Å−3, and that each type of mutation had, in addition, an intrinsic destabilizing effect that could be attributed to the specific hydrophobicity of the substituted side chain as measured by water/octanol transfer experiments (Fauchere and Pliska 1983). For valine to alanine mutations, the data were more scattered. To investigate whether the same principles can be extended to other proteins and to different mutations, we separated the flavodoxin mutations into three groups and performed specific correlations for Leu to Ala, Val to Ala, and Ile to Val mutations. For the three subsets, the slope of ΔΔG versus cavity volume plots displays values between 20 and 23 cal.mol−1Å−3. The intercepts of the plots, however, differ from 1.4 and 1.5 kcal.mol−1 for Val to Ala and Leu to Ala mutations to 0.9 kcal.mol−1 for Ile to Val ones, which is in qualitative agreement with the corresponding water/octanol difference transfer energies of 1.2, 1.9, and 0.7 kcal.mol−1 (Xu et al. 1998). An equivalent analysis performed in the seven-protein database gives slope values ranging from 20 to 24 cal.mol−1Å−3 and intercepts that correlate reasonably well with water-to-octanol transfer energies (r = 0.88) (Fig. 9). The intercepts also correlate well with the ΔASA of the mutated side chains in the denatured state as calculated using three different types of denatured state models: extended Ala-X-Ala tripeptide (r = 0.79) (Shrake and Rupley 1973), extended Gly-X-Gly tripeptide (r = 0.85) (Miller et al. 1987), and 15-mer in silico modeled peptide (r = 0.82) (Creamer et al. 1995). The data corresponding to the four types of mutations (Ile to Ala, Leu to Ala, Val to Ala, and Ile to Val) investigated in the seven proteins data set were brought to a common, hydrophobicity-independent reference state by substracting the intercepts (Fig. 10). This raises the correlation between ΔΔG and cavity volume from 0.72 (Fig. 8F) to 0.90. Further attempts to improve the correlation considering additional terms accounting for differences in side-chain entropy or secondary structure propensity did not work. Our analyses thus support the proposal (Eriksson et al. 1992b) that the change in free energy upon replacement of Leu or Ile to Ala can be reasonably explained by a combination of differential hydrophobicity plus a term proportional to cavity volume. In addition, the correlation is now extended to Ile to Val and to Val to Ala mutations. All branching-conservative, side-chain shortenings of purely aliphatic residues are thus explained using the same principles.
Figure 9.

Correlation between transfer energies and interceptors of linear relationships between cavity volume and experimental ΔΔG for different types of mutations (Leu to Ala, Val to Ala, Ile to Val, and Ile to Ala) implemented in any of the seven proteins of the data set (see Materials and Methods). The dashed line shows a unity fit.
Figure 10.

The experimentally determined ΔΔG values shown in Figure 8F have been brought to a common reference state (hydrophobicity-independent) by subtraction of the intercepts of mutation-type separated plots of ΔΔGNU vs. volume (see Discussion).
Does the “consensus approach” work for hydrophobic mutations?
Sequence comparison has been used as a tool to design thermostabilizing substitutions (Serrano et al. 1993; Steipe et al. 1994; Wirtz and Steipe 1999). From an alignment of more than 350 different SH3 domains (Maxwell and Davidson 1998), a correlation was found between residue conservation and thermodynamic stabilities of mutants constructed at two different positions (r = 0.79). The term “consensus approach” was coined to refer to the fact that a set of amino acid sequences of homologous proteins contains sufficient information to allow a rapid design of thermal stabilization (Lehmann et al. 2002). The approach has been used in the stabilization of a GroEL minichaperone (Wang et al. 2000) and a fungal pythase (Lehmann et al. 2000). As has been pointed out (Campos et al. 2004b), the consensus approach is a practical application of the known and yet surprising fact that natural protein sequences seem to comply to some extent to Boltzmann's law (Fernandez-Recio and Sancho 1998; Shortle 2003; Campos et al. 2004; Godoy-Ruiz et al. 2004). Sequence alignments performed on several protein families, including ubiquitin (Finucane and Woolfson 1999), staphylococcal nuclease (Chen and Stites 2001b), GroES (Taneja and Mande 1999), Ig-like domains (Halaby et al. 1999), and SH3 (Di Nardo et al. 2003) have shown that individual positions in the hydrophobic core generally display distinct preferences for particular types of hydrophobic residues. Di Nardo et al. (2003) have found that experimentally determined ΔΔG values in SH3 domains show a good linear correlation (r = 0.78, with a slope of 1) with conservation energies. In this line, we have recently reported that the overall stabilization afforded by charge-reversal mutations in apoflavodoxin (Campos et al. 2004b) correlates linearly with weighted conservation energies (r = 0.89), so that the stabilization of charge-reversal stabilizing mutations can be predicted semiquantitatively from simple sequence comparison within the flavodoxin family. To assess whether the energetics of aliphatic deletions can be similarly predicted from sequence comparison, we analyzed 75 flavodoxin sequences from different species (López-Llano et al. 2004) and calculated conservation energies (Di Nardo et al. 2003) for the positions mutated (Table 5). The correlation between conformational stability and conservation energy is not very strong (r = 0.50 with a slope of 0.94 if one mutant is excluded). The predictive power of “conservation energies” for aliphatic deletions is thus low, at least in the flavodoxin family.
Conclusion
A total of 14 buried, branching-conservative shortening mutations involving apolar aliphatic residues have been implemented in apoflavodoxin, giving rise to large protein destabilization without introducing major changes in protein structure. In the thermal unfolding, the overall N-to-U destabilization is partitioned into destabilization of the native state relative to an unfolding intermediate (Sancho et al. 2002) and destabilization of the intermediate toward its full unfolding, which lowers the destabilizing impact exerted by the mutations on the native conformation. This suggests that stabilization of three- (or more) state proteins by cavity filling may be of limited success, unless the filled cavity is specifically located in an unfolded region of the intermediate.
An analysis of several structure–energetics relationships proposed to explain mutational effects on protein stability associated to apolar-buried shortening mutations was performed using the apoflavodoxin data set and a larger data set comprising aliphatic-shortening mutations described for seven different proteins. The analysis indicates that modeled cavity volume (Machicado et al. 2002) plus differential hydrophobicity (Eriksson et al. 1992b) are good predictors of the observed energetics, as previously proposed (Xu et al. 1998) for a smaller data set of lysozyme T4 mutants of known X-ray structures. In contrast, unlike what has been described for SH3 domains (Di Nardo et al. 2003), sequence conservation analysis seems to not work so well.
Materials and methods
Mutagenesis, protein purification and quantitation, and apoprotein preparation
The Anabaena PCC7119 flavodoxin gene was mutated using the QuikChange site-directed mutagenesis kit (Stratagene). The following substitutions were made: I22V, L50A, L105A, I109A, V160A, W66F, W66F/L44A, and W66F/L105A (Fig. 1), replacing buried hydrophobic residues by smaller ones. In addition, the mutants L6A, V31A, I51V, I52V, A84G, V117A, V139A, L143A, and I156V (Campos et al. 2004) were used in the analysis (Table 1). The 17 mutants were purified as described (Fillat et al. 1991) and, in all cases, the final preparations were homogeneous as judged by SDS-PAGE.
To obtain the apoflavodoxins, the flavin mononucleotide group was removed from the holoproteins by precipitation with trichloroacetic acid (Edmondson and Tollin 1971). Apoflavodoxin concentration was determined from the absorbance at 280 nm using an extinction coefficient of 34.1 mM−1 cm−1 (Genzor et al. 1996a), except for W66F and variants containing this mutation, for which an extinction coefficient of 27.6 mM−1 cm−1 was used (S. Zorrilla, unpubl.).
Absorbance, fluorescence, and circular dicroism (CD) spectra
Emission fluorescence were recorded at 25.0° ± 0.1°C in 50 mM MOPS (pH 7.0), in an Aminco-Bowman Series 2 fluorimeter. CD spectra were recorded in a Jasco 710 spectropolarimeter at 25.0° ± 0.1°C. Near-UV CD spectra were measured in a 1-cm path-length cuvette with 40 μM apoprotein solutions in 50 mM MOPS (pH 7). Far-UV CD spectra were recorded in a 1-mm path-length cuvette using 20 μM apoprotein solutions in 5 mM MOPS (pH 7), with 15 mM NaCl to obtain the same ionic strength of the 50 mM MOPS buffer. Thermal and urea denaturation curves were recorded in the same instruments.
Urea denaturation equilibrium
Protein samples were prepared by mixing 900-μL urea solutions of different concentrations with 100-μL aliquots of 20 μM apoprotein in 500 mM MOPS (pH 7.0). The unfolding at 25.0° ± 0.1°C was followed, after equilibration for 30 min by measuring a ratio of fluorescence emission (320:360 nm, with excitation at 280 nm; see López-Llano et al. 2006 for details). The urea unfolding of apoflavodoxin at pH 7.0 is two-state (Genzor et al. 1996a). The unfolding curves were analyzed assuming that the free energy of unfolding, ΔG, is a linear function of urea concentration (Pace 1990):
where ΔGw is the free energy of unfolding in the absence of denaturant, D is the molar concentration of urea, and m is a proportionality constant. The spectroscopic signal of the folded (SF) and unfolded (SU) states are assumed to vary linearly with urea concentration (Bolen and Santoro 1988) with slopes mF and mU, respectively. Under this assumption, the observed spectroscopic signal follows:
 |
where R is the gas constant and T is the absolute temperature.
Thermal unfolding followed spectroscopically
Four different spectroscopic techniques were used to follow the thermal denaturation of each protein variant. For fluorescence, a ratio of emission (320:360 nm with excitation at 280 nm) was used to minimize the strong temperature dependence of the baselines. Apoprotein concentration was 2 μM in 50 mM MOPS (pH 7). Circular dichroism and absorbance in the near-UV were simultaneously measured at 291 nm using 40 μM apoflavodoxin solution in 50 mM MOPS (pH 7). Circular dichroism in the far-UV (222 nm) was recorded using 1 μM apoprotein solution in 5 mM MOPS (pH 7), with 15 mM NaCl. Near- and far-UV experiments were carried out using a 1-cm path-length cuvette.
Thermal unfolding: Three-state global analysis
Global fitting of the four thermal unfolding curves recorded for each protein (fluorescence, far-UV CD, near-UV CD, and near-UV absorbance) to a three-state model involving native (N), intermediate (I), and unfolded (U) conformations was performed with the program MLAB (Civilized Software, Inc.).
For each protein, the curves were fitted to the following three-state equation, with an adaptation (Campos et al. 2004) of the one previously described for a two-state model (Privalov 1979):
 |
with
where Y is the observed spectroscopic signal; YN, YI, and YD are spectroscopic signals at T = 0 K of the native, intermediate, and denatured states, respectively; mN, mI, and mD are slopes that describe the temperature dependence of the spectroscopic signals of the native, intermediate, and denatured states, respectively; ΔHNI, TmNI, and ΔCpNI correspond, respectively, to the enthalpy change, the melting temperature, and the change in heat capacity of the first transition; and ΔHIU, TmIU, and ΔCpIU to those of the second transition . For each mutant, the four thermal unfolding curves were roughly normalized in order to obtain property value spans of ∼1–0, which balances the contribution of the different curves in the fitting without having to perform preliminary individual fits. All of the curves were then globally fitted to common ΔH, Tm, and ΔCp values using MLAB (Civilized Software, Inc.). Due to the typically large errors associated to fitted ΔCp values, the ΔCp values were constrained in the fitting to be within the standard deviation interval around the mean of the ΔCp values calculated without restrictions for 40 different apoflavodoxin mutants as described in Campos et al. (2004a). Standard deviations have been determined as described in Beechem (1992).
Equilibrium Φ−analysis of the thermal intermediate
Inspired in classical Φ-analysis (Fersht et al. 1992) originally devised to map out side-chain interactions in transition states of protein unfolding and in transient intermediates, we have recently developed equilibrium Φ-analysis as a way to investigate the integrity in equilibrium intermediates of side-chain interactions present in native states (Irun et al. 2001a; Campos et al. 2004; Korkin et al. 2005). In this analysis, Φ values of 1 or 0 represent native interactions that are present or absent, respectively, in the intermediate, while intermediate Φ values, especially those at internal positions, are interpreted as indicative of weakened interactions. Equilibrium Φ-values are calculated as:
Although Equations 4 and 5 provide a way to calculate ΔGNI and ΔGIU values, the inaccuracy of the fitted ΔCp values misadvises it, and we use a simplified equation that allows us to calculate equilibrium Φ values at a precise reference temperature (chosen at 317.3 K). The details of the fitting have been previously described (Campos et al. 2004).
Modeling of protein mutant structure: Cavity volume and solvent accessibility calculations
The modeling of the mutant structures was done as described in Machicado et al. (2002). Energy minimizations were carried out using the CHARMm force field (Brooks et al. 1983). A cutoff distance of 11 Å was used for nonbonded interactions (with a smoothing from 8 Å). Each structure was energy-minimized, without restrictions, using the method of steepest descent (2000 steps). Minimizations were started from the X-ray structure of wild-type Anabaena PCC 7119 apoflavodoxin after having implemented the appropriate in silico mutation. Cavity volume was calculated with a probe radius of 1.4 Å using the Connolly method (Connolly 1983) as implemented in SwissPDBViewer (Guex and Peitsch 1996).
The difference in solvent-accessible area buried in wild-type and mutant folded proteins was estimated as described (Serrano et al. 1992). First, the solvent accessibility of the residue of interest in the wild-type structure (calculated using the Lee and Richards algorithm [Lee and Richards 1971]) was subtracted from that calculated for that residue in an extended tripeptide Gly-X-Gly (Miller et al. 1987) to give a value A. In parallel, the in silico mutation was performed by deleting the appropriate carbon atoms from the coordinate file of the wild-type protein, and the solvent-accessible area of the mutated residue in the protein was calculated. This value was subtracted from the one calculated in the tripeptide to give a value B. The difference between the two, A–B, is the loss of solvent-accessible area buried in the folded protein upon mutation.
Cavity volumes and differences in solvent-accessible area were also calculated in mutants from ROP (Vlassi et al. 1999), barnase (Serrano et al. 1992), T4 lysozyme (Eriksson et al. 1992a; Xu et al. 1998), staphylococcal nuclease (Shortle et al. 1990), CI2 (Otzen and Fersht 1995), and human lysozyme (Takano et al. 1995, 1997).
Analysis of packing density
The number of contacts between residues located at the site of mutation was calculated on the wild-type structure (PDB code 1ftg) and modeled mutants using the WHATIF software package (Vriend 1990). Similar calculations were made in mutant proteins from ROP (1rop), barnase (1bni), T4 lysozyme (1l63), staphylococcal nuclease (1stn), chymotrypsin inhibitor (2ci2), and human lysozyme (1lz1).
Residue contact parameters, nH, were calculated as defined (Vlassi et al. 1999). Each atom i of a given core residue h (site of mutation) is assumed to make Ni contacts to j atoms within a 6 Å radius. Each contact is weighted by 1/dij, the inverse of the distance between atom i and j, and by 1/racc,j, the inverse of the relative accessibility area (calculated using NACCESS [Hubbard et al. 1991]) of the residue to which atom j belongs.
 |
Packing densities were calculated in two ways: as the number of methyl and methylene groups within 6 Å of any side-chain atom removed by mutation (Otzen and Fersht 1995) and as the number of Cα carbons within a sphere of 10 Å radius from the Cα of the mutated residue (Shortle et al. 1990). These calculations were performed using the MMTK software (Hinsen 2000).
Flavodoxin sequence alignment
A total of 75 flavodoxins homologs of the Anabaena PCC7119 flavodoxin sequence were identified with BLAST (Altschul et al. 1997) and preliminarily aligned with CLUSTALW (Thompson et al. 1994). Incomplete sequences were discarded and the remaining sequences realigned. Each sequence was weighted following an established procedure (Henikoff and Henikoff 1994) so that weighted percentages of conservation of residues at each flavodoxin position mutated in this work were calculated.
Acknowledgments
We acknowledge financial support from grant BFU2004-01411 (Spain). M.B., L.A.C., and J.E. were supported by MEC fellowships.
Footnotes
Reprint requests to: Javier Sancho, Departamento de Bioquímica y Biología Molecular y Celular, Facultad de Ciencias, Universidad de Zaragoza, E 50009-Zaragoza, Spain; e-mail: jsancho@unizar.es; fax: +34-976-76-21-23.
Article and publication are at http://www.proteinscience.org/cgi/doi/10.1110/ps.062274906.
References
- Adamek D.H., Guerrero L., Blaber M., Caspar D.L. 2005. Structural and energetic consequences of mutations in a solvated hydrophobic cavity. J. Mol. Biol. 346: 307–318. [DOI] [PubMed] [Google Scholar]
- Akasako A., Haruki M., Oobatake M., Kanaya S. 1997. Conformational stabilities of Escherichia coli RNase HI variants with a series of amino acid substitutions at a cavity within the hydrophobic core. J. Biol. Chem. 272: 18686–18693. [DOI] [PubMed] [Google Scholar]
- Alber T., Sun D.P., Nye J.A., Muchmore D.C., Matthews B.W. 1987. Temperature-sensitive mutations of bacteriophage T4 lysozyme occur at sites with low mobility and low solvent accessibility in the folded protein. Biochemistry 26: 3754–3758. [DOI] [PubMed] [Google Scholar]
- Altschul S.F., Madden T.L., Schaffer A.A., Zhang J., Zhang Z., Miller W., Lipman D.J. 1997. Gapped BLAST and PSI-BLAST: A new generation of protein database search programs. Nucleic Acids Res. 25: 3389–3402. [DOI] [PMC free article] [PubMed] [Google Scholar]
- Baase W.A., Eriksson A.E., Zhang X.J., Heinz D.W., Sauer U., Blaber M., Baldwin E.P., Wozniak J.A., Matthews B.W. 1992. Dissection of protein structure and folding by directed mutagenesis. Faraday Discuss. 93: 173–181. [DOI] [PubMed] [Google Scholar]
- Bairoch A. and Apweiler R. 1997. The SWISS-PROT protein sequence database: Its relevance to human molecular medical research. J. Mol. Med. 75: 312–316. [PubMed] [Google Scholar]
- Beechem J.M. 1992. Global analysis of biochemical and biophysical data. Methods Enzymol. 210: 37–54. [DOI] [PubMed] [Google Scholar]
- Bolen D.W. and Santoro M.M. 1988. Unfolding free energy changes determined by the linear extrapolation method. 2. Incorporation of ΔGN-U values in a thermodynamic cycle. Biochemistry 27: 8069–8074. [DOI] [PubMed] [Google Scholar]
- Brooks B., Bruccoleri R., Olafson B., States D., Swaminathan S., Karplus M. 1983. CHARMM: A program for macromolecular energy, minimisation, and dynamics calculations. J. Comput. Chem. 4: 187–217. [Google Scholar]
- Buckle A.M., Henrick K., Fersht A.R. 1993. Crystal structural analysis of mutations in the hydrophobic cores of barnase. J. Mol. Biol. 234: 847–860. [DOI] [PubMed] [Google Scholar]
- Buckle A.M., Cramer P., Fersht A.R. 1996. Structural and energetic responses to cavity-creating mutations in hydrophobic cores: Observation of a buried water molecule and the hydrophilic nature of such hydrophobic cavities. Biochemistry 35: 4298–4305. [DOI] [PubMed] [Google Scholar]
- Bueno M., Cremades N., Neira J.L., Sancho J. 2006. Filling small, empty protein cavities: Structural and energetic consequences. J. Mol. Biol. 358: 701–712. [DOI] [PubMed] [Google Scholar]
- Campos L.A., Bueno M., Lopez-Llano J., Jiménez M.A., Sancho J. 2004a. Structure of stable protein folding intermediates by equilibrium ϕ-analysis: The apoflavodoxin thermal intermediate. J. Mol. Biol. 344: 239–255. [DOI] [PubMed] [Google Scholar]
- Campos L.A., Garcia-Mira M.M., Godoy-Ruiz R., Sanchez-Ruiz J.M., Sancho J. 2004b. Do proteins always benefit from a stability increase? Relevant and residual stabilisation in a three-state protein by charge optimisation. J. Mol. Biol. 344: 223–237. [DOI] [PubMed] [Google Scholar]
- Campos L.A., Cuesta-Lopez S., López-Llano J., Falo F., Sancho J. 2005. A double-deletion method to quantifying incremental binding energies in proteins from experiment. Example of a destabilizing hydrogen bonding pair. Biophys. J. 88: 1311–1321. [DOI] [PMC free article] [PubMed] [Google Scholar]
- Chan H.S. and Dill K.A. 1990. Origins of structure in globular proteins. Proc. Natl. Acad. Sci. 87: 6388–6392. [DOI] [PMC free article] [PubMed] [Google Scholar]
- Chen J. and Stites W.E. 2001a. Energetics of side chain packing in staphylococcal nuclease assessed by systematic double mutant cycles. Biochemistry 40: 14004–14011. [DOI] [PubMed] [Google Scholar]
- Chen J. and Stites W.E. 2001b. Packing is a key selection factor in the evolution of protein hydrophobic cores. Biochemistry 40: 15280–15289. [DOI] [PubMed] [Google Scholar]
- Connolly M.L. 1983. Solvent-accessible surfaces of proteins and nucleic acids. Science 221: 709–713. [DOI] [PubMed] [Google Scholar]
- Creamer T.P., Srinivasan R., Rose G.D. 1995. Modeling unfolded states of peptides and proteins. Biochemistry 34: 16245–16250. [DOI] [PubMed] [Google Scholar]
- Dill K.A. 1990. Dominant forces in protein folding. Biochemistry 29: 7133–7155. [DOI] [PubMed] [Google Scholar]
- Di Nardo A.A., Larson S.M., Davidson A.R. 2003. The relationship between conservation, thermodynamic stability, and function in the SH3 domain hydrophobic core. J. Mol. Biol. 333: 641–655. [DOI] [PubMed] [Google Scholar]
- Edmondson D.E. and Tollin G. 1971. Flavin-protein interactions and the redox properties of the Shethna flavoprotein. Biochemistry 10: 133–145. [DOI] [PubMed] [Google Scholar]
- Eriksson A.E., Baase W.A., Wozniak J.A., Matthews B.W. 1992a. A cavity-containing mutant of T4 lysozyme is stabilized by buried benzene. Nature 355: 371–373. [DOI] [PubMed] [Google Scholar]
- Eriksson A.E., Baase W.A., Zhang X.J., Heinz D.W., Blaber M., Baldwin E.P., Matthews B.W. 1992b. Response of a protein structure to cavity-creating mutations and its relation to the hydrophobic effect. Science 255: 178–183. [DOI] [PubMed] [Google Scholar]
- Eyal E., Najmanovich R., Edelman M., Sobolev V. 2003. Protein side-chain rearrangement in regions of point mutations. Proteins 50: 272–282. [DOI] [PubMed] [Google Scholar]
- Fauchere J.L. and Pliska V. 1983. Hydrophobic parameters π of amino-acid side-chains from the partitioning of N-Acetyl-amino-acid amides. Eur. J. Med. Chem. 18: 369–375. [Google Scholar]
- Fernandez-Recio J. and Sancho J. 1998. Intrahelical side chain interactions in α-helices: Poor correlation between energetics and frequency. FEBS Lett. 429: 99–103. [DOI] [PubMed] [Google Scholar]
- Fernandez-Recio J., Romero A., Sancho J. 1999. Energetics of a hydrogen bond (charged and neutral) and of a cation-π interaction in apoflavodoxin. J. Mol. Biol. 290: 319–330. [DOI] [PubMed] [Google Scholar]
- Fersht A.R., Matouschek A., Serrano L. 1992. The folding of an enzyme. I. Theory of protein engineering analysis of stability and pathway of protein folding. J. Mol. Biol. 224: 771–782. [DOI] [PubMed] [Google Scholar]
- Fillat M.F., Borrias W.E., Weisbeek P.J. 1991. Isolation and overexpression in Escherichia coli of the flavodoxin gene from Anabaena PCC7119. Biochem. J. 280: 187–191. [DOI] [PMC free article] [PubMed] [Google Scholar]
- Finucane M.D. and Woolfson D.N. 1999. Core-directed protein design. II. Rescue of a multiply mutated and destabilized variant of ubiquitin. Biochemistry 38: 11613–11623. [DOI] [PubMed] [Google Scholar]
- Genzor C.G., Beldarrain A., Gomez-Moreno C., Lopez-Lacomba J.L., Cortijo M., Sancho J. 1996a. Conformational stability of apoflavodoxin. Protein Sci. 5: 1376–1388. [DOI] [PMC free article] [PubMed] [Google Scholar]
- Genzor C.G., Perales-Alcon A., Sancho J., Romero A. 1996b. Closure of a tyrosine/tryptophan aromatic gate leads to a compact fold in apoflavodoxin. Nat. Struct. Biol. 3: 329–332. [DOI] [PubMed] [Google Scholar]
- Godoy-Ruiz R., Perez-Jimenez R., Ibarra-Molero B., Sanchez-Ruiz J.M. 2004. Relation between protein stability, evolution and structure, as probed by carboxylic acid mutations. J. Mol. Biol. 336: 313–318. [DOI] [PubMed] [Google Scholar]
- Guex N. and Peitsch M. 1996. Swiss-PdbViewer: A fast and easy-to-use PDB viewer for Macintosh and PC. Protein Data Bank Quarterly Newsletter 77:–7.
- Halaby D.M., Poupon A., Mornon J. 1999. The immunoglobulin fold family: Sequence analysis and 3D structure comparisons. Protein Eng. 12: 563–571. [DOI] [PubMed] [Google Scholar]
- Henikoff S. and Henikoff J.G. 1994. Position-based sequence weights. J. Mol. Biol. 243: 574–578. [DOI] [PubMed] [Google Scholar]
- Hinsen K. 2000. The Molecular Modeling Toolkit: A new approach to molecular simulations. J. Comput. Chem. 21: 79–85. [Google Scholar]
- Hubbard S.J. and Argos P. 1994. Cavities and packing at protein interfaces. Protein Sci. 3: 2194–2206. [DOI] [PMC free article] [PubMed] [Google Scholar]
- Hubbard S.J., Campbell S.F., Thornton J.M. 1991. Molecular recognition. Conformational analysis of limited proteolytic sites and serine proteinase protein inhibitors. J. Mol. Biol. 220: 507–530. [DOI] [PubMed] [Google Scholar]
- Hubbard S.J., Gross K.H., Argos P. 1994. Intramolecular cavities in globular proteins. Protein Eng. 7: 613–626. [DOI] [PubMed] [Google Scholar]
- Irun M.P., Garcia-Mira M.M., Sanchez-Ruiz J.M., Sancho J. 2001a. Native hydrogen bonds in a molten globule: The apoflavodoxin thermal intermediate. J. Mol. Biol. 306: 877–888. [DOI] [PubMed] [Google Scholar]
- Irun M.P., Maldonado S., Sancho J. 2001b. Stabilization of apoflavodoxin by replacing hydrogen-bonded charged Asp or Glu residues by the neutral isosteric Asn or Gln. Protein Eng. 14: 173–181. [DOI] [PubMed] [Google Scholar]
- Ishikawa K., Nakamura H., Morikawa K., Kanaya S. 1993. Stabilization of Escherichia coli ribonuclease HI by cavity-filling mutations within a hydrophobic core. Biochemistry 32: 6171–6178. [PubMed] [Google Scholar]
- Jackson S.E., Moracci M., elMasry N., Johnson C.M., Fersht A.R. 1993. Effect of cavity-creating mutations in the hydrophobic core of chymotrypsin inhibitor 2. Biochemistry 32: 11259–11269. [DOI] [PubMed] [Google Scholar]
- Kellis J.T. Jr., Nyberg K., Fersht A.R. 1989. Energetics of complementary side-chain packing in a protein hydrophobic core. Biochemistry 28: 4914–4922. [DOI] [PubMed] [Google Scholar]
- Langdon G.M., Jiménez M.A., Genzor C.G., Maldonado S., Sancho J., Rico M. 2001. Anabaena apoflavodoxin hydrogen exchange: On the stable exchange core of the α/β(21345) flavodoxin-like family. Proteins 43: 476–488. [DOI] [PubMed] [Google Scholar]
- Lassalle M.W., Yamada H., Morii H., Ogata K., Sarai A., Akasaka K. 2001. Filling a cavity dramatically increases pressure stability of the c-Myb R2 subdomain. Proteins 45: 96–101. [DOI] [PubMed] [Google Scholar]
- Lee B. and Richards F.M. 1971. The interpretation of protein structures: Estimation of static accessibility. J. Mol. Biol. 55: 379–400. [DOI] [PubMed] [Google Scholar]
- Lehmann M., Pasamontes L., Lassen S.F., Wyss M. 2000. The consensus concept for thermostability engineering of proteins. Biochim. Biophys. Acta 1543: 408–415. [DOI] [PubMed] [Google Scholar]
- Lehmann M., Loch C., Middendorf A., Studer D., Lassen S.F., Pasamontes L., van Loon A.P., Wyss M. 2002. The consensus concept for thermostability engineering of proteins: Further proof of concept. Protein Eng. 15: 403–411. [DOI] [PubMed] [Google Scholar]
- López-Llano J., Maldonado S., Bueno M., Lostao A., Angeles-Jimenez M., Lillo M.P., Sancho J. 2004. The long and short flavodoxins: I. The role of the differentiating loop in apoflavodoxin strcuture and FMN binding. J. Biol. Chem. 279: 47177–47183. [DOI] [PubMed] [Google Scholar]
- López-Llano J., Campos L.A., Bueno M., Sancho J. 2006. Equilibrium Φ-analysis of a molten globule: The 1-149 apoflavodoxin fragment. 356: 354–366. [DOI] [PubMed]
- Lostao A., El Harrous M., Daoudi F., Romero A., Parody-Morreale A., Sancho J. 2000. Dissecting the energetics of the apoflavodoxin-FMN complex. J. Biol. Chem. 275: 9518–9526. [DOI] [PubMed] [Google Scholar]
- Lostao A., Daoudi F., Irun M.P., Ramon A., Fernandez-Cabrera C., Romero A., Sancho J. 2003. How FMN binds to anabaena apoflavodoxin: A hydrophobic encounter at an open binding site. J. Biol. Chem. 278: 24053–24061. [DOI] [PubMed] [Google Scholar]
- Machicado C., Bueno M., Sancho J. 2002. Predicting the structure of protein cavities created by mutation. Protein Eng. 15: 669–675. [DOI] [PubMed] [Google Scholar]
- Maldonado S., Lostao A., Irun M.P., Fernandez-Recio J., Gustavo Genzor C., Begona Gonzalez E., Rubio J.A., Luquita A., Daoudi F., Sancho J. 1998. Apoflavodoxin: Structure, stability, and FMN binding. Biochimie 80: 813–820. [DOI] [PubMed] [Google Scholar]
- Matsumura M., Becktel W.J., Matthews B.W. 1988. Hydrophobic stabilization in T4 lysozyme determined directly by multiple substitutions of Ile-3. Nature 334: 406–410. [DOI] [PubMed] [Google Scholar]
- Matthews B.W. 1993. Structural and genetic-analysis of protein-folding and stability. Curr. Opin. Struct. Biol. 3: 589–593. [Google Scholar]
- Maxwell K.L. and Davidson A.R. 1998. Mutagenesis of a buried polar interaction in an SH3 domain: Sequence conservation provides the best prediction of stability effects. Biochemistry 37: 16172–16182. [DOI] [PubMed] [Google Scholar]
- Milla M.E., Brown B.M., Sauer R.T. 1994. Protein stability effects of a complete set of alanine substitutions in Arc repressor. Nat. Struct. Biol. 1: 518–523. [DOI] [PubMed] [Google Scholar]
- Miller S., Janin J., Lesk A.M., Chothia C. 1987. Interior and surface of monomeric proteins. J. Mol. Biol. 196: 641–656. [DOI] [PubMed] [Google Scholar]
- Munson M., Balasubramanian S., Fleming K.G., Nagi A.D., O'Brien R., Sturtevant J.M., Regan L. 1996. What makes a protein a protein? Hydrophobic core designs that specify stability and structural properties. Protein Sci. 5: 1584–1593. [DOI] [PMC free article] [PubMed] [Google Scholar]
- Ohmura T., Ueda T., Ootsuka K., Saito M., Imoto T. 2001. Stabilization of hen egg white lysozyme by a cavity-filling mutation. Protein Sci. 10: 313–320. [DOI] [PMC free article] [PubMed] [Google Scholar]
- Otzen D.E. and Fersht A.R. 1995. Side-chain determinants of β-sheet stability. Biochemistry 34: 5718–5724. [DOI] [PubMed] [Google Scholar]
- Otzen D.E., Rheinnecker M., Fersht A.R. 1995. Structural factors contributing to the hydrophobic effect: The partly exposed hydrophobic minicore in chymotrypsin inhibitor 2. Biochemistry 34: 13051–13058. [DOI] [PubMed] [Google Scholar]
- Pace C.N. 1990. Conformational stability of globular proteins. Trends Biochem. Sci. 15: 14–17. [DOI] [PubMed] [Google Scholar]
- Pace C.N. 1992. Contribution of the hydrophobic effect to globular protein stability. J. Mol. Biol. 226: 29–35. [DOI] [PubMed] [Google Scholar]
- Pace C.N. and Laurents D.V. 1989. A new method for determining the heat capacity change for protein folding. Biochemistry 28: 2520–2525. [DOI] [PubMed] [Google Scholar]
- Privalov P.L. 1979. Stability of proteins: Small globular proteins. Adv. Protein Chem. 33: 167–241. [DOI] [PubMed] [Google Scholar]
- Rashin A.A., Iofin M., Honig B. 1986. Internal cavities and buried waters in globular proteins. Biochemistry 25: 3619–3625. [DOI] [PubMed] [Google Scholar]
- Sancho J. 2006. Flavodoxin: Sequence, folding, binding, function and beyond. Cell. Mol. Life Sci. 63: 855–864. [DOI] [PMC free article] [PubMed] [Google Scholar]
- Sancho J., Bueno M., Campos L.A., Fernandez-Recio J., Irun M.P., Lopez J., Machicado C., Pedroso I., Toja M. 2002. The ‘relevant’ stability of proteins with equilibrium intermediates. ScientificWorldJournal 2: 1209–1215. [DOI] [PMC free article] [PubMed] [Google Scholar]
- Sandberg W.S. and Terwilliger T.C. 1991. Energetics of repacking a protein interior. Proc. Natl. Acad. Sci. 88: 1706–1710. [DOI] [PMC free article] [PubMed] [Google Scholar]
- Serrano L., Kellis J.T. Jr., Cann P., Matouschek A., Fersht A.R. 1992. The folding of an enzyme. II. Substructure of barnase and the contribution of different interactions to protein stability. J. Mol. Biol. 224: 783–804. [DOI] [PubMed] [Google Scholar]
- Serrano L., Day A.G., Fersht A.R. 1993. Step-wise mutation of barnase to binase. A procedure for engineering increased stability of proteins and an experimental analysis of the evolution of protein stability. J. Mol. Biol. 233: 305–312. [DOI] [PubMed] [Google Scholar]
- Shortle D. 2003. Propensities, probabilities, and the Boltzmann hypothesis. Protein Sci. 12: 1298–1302. [DOI] [PMC free article] [PubMed] [Google Scholar]
- Shortle D., Stites W.E., Meeker A.K. 1990. Contributions of the large hydrophobic amino acids to the stability of staphylococcal nuclease. Biochemistry 29: 8033–8041. [DOI] [PubMed] [Google Scholar]
- Shrake A. and Rupley J.A. 1973. Environment and exposure to solvent of protein atoms—Lysozyme and insulin. J. Mol. Biol. 79: 351–371. [DOI] [PubMed] [Google Scholar]
- Steipe B., Schiller B., Pluckthun A., Steinbacher S. 1994. Sequence statistics reliably predict stabilizing mutations in a protein domain. J. Mol. Biol. 240: 188–192. [DOI] [PubMed] [Google Scholar]
- Takano K., Ogasahara K., Kaneda H., Yamagata Y., Fujii S., Kanaya E., Kikuchi M., Oobatake M., Yutani K. 1995. Contribution of hydrophobic residues to the stability of human lysozyme: Calorimetric studies and X-ray structural analysis of the five isoleucine to valine mutants. J. Mol. Biol. 254: 62–76. [DOI] [PubMed] [Google Scholar]
- Takano K., Yamagata Y., Fujii S., Yutani K. 1997. Contribution of the hydrophobic effect to the stability of human lysozyme: Calorimetric studies and X-ray structural analyses of the nine valine to alanine mutants. Biochemistry 36: 688–698. [DOI] [PubMed] [Google Scholar]
- Takano K., Yamagata Y., Yutani K. 2003. Buried water molecules contribute to the conformational stability of a protein. Protein Eng. 16: 5–9. [DOI] [PubMed] [Google Scholar]
- Taneja B. and Mande S.C. 1999. Conserved structural features and sequence patterns in the GroES fold family. Protein Eng. 12: 815–818. [DOI] [PubMed] [Google Scholar]
- Thompson J.D., Higgins D.G., Gibson T.J. 1994. CLUSTAL W: Improving the sensitivity of progressive multiple sequence alignment through sequence weighting, position-specific gap penalties and weight matrix choice. Nucleic Acids Res. 22: 4673–4680. [DOI] [PMC free article] [PubMed] [Google Scholar]
- Vlassi M., Cesareni G., Kokkinidis M. 1999. A correlation between the loss of hydrophobic core packing interactions and protein stability. J. Mol. Biol. 285: 817–827. [DOI] [PubMed] [Google Scholar]
- Vriend G. 1990. WHAT IF: A molecular modeling and drug design program. J. Mol. Graph. 8: 52–56. [DOI] [PubMed] [Google Scholar]
- Wang Q.H., Buckle A.M., Fersht A.R. 2000. Stabilization of GroEL minichaperones by core and surface mutations. J. Mol. Biol. 298: 917–926. [DOI] [PubMed] [Google Scholar]
- Williams M.A., Goodfellow J.M., Thornton J.M. 1994. Buried waters and internal cavities in monomeric proteins. Protein Sci. 3: 1224–1235. [DOI] [PMC free article] [PubMed] [Google Scholar]
- Wirtz P. and Steipe B. 1999. Intrabody construction and expression III: Engineering hyperstable V(H) domains. Protein Sci. 8: 2245–2250. [DOI] [PMC free article] [PubMed] [Google Scholar]
- Wolfenden R. and Radzicka A. 1994. On the probability of finding a water molecule in a nonpolar cavity. Science 265: 936–937. [DOI] [PubMed] [Google Scholar]
- Xu J., Baase W.A., Baldwin E., Matthews B.W. 1998. The response of T4 lysozyme to large-to-small substitutions within the core and its relation to the hydrophobic effect. Protein Sci. 7: 158–177. [DOI] [PMC free article] [PubMed] [Google Scholar]
- Xu B., Hua Q.X., Nakagawa S.H., Jia W., Chu Y.C., Katsoyannis P.G., Weiss M.A. 2002. A cavity-forming mutation in insulin induces segmental unfolding of a surrounding α-helix. Protein Sci. 11: 104–116. [DOI] [PMC free article] [PubMed] [Google Scholar]
- Yu B., Blazer M., Gronenborn A.M., Clore G.M., Caspar D.L. 1999. Disordered water within a hydrophobic protein cavity visualized by x-ray crystallography. Proc. Natl. Acad. Sci. 96: 103–108. [DOI] [PMC free article] [PubMed] [Google Scholar]
- Yutani K., Ogasahara K., Tsujita T., Sugino Y. 1987. Dependence of conformational stability on hydrophobicity of the amino acid residue in a series of variant proteins substituted at a unique position of tryptophan synthase α subunit. Proc. Natl. Acad. Sci. 84: 4441–4444. [DOI] [PMC free article] [PubMed] [Google Scholar]