Abstract
Gene duplication is an important mechanism in the evolution of protein interaction networks. Duplications are followed by the gain and loss of interactions, rewiring the network at some unknown rate. Because rewiring is likely to change the distribution of network motifs within the duplicated interaction set, it should be possible to study network rewiring by tracking the evolution of these motifs. We have developed a mathematical framework that, together with duplication data from comparative genomic and proteomic studies, allows us to infer the connectivity of the preduplication network and the changes in connectivity over time. We focused on the whole-genome duplication (WGD) event in Saccharomyces cerevisiae. The model allowed us to predict the frequency of intergene interaction before WGD and the post duplication probabilities of interaction gain and loss. We find that the predicted frequency of self-interactions in the preduplication network is significantly higher than that observed in today's network. This could suggest a structural difference between the modern and ancestral networks, preferential addition or retention of interactions between ohnologs, or selective pressure to preserve duplicates of self-interacting proteins.
Keywords: gene duplication, network motifs, self-interacting proteins, whole-genome duplication
Complex biological networks result from the evolutionary growth of simpler networks with fewer components. Gene duplication is thought to be a key mechanism by which networks evolve and new components are added (1–6, 43). These duplication events can act on a single gene, a chromosomal segment, or even a whole genome (1, 7–11). After duplication, the duplicate genes may assume one of several fates, including differentiation of sequence and function, or loss of one of the duplicates (12–17, 44). These outcomes are thought to be affected by genetic factors including redundancy, modularization, and expression dosage (9, 12, 15, 18–22, 45).
Little is known about the rules that govern the modification of gene interactions after a duplication event or the effects of gene interaction on the fate of duplicate genes. Here, we report a mathematical framework for inferring the preduplication connectivity properties of a network and for describing its postduplication dynamics. Our method decomposes a protein interaction network into a vector of network motifs and tracks the evolution of this vector over time. We apply our methodology to the protein interaction network of Saccharomyces cerevisiae (23–29), which has undergone a whole-genome duplication (WGD) event, resulting in hundreds of coordinately duplicated gene pairs (ohnologs) (8, 9, 11).
Results and Discussion
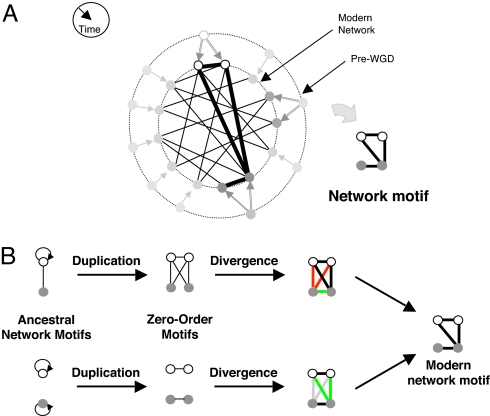
Network motifs are small subgraphs, or interaction patterns, that occur in networks more frequently than would be expected by chance (30). Motifs have been a valuable tool in identifying functional structure in many biological networks including in transcriptional, neural, and developmental networks (30, 31). We applied the concept of network motifs to WGD genes in S. cerevisiae and analyzed network motifs composed of pairs of ohnologs (namely, motifs of interactions within four proteins, Fig. 1A). There are six possible interactions between any four proteins, hence 64 possible motifs (26). This number is reduced to 19 different motif classes after accounting for the symmetry between the motif's ohnolog pairs and the symmetry of the genes within each ohnolog pair [supporting information (SI) Table 3].
Fig. 1.
Whole-genome duplication (WGD) produces network motifs between ohnolog pairs. (A) The paths genes take through time after a WGD. In most cases only one of the duplicated genes is retained (light gray). Surviving gene duplicate pairs are present as ohnologs in the modern network (white, dark gray). Interactions between any two pairs of ohnologs form a four-node subgraph (network motif) in the proteome. (B) Modern ohnolog motifs are formed through a process of duplication and divergence. Preduplication self-interacting proteins lead to a postduplication interaction between ohnologs. If two ancestral genes interacted, 4 interactions are formed between their pairs of descendants. The duplication step thus yields an initial ohnolog motif (zero-order motifs), which is subsequently modified over time. During the divergence step, interactions might be gained (green) and others are lost (red). Not everything changes: some interactions are retained (black) and other interactions remain absent (gray).
The proteins we considered for our motif analysis are the 450 WGD ohnolog pairs, as listed in Kellis et al. (8). Interactions between these proteins are listed in the Database of Interacting Proteins (DIP) (23–29). From these data we determined the modern distribution (mmodern) of our 19 motif classes (Table 1). We observe a rich variability in motif prevalences. Even for motifs with the same number of interactions, we observed that frequencies vary across several orders of magnitude, indicating that motif frequencies reflect evolutionary processes rather than stochastic effects. We then asked how much of the motif distribution observed today could be explained by a neutral model accounting for the evolutionary dynamics of gene duplication after the WGD event.
Table 1.
Motif distribution in the modern protein interaction network
| Motif class no. | Motif class | No. of motifs present in today's yeast proteome | Modern motif frequency (mmodern) |
|---|---|---|---|
| 1 | 81,983 | 8.15 × 10⁻¹ | |
| 2 | 17,748 | 1.76 × 10⁻¹ | |
| 3 | 215 | 2.13 × 10⁻³ | |
| 4 | 925 | 9.16 × 10⁻² | |
| 5 | 14 | 1.39 × 10⁻⁴ | |
| 6 | 2 | 1.98 × 10⁻⁵ | |
| 7 | 93 | 9.21 × 10⁻⁴ | |
| 8 | 15 | 1.48 × 10⁻⁴ | |
| 9 | 6 | 5.94 × 10⁻⁵ | |
| 10 | 0 | 0 | |
| 11 | 16 | 1.58 × 10⁻⁴ | |
| 12 | 0 | 0 | |
| 13 | 1 | 9.90 × 10⁻⁶ | |
| 14 | 1 | 9.90 × 10⁻⁶ | |
| 15 | 0 | 0 | |
| 16 | 4 | 3.96 × 10⁻⁵ | |
| 17 | 0 | 0 | |
| 18 | 1 | 9.90 × 10⁻⁶ | |
| 19 | 1 | 9.90 × 10⁻⁶ |
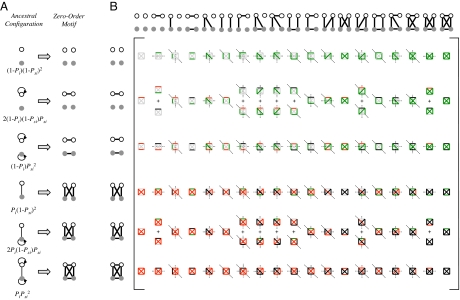
We developed a model describing protein connectivity within the subnetwork of surviving ohnologs (Fig. 1A) (5, 36). The model consists of two steps: duplication and divergence (Fig. 1B). The duplication step assumes that each protein is duplicated along with all its interactions. Because the two daughter proteins are initially identical to each other, the resulting interaction sets are identical. Accordingly, if a protein was self-interacting, each of its duplicates will be self-interacting, and an interaction will exist between the duplicates. This duplication process can generate only 6 different motifs of the possible 19 (Fig. 2A). We term these initial patterns “zero-order motifs,” and represent their distribution by a vector, m0. The frequencies of these zero-order motifs are governed by Psi and Pi, defined as the probabilities of protein self-interaction and of interaction between two different proteins in the preduplication network, respectively (Fig. 2A).
Fig. 2.
Ohnolog motif frequencies provide a method for estimating ancestral connectivity and rewiring parameters. (A) Immediately after duplication, ohnolog motifs can be one of six zero-order motifs with probability vector m0 (row vector shown as its transpose). The probabilities of observing each ancestral configuration, and hence each zero-order motif, are listed as functions of the ancestral interaction (Pi) and self-interaction (Psi) probabilities. Thirteen of the 19 motifs cannot arise in this fashion, enforcing a strong constraint on the initial conditions of the system. (B) The six zero-order motifs can evolve into any one of the 19 possible motifs. The transition probabilities are given by a matrix T, whose entries Tij represent the probability of a member of the motif class in row i becoming a member of the motif class in column j. This matrix is represented iconographically, with each entry showing the interaction changes necessary to go from one motif to another. Edges are colored as in Fig. 1B and symmetry axes are shown by dotted lines. Horizontal and vertical symmetry axes indicate reflections that yield alternative icon-procedures for getting from class i to class j. A diagonal symmetry axis indicates that exchanging the positions of the vertices in either ohnolog pair yields an alternative icon-procedure for getting from class i to class j (SI Table 3). The value of each entry is given by Ti,j = 2SP+nGP−nL(1 − P−)nR(1 − P+)nA, where nG, nL, nR, and nA represent the number of edges that are gained (green), lost (red), retained (black), or remain absent (gray). The values of the icons in each row sums to 1. As an illustration, the probability of a motif in class  becoming a motif of class
  graphically is
  that equals 22 · P+2 · P−1 · (1-P+)3 · (1-P−)0 = 4 P+2 P− (1-P+)3.
The second step in the model encompasses the evolutionary dynamics after duplication (1). Mutations leading to the addition or deletion of an interaction are assumed to occur with probabilities P+ and P−, respectively. We define these probabilities as describing the overall period from the WGD event until today, accounting for the possibility of multiple rounds of addition and deletion.** We assume that rewiring events are independent, so that the probability of adding or removing multiple interactions is described by the product of the individual probabilities. This rewiring dynamic is described mathematically by a transition matrix (T, Fig. 2B) whose elements are the probabilities of evolution from the initial, six-element condition vector, m0, to an observed, 19-element vector, m0T. For example, the probability of a motif in class  becoming a motif of class
  is P−(1 − P+)5—the probability of losing the one interaction multiplied by the probability of not gaining an interaction at any of the five open positions. The final outcome of duplication and divergence should yield the motif distribution observed today, mmodern. We obtain a system of 19 equations, one for each motif class, with four variables: Pi, Psi, P+, and P−:
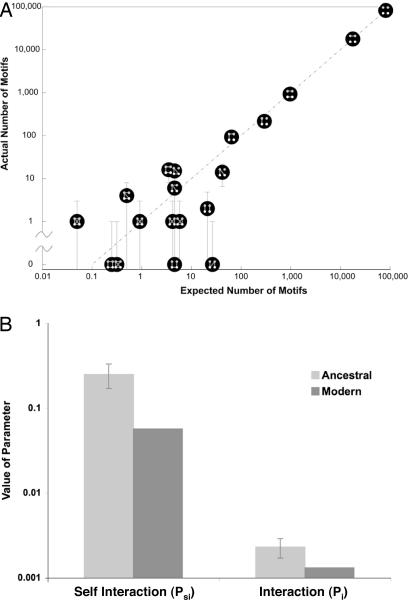
The transition matrix elements are functions of P+ and P−,and the initial condition zero-order motif vector m0 is a function of the preduplication parameters Pi and Psi. Because these four parameters are overdetermined by the 19 equations of Eq. 1, the existence of a solution is not mathematically guaranteed. We solved the equations for the best-fit values of Pi, Psi, P+, and P− (Methods and Table 2). Fig. 3A shows that the observed number of motifs is in good agreement with the predictions of the model given the best-fit parameters obtained. This indicates that our simplified model is able to capture much of the complexity of the preduplication network and its rewiring dynamics. Our model is less predictive for some of the motifs, in particular some low-frequency ones (see SI Text for further discussion on potential reasons for these outliers). As shown in Table 2, postduplication rewiring of the network involved a high probability of interaction loss, whereas the likelihood of gaining an interaction was small. This result is consistent with previous work (5, 38).
Table 2.
Best-fit values of preduplication network connectivity and postduplication dynamics inferred from the proteomic network motif distribution of Saccharomyces cerevisiae
| Parameter | Parameter value ± SD |
|---|---|
| Pi | 0.0023 ± 0.0003 |
| Psi | 0.25 ± 0.04 |
| P+ | 0.0007 ± 0.0001 |
| P− | 0.61 ± 0.03 |
Fig. 3.
The modern motif distribution closely resembles the expected distribution. (A) We solved our system of 19 equations in 4 unknowns to compute the best-fit network. The expected number of motifs given the best-fit parameters Pi, Psi, P+, and P− (x axis) is plotted against actual motif data from today's S. cerevisiae proteome (y axis). The error bars in the modern motif distribution are estimated as . Best-fit parameter values are listed in Table 2. (B) Observed values for Pi and Psi in the modern network are compared with the inferred Pi and Psi parameters for the ancestral preduplication network. Although the intergene connectivity (Pi) is very similar, the inferred self-interaction frequency (Psi) of that network differs by a factor of five from the equivalent modern value. Error estimation is described in SI Text. Similar analyses with the database of Batada et al. (47) yield consistent results (SI Fig. 4).
We also observe an enrichment of interactions between the ohnologs themselves. Based on the modern frequency of protein interactions (0.13%), we would expect <1 ohnolog pair to interact. We observe 44 interactions of this type (binomial P ≪ 10−10)—nearly 10% of our ohnologs (see, for example, refs. 18, 32, 33, and 37). This phenomenon translates itself in the context of our model to a high probability of self-interaction in the preduplication network (Psi = 0.25). This frequency of self-interaction is nearly fivefold higher than observed in the modern value (0.056,††Fig. 3B).
A simple explanation for this phenomenon is that the ancestral network contained more self-interacting proteins than exist in the modern network and that the ohnolog interactions are descendents of the frequent ancestral self-interactions. This would suggest a structural difference between the ancient and modern proteome. Because a network's structure can reflect its functional capabilities, such a difference might imply unique functional capabilities of the ancestral proteome or potentially proteomic subfunctionalization between the pre- and postduplication organisms (36–38). Alternatively, these ohnologous interactions might be de novo. Because overall P+ is small, this would suggest an evolutionary preference for adding or retaining ohnolog interactions (i.e., P+,ohnolog > P+,nonohnolog, or P−,ohnolog < P−,nonohnolog) (36).
Another intriguing explanation is that the high estimate for Psi results from selective retention of duplicates descended from ancestrally self-interacting proteins. Assuming that self-interactions were not more common in the ancestral network, our data may suggest that these pairs were under selective pressure to be maintained (46). Because they would be retained over long periods of time, they are more likely to have evolved a novel function (22, 38, 49). We suggest a simple dose-dependent model (described in SI Text) consistent with the idea that duplicated self-interacting proteins are selectively preserved (39). This could be an important contributor to the evolution of protein complexes (38, 45, 49).
Our model explains the current prevalence of the 19 ohnolog motifs and provides an estimate for pre- and postduplication parameters of the interaction network. The estimated frequency of self-interaction in the ancestral network is significantly higher than in today's network. This could indicate preferential retention of self-interacting protein duplicates, structural differences between the networks, or an inherent asymmetry between ohnologous and nonohnologous protein interaction dynamics. Our results are based on DIP and should be taken with caution because of possible bias and inherent noise associated with the high-throughput data that make up a significant portion of the DIP (23–29, 48). It will be interesting to see whether similar observations appear in other sources of interaction data for S. cerevisiae and other species (1, 21, 40, 41).
Methods
Databases.
We used the protein interactions listed in the DIP database (23, 26–29). Data can be downloaded at http://dip.doe-mbi.ucla.edu/. The whole-genome duplicates are listed in the supplemental material of Kellis et al. (8).
Minimization Algorithm.
We solve Eq. 1 for the parameters that best fit the data by minimizing the error associated with the fit. The right hand side, mmodern, is directly derived from the data (Table 1). The left hand side, m0(Pi,Psi)·T(P+,P−) yields a vector mexpected that depends on the four parameters Pi, Psi, P+, and P−. For a motif i, the goodness of fit is given by the square of the difference between the observed abundance mmodern,i and the expected abundance mexpected,i, scaled by the expected number of motifs:
 |
We then minimize E using the simplex search method (42) implemented by the fminsearch function in Matlab, obtaining best-fit values of Pi, Psi, P+, and P− (see Table 2). The algorithm to estimate the error in the parameters is described in SI Text. We tested the model on simulated networks (SI Text and SI Table 4) before running on the actual yeast proteome.
Supplementary Material
ACKNOWLEDGMENTS.
We acknowledge N. Barkai, M. Brenner, A. DeLuna, E. Lieberman, I. Nachman, I. Wapinski, and K. Wolfe for their advice and helpful discussions and E. Lieberman and R. Milo for critical readings of the manuscript. This work was supported in part by National Institutes of Health Grants GM068763 (to M.B.E.) and R01GM081617 (to R.K.). A.P. was supported by a National Science Foundation Graduate Fellowship and a National Defense Science and Engineering Graduate Fellowship.
Footnotes
The authors declare no conflict of interest.
This article is a PNAS Direct Submission. L.K. is a guest editor invited by the Editorial Board.
This article contains supporting information online at www.pnas.org/cgi/content/full/0707293105/DC1.
Explicitly, we allow one edge transition per site. This would not include cases where we have multiple transitions at a single site (e.g.,  is equivalent in our method to
  ). In practice, multiple transitions are improbable, but we define our transitions to include these higher-order transitions for completeness.
According to DIP, the dataset on which we base our analysis. In other datasets, this parameter ranges in value, with the largest being 0.138 [large literature-curated dataset (35)].
References
- 1.Aury JM, Jaillon O, Duret L, Noel B, Jubin C, Porcel BM, Segurens B, Daubin V, Anthouard V, Aiach N, et al. Nature. 2006;444:171–178. doi: 10.1038/nature05230. [DOI] [PubMed] [Google Scholar]
- 2.Barabasi AL, Albert R. Science. 1999;286:509–512. doi: 10.1126/science.286.5439.509. [DOI] [PubMed] [Google Scholar]
- 3.Dehal P, Boore JL. PLoS Biol. 2005;3:e314. doi: 10.1371/journal.pbio.0030314. [DOI] [PMC free article] [PubMed] [Google Scholar]
- 4.Ispolatov I, Krapivksy PL, Mazo I, Yuryev A. New J Phys. 2005;7:145. doi: 10.1088/1367-2630/7/1/000. [DOI] [PMC free article] [PubMed] [Google Scholar]
- 5.Pastor-Satorras R, Smith E, Sole RV. J Theor Biol. 2003;222:199–210. doi: 10.1016/s0022-5193(03)00028-6. [DOI] [PubMed] [Google Scholar]
- 6.Hughes AL. Proc R Soc London Ser B. 1994;256:119–123. [Google Scholar]
- 7.Wolfe K. Curr Biol. 2004;14:R392–R394. doi: 10.1016/j.cub.2004.05.015. [DOI] [PubMed] [Google Scholar]
- 8.Kellis M, Birren BW, Lander ES. Nature. 2004;428:617–624. doi: 10.1038/nature02424. [DOI] [PubMed] [Google Scholar]
- 9.Langkjaier RB, Cliften PF, Johnston M, Piskur J. Nature. 2003;421:848–852. doi: 10.1038/nature01419. [DOI] [PubMed] [Google Scholar]
- 10.Ohno S. Evolution by Gene Duplication. London: Allen and Unwin; 1970. [Google Scholar]
- 11.Wolfe KH, Shields DC. Nature. 1997;387:708–713. doi: 10.1038/42711. [DOI] [PubMed] [Google Scholar]
- 12.Conant GC, Wolfe KH. PLoS Biol. 2006;4:545–554. doi: 10.1371/journal.pbio.0040109. [DOI] [PMC free article] [PubMed] [Google Scholar]
- 13.Ihmels J, Collins SR, Schuldiner M, Krogan NJ, Weissman JS. Mol Syst Biol. 2007;3 doi: 10.1038/msb4100127. [DOI] [PMC free article] [PubMed] [Google Scholar]
- 14.Kafri R, Bar-Even A, Pilpel Y. Nat Genet. 2005;37:295–299. doi: 10.1038/ng1523. [DOI] [PubMed] [Google Scholar]
- 15.Lynch M, Force A. Genetics. 2000;154 doi: 10.1093/genetics/154.1.459. [DOI] [PMC free article] [PubMed] [Google Scholar]
- 16.Tirosh I, Barkai N. Genome Biol. 2007;8:R50. doi: 10.1186/gb-2007-8-4-r50. [DOI] [PMC free article] [PubMed] [Google Scholar]
- 17.Wagner A. Mol Biol Evol. 2002;19:1760–1768. doi: 10.1093/oxfordjournals.molbev.a003998. [DOI] [PubMed] [Google Scholar]
- 18.Papp B, Pal C, Hurst LD. Nature. 2003;424:194–197. doi: 10.1038/nature01771. [DOI] [PubMed] [Google Scholar]
- 19.Cliften PF, Fulton RS, Wilson RK, Johnston M. Genetics. 2006;172:863–872. doi: 10.1534/genetics.105.048900. [DOI] [PMC free article] [PubMed] [Google Scholar]
- 20.Mintseris J, Weng Z. Proc Natl Acad Sci USA. 2005;102:10930–10935. doi: 10.1073/pnas.0502667102. [DOI] [PMC free article] [PubMed] [Google Scholar]
- 21.Scannell DR, Byrne KP, Gordon JL, Wong S, Wolfe K. Nature. 2006;440:341–345. doi: 10.1038/nature04562. [DOI] [PubMed] [Google Scholar]
- 22.Wapinski I, Pfeffer A, Friedman N, Regev A. Nature. 2007;449:54–61. doi: 10.1038/nature06107. [DOI] [PubMed] [Google Scholar]
- 23.Ho Y, Gruhler A, Heilbut A, Bader GD, Moore L, Adams SL, Millar A, Taylor P, Bennett K, Boutilier K, et al. Nature. 2002;415:180–183. doi: 10.1038/415180a. [DOI] [PubMed] [Google Scholar]
- 24.Ito T, Chiba T, Ozawa R, Yoshida M, Hattori M, Sakaki Y. Proc Natl Acad Sci USA. 2001;98:4569–4574. doi: 10.1073/pnas.061034498. [DOI] [PMC free article] [PubMed] [Google Scholar]
- 25.Salwinski L, Miller CS, Smith AJ, Pettit FK, Bowie JU, Eisenberg D. Nucleic Acids Res Database Issue. 2004;32:D449–D451. doi: 10.1093/nar/gkh086. [DOI] [PMC free article] [PubMed] [Google Scholar]
- 26.Uetz P, Giot L, Cagney G, Mansfield TA, Judson RS, Knight JR, Lockshon D, Narayan V, Srinivasan M, Pochart P, et al. Nature. 2000;403:623–627. doi: 10.1038/35001009. [DOI] [PubMed] [Google Scholar]
- 27.Xenarios I, Rice DW, Salwinski L, Baron MK, Marcotte EM, Eisenberg D. Nucleic Acids Res. 2000;28:289–291. doi: 10.1093/nar/28.1.289. [DOI] [PMC free article] [PubMed] [Google Scholar]
- 28.Xenarios I, Fernandez E, Salwinski L, Duan XJ, Thompson MJ, Marcotte EM, Eisenberg D. Nucleic Acids Res. 2001;29:239–241. doi: 10.1093/nar/29.1.239. [DOI] [PMC free article] [PubMed] [Google Scholar]
- 29.Xenarios I, Salwinski L, Duan XJ, Higney P, Kim S, Eisenberg D. Nucleic Acids Res. 2002;30:303–305. doi: 10.1093/nar/30.1.303. [DOI] [PMC free article] [PubMed] [Google Scholar]
- 30.Milo R, Shen-Orr S, Itzkovitz S, Kashtan N, Chkovskii D, Alon U. Science. 2002;298:824–827. doi: 10.1126/science.298.5594.824. [DOI] [PubMed] [Google Scholar]
- 31.Shen-Orr S, Milo R, Mangan S, Alon U. Nat Genet. 2003;32:64–68. doi: 10.1038/ng881. [DOI] [PubMed] [Google Scholar]
- 32.DeLuna A, Avendaño A, Riego L, González A. J Biol Chem. 2001;276:43775–43783. doi: 10.1074/jbc.M107986200. [DOI] [PubMed] [Google Scholar]
- 33.Gibson TJ, Spring J. TiG. 1999;14:46–49. doi: 10.1016/s0168-9525(97)01367-x. [DOI] [PubMed] [Google Scholar]
- 34.Guldner U, Munsterkotter M, Oesterheld M, Pagel P, Ruepp A, Mewes HW, Stumpflen V. Nucleic Acids Res. 2006;34:D436–D441. doi: 10.1093/nar/gkj003. [DOI] [PMC free article] [PubMed] [Google Scholar]
- 35.Reguly T, Breitkreutz A, Boucher L, Breitkreutz B-J, Hon GC, Myers CL, Parsons A, Friesen H, Oughtred R, Tong A, et al. J Biol. 2006;5:11.11–11.28. doi: 10.1186/jbiol36. [DOI] [PMC free article] [PubMed] [Google Scholar]
- 36.Wagner A. Proc R Soc London Ser B. 2003;270:457–466. [Google Scholar]
- 37.Ispolatov I, Yuryev A, Mazo I, Maslov S. Nucleic Acids Res. 2005;33:3629–3635. doi: 10.1093/nar/gki678. [DOI] [PMC free article] [PubMed] [Google Scholar]
- 38.Pereira-Leal JB, Levy ED, Kamp C, Teichmann SA. Genome Biol. 2007;8:R51.51–R51.12. doi: 10.1186/gb-2007-8-4-r51. [DOI] [PMC free article] [PubMed] [Google Scholar]
- 39.Hughes T, Ekman D, Ardawatia H, Elofsson A, Liberles DA. Genome Biol. 2007;8:8:213.211–218:213.214. doi: 10.1186/gb-2007-8-5-213. [DOI] [PMC free article] [PubMed] [Google Scholar]
- 40.Britten RJ. Proc Natl Acad Sci USA. 2006;103:19027–19032. doi: 10.1073/pnas.0608796103. [DOI] [PMC free article] [PubMed] [Google Scholar]
- 41.Jaillon O, Aury J-M, Brunet F, Petit J-L, Stange-Thomann N, Mauceli E, Bouneau L, Fischer C, Ozouf-Costaz C, Bernot A, et al. Nature. 2004;431:946–957. doi: 10.1038/nature03025. [DOI] [PubMed] [Google Scholar]
- 42.Press WH, Teukolsky SA, Vetterling WT, Flannery BP. Numerical Recipes in C. Cambridge, UK: Cambridge Univ Press; 1992. [Google Scholar]
- 43.Prince VE, Pickett FB. Not Rev Genet. 2002;3:827–837. doi: 10.1038/nrg928. [DOI] [PubMed] [Google Scholar]
- 44.Wagner A. Mol Biol Evol. 2001:18:1283–1292. doi: 10.1093/oxfordjournals.molbev.a003913. [DOI] [PubMed] [Google Scholar]
- 45.Pereira-Leal JB, Teichmann SA. Genome Res. 2005;15:552–559. doi: 10.1101/gr.3102105. [DOI] [PMC free article] [PubMed] [Google Scholar]
- 46.Marianayagam NJ, Sunde M, Mathews JM. Trends Biochem Sci. 2004;29:618–625. doi: 10.1016/j.tibs.2004.09.006. [DOI] [PubMed] [Google Scholar]
- 47.Batada NN, Reguly T, Breitkreutz A, Boucher L, Breitkreutz B-J, Hurst LD, Tyers M. PLoS Biol. 2007;5:e154. doi: 10.1371/journal.pbio.0050154. [DOI] [PMC free article] [PubMed] [Google Scholar]
- 48.Yu H, Paccanaro A, Trifonov V, Gerstein M. Bioinformatics. 2006;22:823–829. doi: 10.1093/bioinformatics/btl014. [DOI] [PubMed] [Google Scholar]
- 49.Musso G, Zhang Z, Emili A. Retention of protein–protein interactions by ancient duplicated gene products in budding yeast. Trends Genet. 2007;23:266–269. doi: 10.1016/j.tig.2007.03.012. [DOI] [PubMed] [Google Scholar]
Associated Data
This section collects any data citations, data availability statements, or supplementary materials included in this article.


