

Abstract
We propose the possibility of using vibrational population transfer to enhance the structural markers for protein motifs that occur in two-dimensional infrared spectroscopy. We demonstrate the potential of this method by calculating the spectrum of the trpzip2 β-hairpin peptide, a system that is small enough to allow accurate simulation of its two-dimensional infrared spectra, including vibrational population transfer induced by a fluctuating solvent. The results show that under selected experimental conditions, in particular by using perpendicular polarization and finite waiting times, the cross peaks that constitute the well-known Z-shape marker for β-sheet structure in two-dimensional spectra are strongly enhanced. This enhancement is shown to result from vibrational population transfer. It should be possible to use the same technique for enhancing cross peaks in other structures and generally improve structure determination by two-dimensional infrared spectroscopy. The simulated population transfer times are in good agreement with those observed in experiments on typical proteins.
Introduction
Infrared spectroscopy is a powerful tool for probing protein conformation and dynamics (1–3). The amide I band has proven particularly useful. This band is formed by the amide I modes, which are dominated by the carbonyl stretching vibration that occurs in each peptide unit of the protein backbone. The amide I band is strong due to the large transition dipole of the carbonyl stretch vibration. This large dipole also results in strong coupling between neighboring oscillators, which in turn gives rise to delocalized excitonic states involving vibrations in many peptide units. The couplings depend on the local structure and the frequencies of the local amide I modes depend on side groups and hydrogen bonding. This leads to characteristic infrared signatures for different secondary structures (1–3) and, thus, in principle opens the way to distinguish those experimentally. In practice, for proteins in solution the use of traditional infrared absorption spectroscopy to distinguish secondary structures is limited. The reason is that these spectra typically are rather congested and look very similar for different proteins. Instead, two-dimensional infrared (2DIR) spectroscopy has considerably more potential to disentangle different spectral contributions. Moreover, due to its subpicosecond time resolution, this technique also allows for the study of structural and vibrational dynamics.
2DIR spectroscopy is a technique that has come available with the development of femtosecond infrared laser pulses (4). In this experiment, first a pair of pump pulses is applied to the sample. This is followed by a waiting time, during which the system is allowed to relax. The waiting time typically lasts from zero to several picoseconds and the duration can be controlled with a resolution of tens of femtoseconds. A probe pulse is then applied, resulting in the emission of a signal from the sample. The 2DIR spectrum is a two-dimensional correlation plot of transitions at the frequency ω1 that were excited by the initial pump pulses and those at frequency ω3 probed by the pulse applied after the waiting time, t2.
Like in two-dimensional nuclear magnetic resonance (2DNMR) spectroscopy, 2DIR spectroscopy spreads the spectrum in two dimensions and allows for the observation of cross peaks that contain information on the coupling between different vibrational modes. This enhances the power to distinguish protein conformations. The amide I band has proven particularly suitable in this respect, because it is very sensitive to hydrogen bonding (5) and backbone configuration (6–8). Indeed, it has already been shown that 2DIR spectroscopy in the amide I region can distinguish β-sheet (6), α-helix (7), and 310-helix (8) structures. For β-sheet structures, a Z-shaped pattern is observed in the two-dimensional spectrum (6). This shape arises from the two diagonal peaks and two cross peaks caused by two delocalized excitonic states, denoted a− and a+, located at ∼1640 and ∼1680 cm−1, respectively (6,9,10). Also in α-helices, two delocalized excitonic states, denoted A and E1 (7), are found. These are separated by only 10 cm−1 and can, usually, not be resolved.
Despite the recent progress described above, there still is a strong need to enhance the contrast of the various structural markers in two-dimensional spectroscopy, in particular to overcome the masking effects of disorder and heterogeneous dynamics. One option is to use the fact that certain choices of polarization directions of the laser pulses may enhance the cross peaks. For instance, for cross peaks between transitions that have dipoles that are (close to) perpendicular to each other, it is advantageous to use the ZZYY setup (referred to as perpendicular polarization), where the two pump pulses are polarized identically and perpendicularly to the probe and detection pulses (11). This choice is useful for β-sheet structures, because the angle between the a− and a+ transition dipoles is close to 90° (6,10). The anisotropy determined by intensity difference between cross peaks in the ZZZZ and the ZZYY setup can, thus, be used to estimate the angle between the transition dipoles of the involved modes and further strengthen the distinction between structural motifs.
In this article, we will demonstrate that in addition to the use of pulse polarizations, the waiting time, t2, may be exploited as a degree of freedom to enhance structural markers. So far, only 2DIR studies with t2 = 0 have been used for structural determination in larger peptides (6–8,12). This is the analog of the COSY variant of 2DNMR, while nonzero waiting times correspond to the NOESY variant of 2DNMR (13). The underlying reason why the infrared analog to NOESY can highlight structural markers, as we propose here, is the fact that, with increasing t2, population transfer between coupled modes causes the intensities of the cross-peaks to grow as compared to the diagonal peaks. This has been observed in the pioneering studies on the small molecules trialanine (14) and Rh(CO)2(C5H7O2) (15). Similar effects have been observed in the electronic equivalent of 2DIR in the Fenna-Matthews-Olson bacteriochlorophyll a protein (16). Independently of this work, it has been suggested, based on an experimental study of 3-cyanocoumarin (17,18), to determine structural parameters by utilizing the vibrational relaxation to enhance cross-peaks.
We will show the potential of the NOESY analog by simulating 2DIR spectra of a 12-residue β-hairpin for different waiting times. To do this, we apply a recently developed spectral simulation method that accounts for population transfer during the waiting time (19,20). This method has opened new possibilities of simulating 2DIR spectra of polypeptides in a solvent and interpreting experimental data with finite waiting times. It was demonstrated to work for alanine dipeptide (19), for which it was shown that the population transfer could be extracted accurately from congested spectra. Here we will make the step to population dynamics in large peptides. We will focus on the trpzip2 β-hairpin, which is a β-sheet model system. This hairpin was synthesized to allow investigation of the stability of hairpins (21). Its structure is shown in Fig. 1; it consists of 12 amino acids of which four are tryptophans, which makes it suitable for fluorescence experiments. Trpzip2 has been subject to fluorescence T-jump experiments (22), showing multiple timescales in the folding dynamics. The temperature stability has been studied with both Fourier transform infrared spectroscopy (FTIR) and 2DIR spectroscopy (23). The structure has also been subject to 2DIR isotope label studies (24,25), providing agreement with the NMR structure (21).
Figure 1.
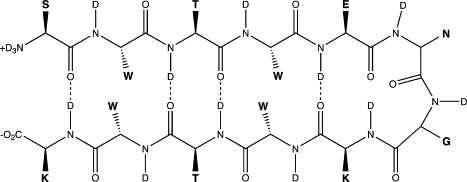
The chemical structure of Trpzip2, letters in bold indicate side-chain groups. (S, serine; W, tryptophan; T, threonine; E, glutamic acid; N, asparagine; G, glycine; and K, lysine.)
By simulating the 2DIR spectra of the trpzip2 β-hairpin in water for different waiting times, we will demonstrate that the infrared analog to NOESY can strongly enhance the spectral markers used to identify β-sheet structure. Molecular dynamics (MD) will be used to describe the motion of the peptide and the surrounding solvent. Density functional theory-based electrostatic models will be used to extract vibrational frequencies and couplings between amide I oscillators from the simulations, while the time-dependent Schrödinger equation (19,20) for the vibrations will be solved to calculate linear absorption spectra as well as 2DIR spectra, for different waiting times. At 1-ps waiting time, we find strong enhancement of the cross peaks in the perpendicularly polarized spectrum. This shows that the NOESY variant of 2DIR considerably improves this technique as a structural probe of protein structure in solution.
The remainder of this article is organized as follows. In Methods, we will outline the simulation methods applied. We will introduce a projection method, performed on a set of fixed reference states, that is useful in interpreting the spectra and population dynamics. The results for the FTIR and the 2DIR spectra, using different polarization choices and various waiting times, will be presented and discussed in Results and Discussion. Finally, we draw our conclusions in the last section.
Methods
MD simulations were performed with GROMACS-3.1.4 (26) using the implemented all-atom OPLS force field (27) for the hairpin and the SPC/E force field for water (28). The initial trpzip2 structure was taken from the Protein Database (PDB 1LE1 (21)). One chlorine counterion was added to keep the system neutral. It was solvated in heavy water and all acidic protons were replaced by deuterium. All bond lengths were kept fixed with the LINCS algorithm (29), allowing the use of 1-fs simulation time steps. The structure was equilibrated for 1 ns at 300 K (30). Ten different configurations were generated by MD simulation with 1 ns between each configuration. For each configuration, a 100-ps simulation was performed storing the structure every 20 fs, giving 10 trajectories with a total of 50,000 stored snapshots.
For every snapshot, the vibrational Hamiltonian was constructed. The site frequencies were found with a Stark-effect-based approach (31–33) using the electrical field and its gradient on the C, O, N, and D atoms (34). The frequencies were corrected for through-bond effects with neighboring units, using the Ramachandran-angle-based, nearest-neighbor frequency shift, density-functional theory map (35). The anharmonicity needed for describing doubly excited states was set to 16 cm−1 on all units (4). The couplings between different units were found using the transition charge coupling scheme (35,36). For the nearest-neighbor couplings, the NNC scheme was used (35).
In the spectral simulation, the side-chain carbonyl vibration in the asparagine unit was neglected. The frequency of this vibration is in the same range as that of the backbone carbonyls, but no reliable model for the solvent dependence of its frequency exists. The spectra of real peptides will contain contributions from side-chain vibrations in the amide I region. The original trpzip2 (21) was terminated with and CONH2 on the N- and C-terminals, respectively. In our simulations, as in previous theoretical studies (37,38), the Zwitterion termination was used. In recent FTIR and 2DIR experiments the N- and C-termini were, respectively, acetylated and methylated, because this species is easier to synthesize.
The linear absorption spectra were calculated using the NISE method (19,39), which is based on numerically solving the time-dependent Schrödinger equation for the vibrational Hamiltonian. This approach includes nonadiabatic effects (40) and population transfer within the amide I manifold. Population transfer out of this manifold was accounted for by the inclusion of an ad hoc exponential lifetime of 1 ps (41). The linear time-domain response functions were calculated for the 10 MD trajectories individually and they were then added-up. For each trajectory, ensemble averaging was performed by calculating the response functions at 500-fs intervals and adding them up. This results in a total of ∼2000 configurations included in the ensemble average. For each configuration, the linear time-domain response function was calculated up to 10 ps. The linear absorption spectrum was obtained by Fourier transform of the response function. The two-dimensional infrared spectra were calculated in an analogous way, also using the NISE method (19,39). This was done by explicitly calculating the involved four-time correlation functions (40). The time delays corresponding to the time between the pump pulses and the time between the probe pulse and the detection of the signal were both varied from 0 to 5 ps. The two-dimensional spectra in the frequency domain were obtained by a two-dimensional Fourier transform, where the first time delay gives the horizontal (ω1) frequency axis and the last time delay gives the vertical (ω3) frequency axis of the spectrum. The polarization dependence in the lab coordinate frame was obtained by averaging over the polarization components in the microscopic frame, using the proper weights given in Hochstrasser (11).
For interpretation of the results, it turns out useful to analyze the data by using a set of orthonormal fixed reference states, with specific symmetry properties, denoted φi. This is done by projecting instantaneous eigenstates ψj obtained from solving the Schrödinger equation on the reference states. Thus, the weight of a reference state i in a particular eigenstate j is given by the overlap
| (1) |
The static absorption spectrum that may be associated with the individual reference state i is
| (2) |
where is the transition dipole operator, Ψg the vibrational ground state, and ϵj(t) the eigenvalue of eigenstate j. The outer brackets 〈…〉 denote the ensemble average, i.e., an average over the individual snapshots generated in the MD simulation. Since this average ignores correlations between snapshots, it does not account for motional narrowing. The population transfer between reference states is obtained from the time evolution operator U(t′ + t, t) obtained by solving the time-dependent Schrödinger equation (19). Specifically, the probability of ending in reference state j at time t′ + t, provided that the system was in state i at time t, is given by
| (3) |
Results and discussion
The simulated and experimental (23) linear absorption spectra are shown together in Fig. 2. The simulated spectrum was shifted 18 cm−1 to the red for comparison. The spectrum exhibits a peak at 1640 cm−1 with a broad shoulder extending to 1680 cm−1. As we will see below, the peak is constituted of states with the a− type symmetry of β-sheets (6,9,10). The shoulder is dominated by a+ type symmetry states of β-sheets (6,10). Most likely, the slight difference between the simulated and experimental spectra is due to the neglect of the asparagine side-chain vibration and the difference in the terminal groups. The blue shift of the simulated spectrum may be due to the neglect of polarization effects in the MD force field, the neglect of dispersion forces in the model for the Hamiltonian, or a combination of those. It is worth noting that all recent simulations on water that draw on classical force fields give simulated spectra that are too narrow and blue-shifted compared to experiment (31,33,42,43) and the inclusion of polarization effects in that case can improve the predicted solvent shift and linewidth (33).
Figure 2.
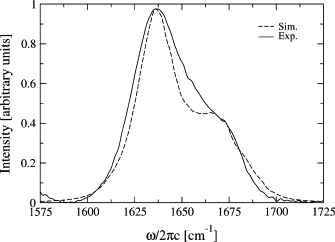
Experimental (23) and simulated linear absorption spectra in the amide I region of trpzip2.
The spectra can be analyzed in terms of reference states reflecting the symmetry of ideal β-sheet structures. Here we use the fact that if we omit the two terminal oscillators in Fig. 1, and the one in the turn, we are left with two unit cells of an antiparallel β-sheet. In Fig. 3, the wave functions for the reference states contributing to the spectrum are illustrated (10). First, there are two reference states with a− character, namely the (a−)s state, in which the unit cells are in phase, and the (a−)a state, where both unit cells have opposite phase. The absolute value of the amplitude on the eight participating oscillators is taken equal. Second, there is one a+ state, namely (a+)s (again with equal amplitude on the participating sites), and finally there are three states, where the vibration is located on one of the terminal sites or in the turn. The transition dipole of the (a−)s state is large and points in the direction of the hairpin plane, perpendicular to the two legs. The transition dipole for the (a+)s state is approximately three times smaller than that of the (a−)s state and it is parallel with the hairpin legs and thus perpendicular to the transition dipole of the (a−)s state. The transition dipole of the (a−)a state vanishes in an ideal flat hairpin. Due to the fluctuations of frequencies, couplings, and transition dipoles the instantaneous eigenstates found along the Hamiltonian trajectory deviate from the ideal reference state picture; however, this picture still provides a useful way to interpret the spectra. In Fig. 4, the contribution of the different reference states to the absorption spectrum are shown. It is clear that both the (a−)s and (a−)a states contribute to the low-frequency peak, while the (a+)s, the turn vibration, and one of the terminal vibrations contribute to the high-frequency end of the shoulder. The other terminal vibration has spectral contributions between these two domains.
Figure 3.

The transition dipole phase diagrams for the bright reference states dominating the spectra. The colors indicate the phase of the delocalized vibrational wave functions. Red is positive, blue is negative, and black is no contribution. Adding the red transition dipoles and subtracting the blue ones gives the total transition dipole between the ground state and the considered state.
Figure 4.
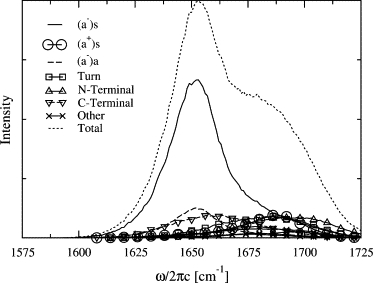
The static linear spectrum Ii(ω) (given in Eq. 2) analyzed in terms of the reference states in Fig. 3.
The simulated 2DIR spectra with parallel polarization for all pulses, as well as the detection, are given in Fig. 5 with waiting times of 0 ps and 1 ps. The a− and a+ dominated peaks are observed on the diagonal. Both peaks are stretched out slightly along the ω1-axis, indicating a weak cross-peak due to coupling between these modes. Below the diagonal peaks, excited-state absorption peaks are observed. Little difference is observed between the spectra with different waiting times.
Figure 5.

Simulated parallel polarization 2DIR spectra of trpzip2 with 0-ps and 1-ps waiting times. Dashed lines indicate negative contributions, originating from bleaching and stimulated emission, while solid lines indicate positive contributions, originating from excited state absorption. Contour lines are plotted at ±4%, ±8%, ±12%, ±16%, and ±20% of the most intense peak.
The simulated 2DIR spectra with perpendicular polarization are given in Fig. 6 for the same waiting times as were shown for the parallel polarization. The spectrum with zero waiting time looks very much like the parallel polarization spectra. However, at 1-ps waiting time, a significant cross-peak emerges above the diagonal at (ω1,ω3) = (1650 cm−1, 1685 cm−1), with a peak intensity that equals >20% of the maximum intensity of the diagonal peak at (ω1,ω3) = (1657 cm−1, 1657 cm−1). In the parallel spectra there is <8% intensity in this area and at zero waiting time the intensity is <12%. The emerging cross-peak is even stronger than the diagonal peak at (ω1,ω3) = (1685 cm−1, 1685 cm−1). A similar growth is observed of the cross-peak below the diagonal.
Figure 6.

Simulated perpendicular polarization spectra of trpzip2 with 0-ps and 1-ps waiting times. The contour lines are as in Fig. 5.
The relative intensity of the cross-peak signal at its maximum (ω1,ω3) = (1657 cm−1, 1690 cm−1) as compared to the maximum intensity of the diagonal peak signal at (ω1,ω3) = (1657 cm−1, 1657 cm−1) is shown in Fig. 7 as a function of the waiting time. For the parallel signals, this ratio is below 10%, except for waiting times above 2000 fs. The perpendicular ratio grows rapidly from 12.5% to ∼24% at 1000 fs and continues growing. An important factor in the growth of the relative cross-peak intensity is population transfer from the initially excited a− state to the a+ state, which leads to a decay of the diagonal a− peak and an increase of the cross-peak. In addition, the detailed time dependence of this ratio is influenced by spectral diffusion, which slightly changes the peak shapes during the waiting time.
Figure 7.

The relative intensity between the cross peak at (ω1,ω3) = (1657 cm−1, 1690 cm−1) and the diagonal peak at (ω1,ω3) = (1657 cm−1, 1657 cm−1) in the parallel and perpendicular spectra.
The population transfer from an initially excited (a−)s state to other vibrational states is shown in Fig. 8. This state exhibits a fast initial decay, losing ∼70% of its population within 500 fs. This is followed by a slower decay toward the equilibrium population of 9.1%. (In this approach, the population of all single excited states is equal in equilibrium. This is a good approximation, because kT is much higher than the separation between the levels.) The (a−)a state receives more than its equilibrium share of the population, which first grows to a maximum at ∼1000 fs and then slowly decays toward equilibrium at the same rate as the (a−)s state. The populations of the remaining β-sheet states show a fast initial growth and reach their equilibrium values after 500 fs. The turn and terminal states gain population much more slowly. The turn state has grown approximately half-way to the equilibrium after 2000 fs, while the terminal states only have approximately one-third of the equilibrium population at this time.
Figure 8.
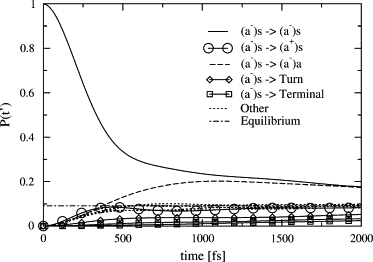
The population of the different reference states after an initial excitation of the (a−)s state.
The above leads to the following interpretation of the changes in the perpendicular two-dimensional spectrum with increasing waiting time. The cross peak above the diagonal increases in intensity, because, during the waiting time, population is transferred from the (a−)s state excited by the pump pulses is transferred to the (a+)s state. This moves stimulated emission intensity from the diagonal to the cross peak. Because population transfer results in a change of transition dipole direction, detection in the perpendicular polarization experiment is favored. To some extent, the transfer to one of the terminal states and the turn state also contribute to the peak growth. In particular, the terminal contribution is observed in the small peak at (ω1,ω3) = (1650 cm−1, 1705 cm−1). The growth of the cross peaks is further enhanced by the concurrent decay of the (a−)s stimulated emission part of the diagonal peak due to the population transfer both into the observed as well as the dark (not observed) states. The ground-state bleach contributions to the spectra are not affected by the internal population transfer. This puts an upper limit on the possible enhancement of the cross peak. In the following, we consider the perpendicular spectrum. If half the population would be transferred from (a−)s to (a+)s, the cross-peak intensity would be increased by 50%, while the diagonal intensity would be reduced by 25%. This holds if we neglect the overall decay out of the band, which is assumed to affect all states equally. The relative cross-peak intensity would then be enhanced by a factor of two. However, a considerable amount of population is transferred to other states than (a+)s, resulting in an expected enhancement a bit larger than a factor of two, which is roughly the enhancement observed at long delays in Fig. 7. One should keep in mind that interference effects and spectral diffusion affect the relative peak intensities as well. These effects are included in our full simulations, which are necessary to give accurate predictions of peak intensities.
In addition to the above qualitative picture of the relaxation pathways, the simulations also yield interesting quantitative information. In particular, we note that the typical population transfer times of 500 fs between the vibrational states found in our simulations, are in very good agreement with those observed from anisotropy experiments on real proteins. For Apamin and Scyllatoxin, anisotropy decays of 500 fs and 300 fs were observed, respectively (4). In the experiment, the population is also transferred out of the amide I band. This population transfer takes place on a 450-fs timescale (4) and results in an overall decay of the spectrum. This means that, to observe the growth of the predicted cross peak, the waiting time should not be too long. Waiting times between 500 fs and 1 ps are probably the most ideal.
The vibrational population transfer times that we calculated for trpzip2 are considerably faster than those observed in trialanine (∼10 ps) (14). This should be expected because the two amide I vibrations are spectrally well separated. We found similar slow transfer times with the NISE method for alanine dipeptide (19). In trpzip2, slow population transfer was also found by this study, but exclusively for transfer from and to the termini and the turn unit. This is expected, because the coupling is small between these units and the sites in the core of the β-sheet, compared to the couplings between the β-sheet sites.
The population transfer from the amide I manifold to side-chain modes or to the amide II manifold can possibly affect the 2DIR spectrum of the amide I region in a more complicated way than the ad hoc manner used here. The population transfer might be faster for certain amide I modes than for others. Furthermore, the population may get stuck in intermediate states, resulting in a faster decay of the overtone excited-state absorption peaks, since the decay of the ground-state bleach signal depends on the rate of ground-state recovery. Including different transfer rates for different vibrational states requires that we include other vibrational modes, and their interactions with the amide I oscillators, explicitly in our simulations. An example is the population transfer between amide I and amide II modes (44,45), which is investigated theoretically in Dijkstra et al. (46) for n-methyl acetamide. The transfer from amide I to amide II takes place at a subpicosecond timescale and can thus be expected to affect the amide I spectrum in the time span considered here. Whether this effect is very different from the overall decay used here remains to be seen and is subject to ongoing investigations. The delayed ground-state recovery can be modeled using a different decay time for the ground-state bleach signal than for the excited-state absorption and stimulated emission contributions.
Conclusions
In this article, we simulated the 2DIR spectra of the β-hairpin trpzip2. The structural and solvent dynamics were accounted for by using molecular dynamics simulations. The vibrational Hamiltonian was constructed and the vibrational dynamics of the observed amide I band was described by solving the time-dependent Schrödinger equation. The spectra were analyzed using reference states reflecting the symmetry of ideal β-sheet structures.
We demonstrated that detecting 2DIR spectra with waiting times of 1 ps in the perpendicular polarization configuration strongly enhances the cross peaks associated with states of a− and a+ symmetry. These cross peaks (in particular the one above the diagonal) at finite waiting times seem to provide a clearer signature for β-sheet structure than the Z-shape that exists for zero waiting time. The cross-peak enhancement is due to vibrational population transfer between states with a− and a+ symmetry character. Similar enhancement can be expected to be found in other secondary structural elements of peptides and proteins, such as α-helices, where vibrational population transfer between A and E1 states is expected. The observation here is based on the simulation for one β-hairpin that is small enough to be treated with accurate spectral simulations. The observation should be confirmed by experiments on this hairpin as well as larger peptides and proteins. Preliminary experiments performed on the trpzip2 hairpin by the Tokmakoff group show population transfer effects similar to our predictions (A. Tokmakoff, 2007, private communication). Moreover, the simulated population transfer rate found by us is in very good agreement with the vibrational anisotropy decay measured for several proteins (4). This anisotropy decay can also be due to rotational dynamics in the proteins, but it is unlikely that such fast dynamics occurs for large proteins; the only other source of the anisotropy decay is vibrational population transfer.
The observed contrast enhancement of the cross peaks can be expected to improve the interpretation of spectra after the denaturation of peptides, by increasing the sensitivity to structural order. This suggests that, to maximize the structural discrimination between native folded and unfolded states, 2DIR spectra used in T-jump experiments on peptides, such as trpzip2, should be performed in the perpendicular polarization configuration with a finite waiting time of 500–1000 fs.
Acknowledgments
We thank Andrei Tokmakoff, Ziad Ganim, and Adam Smith for providing the experimental FTIR data and helpful discussions.
T.l.C.J. acknowledges the Netherlands Organization for Scientific Research for support through a VENI grant.
Footnotes
Editor: Brian R. Dyer.
References
- 1.Barth A., Zscherp C. What vibrations tell us about proteins. Q. Rev. Biophys. 2002;35:369–430. doi: 10.1017/s0033583502003815. [DOI] [PubMed] [Google Scholar]
- 2.Krimm S., Bandekar J. Vibrational spectroscopy and conformation of peptides and proteins. Adv. Protein Chem. 1986;38:181–364. doi: 10.1016/s0065-3233(08)60528-8. [DOI] [PubMed] [Google Scholar]
- 3.Torii H., Tasumi M. Model calculations on the amide-I infrared bands of globular proteins. J. Chem. Phys. 1992;96:3379–3387. [Google Scholar]
- 4.Hamm P., Lim M.H., Hochstrasser R.M. Structure of the amide I band of peptides measured by femtosecond nonlinear-infrared spectroscopy. J. Phys. Chem. B. 1998;102:6123–6138. [Google Scholar]
- 5.DeCamp M.F., DeFlores L., McCracken J.M., Tokmakoff A., Kwac K., Cho M. Amide I vibrational dynamics of n-methylacetamide in polar solvents: the role of electrostatic interactions. J. Phys. Chem. B. 2005;109:11016–11026. doi: 10.1021/jp050257p. [DOI] [PubMed] [Google Scholar]
- 6.Demirdöven N., Cheatum C.M., Chung H.S., Khalil M., Knoester J., Tokmakoff A. Two-dimensional infrared spectroscopy of antiparallel β-sheet secondary structure. J. Am. Chem. Soc. 2004;126:7981–7990. doi: 10.1021/ja049811j. [DOI] [PubMed] [Google Scholar]
- 7.Woutersen S., Hamm P. Time-resolved two-dimensional vibrational spectroscopy of a short α-helix in water. J. Chem. Phys. 2001;115:7737–7743. [Google Scholar]
- 8.Maekawa H., Toniolo C., Moretto A., Broxterman Q.B., Ge N.-H. Different spectral signatures of octapeptide 310- and α-helices revealed by two-dimensional infrared spectroscopy. J. Phys. Chem. B. 2006;110:5835–5837. doi: 10.1021/jp057472q. [DOI] [PubMed] [Google Scholar]
- 9.Cheatum C.M., Tokmakoff A., Knoester J. Signatures of β-sheet secondary structures in linear and two-dimensional infrared spectroscopy. J. Chem. Phys. 2004;120:8201–8215. doi: 10.1063/1.1689637. [DOI] [PubMed] [Google Scholar]
- 10.Dijkstra A.G., Knoester J. Collective oscillations and the linear and two-dimensional infrared spectra of inhomogeneous β-sheets. J. Phys. Chem. B. 2005;109:9787–9798. doi: 10.1021/jp044141p. [DOI] [PubMed] [Google Scholar]
- 11.Hochstrasser R.M. Two-dimensional IR-spectroscopy: polarization anisotropy effects. Chem. Phys. 2001;266:273–284. [Google Scholar]
- 12.Golonzka O., Khalil M., Demirdöven N., Tokmakoff A. Coupling and orientation between anharmonic vibrations characterized with two-dimensional infrared vibrational echo spectroscopy. J. Chem. Phys. 2001;115:10814–10828. [Google Scholar]
- 13.Mukamel S. Multidimensional femtosecond correlation spectroscopies of electronic and vibrational excitations. Annu. Rev. Phys. Chem. 2000;51:691–729. doi: 10.1146/annurev.physchem.51.1.691. [DOI] [PubMed] [Google Scholar]
- 14.Woutersen S., Mu Y., Stock G., Hamm P. Subpicosecond conformational dynamics of small peptides probed by two-dimensional vibrational spectroscopy. Proc. Natl. Acad. Sci. USA. 2001;98:11254–11258. doi: 10.1073/pnas.201169498. [DOI] [PMC free article] [PubMed] [Google Scholar]
- 15.Khalil M., Demirdoven N., Tokmakoff A. Vibrational coherence transfer characterized with Fourier-transform 2D IR spectroscopy. J. Chem. Phys. 2004;121:362–373. doi: 10.1063/1.1756870. [DOI] [PubMed] [Google Scholar]
- 16.Brixner T., Stenger J., Vaswani H.M., Cho M., Blankenship R.E., Fleming G.R. Two-dimensional spectroscopy of electronic couplings in photosynthesis. Nature. 2005;434:625–628. doi: 10.1038/nature03429. [DOI] [PubMed] [Google Scholar]
- 17.Kurochkin D.V., Naraharisetty S.R.G., Rubtsov I.V. Relaxation-assisted 2D IR using weak vibrational modes. In: Corkum D., Jonas M., Miller R.J.D., editors. Springer Series in Chemical Physics. Vol. 88. Springer; New York: 2006. [Google Scholar]
- 18.Kurochkin D.V., Naraharisetty S.R.G., Rubtsov I.V. A relaxation-assisted 2D IR spectroscopy method. Proc. Natl. Acad. Sci. USA. 2007 doi: 10.1073/pnas.0700560104. www.pnas.org/cgi/reprint/0700560104v1 [DOI] [PMC free article] [PubMed] [Google Scholar]
- 19.Jansen T.I.C., Knoester J. Nonadiabatic effects in the two-dimensional infrared spectra of peptides: alanine dipeptide. J. Phys. Chem. B. 2006;110:22910–22916. doi: 10.1021/jp064795t. [DOI] [PubMed] [Google Scholar]
- 20.Torii H. Effects of intermolecular vibrational coupling and liquid dynamics on the polarized Raman and two-dimensional infrared spectral profiles of liquid n,n-dimethylformamide analyzed with a time-domain computational method. J. Phys. Chem. A. 2006;110:4822–4832. doi: 10.1021/jp060014c. [DOI] [PubMed] [Google Scholar]
- 21.Cochran A.G., Skelton N.J., Starovasnik M.A. Tryptophan zippers: stable, monomeric β-hairpins. Proc. Natl. Acad. Sci. USA. 2001;98:5578–5583. doi: 10.1073/pnas.091100898. [DOI] [PMC free article] [PubMed] [Google Scholar]
- 22.Yang W.Y., Gruebele M. Detection-dependent kinetics as a probe of folding landscape microstructure. J. Am. Chem. Soc. 2004;126:7758–7759. doi: 10.1021/ja0493751. [DOI] [PubMed] [Google Scholar]
- 23.Smith A.W., Chung H.S., Ganim Z., Tokmakoff A. Residual native structure in a thermally denaturated β-hairpin. J. Phys. Chem. B. 2005;109:17025–17027. doi: 10.1021/jp053949m. [DOI] [PubMed] [Google Scholar]
- 24.Smith A.W., Tokmakoff A. Amide I 2D IR spectroscopy of β-hairpin peptides. J. Chem. Phys. 2007;126:045109. doi: 10.1063/1.2428300. [DOI] [PubMed] [Google Scholar]
- 25.Wang J., Chen J., Hochstrasser R.M. Local structure of β-hairpin isotopomers by FTIR, 2D IR, and ab initio theory. J. Phys. Chem. B. 2006;110:7545–7555. doi: 10.1021/jp057564f. [DOI] [PMC free article] [PubMed] [Google Scholar]
- 26.Berendsen H.J.C., van der Spoel D., van Drunen R. GROMACS: a message-passing parallel molecular dynamics implementation. Comput. Phys. Commun. 1995;91:43–56. [Google Scholar]
- 27.Jorgensen W.L., Tirado-Rives J. The OPLS potential functions for proteins. Energy minimizations for crystals of cyclic peptides and crambin. J. Am. Chem. Soc. 1988;110:1657–1666. doi: 10.1021/ja00214a001. [DOI] [PubMed] [Google Scholar]
- 28.Berendsen H.J.C., Grigera J.R., Straatsma T.P. The missing term in effective pair potentials. J. Phys. Chem. 1987;91:6269–6271. [Google Scholar]
- 29.Hess B., Bekker H., Berendsen H.J.C., Fraaije M.J.G.E. LINCS: a linear constraint solver for molecular simulations. J. Comput. Chem. 1997;18:1463–1472. [Google Scholar]
- 30.Berendsen H.J.C., Postma J.P.M., Gunsteren W.F.v., DiNola A., Haak J.R. Molecular dynamics with coupling to external bath. J. Chem. Phys. 1984;81:3684–3690. [Google Scholar]
- 31.Fecko C.J., Eaves J.D., Loparo J.J., Tokmakoff A., Geissler P.L. Ultrafast hydrogen-bond dynamics in the infrared spectroscopy of water. Science. 2003;301:1698–1702. doi: 10.1126/science.1087251. [DOI] [PubMed] [Google Scholar]
- 32.Choi J.H., Ham S.Y., Cho M. Local amide I mode frequencies and coupling constants in polypeptides. J. Phys. Chem. B. 2003;107:9132–9138. [Google Scholar]
- 33.Hayashi T., Jansen T.l.C., Zhuang W., Mukamel S. Collective solvent coordinates for the Infrared Spectrum of HOD in D2O based on an ab initio electrostatic map. J. Phys. Chem. A. 2005;109:64–82. doi: 10.1021/jp046685x. [DOI] [PubMed] [Google Scholar]
- 34.Jansen T.l.C., Knoester J. A transferable electrostatic map for solvation effects on amide I vibrations and its application to linear and two-dimensional spectroscopy. J. Chem. Phys. 2006;124:044502. doi: 10.1063/1.2148409. [DOI] [PubMed] [Google Scholar]
- 35.Jansen T.l.C., Dijkstra A.G., Watson T.M., Hirst J.D., Knoester J. Modeling the amide I bands of small peptides. J. Chem. Phys. 2006;125:044312. doi: 10.1063/1.2218516. [DOI] [PubMed] [Google Scholar]
- 36.Hamm P., Woutersen S. Coupling of the amide I modes of the glycine dipeptide. Bull. Chem. Soc. Jpn. 2002;75:985–988. [Google Scholar]
- 37.Ganim Z., Tokmakoff A. Spectral signatures of heterogeneous protein ensembles revealed by MD simulations of 2DIR spectra. Biophys. J. 2006;91:2636–2646. doi: 10.1529/biophysj.106.088070. [DOI] [PMC free article] [PubMed] [Google Scholar]
- 38.Pitera J.W., Haque I., Swope W.C. Absence of reptation in the high-temperature folding of the trpzip2 β-hairpin peptide. J. Chem. Phys. 2006;124:141102. doi: 10.1063/1.2190226. [DOI] [PubMed] [Google Scholar]
- 39.Jansen T.l.C., Knoester J. Simulation of two-dimensional infrared spectra by numerical integration of the Schrödinger equation. In: Simos T., Maroulis G., editors. International Conference of Computational Methods in Sciences and Engineering, Recent Progress in Computational Sciences and Engineering Vol. 7. Brill Academic Publishers, Leiden; The Netherlands, China, Crete, Greece: 2006. [Google Scholar]
- 40.Jansen T.l.C., Zhuang W., Mukamel S. Stochastic Liouville equation simulation of multidimensional vibrational line shapes of trialanine. J. Chem. Phys. 2004;121:10577–10598. doi: 10.1063/1.1807824. [DOI] [PubMed] [Google Scholar]
- 41.Kwac K., Lee H., Cho M. Non-Gaussian statistics of amide I mode frequency fluctuations of n-methylacetamide in methanol solution: linear and nonlinear vibrational spectra. J. Chem. Phys. 2004;120:1477–1490. doi: 10.1063/1.1633549. [DOI] [PubMed] [Google Scholar]
- 42.Corcelli S.A., Lawrence C.P., Skinner J.L. Combined electronic structure/molecular dynamics approach for ultrafast infrared spectroscopy of dilute HOD in liquid H2O and D2O. J. Chem. Phys. 2004;120:8107–8117. doi: 10.1063/1.1683072. [DOI] [PubMed] [Google Scholar]
- 43.Lawrence C.P., Skinner J.L. Vibrational spectroscopy of HOD in liquid D2O. II. Infrared line shapes and vibrational Stokes shift. J. Chem. Phys. 2002;117:8847–8854. [Google Scholar]
- 44.DeFlores L., Ganim Z., Ackley S.F., Chung H.S., Tokmakoff A. The anharmonic vibrational and relaxation pathways of the amide I and amide II modes of n-methylacetamide. J. Phys. Chem. B. 2006;110:18973–18980. doi: 10.1021/jp0603334. [DOI] [PubMed] [Google Scholar]
- 45.Rubtsov I.V., Wang J., Hochstrasser R.M. Dual-frequency 2D-IR spectroscopy heterodyned photon echo of the peptide bond. Proc. Natl. Acad. Sci. USA. 2003;100:5601–5606. doi: 10.1073/pnas.0931292100. [DOI] [PMC free article] [PubMed] [Google Scholar]
- 46.Dijkstra A.G., Bloem R., Jansen T.l.C., Knoester J. Vibrational relaxation in simulated two-dimensional infrared spectra of two amide modes in solution. J. Chem. Phys. 2007;127:194505. doi: 10.1063/1.2786455. [DOI] [PubMed] [Google Scholar]