

Abstract
In response to elevated temperatures, cells from many organisms rapidly transcribe a number of mRNAs. In Saccharomyces cerevisiae, this protective response involves two regulatory systems: the heat shock transcription factor (Hsf1) and the Msn2 and Msn4 (Msn2/4) transcription factors. Both systems modulate the induction of specific heat shock genes. However, the contribution of Hsf1, independent of Msn2/4, is only beginning to emerge. To address this question, we constructed an msn2/4 double mutant and used microarrays to elucidate the genome-wide expression program of Hsf1. The data showed that 7.6% of the genome was heat-induced. The up-regulated genes belong to a wide range of functional categories, with a significant increase in the chaperone and metabolism genes. We then focused on the contribution of the activation domains of Hsf1 to the expression profile and extended our analysis to include msn2/4Δ strains deleted for the N-terminal or C-terminal activation domain of Hsf1. Cluster analysis of the heat-induced genes revealed activation domain-specific patterns of expression, with each cluster also showing distinct preferences for functional categories. Computational analysis of the promoters of the induced genes affected by the loss of an activation domain showed a distinct preference for positioning and topology of the Hsf1 binding site. This study provides insight into the important role that both activation domains play for the Hsf1 regulatory system to rapidly and effectively transcribe its regulon in response to heat shock.
The ability to respond to a large number of environmental stresses is crucial for the survival of all organisms (1). Heat shock is among a highly diverse group of environmental conditions that alter gene expression in prokaryotic and eukaryotic cells. The response to heat shock is characterized by a rapid induction of a conserved group of heat shock proteins (HSPs).2 In Saccharomyces cerevisiae, two regulatory systems are involved in this response: the heat shock transcription factor (Hsf1) (2, 3) and the Msn2 and Msn4 (Msn2/4) transcription factors (4, 5).
Yeast Hsf1 is an essential protein that binds to inverted repeats of nGAAn called heat shock elements (HSEs) within the promoters of many HSPs and activates their transcription. Hsf1 is composed of several well defined domains that are important for its function. They include the highly conserved central core, which is made up of the winged-helix-turn-helix DNA-binding domain (6, 7) and the hydrophobic coiled-coil region essential for the regulation of homotrimer formation (8–10). In addition, yeast Hsf1 has two trans-activation domains, one at the N terminus and the other at the C terminus (11, 12).
Although the structure and function of HSF is generally conserved from various organisms, there is variability in the number and importance of HSF genes in any particular organism. The yeasts, S. cerevisiae and Schizosaccharomyces pombe, have one HSF gene that is essential for cell survival (2, 13, 14), whereas Drosophila melanogaster has a single HSF gene that is essential for oogenesis, early larval development, and survival in response to acute stress but is unnecessary for cell growth and viability (15). In contrast, chickens and mammals have 3 HSF genes that vary in their cellular and physiological roles (16), whereas Arabidopsis thaliana has 21 HSF genes that are tightly regulated into a network of interacting proteins (17).
The existence of multiple HSF species in higher eukaryotes suggests that HSF isoforms may have specific functions that are triggered by distinct stimuli or activate specific target genes. So how does S. cerevisiae, with one Hsf1 isoform, regulate such a complex response to environmental stress? Yeast Hsf1 differs from metazoan HSFs in several important ways (16). First, S. cerevisiae utilizes the single essential Hsf1 to activate the expression of a wide variety of genes under normal physiological conditions and in response to environmental stress. Metazoan cells have three heat shock factors that only function under specific developmental or environmental conditions. Second, in the absence of heat shock, S. cerevisiae Hsf1 exists in the nucleus as a trimer bound to HSEs. In contrast, mammalian HSF1 exists in the cytoplasm as an inactive monomer. In response to heat shock, mammalian HSF undergoes nuclear localization, trimerizes, and binds to HSEs. Third, S. cerevisiae Hsf1 has two trans-activation domains, whereas the metazoan HSF has only one located at the C terminus.
The activation domains of the S. cerevisiae Hsf1 appear to mediate different temporal aspects of the heat shock response, which can be divided into two phases: the transient response and the sustained response (11, 12, 18). The transient response is characterized as how cells tolerate an increase in temperature over 35 °C for <1 h, whereas the sustained response is characterized as how cells acclimate to the higher temperatures for long periods of time. The N-terminal activation domain (NAD), found in the first 65 amino acids, is thought to mediate the transient response, whereas the C-terminal activation domain (CAD), found between residues 595 and 783, is thought to be responsible for the sustained response to stress. Although there have been no detailed studies of the genes effected by the NAD, the effect of the CAD has been studied for specific genes. The CAD is critical for the heat-induced expression of CUP1, HSP82, and HSP26, whereas the loss of the CAD has no effect on the heat-induced expression of SSA1, SSA3, and HSP104 (19–21).
The second regulatory system of the heat shock response, Msn2 and Msn4, has not been conserved between yeasts and humans. These proteins are non-essential transcription factors that bind to stress response elements (STREs) found in the promoters of most HSPs (22). Msn2 and Msn4 are 41% identical in amino acid sequence and 100% conserved at three residues that are pertinent for DNA sequence recognition (23). Under constitutive conditions, Msn2/4 proteins are localized to the cytoplasm; however, during heat shock, they are transported to the nucleus where they activate transcription of HSPs (24).
The contributions of Msn2/4 and Hsf1 proteins to the yeast heat shock response have been addressed previously (25–28). These studies, although not exhaustive, establish that each regulatory system contributes differently to the expression of genes. For some genes, such as HSP26 and HSP104, their expression is regulated by cooperation between both Msn2/4 and Hsf1 (19, 29), whereas other genes appear to be regulated by only one system. The Msn2/4 regulatory system controls the expression of genes classified as chaperones, carbon metabolism, and oxidative stress (25, 28), whereas the Hsf1 regulatory system controls the expression of genes classified as chaperones, cell wall maintenance, and energy regeneration (26, 27, 30).
In this study, we used DNA microarrays to quantify the contribution that the Hsf1 regulatory system makes to the transient heat shock response in the absence of the Msn2/4 transcription factors. In particular, we focused on the roles of the activation domains of Hsf1 by analyzing the expression patterns of strains with NAD or CAD deletions. We applied clustering algorithms to our data to illuminate physiological and mechanical relationships among genes. Promoter analysis showed architectural distinctions between the different clustered genes. These data show that Hsf1, its activation domains, and HSEs all play distinctive roles in the reorganizing and orchestrating of cellular events during the heat shock response.
EXPERIMENTAL PROCEDURES
Yeast Strains and Growth Conditions
All strains were constructed in our laboratory and derived from the S. cerevisiae strain W303-1A (MATa ade2–1 trp-1 can-1 leu2,3–112 his-11,15 ura3–1). We used the KanMX cassette in combination with cre-loxP recombination technology to create the msn2::loxP msn4::loxP null alleles (31). Creation of the activation domain deletion strains has been previously described (32). Briefly, URA3-marked integration plasmids that contained Hsf1 genes deleted for either the N- or C-terminal activation domains were constructed. These plasmids were used to replace the wild-type HSF1 allele with either the hsf1(66–833) or hsf1(1–583) alleles in both MSN2/4 and msn2/4Δ strains. Strains with the wild-type HSF1 were designated HSF, strains with hsf1(66–833) allele were designated HSFΔNAD, and strains with the hsf1(1–583) allele were designated HSFΔCAD. Cells were grown in yeast extract-peptone-dextrose medium supplemented with adenine (YPAD) at 30 °C to mid-log phase (A600 of 0.5).
RNA Preparation and Northern Blot Analysis
The culture was split into two, with one half remaining at standard growing conditions, while the other half was heat shocked at 37 °C for 15 min. Cells were harvested by centrifugation at 258 × g at 4 °C for 5 min, flash frozen in liquid nitrogen, and stored at −80 °C. Total RNA was isolated using the hot acidic phenol method (33). Pellets were resuspended in RNase-free dH2O, quantified, and store at −80 °C until needed. RNA samples (7 μg/lane) were incubated in a 1:1 ratio of loading buffer (54% formamide, 19% formaldehyde, 40 mM MOPS, pH 7, 10 mM sodium acetate, 4.2% glycerol, 0.03% xylene cyanol, 0.03% bromphenol blue, 1 mM EDTA, pH 8) at 65 °C for 10 min. The RNA samples were resolved on formaldehyde-agarose gels and then transferred onto ZetaProbe Nylon membrane (Bio-Rad). The membrane was cross-linked in the UV Stratalinker 2400 (Stratagene) and washed in 0.1× SSC at room temperature. The membrane was pre-hybridized in RapidHyb buffer (Amersham Biosciences) at 55 °C for a minimum of 2 h. Probes were generated by incorporating Biotin-16-dUP nucleotide (Roche Applied Science) into PCR products of the HSP12, HSP26, HSP82, HSP104, SSA3, SSA4, and SSE2 open reading frames (ORFs). Hybridization was carried out with denatured probes in the same buffer at 55 °C overnight. The following day, the filters were washed three times in 300 mM NaCl; 30 mM sodium citrate, 0.1% SDS at 55 °C for 20 min. The protocol from the North2South Chemi-luminescent Detection Kit (Pierce) was used for probe detection and substrate development. Signals were then quantified on a Fluorchem 8800 cooled charge-coupled device detection system (Alpha Innotech Corp.).
Microarray Hybridization
The Affymetrix yeast genome YG_S98 microarrays used in this study contain ~6400 known or predicted open reading frames as described in the Saccharomyces Genome Database (SGD) and additional probe sets representing putative ORFs identified by SAGE analysis, mitochondrial proteins, and TY proteins (Affymetrix).
All protocols were conducted as described in the Affymetrix GeneChip Expression Analysis Technical Manual. Briefly, 10 μg of total RNA was incubated with Superscript II reverse transcriptase primed by a poly(T) oligomer that incorporated the T7 promoter to convert the RNA into first-strand cDNA. Second-strand cDNA synthesis was followed by in vitro transcription for linear amplification of each transcript and incorporation of biotinylated CTP and UTP. The cRNA products were fragmented to an average of 200 nucleotides, heated at 99 °C for 5 min, and hybridized for 16 h at 45 °C to the Affymetrix microarrays at the University of Pennsylvania Microarray Core Facility. The microarrays were then washed at low (0.9 M NaCl, 60 mM Na H2PO4, pH 7.5, 6 mM EDTA, 0.005% Triton X-100) and high (100 mM MES, 0.1 M NaCl) stringency and stained with streptavidin-phycoerythrin. Fluorescence was amplified by adding biotinylated anti-streptavidin and an additional aliquot of streptavidin-phycoerythrin stain. A confocal scanner was used to collect fluorescence signal at 3-μm resolution after excitation at 570 nm. The average signal from two sequential scans was calculated for each microarray feature. Gene expression values were calculated using Affymetrix Microarray Suite, version 5.0, and exported as “chp” files. The data were imported and analyzed using GeneSpring GX version 7.2 (Agilent Technologies). The chp files were pre-normalized (centered on a trimmed mean of 150). In GeneSpring, the values were further normalized “per chip” by dividing each intensity value by the median intensity of the entire chip, and then “per gene” by dividing the signal levels of a given gene across all 18 samples by the median signal across the same samples for that gene.
Data Acquisition and Analysis
First, an experiment was set upto group the three independent replicates of each condition and strain together. This generated an average signal log ratio value, which reflects the abundance of each Affymetrix probe set. At the end of this summarization process, there were six normalized values for each replicate group, one for each strain and condition tested. Then, a pair-wise comparative analysis was performed between the experimental heat shock and the baseline constitutive microarrays for each of the three strains. The probe sets were designated present or induced if they were enriched by a minimum of 2-fold(normalized fold change (NFC) = 2.0). The loci that pass the filter were saved as a gene list.
In parallel with the above analysis, normalized signal values for all probe sets were statistically analyzed to identify probe sets that changed in each of the strains in response to heat shock. We applied Significance Analysis of Microarrays, version 2.2 (SAM) (34) to the experimental heat shock and the baseline constitutive microarrays for each of three strains in two-sample unpaired mode, with no fold-change cutoff. The stringency for calling loci significant was set at a moderate threshold (Δ) of 0.6. This analysis generated a differentially expressed probe set list for each of the three comparisons. The false discovery rates for the lists were 3.6% for strain HSF, 4.2% for strain HSFΔNAD, and 3.9% for strain HSFΔCAD.
We then imported the gene lists of statistically significant probe sets identified by SAM into GeneSpring and compared it to the gene list with >2-fold change generated by the Gene-Spring software. The overlapping probe sets that met both qualifications, Δ = 0.6 and normalized fold change (NFC) = 2.0, were used for further analysis. Quality threshold (QT) clustering was performed to uncover patterns of gene expression and the relationships between these patterns (35). The algorithm builds a cluster by starting with a single locus and a cluster diameter of zero. One by one, other loci are added to the cluster and a new cluster diameter is calculated. If a locus cannot be placed into an existing cluster without sacrificing the quality or the diameter threshold, it is placed into a new cluster. As a starting point, we analyzed the loci induced in the HSF strain with the QT clustering algorithm of GeneSpring. When all of the loci had been placed, 18 clusters had been generated. We then manually varied the diameter from 0.3 to 0.7 to reduce the number of clusters and to be able to add more loci to each cluster while maintaining a well matched pattern within the cluster. The end result was a five-cluster pattern.
To identify Hsf1 binding sites in the promoter sequences, we analyzed 1000 bp upstream of the start codon of the loci that represented verifiable ORFs. Sequences were retrieved from the SGD (36, 37) and analyzed using a simple pattern-identification program. We defined three types of HSEs, each having three nGAAn repeats in Perfect (PFT), GAP (GAP), and STEP (STP) arrangements. The perfect HSE (PFT) consists of three contiguous, inverted repeats of the nGAAn sequence, either nGAAnnTTCnnGAAn or nTTCnnGAAnnTTCn. The GAP HSE consists of an nGAAn repeat, followed by any 5 bp and 2 inverted nGAAn repeats (nGAAn-(5-bp)-nGAAnnTTCn) and its complement (nGAAnnTTCn-(5-bp)-nTTCn), as well as the related sequences nTTCn-(5-bp)-nTTCnnGAAn and nTTC-nnGAAn-(5-bp)-nGAAn. The STP HSE has a 5-bp insert between each of the 3 nGAAn repeats, yielding the sequences nGAAn-(5-bp)-nGAAn-(5-bp)-nGAAn and nTTCn-(5-bp)-nTTCn-(5-bp)-nTTCn (30). As per previous studies (27, 30), we also allowed a single mismatch (nGAR) in one of the three nGAAn repeats for PFT or GAP.
RESULTS
Both Activation Domains of Hsf1 Contribute to the Transient Heat Shock Response
Yeast Hsf1 has two activation domains that play distinct temporal roles during the heat shock response (12, 18). To compare their relative contributions in the initial response to heat stress, we constructed six isogenic strains, three in an MSN2/4 background and three in an msn2/4Δ back-ground. In both backgrounds, we tested various truncations of Hsf1: HSF, wild-type Hsf1; HSFΔNAD, which eliminated the first 65 residues of Hsf1; and HSFΔCAD, which eliminated the last 250 residues of Hsf1 (Fig. 1). The six strains were subjected to a 15-min heat shock at a moderate (37 °C) temperature. Northern blot analysis was used to measure the constitutive and heat-induced levels of several HSF-controlled mRNAs. In all six strains, the constitutive levels of HSP104, HSP82, and HSP26 mRNAs were low, whereas the heat-induced levels of the same mRNAs increased to varying degrees (Fig. 2). When we compared the heat induction of HSP104 and HSP26 in the MSN2/4 strain versus the msn2/4Δ strain, there was only a slight increase, whereas HSP82 was significantly reduced in the same background comparison. When we analyzed the contribution of the NAD or the CAD in MSN2/4 strains, the results were similar to those obtained in the HSF strain. The effects of the deleted activation domains were masked and/or compensated for by the Msn2/4 regulatory system.
FIGURE 1. Schematic diagram of yeast Hsf1 proteins used in this study.
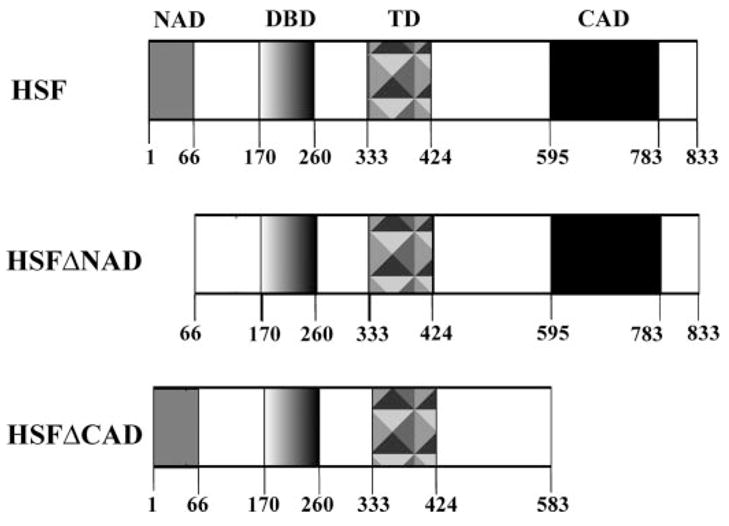
Relevant functional domains are highlighted; they are the N-terminal activation domain (NAD), the DNA-binding domain (DBD), the trimerization domain (TRM), and the C-terminal activation domain (CAD). The HSFΔNAD construct was made by deleting the first 65 residues of the protein, highlighted by the gray box. The HSFΔCAD construct was made by deleting the last 250 residues, highlighted by the black box.
FIGURE 2. Removal of a single activation domain of Hsf1 reveals promoter-specific defects in heat shock induction of HSPs in the absence of msn2/4. A.
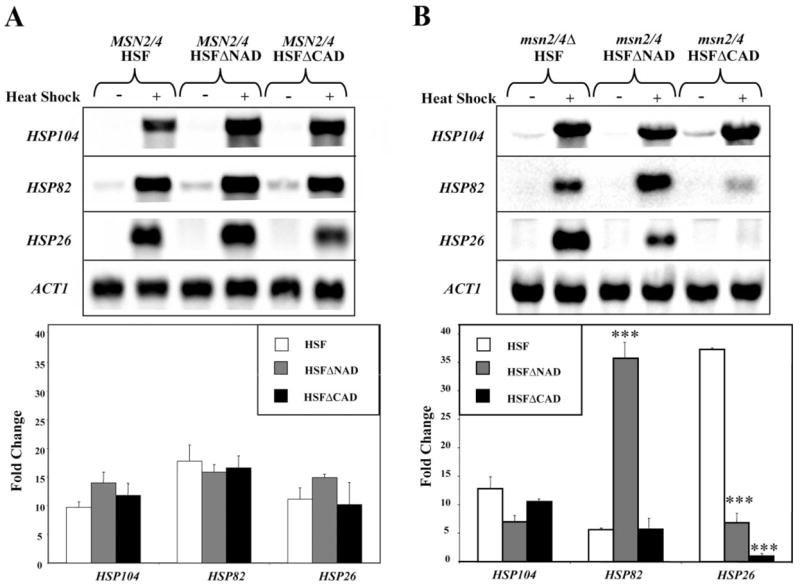
and B, total RNA was isolated from six different strains that were either maintained at constitutive conditions (30 °C) or heat shocked at 37 °C for 15 min. A representative Northern blot is shown for the transcripts HSP104, HSP12, HSP26, and ACT1 (loading control). The bar graph below illustrates heat induction, which was calculated as the -fold change of the normalized transcript between heat shock conditions versus constitutive conditions. The asterisks indicate significant differences between wild-type and the condition tested using Student’s t test: **, p < 0.01; ***, p < 0.001.
On the other hand, in the msn2/4Δ strains, each of the HSPs tested was affected differently by the loss of one of the Hsf1 activation domains (Fig. 2B). In the HSF strain, the heat-induced mRNA levels increased moderately for HSP104 (12-fold) and HSP82 (4-fold) and dramatically for HSP26 (37-fold). In the HSFΔNAD strain, the heat-induced mRNA levels increased moderately for HSP104 (7-fold) and HSP26 (7-fold) and dramatically for HSP82 (34-fold). In the HSFΔCAD strain, the heat-induced mRNA levels increased moderately for HSP104 (5-fold) and HSP82 (6-fold) but had no effect on the levels of HSP26 (0.9-fold). From these experiments we were able to confirm that both regulatory systems cooperate in the expression of many genes. More importantly, we could use the msn2/4 null strains to look specifically at the contribution of the Hsf1 regulatory system.
Global Transcript Profiling of mRNAs Shows a Unique Response to Mutations in Hsf1 during Heat Shock
To understand the broader utilization of Hsf1 and its activation domains during the transient heat shock response, we used microarrays to examine genome-wide changes in transcription levels. For each msn2/4Δ strain, we isolated RNA from constitutive and heat-induced conditions in triplicate, resulting in 18 RNA samples. These samples served as templates to generate biotinylated antisense probes for hybridization to Affymetrix yeast genome YG_S98 microarrays. After spot quantitation and normalization, the signal log ratio for each locus on the microarray was determined.
We compared the constitutive and heat shock conditions in each strain and identified loci that responded with significant changes in their transcript level. We then imported the list into the SGD to identify the loci that represented known or putative genes. In the HSF strain, 442 genes were heat-induced. The induction of these genes is significantly higher than would be expected if induction was not correlated with heat shock expression (p = 2.1 × 10⁻²¹). Of the 442 genes, 63% were increased by 2- to 3-fold, 28% increased by 3- to 6-fold, and 9% increased by more than 6-fold. The highest expression profile was for the HSP70 homolog SSA4, which increased its levels by 137-fold. In the HSFΔNAD strain, 329 genes were heat-induced (p = 4.3 × 10⁻¹⁶). Of the 329 genes, 63% were increased by 2-to 3-fold, 31% increased by 3- to 6-fold, and 6% increased by more than 6-fold. The highest expression profile was for HSP12, which increased its levels by 95-fold. In the HSFΔCAD strain, 326 genes were heat-induced (p = 6.1 × 10⁻¹⁸). Of the 326 genes, 66% were increased by 2- to 3-fold, 26% increased by 3- to 6-fold, and 8% increased by more than 6-fold. The highest expression profile was not a chaperone, but YFR026C, whose function has not yet been identified. The levels of YRF026C increased by 36.9-fold.
To confirm the reliability of these data, we performed Northern blot hybridizations using selected HSPs that exhibited different levels of dependence of the NAD and CAD in the microarray experiments. In general, the transcript profiles detected by the Northern blot analysis correlated qualitatively with the average values obtained from the microarray experiments (Fig. 3). In addition, the expression changes by the microarray analysis averaged 5- to 8-fold higher than in the Northern blot analysis. This observation, which has been seen by other laboratories (38), may be due to the high sensitivity of the microarray technology. Both experiments show the critical role for the NAD, because the heat-induced levels of HSP42 and SSE2 were dramatically reduced and SSA4 was slightly reduced by the deletion of the NAD, whereas HSP12 was slightly increased. Both experiments also show that the CAD was critical for the heat-induced levels of HSP12 and SSE2 but not critical for SSA4.
FIGURE 3. Confirmation and comparison of gene expression by microarray and Northern analyses.

A, the two-dimensional graph shows expression profiles of selected heat shock genes: HSP12, HSP42, SSA4, SSE2, and ACT1 (negative control). Each vertical line on the graph represents an array, and each horizontal line represents a single gene. There are 18 arrays in total, with the strain and condition for each array indicated. The bar graph below illustrates heat induction, which was calculated as the -fold change of the normalized transcript between heat shock conditions versus constitutive conditions. The graph was made using GeneSpring GX version 7.2 software. B, Northern blot analysis of HSP12, HSP42, SSA4, SSE2, and ACT1 (loading control). The bar graph below illustrates heat induction, which was calculated as the -fold change of the normalized transcript between heat shock conditions versus constitutive conditions. The asterisks indicate significant differences between wild-type and the condition tested using Student’s t test: *, p < 0.05; **, p < 0.01.
As a further test of the validity of our data, we compared our gene list for HSF to previously published data. Other laboratories have compared the heat shock response program between wild-type cells and cells lacking either functional HSF1 or MSN2/4 genes (25–28, 30). In general, genes previously identified as Hsf1-dependent were heat-induced, whereas genes previously identified as Msn2/4-dependent were not heat-induced in our msn2/4Δ strain (25–28, 30). One critical exception was HSP12 (39). To resolve the conflicting data, we used Northern blot analysis to compare the levels of HSP12 in a MSN2/4 wild-type strain (29.5-fold) to an msn2/4Δ strain (20.2-fold) and found that the heat-induced level decreased only 32% (data not shown). These data suggest that, although the transcription level of HSP12 was reduced significantly in the absence of Msn2/4, HSP12 is still heat-induced in an Hsf1-dependent manner (Fig. 3B). HSP12 may be cooperatively controlled by both stress regulatory systems, in a manner similar to HSP26 and HSP104 (19, 29).
To highlight the relationship between the genes in the different strains, we charted the data as a Venn diagram (Fig. 4A). When we compared the HSFΔNAD and the HSF strains, we found that 55% of the genes overlap and seem to be unaffected by the loss of the NAD. The remaining 45% of the genes are not heat-induced in the wild-type Hsf1 strain but gain heat inducibility in the absence of the NAD. When we compared the HSFΔCAD and the HSF strains, we found that only 43% of the genes overlap and seem to be unaffected by the loss of the CAD. The remaining 57% of the genes are not heat-induced in the wild-type Hsf1 strain, but gain heat inducibility in the absence of the CAD.
FIGURE 4. Expression profiles of loci that are heat-induced due to truncations in Hsf1.

A, the gray circle represents the 442 loci that are heat-induced by in the HSF strain. The circle in the upper left hand corner represents the 329 loci that are heat-induced in the HSFΔNAD strain, and the circle in the upper right hand corner represents the 326 loci that are heat-induced in the HSFΔCAD strain. The three circles intersect in the Venn diagram to form seven distinct regions that have been labeled A–G. The number of genes in each region is indicated. B, each column represents the average of the three independent experiments for each condition and strain. The data are represented graphically by coloring each gene, represented as a rectangle, on the basis of the measured fluorescence ratio. Genes with log ratios of zero are black (genes unchanged), positive log ratios with reds of increasing intensity, and negative log ratios with greens of increasing intensity. The figure was clustered in GeneSpring GX version 7.2 by their expression ratios in the six different conditions, similar to the Venn diagram. Regions that correspond to the Venn diagram are indicated. The complete list of heat-induced genes is available as supplemental data. C, Northern blot analysis of ADH2, IDP2, LSM2, PEP3, SFC1, YKR015C, and ACT1 (loading control) is shown. The region within the Venn diagram in which the gene can be found is also indicated.
The majority of the genes that gained heat inducibility in the absence of an activation domain maintained their constitutive levels and increased their heat-induced levels (Fig. 4B). To confirm these data, several genes were tested by Northern blot analysis (Fig. 4C). In all three strains, the constitutive levels of ADH2, IDP2, LSM2, PEP3, and YKR015C were low, whereas the heat-induced levels increased to varying degrees in only the HSFΔNAD and HSFΔCAD strains. In the HSFΔNAD strain, the heat-induced mRNA levels increased moderately for ADH2 (3-fold), SFC1 (4-fold), and IDP2 (3-fold) and dramatically for LSM2 (14-fold). There was very little effect on the heat-induced levels of YKR015C (1.5-fold). In the HSFΔCAD strain, the heat-induced mRNA levels increased moderately for PEP3 (5-fold) and markedly for IDP2 (11-fold) and LSM2 (7-fold). There was no effect on the levels of ADH2 (0.9-fold) and SFC1 (0.8-fold). These results suggest that removal of an activation domain is not globally affecting constitutive activity. Instead, it causes an increase in heat inducibility in select genes. This could be due to the removal of negative-regulating elements that regulate a subset of genes. Alternatively, it could be due to the absence of a repressor normally activated by full-length Hsf1, although the only known heat-induced repressor, XBP1, is induced in all three strains.
For a few genes (4%), the constitutive expression level is increased in the strains with a deleted activation domain. One such case is SFC1, where the constitutive level increased dramatically in the HSFΔCAD strain (Fig. 4C). The heat shock level increased as well, thus negating its heat induction (0.7-fold). We also examined the constitutive levels of all ~5800 putative genes on the microarray and found increases in 41 genes (0.007%) in the HSFΔNAD strain and in 37 genes (0.006%) in the HSFΔCAD strain. Many of these genes from the HSFΔNAD strain are involved in intracellular trafficking (29.3%), whereas many of the genes from the HSFΔCAD strain are involved in metabolism (35.1%). Some of these genes can be seen in Fig. 4B by scanning the constitutive conditions in the HSFΔNAD and HSFΔCAD strains and identifying red outliers. Previous studies have shown that deletion or mutation of Hsf1 can remove intramolecular negative regulation and increase constitutive levels to nearly the same as the induced levels (11, 12, 40–43). Our results confirm that the activation domains are involved in regulating Hsf1 activity for a specific subset of genes.
Identification and Classification of Induced mRNAs in Response to Wild-type HSF during the Heat Shock
As a next step in interpreting the data, each gene that was heat-induced in the HSF strain was annotated by a SGD search and organized into a classification system based on its documented or putative molecular function (36, 37). The functional assignments should be considered dynamic, because many genes have more than one function and could be assigned to alternative groups. We then compared our list to the catalogues of the entire genome as described by the Munich Information Center for Protein Sequence (MIPS) Comparative Yeast Genome Database (44). The number of genes in each category was expressed as a percentage of the total number of genes and plotted on a bar graph (Fig. 5). Only 65% of the 442 genes induced in the wild-type HSF strain have known functions. One of the functional categories that we expected to be highly represented is the chaperone category. It was the most overrepresented of the ten categories described. Seventeen induced genes were categorized as chaperones, including the classic heat shock proteins (HSP12, HSP26, HSP42, HSP78, HSP82, HSP104, SSA3, SSA4, and SSE2). Statistical analysis confirmed that induction of 17 of the 45 chaperones in the genome occurred more frequently than expected by chance (p <7.9 × 10⁻⁷).
FIGURE 5. Distribution of heat-induced genes into a wide variety of functional categories.
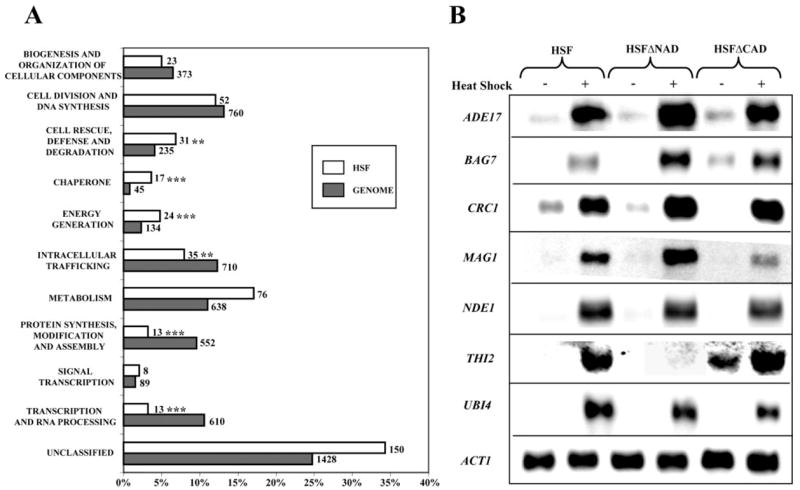
Over 5700 characterized or verifiable ORFs were assigned a functional classification as described by the SGD (36) and the Munich Information Center for Protein Sequence (MIPS) catalogue (44). Gray bars represent the percentage of genes per functional categories for the whole genome, and white bars represent the percentage of genes per functional categories for the HSF strain gene list. The total number of genes in each category is indicated. The asterisks indicate significant differences between wild-type and the condition tested using Fisher’s Exact test and adjusted with Bonferroni correction: **, p < 0.01; ***, p < 0.001. B, Northern blot analysis of ADE17 (metabolism), BAG7 (signal transduction), CRC1 (intracellular trafficking), MAG1 (cell division and DNA processing), NDE1 (energy generation), THI2 (metabolism), UBI4 (cell rescue, defense, and degradation), and ACT1 (loading control) are shown.
The functional analysis also emphasized the vast number of genes that were affected by heat shock and the major reprogramming that the cell undergoes to protect itself from environmental stress. Fig. 5B shows a select few of the 20 genes that were verified using Northern blot analysis. Genes involved in metabolism and energy generation were overrepresented in the HSF gene list compared with the total genome (p < 0.000017 and p < 0.00028, respectively) (Fig. 5). The high percentage of genes involved in energy generation was not surprising, because the increase in their functional activity could provide the energy needed for the functions of ATP-dependent molecular chaperones. Although other genome-wide studies have shown the importance of energy generation during various environmental stresses (26, 45), our studies emphasize the important role of Hsf1 in regulating their expression during heat shock.
On the other hand, genes involved in transcription or protein synthesis were underrepresented in the HSF gene list (p < 6.2 × 10⁻¹⁰ and p < 2.1 × 10⁻⁸, respectively), emphasizing that the cell is in a protective mode. Interestingly, one of the genes involved in transcription and induced in this study was XBP1, a transcription repressor that binds to the promoters of all three G1 cyclins and causes a transient cell cycle delay under various stress conditions (46, 47). Another induced gene was HAC1, a transcription factor that functions to activate the unfolded protein response in response to stress in the endoplasmic reticulum (48, 49). Although Hac1 requires alternative splicing by the serine/threonine kinase, Ire1, to gain activator properties, many of the newly identified genes up-regulated by the unfolded protein response are also induced in this study (48). In particular, genes involved in protein folding (JEM1, SCJ1, ERO1, EUG1, and MPD1) and protein degradation (DER1, HRD1, and HRD3) were found in both gene lists. The presence of these two proteins, XBP1 and HAC1, suggests that Hsf1 plays an indirect role in ceasing translation of new proteins and helping the cell to tolerate unfolded proteins during the heat shock response.
We compared the percentage of genes in the functional categories in the HSF strain to HSFΔNAD and HSFΔCAD strains and found there were small changes in the number of genes in specific functional categories. One of the most interesting groups was the transcription and RNA processing category. There were 13 genes (2.9%) in the HSF strain, 14 genes (4.3%) in the HSFΔNAD strain, and 20 genes (5.9%) in the HSFΔCAD strain. Although there were comparable percentages of genes in the three strains, different genes were heat-induced in each strain. The genes ACA1, HAC1, and PUT3 were heat-induced only in the HSF strain, whereas the genes MIG3 and ZAP1 are heat-induced only in the HSFΔCAD strain. The differences in transcription factor expression may account for some of the differences in the three gene lists (Fig. 4A). Hsf1 may act in tandem with these transcription factors to indirectly influence expression in an activation domain-specific manner.
Clustering of Loci Induced by Wild-type Hsf1 Identifies Loci That Are Dependent upon an Activation Domain for Heat Inducibility
As shown in Fig. 4A, deletion of an activation domain caused a complex change in gene expression patterns. To understand the role of the activation domains within the context of full-length Hsf1, we used the loci induced in the wild-type HSF strain as starting material for cluster analysis (Fig. 4B, gray circle). The QT clustering algorithm used in this study grouped together loci with similar patterns of expression over the six conditions (three strains and two temperatures). The end product of the clustering was a five-cluster pattern. The five clusters were named by visually examining the expression profiles revealed by the clustering approach. The first cluster is called INDEPENDENT, because the expression patterns are unaffected by the loss of either of the activation domains (Fig. 6A, green graph). The second cluster is called BOTH, because both activation domains are required for heat induction (Fig. 6B, yellow graph). The third cluster is called NAD, because these loci require the NAD for heat inducibility (Fig. 6C, blue graph). The fourth cluster is called CAD, because these loci require the CAD for heat inducibility (Fig. 6D, pink graph). The fifth cluster consists of loci that were unable to be grouped without compromising cluster diameter and quality of the other clusters (data not shown).
FIGURE 6. Profiles of clustered genes that show similar patterns of expression.

Two-dimensional graphs of four of the five clusters devised by the QT clustering algorithm of the GeneSpring GX software are shown. Two-dimensional graphs are as described in Fig. 3A. Conditions and strains are indicated. Clusters are named: A, INDEPENDENT; B, BOTH; C, NAD; and D, CAD.
Next we analyzed each of the clusters to determine if loci with similar patterns of expression by QT clustering also had distinct preferences for functional categories (Fig. 7). Only genes with known functions were analyzed. The number of genes in each functional category was expressed as a percentage of the total number of genes in the cluster. The data revealed that the cluster BOTH was dominated by genes that are involved in cell division and DNA processing (47.6%), and the cluster INDEPENDENT was dominated by genes that are involved in metabolism (32.5%) and energy generation (13.2%) (Fig. 7B). The cluster CAD was dominated by genes that are classified as chaperones (12.2%), metabolism (14.9%), and cell rescue, defense, and degradation (20.3%) (Fig. 7C). The cluster NAD was dominated by genes that are involved in metabolism (28.1%) and intracellular trafficking (15.6%) (Fig. 7D).
FIGURE 7. Distribution of clustered genes within functional categories revealed that genes with similar patterns of expression are also found in the same functional categories.

Pie charts representing the distribution of functional categories in each cluster. The percentage of genes in each functional category was calculated as the number of genes in each functional category divided by the total number of genes in the cluster. Clusters are: A, INDEPENDENT; B, BOTH; C, NAD; and D, CAD.
On the other hand, the cluster BOTH is devoid of loci classified as chaperones, protein synthesis, and cell rescue, defense, and degradation (Fig. 7A). The cluster CAD contained very few loci that are involved in energy generation (2.7%) (Fig. 7D), whereas the cluster NAD contained very few loci that are involved in transcription and RNA processing (3.1%) or biogenesis and organization of cellular components (3.1%) (Fig. 7C). All of these data strongly indicate that not only do genes with similar patterns of dependence on a particular activation domain have distinct preferences for functional categories, but each activation domain of Hsf1 contributes to the transient response to heat shock.
Promoter Analysis of Loci Identifies Heat Shock Element Architecture That Is Cluster-specific
The role of highly conserved HSEs in HSF binding to specific loci has been well established in yeasts and metazoans (30, 50–52). HSEs are composed of inverted, alternating repeats of the 5-bp sequence nGAAn, where n is any nucleotide (53–56). The number of pentameric units in an HSE varies, but three to six units are thought to be required for heat regulation in vivo (30, 57). Deviations from the consensus in both sequence and/or the distance between the modules can be tolerated, but to what extent is unknown. To determine if there is a correlation between the different HSEs and the affinity of Hsf1 for the motif and, thereby, the level of transcription activation, we searched in the promoters of the genes for three types of HSEs. Each type contains three nGAAn core motifs, but the variants are distinguishable from each other by the location of the core motifs within the HSE (“Experimental Procedures”).
Of the heat-induced genes, only 20.4% of them contained HSEs in their promoters, which is statistically significant in comparison to the entire genome, where only 16.7% of the promoters contained HSEs (p < 0.03). There are two possibilities why all of the promoters of heat-induced genes do not contain HSEs. First, the heat induction measured by microarray analysis may be due to changes in the activity of other transcription factors that are activated by heat shock. For example, 23 genes that do not contain HSEs do have binding sites for Hac1, a transcription factor that activates the unfolded protein response. Second, there may be other types of HSEs that are yet to be identified or considered. This possibility has been strengthened by the chromatin immunoprecipitation (ChIP) experiment that showed Hsf1 could bind to promoters lacking a known HSE (27). Furthermore, recent studies on the MDJ1 promoter identified a novel non-consensus HSE that consists of three separated nGAAn motifs, nTTCn-(11-bp)-nGAAn-(5-bp)-nGAAn (58). When we analyzed promoters of the genes induced by HSF for this non-consensus HSE, we found 2.9% of the genes contained this novel HSE. More detailed analyses will be required to identify all non-consensus HSEs.
When we limit our focus to those genes that were heat-induced by more than 10-fold, over 50% of them contained HSEs in their promoters. The analysis highlighted a significant correlation between the presence of an HSE of a heat-induced gene and its Hsf1-mediated transcriptional activity (p < 0.004). This finding is consistent with the notion that Hsf1 is bound to canonical HSEs, constitutively, ready for the signal to transcribe genes that are important in helping the cell cope with changes in its environment.
We then determined the distribution of HSEs along the promoter within the four clusters and found that HSE binding sites are not uniformly distributed over the promoter region (Table 1). In comparison to the randomized distribution of HSEs seen in the promoters of all the genes in the genome, clusters NAD and CAD had a higher concentration of HSEs distributed close to the ORF (p < 0.02). On the other hand, HSEs in the promoters of genes in cluster INDEPENDENT were evenly distributed, whereas cluster BOTH were slightly further away from the ORF. There is no correlation between clusters and the distribution of HSE types along the promoters. However, we found a correlation between the Hsf1-mediated transcriptional activity and its underlying preference for HSE orientation. Of the 90 heat-induced genes that contain HSEs in their promoters, there is an equal number of HSEs that start with nGAAn and nTTCn, but genes with a -fold change >5-fold have HSEs with the sequences nTTCnnGAAn or nTTCnnNNNnnTTC than any combination starting with nGAAn (66.7%). These findings suggest that the type of Hsf1 binding site is not as important as the topology of the HSE. Previous studies have revealed that all three DNA-binding domains of the trimeric Hsf1 bind to one face of the DNA (59), and our studies confirm that the orientation of the HSE with respect to the transcriptional start site can affect its transcriptional activity.
TABLE 1.
Distribution of HSEs in the promoter of clustered genes
| Genome | Independent | Both | NAD | CAD | |
|---|---|---|---|---|---|
| Distance from ORF | N/1078 | N/53 | N/7 | N/11 | N/31 |
| A (0–250) | 25.6% | 22.6% | 14.3% | 54.5%a | 48.4% |
| B (251–500) | 25.7% | 34.0% | 14.3% | 27.3% | 12.9% |
| C (501–750) | 23.8% | 24.5% | 42.9% | 0.0% | 16.1% |
| D (751–1000) | 24.9% | 18.9% | 28.6% | 18.2% | 22.6% |
DISCUSSION
This genome-wide study highlights the importance of the Hsf1 transcription factor in reprogramming cellular events to accommodate changes in temperature. Although yeast cells have two regulatory systems to deal with heat shock, each system has a very specific gene expression program. We used DNA microarrays on strains deleted for the Msn2/4 transcription factors to explore changes in gene expression that are independent of these factors. We then compared data from the msn2/4Δ strain with wild-type Hsf1 (HSF) to msn2/4Δ isogenic strains that were deleted for one of the activation domains (HSFΔNAD and HSFΔCAD) to understand their role during this critical time.
Our analysis led to three important results. First, we identified a large number of genes that are heat-induced in the absence of the Msn2/4 transcription factors (Fig. 2). The 442 induced genes are involved, to varying degrees, in almost every cellular process (Fig. 6), emphasizing the massive reprogramming that must occur during heat shock. We attribute the identification of such a large number of loci, in part, to improvements in microarray design and reproducibility over the last 5 years. In addition, the number of replicates and the high quality of the data gave us a low false discovery rate, thus broadening the group of genes that are regulated directly or indirectly by Hsf1 during the heat shock response. Although the Northern and microarray data were clean and reproducible, we encountered minor differences caused by cross contamination of the microarray probe sets. One critical example was SSA3, for which our microarray and Northern results did not agree for the HSFΔCAD strain (data not shown). This example emphasizes the importance of using alternative approaches to confirm microarray analysis data for individual genes of interest.
The number of genes identified by our microarray is much larger than the 165 loci identified in the recent Hsf1 ChIP-DNA microarray experiment presented in Hahn et al. (27). When we compared the data, 61 of 165 of genes identified by Hahn et al. were induced by at least 2-fold in our microarray experiments. Conversely, 13.8% of the genes that we identified as induced by at least 2-fold in our microarray experiments were also identified by Hahn et al. The discrepancies between our two experiments may be explained by the different yeast strains used in our respective studies, msn2/4Δ for our studies and MSN2/4 for the ChIP experiments. Many of the genes isolated in the ChIP experiment may require Msn2/4 to stabilize or enhance Hsf1 binding and heat inducibility. In addition, the discrepancies may be explained by the different techniques used in our respective studies. ChIP experiments depend on the ability to cross-link a protein to DNA and the ability of the antibody to detect an enrichment of that protein-bound DNA interaction over background (60). This is a useful technique for determining which genes have their promoters tightly bound by Hsf1. As such, the ChIP approach may underestimate the total number of targets if the antibody is not specific or if the interaction between Hsf1 and its target is transient or weak. On the other hand, microarray experiments allowed us to capture the expression profile of all the genes on the array regardless of the transient nature the protein-DNA interaction. Therefore, we were able to identify both direct and indirect targets of Hsf1.
Secondly, we determined that the N- and C-terminal activation domains both play important roles during the transient heat shock response (11, 12). We identified genes that are specifically dependent on the presence of the N- or C-terminal activation domains for heat induction using the QT clustering algorithm (Fig. 6). Several key features in the global expression can be attributed and recognized from the results of the QT clustering. The entire HSF gene list, including the genes with no known or recognized function was the starting material for the clustering. This led to the assigning of hypothetical functions to uncharacterized genes by analyzing well characterized genes in the same cluster (data not shown). Their responses to heat shock provided a clue to their possible function. All of the data can be taken together to propose a physiological picture of the cellular response to each condition tested.
More specifically, we were able to attribute the induction of specific chaperones to one of the two activation domains. 4 of the 17 chaperones (HSP42, JEM1, SCJ1, and SIS1) induced in the wild-type Hsf1 strain depend on the NAD for heat inducibility, whereas 8 of the 17 chaperones (ACA1, HCH1, HSP10, HSP26, HSP82, MDJ1, SSE2, and STI1) depend on the CAD for heat inducibility (Fig. 7). The remaining chaperones have no activation domain specificity but require at least one activation domain for heat inducibility.
The chaperones in cluster NAD include two HSP40 family members and two chaperones localized in the endoplasmic reticulum. The chaperones in the cluster CAD include HSP70 family members, three HSP90 co-chaperones, and two chaperones localized in the mitochondria. The chaperones in cluster INDEPENDENT are also diverse; they include two HSP70 family members, one chaperone that is localized in the mitochondria, and one that is localized in the plasma membrane.
In addition to chaperones, the cluster CAD is dominated by genes that are involved in cell rescue, defense and degradation; both of these functional categories are critical for maintaining protein homeostasis during exposure to stress. Although HSPs suppress the aggregation of many proteins, other proteins are targeted for degradation by the proteasome. Regulation of genes that depend on a specific activation domain is likely to occur through specific interactions with the transcriptional machinery. This possibility is strengthened by the fact that the TAF-recruiting activity has been mapped to the C-terminal activation domain (61). It is possible that genes that do not depend on the C-terminal activation domain may not require Hsf1 to interact with the TAF-containing form of TATA-binding protein (TBP). As an example, heat-induced expression of SSA4 does not require the C-terminal activation domain (Fig. 3) and does not require TAFs (18, 62).
Until now, the transient heat shock response appeared to be mediated by the N-terminal activation domain, but the targets of the NAD remained a mystery (12, 18). In this study, we identified genes that depend of the NAD for expression. We demonstrated that the cluster NAD is critical for specific chaperones, genes involved in metabolism (28.1%) and intracellular trafficking (15.6%) (Fig. 7C).
Thirdly, we revealed that co-regulated genes have HSEs at a specific distance upstream of the ORF and in a distinct orientation along the promoter (Table 1). The vast majority (82%) of the HSEs found in the promoters of the genes in the cluster NAD lie between 0 and 500 bp upstream of the ORF, far more than would be expected at random (50%) or what we found for all verifiable ORFs (51%). Similar results were seen for the cluster CAD. Many (61.3%) of the HSEs in the promoters of genes in cluster CAD lie between 0 and 500 bp upstream of the ORF (Table 1, column 5).
The promoter analysis also revealed that HSEs found in highly induced genes have an nTTCn as the first repeat. This fits nicely with the current model of Hsf1-HSE interaction. In order for Hsf1 to make contact with nTTCnnGAAn, the DNA-binding domain of two neighboring Hsf1 monomers must come very close together in the major groove of the DNA, whereas, to contact nGAAnnTTCn, the DNA-binding domain of two monomers must reach across the minor groove into the adjacent major groove (54, 56, 63). Our data suggest that distinct HSE topology may influence the activity of Hsf1 by dictating the protein surfaces available for interactions with other transcription factors. More detailed experiments are needed to test these hypotheses.
These different patterns of HSEs might be related to how Hsf1 uses its two activation domains to accomplish what multiple HSF genes achieve in other organisms. Hsf1 may interact with the transcriptional machinery or other transcription factors to regulate distinct classes of genes. Each activation domain may contribute to the transient heat shock response by recognizing specific promoter architecture, recruiting other proteins, and invoking regulatory mechanisms that contribute to the global gene expression pattern of Hsf1 during the transient heat shock response.
Supplementary Material
Acknowledgments
We thank Dr. Scott Ferguson for yeast strains, Dr. Don Baldwin and the Penn Microarray Facility for technical support, Dr. John Tobias for advice on analysis of microarray data, and Dr. Brian Brunk for assistance with the pattern identification program. We also thank Sara Achenbach, Laura Conlin, Scott Ferguson, and John Tobias for helpful discussions and critical readings of the manuscript.
Footnotes
This work was supported by National Institutes of Health Grant GM44086 and by the University of Pennsylvania Research Foundation.
The on-line version of this article (available at http://www.jbc.org) contains supplemental Table S1.
The abbreviations used are: HSP, heat shock protein; Hsf1, heat shock transcription factor; Msn2/4, Msn2 and Msn4 transcription factor; HSE, heat shock element; NAD, N-terminal activation domain; CAD, C-terminal activation domain; STRE, stress response element; MOPS, 4-morpholinepropanesulfonic acid; ORF, open reading frame; MES, 4-morpholineethanesulfonic acid; ChIP, chromatin immunoprecipitation; SGD, Saccharomyces Genome Database; QT, quality threshold; TAF, TATA-binding protein-associated factor.
References
- 1.Morimoto RI, Kline MP, Bimston DN, Cotto JJ. Essays Biochem. 1997;32:17–29. [PubMed] [Google Scholar]
- 2.Sorger PK, Pelham HR. Cell. 1988;54:855–864. doi: 10.1016/s0092-8674(88)91219-6. [DOI] [PubMed] [Google Scholar]
- 3.Wu C. Annu Rev Cell Dev Biol. 1995;11:441–469. doi: 10.1146/annurev.cb.11.110195.002301. [DOI] [PubMed] [Google Scholar]
- 4.Estruch F, Carlson M. Mol Cell Biol. 1993;13:3872–3881. doi: 10.1128/mcb.13.7.3872. [DOI] [PMC free article] [PubMed] [Google Scholar]
- 5.Kobayashi N, McEntee K. Mol Cell Biol. 1993;13:248–256. doi: 10.1128/mcb.13.1.248. [DOI] [PMC free article] [PubMed] [Google Scholar]
- 6.Harrison CJ, Bohm AA, Nelson HCM. Science. 1994;263:224–227. doi: 10.1126/science.8284672. [DOI] [PubMed] [Google Scholar]
- 7.Littlefield O, Nelson HCM. Nat Struct Biol. 1999;6:464–470. doi: 10.1038/8269. [DOI] [PubMed] [Google Scholar]
- 8.Peteranderl R, Nelson HCM. Biochemistry. 1992;31:12272–12276. doi: 10.1021/bi00163a042. [DOI] [PubMed] [Google Scholar]
- 9.Peteranderl R, Rabenstein M, Shin YK, Liu CW, Wemmer DE, King DS, Nelson HCM. Biochemistry. 1999;38:3559–3569. doi: 10.1021/bi981774j. [DOI] [PubMed] [Google Scholar]
- 10.Sorger PK, Nelson HCM. Cell. 1989;59:807–813. doi: 10.1016/0092-8674(89)90604-1. [DOI] [PubMed] [Google Scholar]
- 11.Nieto-Sotelo J, Wiederrecht G, Okuda A, Parker CS. Cell. 1990;62:807–817. doi: 10.1016/0092-8674(90)90124-w. [DOI] [PubMed] [Google Scholar]
- 12.Sorger PK. Cell. 1990;62:793–805. doi: 10.1016/0092-8674(90)90123-v. [DOI] [PubMed] [Google Scholar]
- 13.Gallo GJ, Prentice H, Kingston RE. Mol Cell Biol. 1993;13:749–761. doi: 10.1128/mcb.13.2.749. [DOI] [PMC free article] [PubMed] [Google Scholar]
- 14.Wiederrecht G, Seto D, Parker CS. Cell. 1988;54:841–853. doi: 10.1016/s0092-8674(88)91197-x. [DOI] [PubMed] [Google Scholar]
- 15.Jedlicka P, Mortin MA, Wu C. EMBO J. 1997;16:2452–2462. doi: 10.1093/emboj/16.9.2452. [DOI] [PMC free article] [PubMed] [Google Scholar]
- 16.Pirkkala L, Nykanen P, Sistonen L. FASEB J. 2001;15:1118–1131. doi: 10.1096/fj00-0294rev. [DOI] [PubMed] [Google Scholar]
- 17.Baniwal SK, Bharti K, Chan KY, Fauth M, Ganguli A, Kotak S, Mishra SK, Nover L, Port M, Scharf KD, Tripp J, Weber C, Zielinski D, von Koskull-Doring P. J Biosci. 2004;29:471–487. doi: 10.1007/BF02712120. [DOI] [PubMed] [Google Scholar]
- 18.Young MR, Craig EA. Mol Cell Biol. 1993;13:5637–5646. doi: 10.1128/mcb.13.9.5637. [DOI] [PMC free article] [PubMed] [Google Scholar]
- 19.Amoros M, Estruch F. Mol Microbiol. 2001;39:1523–1532. doi: 10.1046/j.1365-2958.2001.02339.x. [DOI] [PubMed] [Google Scholar]
- 20.Santoro N, Johansson N, Thiele DJ. Mol Cell Biol. 1998;18:6340–6352. doi: 10.1128/mcb.18.11.6340. [DOI] [PMC free article] [PubMed] [Google Scholar]
- 21.Tamai KT, Liu X, Silar P, Sosinowski T, Thiele DJ. Mol Cell Biol. 1994;14:8155–8165. doi: 10.1128/mcb.14.12.8155. [DOI] [PMC free article] [PubMed] [Google Scholar]
- 22.Estruch F. FEMS Microbiol Rev. 2000;24:469–486. doi: 10.1111/j.1574-6976.2000.tb00551.x. [DOI] [PubMed] [Google Scholar]
- 23.Martinez-Pastor MT, Marchler G, Schuller C, Marchler-Bauer A, Ruis H, Estruch F. EMBO J. 1996;15:2227–2235. [PMC free article] [PubMed] [Google Scholar]
- 24.Gorner W, Durchschlag E, Martinez-Pastor MT, Estruch F, Ammerer G, Hamilton B, Ruis H, Schuller C. Genes Dev. 1998;12:586–597. doi: 10.1101/gad.12.4.586. [DOI] [PMC free article] [PubMed] [Google Scholar]
- 25.Boy-Marcotte E, Lagniel G, Perrot M, Bussereau F, Boudsocq A, Jacquet M, Labarre J. Mol Microbiol. 1999;33:274–283. doi: 10.1046/j.1365-2958.1999.01467.x. [DOI] [PubMed] [Google Scholar]
- 26.Gasch AP, Spellman PT, Kao CM, Carmel-Harel O, Eisen MB, Storz G, Botstein D, Brown PO. Mol Biol Cell. 2000;11:4241–4257. doi: 10.1091/mbc.11.12.4241. [DOI] [PMC free article] [PubMed] [Google Scholar]
- 27.Hahn JS, Hu Z, Thiele DJ, Iyer VR. Mol Cell Biol. 2004;24:5249–5256. doi: 10.1128/MCB.24.12.5249-5256.2004. [DOI] [PMC free article] [PubMed] [Google Scholar]
- 28.Treger JM, Schmitt AP, Simon JR, McEntee K. J Biol Chem. 1998;273:26875–26879. doi: 10.1074/jbc.273.41.26875. [DOI] [PubMed] [Google Scholar]
- 29.Grably MR, Stanhill A, Tell O, Engelberg D. Mol Microbiol. 2002;44:21–35. doi: 10.1046/j.1365-2958.2002.02860.x. [DOI] [PubMed] [Google Scholar]
- 30.Yamamoto A, Mizukami Y, Sakurai H. J Biol Chem. 2005;280:11911–11919. doi: 10.1074/jbc.M411256200. [DOI] [PubMed] [Google Scholar]
- 31.Ferguson SB, Anderson ES, Harshaw RB, Thate T, Craig NL, Nelson HC. Genetics. 2005;169:1203–1214. doi: 10.1534/genetics.104.034256. [DOI] [PMC free article] [PubMed] [Google Scholar]
- 32.Ferguson SB. Cell and Molecular Biology. University of Pennsylvania; Philadelphia PA: 2005. Negative Regulation of the Heat Shock Transcription Factor by Protein Kinase A in Saccharomyces cerevisiae, , Ph.D. dissertation. [Google Scholar]
- 33.Ausubel FM, Brent R, Kingston RE, Moore DD, Seidman JG, Smith JA, Struhl K. Current Protocols in Molecular Biology. Greene Publishing Associates Inc., and John Wiley & Sons, Inc; 2004. pp. 13-12.1–13-12.5. [Google Scholar]
- 34.Tusher VG, Tibshirani R, Chu G. Proc Natl Acad Sci U S A. 2001;98:5116–5121. doi: 10.1073/pnas.091062498. [DOI] [PMC free article] [PubMed] [Google Scholar]
- 35.Heyer LJ, Kruglyak S, Yooseph S. Genome Res. 1999;9:1106–1115. doi: 10.1101/gr.9.11.1106. [DOI] [PMC free article] [PubMed] [Google Scholar]
- 36.Ball CA, Dolinski K, Dwight SS, Harris MA, Issel-Tarver L, Kasarskis A, Scafe CR, Sherlock G, Binkley G, Jin H, Kaloper M, Orr SD, Schroeder M, Weng S, Zhu Y, Botstein D, Cherry JM. Nucleic Acids Res. 2000;28:77–80. doi: 10.1093/nar/28.1.77. [DOI] [PMC free article] [PubMed] [Google Scholar]
- 37.Balakrishnan R, Christie KR, Costanzo MC, Dolinski K, Dwight SS, Engel SR, Fisk DG, Hirschman JE, Hong EL, Nash R, Oughtred R, Skrzypek M, Theesfeld CL, Binkley G, Lane C, Schroeder M, Sethuraman A, Dong S, Weng S, Miyasato S, Andrada R, Botstein D, Cherry JM. Saccharomyces Genome Database. 2005 www.yeastgenome.org.
- 38.Lagorce A, Hauser NC, Labourdette D, Rodriguez C, Martin-Yken H, Arroyo J, Hoheisel JD, Francois J. J Biol Chem. 2003;278:20345–20357. doi: 10.1074/jbc.M211604200. [DOI] [PubMed] [Google Scholar]
- 39.Moskvina E, Schuller C, Maurer CT, Mager WH, Ruis H. Yeast. 1998;14:1041–1050. doi: 10.1002/(SICI)1097-0061(199808)14:11<1041::AID-YEA296>3.0.CO;2-4. [DOI] [PubMed] [Google Scholar]
- 40.Bulman AL, Hubl ST, Nelson HC. J Biol Chem. 2001;276:40254–40262. doi: 10.1074/jbc.M106301200. [DOI] [PubMed] [Google Scholar]
- 41.Chen Y, Barlev NA, Westergaard O, Jakobsen BK. EMBO J. 1993;12:5007–5018. doi: 10.1002/j.1460-2075.1993.tb06194.x. [DOI] [PMC free article] [PubMed] [Google Scholar]
- 42.Bonner JJ, Heyward S, Fackenthal DL. Mol Cell Biol. 1992;12:1021–1030. doi: 10.1128/mcb.12.3.1021. [DOI] [PMC free article] [PubMed] [Google Scholar]
- 43.Sakurai H, Fukasawa T. Biochem Biophys Res Commun. 2001;285:696–701. doi: 10.1006/bbrc.2001.5234. [DOI] [PubMed] [Google Scholar]
- 44.Mewes HW, Albermann K, Heumann K, Liebl S, Pfeiffer F. Nucleic Acids Res. 1997;25:28–30. doi: 10.1093/nar/25.1.28. [DOI] [PMC free article] [PubMed] [Google Scholar]
- 45.Causton HC, Ren B, Koh SS, Harbison CT, Kanin E, Jennings EG, Lee TI, True HL, Lander ES, Young RA. Mol Biol Cell. 2001;12:323–337. doi: 10.1091/mbc.12.2.323. [DOI] [PMC free article] [PubMed] [Google Scholar]
- 46.Mai B, Breeden L. Mol Cell Biol. 1997;17:6491–6501. doi: 10.1128/mcb.17.11.6491. [DOI] [PMC free article] [PubMed] [Google Scholar]
- 47.Rowley A, Johnston GC, Butler B, Werner-Washburne M, Singer RA. Mol Cell Biol. 1993;13:1034–1041. doi: 10.1128/mcb.13.2.1034. [DOI] [PMC free article] [PubMed] [Google Scholar]
- 48.Travers KJ, Patil CK, Wodicka L, Lockhart DJ, Weissman JS, Walter P. Cell. 2000;101:249–258. doi: 10.1016/s0092-8674(00)80835-1. [DOI] [PubMed] [Google Scholar]
- 49.Yoshida H, Matsui T, Yamamoto A, Okada T, Mori K. Cell. 2001;107:881–891. doi: 10.1016/s0092-8674(01)00611-0. [DOI] [PubMed] [Google Scholar]
- 50.Lee TI, Rinaldi NJ, Robert F, Odom DT, Bar-Joseph Z, Gerber GK, Hannett NM, Harbison CT, Thompson CM, Simon I, Zeitlinger J, Jennings EG, Murray HL, Gordon DB, Ren B, Wyrick JJ, Tagne JB, Volkert TL, Fraenkel E, Gifford DK, Young RA. Science. 2002;298:799–804. doi: 10.1126/science.1075090. [DOI] [PubMed] [Google Scholar]
- 51.Hahn JS, Thiele DJ. J Biol Chem. 2004;279:5169–5176. doi: 10.1074/jbc.M311005200. [DOI] [PubMed] [Google Scholar]
- 52.Trinklein ND, Murray JI, Hartman SJ, Botstein D, Myers RM. Mol Biol Cell. 2004;15:1254–1261. doi: 10.1091/mbc.E03-10-0738. [DOI] [PMC free article] [PubMed] [Google Scholar]
- 53.Amin J, Ananthan J, Voellmy R. Mol Cell Biol. 1988;8:3761–3769. doi: 10.1128/mcb.8.9.3761. [DOI] [PMC free article] [PubMed] [Google Scholar]
- 54.Perisic O, Xiao H, Lis JT. Cell. 1989;59:797–806. doi: 10.1016/0092-8674(89)90603-x. [DOI] [PubMed] [Google Scholar]
- 55.Xiao H, Lis JT. Science. 1988;239:1139–1142. doi: 10.1126/science.3125608. [DOI] [PubMed] [Google Scholar]
- 56.Xiao H, Perisic O, Lis JT. Cell. 1991;64:585–593. doi: 10.1016/0092-8674(91)90242-q. [DOI] [PubMed] [Google Scholar]
- 57.Fernandes M, Xiao H, Lis JT. Nucleic Acids Res. 1994;22:167–173. doi: 10.1093/nar/22.2.167. [DOI] [PMC free article] [PubMed] [Google Scholar]
- 58.Tachibana T, Astumi S, Shioda R, Ueno M, Uritani M, Ushimaru T. J Biol Chem. 2002;277:22140–22146. doi: 10.1074/jbc.M201267200. [DOI] [PubMed] [Google Scholar]
- 59.Shuey DJ, Parker CS. J Biol Chem. 1986;261:7934–7940. [PubMed] [Google Scholar]
- 60.Lee TI, Johnstone SE, Young RA. Nat Protocols. 2006;1:729–748. doi: 10.1038/nprot.2006.98. [DOI] [PMC free article] [PubMed] [Google Scholar]
- 61.Sakurai H, Hashikawa N, Imazu H, Fukasawa T. Genes Cells. 2003;8:951–961. doi: 10.1046/j.1356-9597.2003.00689.x. [DOI] [PubMed] [Google Scholar]
- 62.Moqtaderi Z, Bai Y, Poon D, Weil PA, Struhl K. Nature. 1996;383:188–191. doi: 10.1038/383188a0. [DOI] [PubMed] [Google Scholar]
- 63.Bonner JJ, Ballou C, Fackenthal DL. Mol Cell Biol. 1994;14:501–508. doi: 10.1128/mcb.14.1.501. [DOI] [PMC free article] [PubMed] [Google Scholar]
Associated Data
This section collects any data citations, data availability statements, or supplementary materials included in this article.