Abstract
The effects of calcium ion on the Na+ activation gate were studied in squid giant axons. Saxitoxin (STX) was used to block ion entry into Na+ channels without hindering access to the membrane surface, making it possible to distinguish surface effects of calcium from pore-occupancy effects. In the presence of STX, gating kinetics were measured from gating current (Ig). The kinetic effects of external calcium concentration changes were small when STX was present. In the absence of STX, lowering the calcium concentration (from 100 to 10 mM) slowed the closing of Na+ channels (measured from INa tails) by more than a factor of 2. Surprisingly, the voltage sensitivity of closing kinetics changed with calcium concentration, and it was modified by STX. Voltage sensitivity apparently depends in part on the ability of calcium to enter and block the channels as voltage is driven negative. In external medium with no added calcium, INa tail current initially increases in amplitude severalfold with the relief of calcium block, then progressively slows and gets smaller, as calcium diffuses out of the layers investing the axon. INa tails seen just before the current disappears suggest that closing in the absence of channel block is very slow or does not occur. INa amplitude and kinetics are completely restored when calcium is returned. The results strongly suggest that calcium occupancy is a requirement for channel closing and that nonoccupied channels fold reversibly into a nonfunctional conformation.
This is the second of two papers that examine the role of calcium ion in the gating of Na+ channels. Results presented in the first paper (1) strongly suggest that Na+ channels can close while blocked or occupied by calcium ions, and they raise the possibility that calcium occupation facilitates closing. Evidence for the latter is that closing (or deactivation) rate over a wide range of calcium concentrations is a linear function of the fraction of the channels that are blocked by calcium, and, by extrapolation, the closing rate is near zero when none of the channels are calcium-occupied.
The actions of calcium ions on gating properties of Na+ channels are usually explained by surface charge theory (well summarized in ref. 2). Here it is proposed instead that pore occupancy by calcium is the basis for some of these effects. The necessary distinction between surface and pore-occupancy effects was achieved by the use of saxitoxin (STX). This toxin occupies the outer mouth of the Na+ pore, preventing ion movement in or out, without hindering access to the membrane surface (2, 3). Gating events in the presence of STX are detected by measuring gating current (Ig), the small current that is generated primarily by movement of the charged S4 transmembrane segments. Channel closing kinetics were studied most intensively, because of their simple first-order time course.
It is shown that in the presence of STX, the effects of calcium on gating properties are small, indicating that surface potential changes are not an important component of calcium action on gating. Much larger effects of calcium are seen in the absence of STX, when Na+ and Ca2+ can enter and leave the pore. Consistent with the idea that calcium-occupied pores close preferentially, closing is reversibly slowed by a large factor when external calcium is completely removed.
METHODS
Squid of species Loligo peallei were obtained at the Marine Biological Laboratory, Woods Hole, MA, where all experiments were performed. Giant axons were isolated, internally perfused, and voltage clamped, using standard methods (4). During the experiments, axons were maintained in a narrow semicylindical chamber of diameter 1.5 mm, lined with three platinum black electrodes: a central current measuring electrode of 7 mm with a guard electrode on either side. This chamber had no dead spaces and was designed to make it easy to change the external solution while maintaining the accuracy of current measurement. The adequacy of voltage control along the axon was checked from time to time by a second internal voltage electrode in the left guard region. No serious error was found even in solutions of very low calcium concentration.
Gating currents were measured after eliminating ionic current by ion substitution. A current transient was recorded during a voltage step within the range where gates open and close, roughly −60 to 0 mV. This transient included gating current together with capacitive and leak currents. The latter were measured separately and subtracted from the transient, leaving only gating current. Capacity and leak currents were averaged during a series of steps from +50 to +100 mV, where the gating charge is fixed in “open” position and thus does not contribute to the current. This range was used because in solutions with low calcium concentrations, capacitive current recorded near −150 mV was found to be contaminated by nonlinear charge movement. The leak/capacitance sample was scaled appropriately before subtraction. INa traces were also corrected for capacitive and leakage current. In this case the current for subtraction was obtained from steps near −150 mV.
The names and compositions of external solutions are given in Table 1. All solution changes were bracketed by, e.g., a run in 100Ca before and after exposure to 10Ca. Only those experiments in which the bracketing runs matched closely were accepted. The internal solution contained 550 mM N-methylglucamine+, 50 mM F−, 50 mM Cl−, 450 mM glutamate−, and 20 mM Hepes, pH 7.0.
Table 1.
External solutions
| Name | [Ca2+], mM | [Na+], mM | [TMA+], mM | [Cl−], mM | [Hepes], mM |
|---|---|---|---|---|---|
| 100Ca | 100 | 405 | 605 | 10 | |
| 10Ca | 10 | 536 | 556 | 10 | |
| 100Ca 100Na | 100 | 100 | 305 | 605 | 10 |
| 10Ca 100 Na | 10 | 100 | 436 | 556 | 10 |
| 0Ca 100Na | 100 | 450 | 550 | 10 |
pH of all solutions was 7.0; osmolality was ≈1000 mosmolal. TMA, tetramethylammonium.
RESULTS
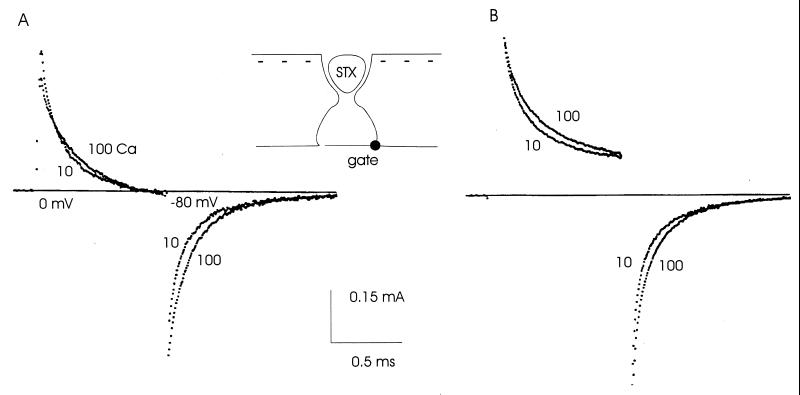
Surface effects of changing calcium concentration are shown in Fig. 1. STX (see Inset) was used to occlude the pore mouth, without obstructing access to the membrane surface (3). The left traces in Fig. 1 show gating current for an activating step to 0 mV, followed by repolarization to −80 mV. Ig is outward during the activating step, reflecting the outward movement of the positively charged S4 segments. S4 movement drives the activation gate of each channel into open conformation. On repolarization, Ig is inward as the S4 segments move inward to rest position, and the gate of each channel deactivates. Changing the calcium concentration from 100 to 10 mM increases the initial amplitude of Ig slightly and makes its time course slightly faster. The inward tail of gating current on repolarization is also slightly faster in 10 than in 100 mM Ca2+. These small changes were completely reversible on returning to 100 mM Ca2+.
Figure 1.
Gating current recorded in the presence of STX is not very sensitive to changes of calcium concentration. STX was used to prevent ion movement in and out of the pore, without disturbing access to surface charges (Inset). (A) Ig in 10 and 100 mM Ca2+, with linear capacitive and leakage current subtracted. (B) As in A, but without subtraction. The changes with calcium concentration are qualitatively the same as with subtraction. Solutions: 100Ca and 10Ca; temperature: 5°C.
As noted in Methods, gating current measurement involves subtraction of a sample of linear capacitive and leak current. This sample is sometimes of dubious purity, raising the possibility that the recorded gating current is contaminated by nonlinear charge movement included in the capacitive current sample. Time resolution was excellent in the experiment of Fig. 1 and the subtraction procedure was almost superfluous, as shown in the right traces, where there was no subtraction. Except for the presence of a leakage current, which raises the outward current traces above the baseline late in the activating step, the results are very similar to the ones with subtraction. Based on experience with ionic current or conductance tails (5), the results of the calcium change are rather small. Further, the kinetic alteration of the deactivation tails is in an unexpected direction: the gating current tails become slightly faster when Ca2+ is lowered, while ionic current (INa) tails slow down (ref. 5 and below).
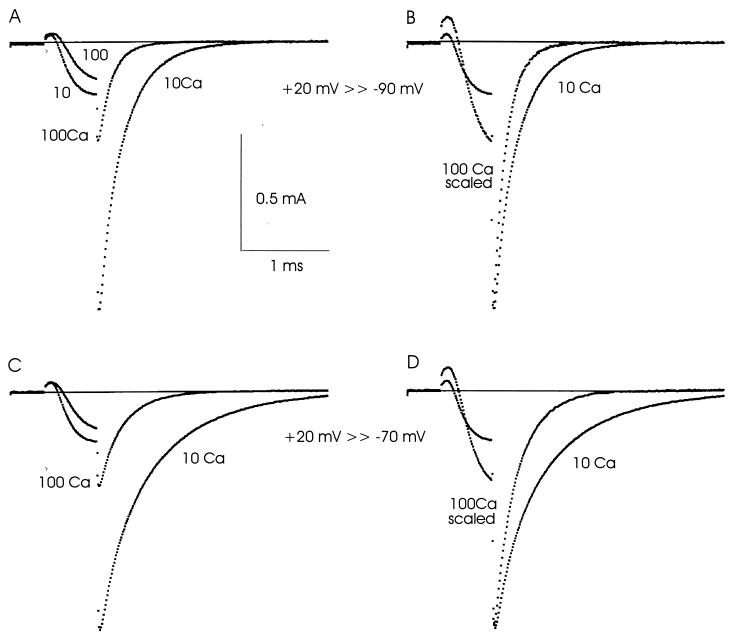
Much larger effects of calcium changes are seen when STX is absent, making it possible for sodium and calcium ions to move in and out of the pore (Fig. 2). The superimposed upper left traces show INa at two calcium concentrations during a 0.6-ms step to +20 mV with repolarization to −90 mV. During the activating pulse, the rise of INa is slower in 100Ca than in 10Ca, and its final value is smaller because of block by Ca2+. INa jumps instantaneously on repolarization because the driving force on Na+ increases. Block in 100Ca is particularly evident when the INa tails are compared. Ca2+ is drawn into the pore by increased internal negativity, making the 100Ca tail much smaller than the one in 10Ca.
Figure 2.
Closing (deactivation) of Na+ channels is strongly affected by calcium concentration changes when Na+ and Ca2+ can enter the pore. Na+ channels were activated by a pulse to +20 mV and repolarized to −90 mV (A and B) or −70 mV (C and D). INa tails at −90 or −70 mV are much larger in 10Ca because block is less (A and C). Closing of Na+ channels is much slower in 10Ca, as can be seen in B and D, where the 100Ca tails have been scaled up. Solutions: 100Ca 100Na and 10Ca 100Na; temperature: 5°C.
Turning from block to closing kinetics, the INa tail decays much more rapidly in 100Ca than in 10Ca, as is clear from the scaled traces at right of Fig. 2. The tail is the result of simultaneous closing of the activation and inactivation gates. To eliminate the effect of inactivation, its rate was measured during a large depolarization and subtracted to give the deactivation rate in isolation (cf. ref. 6). The deactivation (closing) rate is more than twice as large in 100Ca. The differences in deactivation rate are even more pronounced when the axon is repolarized to −70 mV rather than to −90 mV, as shown by the lower traces in Fig. 2. Overall, comparison to the gating current tails in Fig. 1 makes it clear that the kinetic changes of INa are both larger and in the opposite direction: INa decays more slowly in 10Ca, whereas Ig decays slightly faster.
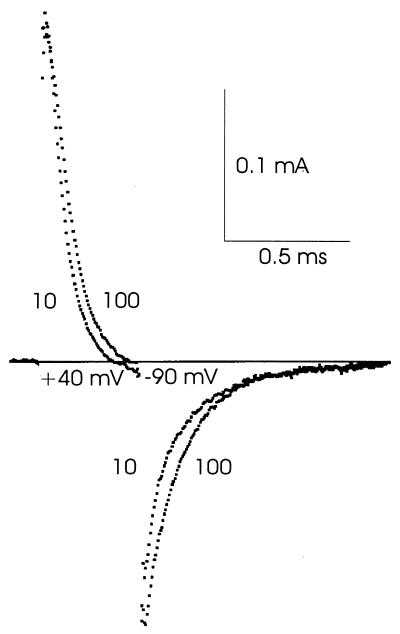
The gating current tails in Fig. 1 were recorded in Na+-free solution containing STX. To make sure that the differences between Figs. 1 and 2 were the result of STX rather than the different Na+ concentrations, Ig was recorded in medium containing 100 mM Na+ together with STX, as shown in Fig. 3. The traces are very similar to the ones in Fig. 1, and again show Ig tails that are slightly faster in 10 mM Ca2+ than in 100 mM Ca2+.
Figure 3.
STX suppresses the sensitivity of Ig to calcium changes even in the presence of external Na+. The external solutions were 100Ca 100Na and 10Ca 100Na. Channels were activated at +40 mV and deactivated at −90 mV. About half of the inactivation gates had been removed by internal perfusion with Pronase. As expected, the effect of Pronase treatment on the gating current tail after the short pulse illustrated was negligible. Temperature: 8°C.
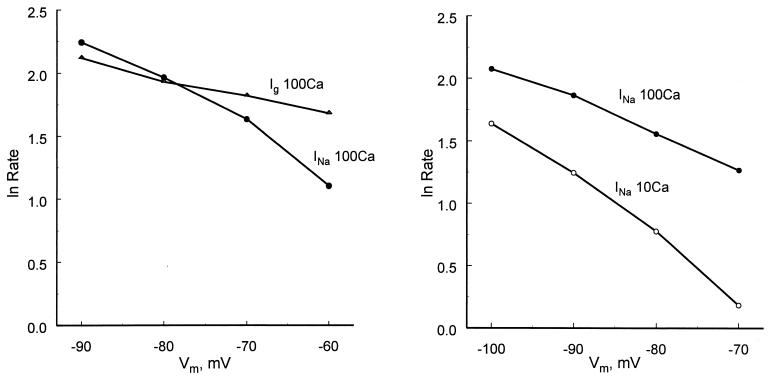
It has been known since the experiments of Hodgkin and Huxley (7) that Na+ channel activation gates close faster when membrane potential (Vm) is made more negative. This effect is clearly visible in Fig. 2 when the INa tails at −90 and −70 mV are compared. The sensitivity of the deactivation rate to Vm has generally been regarded as an intrinsic property of the Na+ channel protein. It was thus surprising to find that Vm sensitivity also depends on the calcium concentration and the presence or absence of STX. Fig. 4 Left compares the deactivation rate at several voltages with and without STX, as measured from Ig or INa tails. From −60 to −90 mV, the deactivation rate of Ig changes by a factor of 1.5, compared with a factor of more than 3 for INa tails (Ig and INa in 100 mM Ca2+). The deactivation rate is even more affected by Vm in 10Ca, as shown in Fig. 4 Right. Over the range from −70 to −100 mV, the rate changes by a factor of 2.2 in 100Ca and by 4.3 in 10Ca. As discussed below, these results strongly indicate that some of the Vm sensitivity of closing arises from the tendency of calcium to enter the pore as Vm is made more negative.
Figure 4.
Voltage sensitivity of deactivation rate in several conditions. Deactivation rate was measured by fitting a single exponential to gating current or INa tails. (Left) Deactivation rate measured from INa tails in 100Ca 100Na increases significantly as Vm is made more negative. As measured from Ig tails in STX, deactivation rate is almost insensitive to voltage. (Right) Lowering the external calcium concentration increases the sensitivity of deactivation rate to voltage, probably because the fraction of calcium-blocked channels changes more with voltage in low calcium.
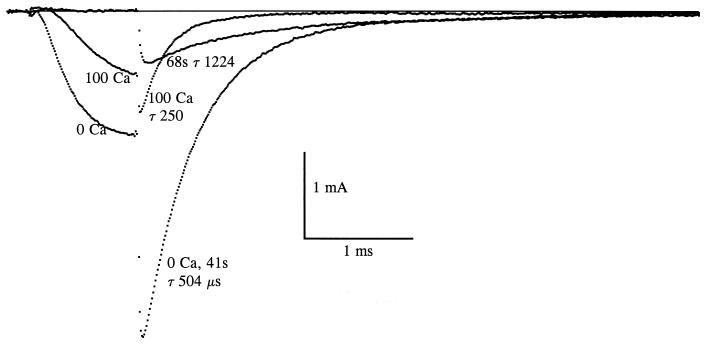
The results presented above and in the previous paper suggest that Na+ channels close preferentially when occupied (blocked) by calcium. The deactivation rate of Na+ channels in GH3 cells decreases as calcium is reduced, and the rate is almost linearly proportional to the fraction of the channels that are Ca2+-blocked (1). We were unable to investigate very low calcium concentrations because these solutions caused irreversible cell damage. Fortunately squid axons tolerate short exposures to 0 Ca2+ solution. The 0 Ca2+ experiment has been performed numerous times over the course of 5 years, and a typical result is shown in Fig. 5. Na+ channels were activated by a 1-ms pulse to 0 mV, and then deactivated by repolarizing to −80 mV. The first trace is in 100Ca 100Na, and the time constant of the tail was 250 μs. Forty-one seconds after a thorough wash with 0Ca 100Na, INa during the activating pulse was about twice as big as in 100Ca, and tail current was increased by a factor of 3, because Ca2+ block was virtually absent. Deactivation kinetics at 41 s were slowed to about half relative to 100Ca. Over the course of the next 30 s, current became much smaller both during and after the pulse, and deactivation kinetics slowed markedly. After 68 s INa during the pulse was not detectable, and the tail current decayed with a time constant of 1224 μs. This decay rate can be completely explained by Na+ inactivation, which was functioning normally in this axon; i.e., the closing rate was probably very small indeed, and the decay of the tail was almost entirely because of inactivation. Shortly afterward the axon was washed with 100Ca 100Na, and the current recovered completely within about 2 min: the 100Ca trace in Fig. 5 is the superimposition of two nearly identical traces, one taken before and one after exposure to 0Ca 100Na. Disappearance of the current in 0Ca 100Na could not be prevented by making the holding potential more negative. Slowing and disappearance of the current are discussed below.
Figure 5.
Effects of calcium removal. Following a record in 100Ca 100Na, the fiber was washed with 0Ca 100Na for approximately 30 s (15 chamber volumes). Forty-one seconds after beginning the wash, INa is increased both during the activating pulse (to 0 mV) and during deactivation (at −80 mV) because of decreased channel block by calcium. The tail time constant (τ) is approximately doubled at 41 s, and it increases progressively to 1224 μs at 68 s. At this time INa is very small. It recovers completely in 100Ca 100Na: the bracketing traces in this solution superimpose almost perfectly. Temperature: 8°C.
DISCUSSION
By using STX to block Ca2+ and Na+ movements into and out of the Na+ pore, it is possible to distinguish calcium effects arising from surface actions external to the STX site from effects that require calcium entry into the pore. The surface actions of calcium are not impressive, as seen in Figs. 1 and 3. Deactivation is only slightly affected when calcium is reduced from 100 to 10 mM, and the usual effect is acceleration, precisely the opposite of the change expected from a calcium-induced alteration of the surface potential. If a surface potential change were involved, lowering calcium would speed Ig during activation (observed), and slow Ig during deactivation (the opposite is observed). These changes were confirmed in the experiment of Fig. 1B, where there was no possibility of an artifact from the subtraction procedure. In summary, the surface actions of calcium are small, and the deactivation effect is not consistent with the idea of a calcium-induced surface potential change.
Calcium affects deactivation gating much more strongly in the absence of STX, when Na+ and Ca2+ can move in and out of the pore. Deactivation kinetics in these conditions are slowed by a lowering of calcium concentration, and the effect is large, in marked contrast to calcium effects in STX-containing solutions. The observations are most easily explained by saying that calcium occupancy of the pore facilitates closing, that sodium competes with calcium for pore occupancy, and that an increase of calcium concentration enhances the likelihood of calcium occupancy.
The sensitivity of closing kinetics to Vm is much more pronounced if Ca2+ can enter and leave the pore (Fig. 4). Deactivation in STX, as detected by Ig measurement, is not very sensitive to Vm: 70 mV is required for an e-fold (2.718… ×) change of deactivation rate. The deactivation rate measured from INa is much more sensitive to Vm: only 27 mV is required for an e-fold change in 100Ca. The best explanation is the following: (i) Ca2+ occupancy of the pore is helpful or necessary for closing. (ii) With STX in the pore mouth, calcium remains trapped in the pore, even during a depolarization that opens the gate, and calcium occupancy thus is not affected by Vm. (iii) In 100Ca 100Na with no STX, calcium can leave the pore when it opens, presumably to be replaced by one or more Na+ ions: sodium competes with calcium for pore occupancy. (iv) Negative voltage favors calcium in this competition, because it is divalent. (v) The fraction of the channels blocked by calcium thus increases as Vm is made more negative. This increase in occupancy with negativity enhances the sensitivity of deactivation rate to voltage. The mechanism by which Ca2+ occupancy affects closing rate is unknown but easily imagined.
Similar reasoning can be used to explain why Vm sensitivity almost doubled in Fig. 4 Right, when Ca2+ was lowered from 100 to 10 mM. A likely explanation is that the fraction of Ca2+-blocked channels is small in 10Ca, and there is a substantial proportional increase as voltage goes negative. In 100Ca, on the other hand, the majority of the channels are Ca2+-blocked at −70 mV, and the proportional increase on changing to −100 mV is not as large as in 10Ca.
If calcium is required for channel closing, as suggested by the results given above, and by Figure 4 in the preceding paper (1), a crucial experiment is to remove calcium entirely and observe the effects on closing. The result is a pronounced slowing of the deactivation rate (Fig. 5): after 68 s in 0Ca 100Na the decay of the current is quite slow and probably the result of inactivation rather than deactivation. The rate of deactivation is probably near zero. This observation is consistent with the idea that calcium occupation is a requirement for channel closing.
Fig. 5 is not easily reconcilable with predictions of the surface charge hypothesis. With surface charge densities in the range usually ascribed to nerve membrane, the change of surface potential is small for changes of Ca2+ concentration below 1 mM (2, 8). In Fig. 5, on the other hand, a large kinetic change occurs when calcium is in the submillimolar range. Calcium concentration must drop well below 1 mM early during the wash with 0Ca 100Na, and it then declines further as Ca2+ diffuses away. The major changes in kinetics occur after the wash, when calcium concentration is very low.
The disappearance of INa in 0Ca 100Na is reminiscent of the now well-documented effects of K+ removal on K+ channels. In squid axons, K+ channel activity disappears irreversibly when K+ is removed from both inside and out (9, 10). Permanent destruction of K+ channel activity also results from adding tetraethylammonium+ to the internal medium in the absence of external K+ (11). Apparently a site in the external part of the K+ pore must be K+-occupied to preserve channel integrity. In Shaker B K+ channels, K+ removal inside and out also leads to loss of K+ channel function, but in this preparation it is reversible (12, 13). Finally, external Ca2+ removal in squid neurons and in Shaker B channels expressed in Sf9 cells leads to reversible disappearance of K+ channel activity and its replacement by a nonselective, nongated current (14, 15). In the present case, disappearance of the current is not the result of inactivation, because it could not be reversed by hyperpolarization. Further, recovery on return to Ca2+-containing solution was quite slow, consistent with the idea that extensive refolding of the molecule was necessary. The data suggest that Na+ channels that are not calcium-occupied fail to close, and they subsequently fold into a nonfunctional conformation. This conformation reverts slowly to normal on restoration of calcium.
There are several reports in the literature regarding Ca2+ removal from excitable membranes. Frankenhaeuser (16) noted that 10 μM Ca2+ is necessary to maintain conduction in myelinated nerve. Frog muscle fibers continue to twitch in very low Ca2+ solution containing 2 mM EGTA (17). In this case it seems likely that Na+ channels were sustained by the normal millimolar concentration of internal Mg2+, since this ion is an adequate Ca2+ substitute (1). Hille and colleagues (18) showed healthy INa–V curves from a node of Ranvier in nominally 0 mM Ca2+/7 mM Na+ solution. No information is given regarding closing kinetics. Vandenberg and Bezanilla (19) showed a record from a patch formed by pressing a pipette against the inner surface of a cut-open squid axon. The membrane was washed with nominally 0 Ca2+ solution, and it showed only minor changes in the kinetics of closing. Our results agree with those of Frankenhaeuser on the necessity of calcium (or a suitable substitute) for maintaining Na+ channel activity. There is no clear reconciliation with the two reports of Na+ channel activity in zero calcium. We found it difficult to wash calcium away thoroughly, and this may also have been a problem in their experiments. Faced with this uncertainty, it can only be said that the observations in perfused squid axon are clear and consistent and have been repeated many times over a span of 5 years.
The results shown here suggest that an early event in the closing of a sodium channel is occupation of the channel lumen by calcium. Conversely, it can be supposed that Ca2+ remains in the channel during the closed interval, and that release of a calcium ion from the lumen is a late or final step in the activation chain. Calcium release from the Na+ channel, and possibly also from the K+ channel (14, 15) thus may play a part in the concerted step(s) proposed to terminate channel activation.
Acknowledgments
The early experiments in this series were performed in collaboration with Dr. Kamram Khodakhah. I am grateful to Drs. Steve Baylor, Brian Salzberg, Zhe Lu, and W. F. Gilly for reading and commenting on the manuscript. This work was supported by U.S. Public Health Service Grant NS12547.
ABBREVIATION
- STX
saxitoxin
Footnotes
A Commentary on this article begins on page 3331.
References
- 1.Armstrong C M, Cota G. Proc Natl Acad Sci USA. 1999;96:4154–4157. doi: 10.1073/pnas.96.7.4154. [DOI] [PMC free article] [PubMed] [Google Scholar]
- 2.Hille B. Ionic Channels of Excitable Membranes. Sunderland, MA: Sinauer; 1992. [Google Scholar]
- 3.Lipkind G M, Fozzard H A. Biophys J. 1994;66:1–13. doi: 10.1016/S0006-3495(94)80746-5. [DOI] [PMC free article] [PubMed] [Google Scholar]
- 4.Bezanilla F, Armstrong C M. J Gen Physiol. 1977;70:549–566. doi: 10.1085/jgp.70.5.549. [DOI] [PMC free article] [PubMed] [Google Scholar]
- 5.Frankenhaeuser B, Hodgkin A L. J Physiol (London) 1957;137:218–244. doi: 10.1113/jphysiol.1957.sp005808. [DOI] [PMC free article] [PubMed] [Google Scholar]
- 6.Cota G, Armstrong C M. J Gen Physiol. 1989;94:213–232. doi: 10.1085/jgp.94.2.213. [DOI] [PMC free article] [PubMed] [Google Scholar]
- 7.Hodgkin A L, Huxley A F. J Physiol (London) 1952;117:500–544. doi: 10.1113/jphysiol.1952.sp004764. [DOI] [PMC free article] [PubMed] [Google Scholar]
- 8.McLaughlin S G A, Szabo G, Eisenman G. J Gen Physiol. 1971;58:667–687. doi: 10.1085/jgp.58.6.667. [DOI] [PMC free article] [PubMed] [Google Scholar]
- 9.Chandler W K, Meves H. J Physiol (London) 1970;211:679–705. doi: 10.1113/jphysiol.1970.sp009299. [DOI] [PMC free article] [PubMed] [Google Scholar]
- 10.Almers W, Armstrong C M. J Gen Physiol. 1980;75:61–78. doi: 10.1085/jgp.75.1.61. [DOI] [PMC free article] [PubMed] [Google Scholar]
- 11.Khodakhah K, Melishchuk A, Armstrong C M. Proc Natl Acad Sci USA. 1997;94:13335–13338. doi: 10.1073/pnas.94.24.13335. [DOI] [PMC free article] [PubMed] [Google Scholar]
- 12.Gomez-Lagunas F. J Physiol (London) 1977;499:3–15. doi: 10.1113/jphysiol.1997.sp021907. [DOI] [PMC free article] [PubMed] [Google Scholar]
- 13.Melishchuk A, Loboda A, Armstrong C M. Biophys J. 1998;75:1828–1835. doi: 10.1016/S0006-3495(98)77624-6. [DOI] [PMC free article] [PubMed] [Google Scholar]
- 14.Armstrong C M, Lopez-Barneo J. Science. 1987;236:712–714. doi: 10.1126/science.2437654. [DOI] [PubMed] [Google Scholar]
- 15.Armstrong C M, Miller C. Proc Natl Acad Sci USA. 1990;87:7579–7582. doi: 10.1073/pnas.87.19.7579. [DOI] [PMC free article] [PubMed] [Google Scholar]
- 16.Frankenhaeuser B. J Physiol (London) 1957;137:245–257. doi: 10.1113/jphysiol.1957.sp005809. [DOI] [PMC free article] [PubMed] [Google Scholar]
- 17.Armstrong C M, Bezanilla F, Horowicz P. Biochim Biophys Acta. 1972;267:605–608. doi: 10.1016/0005-2728(72)90194-6. [DOI] [PubMed] [Google Scholar]
- 18.Hille B, Woodhull A M, Shapiro B I. Philos Trans R Soc London B. 1975;270:301–318. doi: 10.1098/rstb.1975.0011. [DOI] [PubMed] [Google Scholar]
- 19.Vandenberg C A, Bezanilla F. Biophys J. 1991;60:1499–1510. doi: 10.1016/S0006-3495(91)82185-3. [DOI] [PMC free article] [PubMed] [Google Scholar]


