

Abstract
Background and Purpose
Inbred mouse strains C57BL/6J (B6) and C3H/HeJ (C3H) exhibit marked differences in atherosclerotic lesion formation in the carotid arteries on the apolipoprotein E–deficient (apoE−/−) background when fed a Western diet. Quantitative trait locus analysis was performed on an intercross between B6.apoE−/− and C3H.apoE−/− mice to determine genetic factors contributing to variation in the phenotype.
Methods
Female B6.apoE−/− mice were crossed with male C3H.apoE−/− mice to generate F1 hybrids, which were intercrossed to generate 241 female F2 progeny. At 6 weeks of age, F2 mice were started on a Western diet. After being fed the diet for 12 weeks, F2 mice were analyzed for phenotypes such as lesion size in the left carotid arteries and plasma lipid levels and typed for 154 genetic markers spanning the mouse genome.
Results
One significant quantitative trait locus, named CAth1 (25 cM, log of the odds score: 4.5), on chromosome 12 and 4 suggestive quantitative trait loci, on chromosomes 1, 5, 6, and 11, respectively, were identified to influence carotid lesion size. One significant quantitative trait locus on distal chromosome 1 accounted for major variations in plasma low-density lipoprotein/very-low-density lipoprotein, high-density lipoprotein cholesterol, and triglyceride levels. Carotid lesion size was not significantly correlated with plasma low-density lipoprotein/very-low-density lipoprotein or high-density lipoprotein cholesterol levels.
Conclusions
These data indicate that the loci for carotid lesions do not overlap with those for aortic lesions as identified in a previous cross derived from the same parental strains, and carotid atherosclerosis and plasma lipids are controlled by separate genetic factors in the B6 and C3H mouse model.
Keywords: carotid atherosclerosis, hyperlipidemia, quantitative trait locus, stroke
Stroke is the leading cause of disability in adults and the third most common cause of death in the United States and other Western countries.1 A large fraction of ischemic stroke cases are caused by atherosclerosis in the carotid arteries. Carotid atherosclerotic lesions may directly or indirectly, through formation of thrombi, result in narrowing of vascular lumen and block the blood flow to the brain. Genetic studies involving twins, siblings, and families have provided strong evidence for the heritability of carotid atherosclerosis, but the underlying genetic factors remain unidentified.2
Genetic studies of carotid atherosclerosis in humans are underway, but they have been difficult because of the heterogeneity of human populations and the difficulty for the control of environmental influences on the disease. The difficulties of human genetic studies strongly demand alternative approaches to be undertaken by using animal models. The mouse is the most commonly used mammal for genetic study of atherosclerosis because of the availability of sophisticated genetic and biomedical tools. However, wild-type mice do not develop atherosclerotic lesions in the carotid arteries even when they are fed an atherogenic diet containing high fat/cholesterol and cholate (the Paigen diet) for up to 1 year.3,4 Apolipoprotein E–deficient (apoE−/−) mice represent a mouse model in which spontaneous hyperlipidemia and atherosclerosis occur on a low-fat, low-cholesterol diet.5,6 Lesions in apoE−/− mice, like in humans, tend to develop at branch points of large and medial arteries and progress from the foam cell stage to the advanced stage with fibrous caps and necrotic lipid core.7 Recently, Rosenfeld et al8 reported that apoE−/− mice on a C57BL/6 (B6) background develop advanced lesions in the carotid arteries, exhibiting a highly consistent rate of lesion progression.
We and others have demonstrated that genetic backgrounds have a dramatic influence on the susceptibility of apoE−/− mice to atherosclerosis. When the apoE null allele of B6 mice was transferred onto the genetic background of strain FVB/NT, aortic atherosclerotic lesions of the mice were reduced up to 9-fold.9 On the C3H background, we found that the influence was even more dramatic.10 The dramatic differences between B6.apoE−/− and C3H.apoE−/− mice in the formation of carotid atherosclerotic lesions are ideal for conducting genetics studies of the trait. Thus, in the present study, we performed quantitative trait locus (QTL) analysis using an intercross between B6.apoE−/− and C3H.apoE−/− mice to search for loci that influence the development of carotid atherosclerosis and its associated traits.
Materials and Methods
Mice
B6.apoE−/− mice at the N10 backcross were purchased from the Jackson Laboratories (Bar Harbor, Maine), and C3H.apoE−/− mice were generated in our laboratory by initially crossing B6.apoE−/− mice with C3H/HeJ mice followed by 12 sequential generations of backcrossing with C3H/HeJ mice. Female B6.apoE−/− mice were crossed with male C3H.apoE−/− mice to generate F1 hybrids, which were subsequently intercrossed by brother–sister mating to generate 241 female F2 progeny. Female mice were studied because they develop larger atherosclerotic lesions than their male counterparts. This is opposite to the human condition in which premenopausal women are protected against atherosclerosis. At 6 weeks of age, F2 mice were started on a Western-type diet containing 42% fat and 0.15% cholesterol without sodium cholate (TD 88137; Teklad, Madison, Wis) and maintained on the diet for 12 weeks. All procedures were carried out in accordance with current National Institutes of Health guidelines and approved by the University Animal Care and Use Committee.
Plasma Lipid Analysis
The measurements of total cholesterol, high-density lipoprotein (HDL) cholesterol, and triglyceride were performed as reported previously.11
Quantitation of Carotid Atherosclerotic Lesions
The method for isolating the bifurcation of the left common carotid artery was similar to that reported by Rosenfeld et al8 and von der Thusen et al.12 Briefly, mice were euthanized by prolonged inhalation of isoflurane. The vasculature of the animals was perfusion-fixed with 10% formalin through the left ventricle of the heart for >10 minutes. Then, the left common carotid artery and its main branches were dissected from the surrounding tissues, harvested en bloc, and embedded in OCT compound (Tissue-Tek). Serial 10-μm-thick cryo-sections were collected every 3 sections and mounted on poly-d-lysine-coated slides. Thirty to 50 sections were collected for each mouse. Sections were stained with oil red O and hematoxylin and counter-stained with light green. Lesion areas were quantified using an ocular with a square-micrometer grid on a light microscope. The lesion areas of 5 sections with the largest readings were averaged for each mouse and this average was used for statistical analysis.
Genotyping
Genomic DNA was isolated from the tails of mice by using the standard phenol/chloroform extraction and ethanol precipitation method. F2 mice were genotyped initially with 143 microsatellite markers distinguishing strain B6 from strain C3H and covering all chromosomes at an average interval of 12 cM by polymerase chain reaction analysis. Eleven additional markers were then typed for the chromosomal regions that showed linkage with carotid lesion area. Parental and F1 DNA were used as controls for each marker typed.
Linkage and Statistical Analyses
Linkage analysis of lesion areas and plasma lipid levels was performed by using both Map Manager QTXb20 (http://mapmgr.roswellpark.org/) and J/qtl (www.jax.org/staff/churchill/) software as described previously.13 Lesion areas were log transformed before QTL analysis was performed. Low-density lipoprotein/very-low-density lipoprotein (LDL/VLDL), HDL cholesterol, and triglyceride levels were directly used for QTL analysis as they were normally distributed. Analysis of variance was used for determining whether the mean phenotype values of progeny with different genotypes at a specific marker were significantly different. Differences were considered statistically significant at P < 0.05.
Results
Two hundred forty-one female F2 mice derived from B6.apoE−/− and C3H.apoE−/− mice were analyzed to identify the chromosomal regions contributing to carotid atherosclerosis and related traits. As shown in Figure 1, log-transformed lesion areas were distributed in a bimodal manner with approximately 17% (41) of F2s sitting under the no lesion peak on the left and the remaining 83% (200) falling under the bell-shaped curve on the right. LDL/VLDL, HDL cholesterol, and triglyceride levels of F2 mice were approximately normally distributed.
Figure 1.
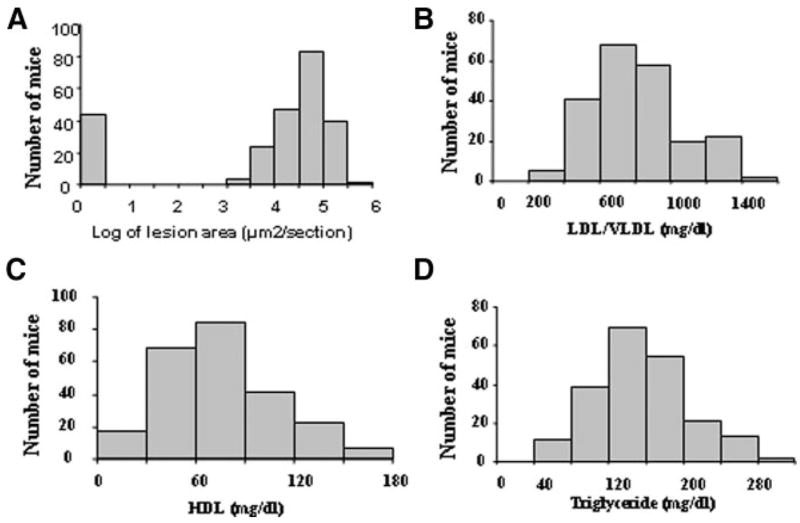
Distributions of log-transformed carotid lesion areas (A), LDL/VLDL (B), HDL cholesterol (C), and triglyceride levels (D) in 241 female F2 mice derived from B6.apoE−/− and C3H.apoE−/− mice. Mice were fed a Western diet for 12 weeks.
A genomewide scan of the F2 cross revealed one significant QTL on chromosome 12 and 4 suggestive QTLs located on chromosomes 1, 5, 6, and 11, respectively, which influenced carotid lesion areas (Figure 2). Details of the QTLs detected, including peak marker locus, log of the odds (LOD) score, SI, variance, probability value, and mode of inheritance, are presented in Table 1. Effects of B6 and C3H alleles on various traits in different QTLs are presented in Table 2. The chromosome 12 locus exhibited a peak linkage with the microsatellite marker D12Mit285 (25 cM, LOD: 4.5), which explained 8% of the variation in lesion area of the cross (Figure 3). We designated this locus as CAth1. This locus exhibited an additive inheritance pattern in that F2 mice with the heterozygous BC genotype at D12Mit285 had a lesion size intermediate between mice with the homozygous BB genotype and those with the CC genotype (Table 2).
Figure 2.
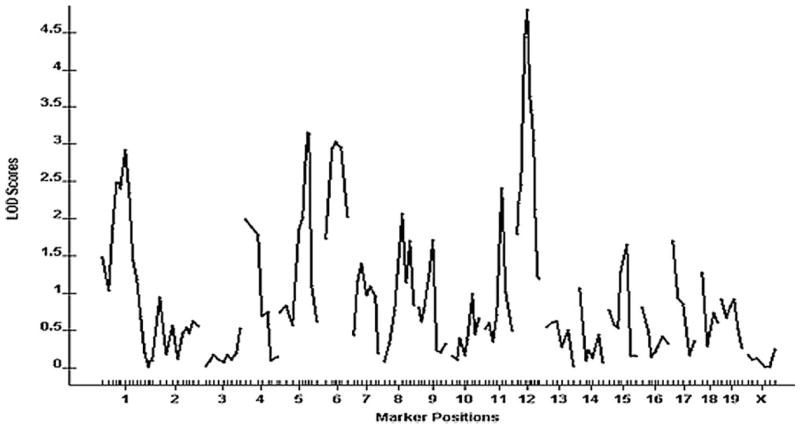
A genomewide scan to search for loci influencing carotid lesions. Chromosomes 1 through X are represented numerically on the x-axis. The relative width of the space allotted for each chromosome reflects the relative length of each chromosome. The y-axis represents the LOD score. Carotid lesion areas were determined by averaging the lesion areas of 5 cross-sections with the largest readings for each of 241 female F2 mice.
Table 1.
Significant and Suggestive QTLs for Carotid Atherosclerotic Lesions, LDL/VLDL, HDL Cholesterol, and Triglyceride Identified in an Intercross Between B6.apoE−/− and C3H. −/− Mice
| Chromosome Marker (cM) | Traits | LOD* | SI (cM)† | Variance (%)‡ | P Value | Model of Inheritance |
|---|---|---|---|---|---|---|
| D1Mit45 (58.5) | Lesion | 2.9 | 32–70 | 5 | 1.3×10⁻³ | Additive |
| D5Mit210 (64) | Lesion | 3.2 | 56–72 | 7 | 1.2×10⁻⁴ | Dominant/C3H |
| D6Mit102 (38.5) | Lesion | 3.1 | 21–60 | 6 | 6.9×10⁻⁴ | Additive |
| D11Mit36 (47.64) | Lesion | 2.4 | 37–54 | 5 | 3.4×10⁻³ | Additive |
| D12Mit285 (25) | Lesion | 4.5 | 21–28 | 8 | 6.0×10⁻⁵ | Additive |
| D1Mit270 (92.3) | LDL/VLDL | 10.1 | 79–95 | 19 | <10−5 | Dominant/C3H |
| D3Mit21 (19.2) | LDL/VLDL | 2.7 | 11–28 | 6 | 1.6×10⁻³ | Additive |
| D6Mit243 (30.4) | LDL/VLDL | 2.2 | 25–59 | 5 | 4.5×10⁻³ | Additive |
| D9Mit274 (38) | LDL/VLDL | 2.7 | 35–67 | 5 | 2.7×10⁻³ | Dominant/C3H |
| D12Mit97 (47) | LDL/VLDL | 4.6 | 38–56 | 8 | 3.0×10⁻⁵ | Additive |
| D1Mit406 (101.2) | HDL | 7.2 | 88–103 | 13 | <10−5 | Additive |
| D2Mit263 (92) | HDL | 4.3 | 87–98 | 8 | 4.0×10⁻⁵ | Dominant/B6 |
| D17Mit244 (55.7) | HDL | 3 | 45–56 | 5 | 1.2×10⁻³ | Dominant/B6 |
| D1Mit270 (92.3) | Triglyceride | 8.8 | 85–99 | 18 | <10−5 | Dominant/C3H |
| D2Mit263 (92) | Triglyceride | 2.5 | 89–103 | 6 | 2.6×10⁻³ | Dominant/C3H |
| D5Mit95 (68) | Triglyceride | 3.2 | 65–70 | 9 | 3.0×10⁻⁵ | Additive |
| D9Mit260 (38) | Triglyceride | 2.5 | 20–65 | 5 | 3.2×10⁻³ | Dominant/C3H |
LOD scores were obtained by dividing the LRS by 4.6. For lesion area: suggestive QTL LOD ≥2.2, significant LOD ≥3.6; for LDL/VLDL: suggestive QTL LOD ≥2.2, significant LOD ≥3.6; for HDL: suggestive QTL LOD ≥2.2, significant LOD ≥3.5; for triglyceride: suggestive QTL LOD ≥2.2, significant LOD ≥3.5.
Support interval (SI) was defined as a one-unit drop in LOD score on both sides of the peak marker.
Variance (%) indicates the percentage of the total trait variance, which could be explained by a QTL at this locus.
Table 2.
Effects of C3H (C) and B6 (B) Alleles in Different QTLs on Carotid Lesions and Plasma Lipid Levels in the B6.apoE−/− and C3H.apoE−/− Intercross
| Traits | Marker | BB* | BC† | CC‡ | P Value |
|---|---|---|---|---|---|
| Lesion | D1Mit45 | 70806±71304 | 56184±59943 | 33538±40300 | 2.1×10⁻³ |
| D5Mit210 | 38895±55573 | 59679±62504 | 56884±56415 | 9.3×10⁻² | |
| D6Mit102 | 70106±71556 | 53846±55193 | 29524±42929 | 8.9×10⁻⁴ | |
| D11Mit36 | 70233±67856 | 54724±58816 | 30107±41469 | 1.1×10⁻³ | |
| D12Mit285 | 84347±76076 | 51338±53111 | 26563±33529 | 1.8×10⁻⁷ | |
| LDL/VLDL | D1Mit270 | 645±153 | 859±306 | 934±306 | 1.2×10⁻¹⁰ |
| D3Mit21 | 895±270 | 818±268 | 722±191 | 1.8×10⁻³ | |
| D6Mit243 | 875±276 | 810±240 | 713±234 | 4.1×10⁻³ | |
| D9Mit274 | 709±200 | 838±266 | 860±270 | 2.6×10⁻³ | |
| D12Mit97 | 924±276 | 818±246 | 709±220 | 3.9×10⁻⁵ | |
| HDL | D1Mit406 | 59±28 | 78±34 | 99±47 | 7.1×10⁻⁸ |
| D2Mit263 | 65±33 | 65±26 | 87±42 | 4.8×10⁻⁵ | |
| D17Mit244 | 75±38 | 69±34 | 92±42 | 1.3×10⁻³ | |
| Triglyceride | D1Mit270 | 120±37 | 168±45 | 175±50 | 2.0×10⁻⁹ |
| D2Mit263 | 134±43 | 163±50 | 160±46 | 2.8×10⁻³ | |
| D5Mit95 | 141±48 | 148±42 | 172±48 | 1.6×10⁻⁴ | |
| D9Mit260 | 132±31 | 163±48 | 166±55 | 3.4×10⁻³ |
Measurements are given as means ± SD. The units for these measurements are: lesion (μm2 per section), LDL/VLDL, HDL cholesterol, and triglyceride (mg/dL).
BB, homozygous for C57BL/6 alleles,
CC, homozygous for C3H alleles, and
BC, heterozygous for C57BL/6 and C3H alleles at the linked markers.
Figure 3.
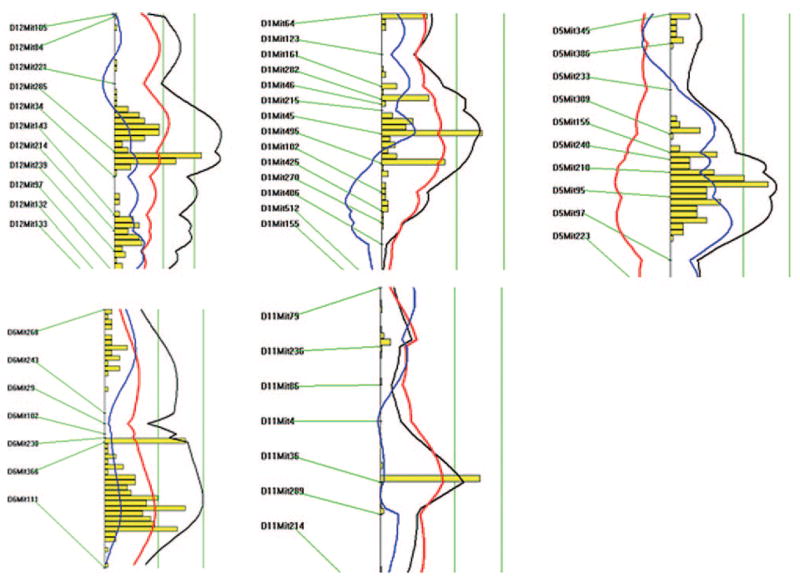
Likelihood plots for carotid lesion QTLs on chromosomes 12, 1, 5, 6, and 11. Plots were created using the interval mapping function of Map Manager QTX, including a bootstrap test shown as a histogram to estimate the confidence interval a QTL. Two straight vertical lines on the plot represent significance thresholds for suggestive and significant QTLs from left to right, respectively. Black plots reflect the likelihood ratio statistic calculated at 1-cM intervals. The red plot represents the additive effect, whereas the blue plot represents the dominant effect.
The chromosome 1 locus had a suggestive LOD score of 2.9 and displayed a peak linkage with the marker D1Mit45 (58.5 cM) (Figure 3; Table 1). This locus explained 5% of the variation in lesion area of the cross and exhibited an additive effect on the trait. The chromosome 5 locus near marker D5Mit210 (64 cM) had a suggestive LOD score of 3.2 and explained 7% of the variation in lesion area. The C3H allele was associated with a paradoxical increase in lesion area. The locus on chromosome 6 near marker D6Mit102 (38.5 cM) had a suggestive LOD score of 3.1 and accounted for 6% of the variation in lesion area. The locus at marker D11Mit36 on chromosome 11 had a suggestive LOD score of 2.4 and explained 5% of the variation in lesion area. The last 2 QTLs displayed an additive inheritance pattern with the B6 allele associated with an increase in lesion area.
As shown in Figure 4 and Table 1, plasma LDL/VLDL, HDL cholesterol, and triglyceride levels were each controlled by multiple QTLs. However, one QTL on chromosome 1 was associated with major variations in plasma levels of LDL/VLDL, HDL cholesterol, and triglyceride of the cross. LOD score plots for chromosome 1 revealed the colocalization of QTL peaks for these traits in the distal region (Figure 5), suggesting a possibility that these traits were controlled by the same gene within the region. This QTL had LOD scores of 10.1 for LDL/VLDL, of 7.2 for HDL cholesterol, and of 8.8 for triglyceride and explained 13% to 19% of the variations in the traits.
Figure 4.

Genomewide scans for loci affecting plasma levels of LDL/VLDL, HDL cholesterol, and triglyceride in F2 mice. Chromosomes 1 through X are represented numerically on the x-axis and the y-axis represents the LOD score.
Figure 5.
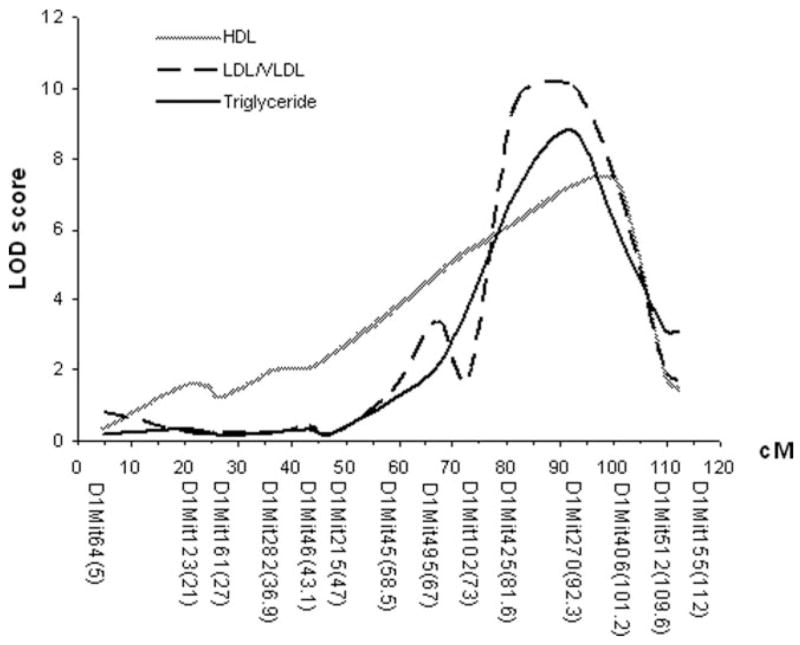
LOD score plots for LDL/VLDL, HDL cholesterol, and triglyceride levels on chromosome 1. The x-axis depicts the marker positions in centimorgans, and the y-axis depicts the LOD score. The micro-satellite markers typed are listed below the x-axis corresponding to their map locations on the chromosome.
QTLs on other chromosomes also contributed to the variations in plasma lipid levels. For LDL/VLDL, the locus near D3Mit21 (19.2 cM, LOD: 2.7) corresponded to Hdlq19, previously identified in a B6×DBA/2 cross.14 The locus at D6Mit243 (30.4 cM, LOD: 2.2) corresponded to Pnhdlc1, a QTL mapped in a B6×CASA intercross.15 The QTLs near D9Mit274 (38 cM, LOD: 2.7) and D12Mit97 (47 cM, LOD: 4.6) overlapped with 2 loci near D9Mit26 (28 cM) and D12Mit5 (37 cM), respectively, previously mapped in a NZB×SM F2 cross.16 These 2 QTLs were named Nhdlq11 and Nhdlq12, respectively, because they have not been named.
For HDL, the QTL near D2Mit263 (92 cM, LOD: 4.3) corresponded to Hdlq19, which was mapped in a B6×129 intercross.17 The QTL near D17Mit244 (55.7 cM, LOD: 3.0) overlapped with Hdl4, mapped in a CAST/Ei×B6 cross,18 and Hdlq39, mapped in PERA/EiJ×I/LnJ and PERA/EiJ×DBA/2J intercrosses.19 For triglyceride, the locus at D5Mit95 (68 cM, LOD: 3.2) overlapped with a QTL at D5Mit65 (68 cM) mapped using a NZB×SM F2 cross.16 The QTL at D9Mit260 (38 cM, LOD: 2.5) overlapped with Trigq1 mapped in a KK×RR F2 mice.20 The QTL at D2Mit263 is novel.
The relationships between carotid atherosclerotic lesions and plasma lipid levels were analyzed using the F2 population. No significant correlations were observed between carotid lesion areas and LDL/VLDL cholesterol levels (R=0.042, P=0.54) nor between carotid lesion areas and HDL cholesterol levels (R = −0.123 and P = 0.06; Figure 6).
Figure 6.
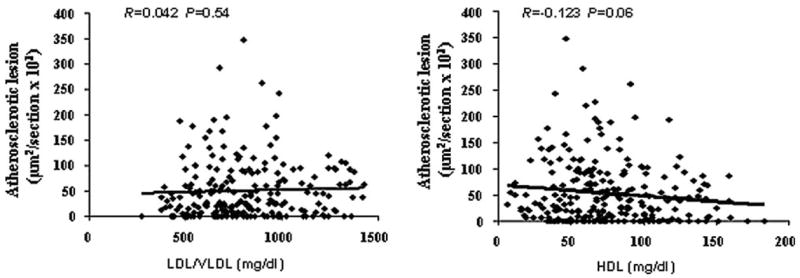
Scatterplots showing relationships between carotid lesion sizes and plasma lipid levels in the F2 cross. Each point represents an individual value of a F2 mouse. The correlation coefficient (R) and significance (P) are shown. Plasma levels of LDL/VLDL or HDL cholesterol were not correlated with the sizes of atherosclerotic lesions in the cross.
Discussion
In the present study, we used the apoE−/− mouse model to search for QTLs that contribute to the differences between B6 and C3H mice in carotid atherosclerosis and plasma lipid levels. We identified one significant QTL on chromosome 12 and 4 suggestive QTLs on chromosomes 1, 5, 6, and 11, respectively, for carotid atherosclerosis, and replicated 12 QTLs for plasma lipids, including one QTL on distal chromosome 1 contributing to the major variations in plasma lipid levels of the mice.
The mouse is the most commonly used animal model for genetic study of atherosclerosis. Because the aortic root is easy to study, previous genetic studies of atherosclerosis are entirely based on the aortic root, a site of less clinical significance in humans. The findings from the aortic root may not reflect the situation elsewhere in the vascular tree. It has been shown that the aortic root responds differently to probucol as compared with more distal regions of the aorta,21 and the aortic root and the innominate artery respond differently to immune deficiency in terms of atherosclerotic lesion formation.22 Because of the close association with the brain and the ready accessibility, the carotid arteries are the most extensively studied vessels in humans with ultrasonography. Several prospective studies with ultrasound demonstrate that carotid artery stenosis is an important risk factor for stroke. In patients with noticeable carotid stenosis, there are severely impaired cerebral blood flow and markedly increased risk for ipsilateral stroke.23,24 In patients with no obvious carotid stenosis, perspective studies also show a close association between the intima media thickening and the risk for stroke.24–28 Intima media thickening of the carotid arteries is considered an early marker of atherosclerosis.29,30
The carotid arteries have been shown to develop athero-sclerotic lesions in apoE−/− mice by 27 weeks of age, even if these mice are maintained on a chow diet,22 and lesion formation could be shortened if the mice are fed a Western-type diet. Using a F2 cross between B6.apoE−/− and C3H.apoE−/− mice, in this study, we identified one significant QTL and 4 suggestive QTLs affecting carotid lesion formation. We have designated the chromosome 12 locus as CAth1 to represent the first QTL that affects carotid lesion formation in the mouse. The chromosome 11 locus (37 to 54 cM) for carotid atherosclerosis was different from the locus for aortic atherosclerosis (11 to 33 cM) because the 2 QTLs did not overlap in the support interval.13 The QTL mapped to chromosome 6 corresponded to the position of Artles (46 to 71 cM) previously mapped in a CAST×B6 intercross31 and of Athsq2 (52 to 70 cM) mapped in a (B6.Ldlr−/− × MOLF) × B6.Ldlr−/− N2 cross.32 The QTLs mapped to chromosomes 1 and 5 did not overlap with any previously mapped QTLs for aortic atherosclerosis.
The QTLs for carotid atherosclerosis are different from those for aortic atherosclerosis previously identified using a separate cross between B6.apoE−/− and C3H.apoE−/− strains.13 In the previous cross, which was done under identical conditions, aortic lesion area was affected by a significant QTL near D9Mit360 (35 cM) with a LOD score of 3.7 and a suggestive QTL near D11Mit236 (20 cM) with a LOD score of 2.4.13 In contrast, carotid lesion area was affected by one significant QTL near D12Mit285 and 4 suggestive QTLs near D1Mit45, D5Mit210, D6Mit102, and D11Mit36. The distribution pattern of lesion size in the F2s and the difference between the 2 parental strains in susceptibility to aortic atherosclerosis versus carotid atherosclerosis also suggest that carotid atherosclerosis and aortic atherosclerosis are controlled by separate genetic factors in the apoE−/− mice. The carotid lesion area of F2 mice exhibited a bimodal distribution with 41 animals having no lesion, which is in contrast to the bell-shaped normal distribution of aortic lesion area in the previous cross.13 C3H.apoE−/− mice were completely absent of carotid lesions after being fed a Western diet for 12 weeks (data not shown), but these mice develop aortic lesions under the same condition.10 The bimodal distribution of carotid lesions suggests a genetic control of carotid atherosclerosis by a recessive-resistant gene from C3H.
In the present study, we found that a QTL in distal chromosome 1 was responsible for the major variations in plasma LDL/VLDL, HDL cholesterol, and triglyceride levels of the cross. This finding is consistent with our observation in the previous F2 cross between B6.apoE−/− and C3H.apoE−/− mice.13 Elevation in plasma LDL/VLDL levels or reduction in HDL levels have been considered to be major risk factors for atherosclerotic vascular disease. However, the present study of F2 mice has demonstrated that carotid atherosclerosis susceptibility was independent of plasma lipids because the size of carotid lesions was not correlated with LDL/VLDL or HDL cholesterol levels. The studies of atherosclerotic lesions at the aortic root in several genetic crosses also demonstrated no significant associations between atherosclerosis susceptibility and plasma lipoprotein levels.13,32,33 Previously, we have found that cultured B6 aortic endothelial cells are highly responsive to oxidized LDL, exhibiting induction of chemokines and adhesion molecules, whereas C3H endothelial cells are relatively unresponsive.34 Recently, direct evidence supporting the arterial wall involvement in control of atherosclerosis susceptibility has been found when B6.apoE−/− and C3H.apoE−/− aortic segments were transplanted into F1 mice, and the donor aortic segments of B6 mice developed significantly larger lesions than those of C3H mice.35 Blood pressure of the 2 strains was normal and comparable when fed chow or a high-fat diet; thus, it could not explain their difference in carotid lesion formation.
The mouse has been a powerful force in elucidating the genetic basis of human physiology and pathophysiology.36 Finding QTL genes in mice is much more cost-effective, less time-consuming, and less fraught with ethical issues than finding them in humans because many new genetic, genomic, and bioinformatics tools for the mouse are available. After a QTL gene is identified in the mouse, it can be tested in human association studies for its role in human diseases. Among the human atherosclerosis QTLs reported, 63% are located in regions homologous to mouse QTLs,37 although further studies are needed to determine whether mouse and human atherosclerosis QTLs have the same underlying genes.
In summary, this study has identified several new QTLs for carotid atherosclerosis, which do not overlap with loci for aortic atherosclerosis as identified from a separate F2 cross derived from the same parental strains. The demonstration that the variation in carotid atherosclerosis between mouse strains B6 and C3H is not due to genetic differences in plasma lipid levels provides an explanation for the clinical observation that a large fraction of patients develop ischemic strokes despite normolipidemia.38
Acknowledgments
We thank Jessica Rowlan for critically reviewing the manuscript.
Sources of Funding
This study was supported by the National Institutes of Health grant HL75433 and by the NHLBI Mammalian Genotyping Service (contract HV48141) for the genotyping.
Footnotes
Disclosures
None.
References
- 1.Bonita R. Epidemiology of stroke. Lancet. 1992;339:342–344. doi: 10.1016/0140-6736(92)91658-u. [DOI] [PubMed] [Google Scholar]
- 2.Humphries SE, Morgan L. Genetic risk factors for stroke and carotid atherosclerosis: insights into pathophysiology from candidate gene approaches. Lancet Neurol. 2004;3:227–236. doi: 10.1016/S1474-4422(04)00708-2. [DOI] [PubMed] [Google Scholar]
- 3.Paigen B, Morrow A, Brandon C, Mitchell D, Holmes P. Variation in susceptibility to atherosclerosis among inbred strains of mice. Atherosclerosis. 1985;57:65–73. doi: 10.1016/0021-9150(85)90138-8. [DOI] [PubMed] [Google Scholar]
- 4.Qiao JH, Xie PZ, Fishbein MC, Kreuzer J, Drake TA. Pathology of atheromatous lesions in inbred and genetically engineered mice. Genetic determination of arterial calcification. Arterioscler Thromb. 1994;14:1480–1497. doi: 10.1161/01.atv.14.9.1480. [DOI] [PubMed] [Google Scholar]
- 5.Plump AS, Smith JD, Hayek Y, Aalto-Setala K, Walsh A, Verstuyft JG, Rubin EM, Vreslow JL. Severe hyper-cholesterolemia and atherosclerosis in apolipoprotein E-deficient mice created by homologous recombination in ES cells. Cell. 1992;71:343–353. doi: 10.1016/0092-8674(92)90362-g. [DOI] [PubMed] [Google Scholar]
- 6.Zhang SH, Reddick RL, Piedrahita JA, Maeda N. Spontaneous hyper-cholesterolemia and arterial lesions in mice lacking apolipoprotein E. Science. 1992;258:468–471. doi: 10.1126/science.1411543. [DOI] [PubMed] [Google Scholar]
- 7.Nakashima Y, Plupm AS, Raines EW, Breslow JL, Ross R. ApoE-deficient mice develop lesions of all phases of atherosclerosis throughout the arterial tree. Arterioscler Thromb. 1994;14:133–140. doi: 10.1161/01.atv.14.1.133. [DOI] [PubMed] [Google Scholar]
- 8.Rosenfeld ME, Polinsky P, Virmani R, Kauser K, Rubanyi G, Schwartz SM. Advanced atherosclerotic lesions in the innominate artery of the apoE knockout mouse. Arterioscler Thromb Vasc Biol. 2000;20:2587–2592. doi: 10.1161/01.atv.20.12.2587. [DOI] [PubMed] [Google Scholar]
- 9.Dansky HM, Charlton SA, Sikes JL, Heath SC, Simantov R, Levin LF, Shu P, Moore KJ, Breslow JL, Smith JD. Genetic background determines the extent of atherosclerosis in ApoE-deficient mice. Arterioscler Thromb Vasc Biol. 1999;19:1960–1968. doi: 10.1161/01.atv.19.8.1960. [DOI] [PubMed] [Google Scholar]
- 10.Shi W, Wang NJ, Shih DM, Sun VZ, Wang X, Lusis AJ. Determinants of atherosclerosis susceptibility in the C3H and C57BL/6 mouse model: evidence for involvement of endothelial cells but not blood cells or cholesterol metabolism. Circ Res. 2000;86:1078–1084. doi: 10.1161/01.res.86.10.1078. [DOI] [PubMed] [Google Scholar]
- 11.Tian J, Pei H, James JC, Li Y, Matsumoto AH, Helm GA, Shi W. Circulating adhesion molecules in apoE-deficient mouse strains with different atherosclerosis susceptibility. Biochem Biophys Res Commun. 2005;329:1102–1107. doi: 10.1016/j.bbrc.2005.02.090. [DOI] [PubMed] [Google Scholar]
- 12.von der Thusen JH, van Berkel TJ, Biessen EA. Induction of rapid atherogenesis by perivascular carotid collar placement in apolipoprotein E-deficient and low-density lipoprotein receptor-deficient mice. Circulation. 2001;103:1164 –1170. doi: 10.1161/01.cir.103.8.1164. [DOI] [PubMed] [Google Scholar]
- 13.Su Z, Li Y, James JC, McDuffie M, Matsumoto AH, Helm GA, Weber JL, Lusis AJ, Shi W. Quantitative trait locus analysis of atherosclerosis in an intercross between C57BL/6 and C3H mice carrying the mutant apolipoprotein E gene. Genetics. 2006;172:1799–1807. doi: 10.1534/genetics.105.051912. [DOI] [PMC free article] [PubMed] [Google Scholar]
- 14.Colinayo VV, Qiao JH, Wang X, Krass KL, Schadt E, Lusis AJ, Drake TA. Genetic loci for diet-induced atherosclerosis lesions and plasma lipids in mice. Mamm Genome. 2003;14:464–471. doi: 10.1007/s00335-002-2187-2. [DOI] [PubMed] [Google Scholar]
- 15.Sehayek E, Duncan EM, Yu HJ, Petukhova L, Breslow JL. Loci controlling plasma non-HDL and HDL cholesterol levels in a C57BL/6J×CASA/Rk intercross. J Lipid Res. 2003;44:1744–1750. doi: 10.1194/jlr.M300139-JLR200. [DOI] [PubMed] [Google Scholar]
- 16.Purcell-Huynh DA, Weinreb A, Castellani LW, Mehrabian M, Doolittle MH, Lusis AJ. Genetic factors in lipoprotein metabolism. Analysis of a genetic cross between inbred mouse strains NZB/BINJ and SM/J using a complete linkage map approach. J Clin Invest. 1995;96:1845–1858. doi: 10.1172/JCI118230. [DOI] [PMC free article] [PubMed] [Google Scholar]
- 17.Ishimori N, Li R, Kelmenson PM, Korstanje R, Walsh KA, Churchill GA, Forsman-Semb K, Paigen B. Quantitative trait loci analysis for plasma HDL-cholesterol concentrations and atherosclerosis susceptibility between inbred mouse strains C57BL/6J and 129S1/SvImJ. Arterioscler Thromb Vasc Biol. 2004;24:161–166. doi: 10.1161/01.ATV.0000104027.52895.D7. [DOI] [PubMed] [Google Scholar]
- 18.Mehrabian M, Castellani LW, Wen P, Wong J, Rithaporn T, Hama SY, Hough GP, Johnson D, Albers JJ, Mottino GA, Frank JS, Navab M, Fogelman AM, Lusis AJ. Genetic control of HDL levels and composition in an interspecific mouse cross (CAST/Ei×C57BL/6J) J Lipid Res. 2000;41:1936–1946. [PubMed] [Google Scholar]
- 19.Wittenburg H, Lyons MA, Li R, Kurtz U, Wang X, Mossner J, Churchill GA, Carey MC, Paigen B. QTL mapping for genetic determinants of lipoprotein cholesterol levels in combined crosses of inbred mouse strains. J Lipid Res. 2006;47:1780–1790. doi: 10.1194/jlr.M500544-JLR200. [DOI] [PubMed] [Google Scholar]
- 20.Suto J, Sekikawa K. Quantitative trait locus analysis of plasma cholesterol and triglyceride levels in KK×RR F2 mice. Biochem Genet. 2003;41:325–341. doi: 10.1023/b:bigi.0000006033.99978.8b. [DOI] [PubMed] [Google Scholar]
- 21.Witting PK, Pettersson K, Letters J, Stocker R. Site-specific anti-atherogenic effect of probucol in apolipoprotein E deficient mice. Arterioscler Thromb Vasc Biol. 2000;20:e26 – e33. doi: 10.1161/01.atv.20.8.e26. [DOI] [PubMed] [Google Scholar]
- 22.Reardon CA, Blachowicz L, White T, Cabana V, Wang Y, Lukens J, Bluestone J, Getz GS. Effect of immune deficiency on lipoproteins and atherosclerosis in male apolipoprotein E-deficient mice. Arterioscler Thromb Vasc Biol. 2001;21:1011–1016. doi: 10.1161/01.atv.21.6.1011. [DOI] [PubMed] [Google Scholar]
- 23.Markus H, Cullinane M. Severely impaired cerebrovascular reactivity predicts stroke and TIA risk in patients with carotid artery stenosis and occlusion. Brain. 2001;124:457–467. doi: 10.1093/brain/124.3.457. [DOI] [PubMed] [Google Scholar]
- 24.Matteis M, Vernieri F, Caltagirone C, Troisi E, Rossini PM, Silvestrini M. Patterns of cerebrovascular reactivity in patients with carotid artery occlusion and severe contralateral stenosis. J Neurol Sci. 1999;168:47–51. doi: 10.1016/s0022-510x(99)00175-6. [DOI] [PubMed] [Google Scholar]
- 25.Bots ML, Hofman A, Grobbee DE. Increased common carotid intima-media thickness. Adaptive response or a reflection of atherosclerosis? Findings from the Rotterdam Study. Stroke. 1997;28:2442–2447. doi: 10.1161/01.str.28.12.2442. [DOI] [PubMed] [Google Scholar]
- 26.Mathiesen EB, Bonaa KH, Joakimsen O. Echolucent plaques are associated with high risk of ischemic cerebrovascular events in carotid stenosis: the Tromsø study. Circulation. 2001;103:2171–2175. doi: 10.1161/01.cir.103.17.2171. [DOI] [PubMed] [Google Scholar]
- 27.O’Leary DH, Polak JF, Kronmal RA, Manolio TA, Burke GL, Wolfson SK., Jr Carotidartery intima and media thickness as a risk factor for myocardial infarction and stroke in older adults. N Engl J Med. 1999;340:14–22. doi: 10.1056/NEJM199901073400103. [DOI] [PubMed] [Google Scholar]
- 28.Touboul PJ, Elbaz A, Koller C, Lucas C, Adrai V, Chedru F, Amarenco P. Common carotid artery intima-media thickness and brain infarction: the Etude du Profil Genetique de l’Infarctus Cerebral (GENIC) case–control study. The GENIC Investigators. Circulation. 2000;102:313–318. doi: 10.1161/01.cir.102.3.313. [DOI] [PubMed] [Google Scholar]
- 29.Grobbee DE, Bots ML. Carotid intima-media thickness as an indicator of generalized atherosclerosis. J Intern Med. 1994;236:567–573. doi: 10.1111/j.1365-2796.1994.tb00847.x. [DOI] [PubMed] [Google Scholar]
- 30.Kiechl S, Willeit J, Bonora E, Schwarz S, Xu Q. No association between dehydroepiandrosterone sulfate and development of atherosclerosis in a prospective population study (Bruneck Study) Arterioscler Thromb Vasc Biol. 2000;20:1094–1100. doi: 10.1161/01.atv.20.4.1094. [DOI] [PubMed] [Google Scholar]
- 31.Mehrabian M, Wong J, Wang X, Jiang Z, Shi W, Folglman AM, Lusis AJ. Genetic locus in mice that blocks development of atherosclerosis despite extreme hyperlipidemia. Circ Res. 2001;89:125–130. doi: 10.1161/hh1401.093458. [DOI] [PubMed] [Google Scholar]
- 32.Welch CL, Bretschger S, Latib N, Bezouevski M, Guo Y, Pleskac N, Liang CP, Barlow C, Dansky H, Breslow JL, Tall AR. Localization of atherosclerosis susceptibility loci to chromosomes 4 and 6 using the Ldlr knockout mouse model. Proc Natl Acad Sci U S A. 2001;98:7946–7951. doi: 10.1073/pnas.141239098. [DOI] [PMC free article] [PubMed] [Google Scholar]
- 33.Dansky HM, Shu P, Donavan M, Montagno J, Nagle DL, Smutko JS, Roy N, Whiteing S, Barrios J, McBride TJ, Smith JD, Duyk G, Breslow JL, Moore KJ. A phenotype-sensitizing APOE-deficient genetic background reveals novel atherosclerosis predisposition loci in the mouse. Genetics. 2002;160:1599–1608. doi: 10.1093/genetics/160.4.1599. [DOI] [PMC free article] [PubMed] [Google Scholar]
- 34.Shi W, Haberland ME, Jien ML, Shih DM, Lusis AJ. Endothelial responses to oxidized lipoproteins determine genetic susceptibility to atherosclerosis in mice. Circulation. 2000;102:75–81. doi: 10.1161/01.cir.102.1.75. [DOI] [PubMed] [Google Scholar]
- 35.Pei H, Wang Y, Miyoshi T, Zhang Z, Matsumoto AH, Helm GA, Tellides G, Shi W. Direct evidence for a crucial role of the arterial wall in control of atherosclerosis susceptibility. Circulation. 2006;114:2382–2389. doi: 10.1161/CIRCULATIONAHA.106.640185. [DOI] [PubMed] [Google Scholar]
- 36.Peters LL, Robledo RF, Bult CJ, Churchill GA, Paigen BJ, Svenson KL. The mouse as a model for human biology: a resource guide for complex trait analysis. Nat Rev Genet. 2007;8:58–69. doi: 10.1038/nrg2025. [DOI] [PubMed] [Google Scholar]
- 37.Wang X, Ishimori N, Korstanje R, Rollins J, Paigen B. Identifying novel genes for atherosclerosis through mouse–human comparative genetics. Am J Hum Genet. 2005;77:1–15. doi: 10.1086/431656. [DOI] [PMC free article] [PubMed] [Google Scholar]
- 38.Vivancos-Mora J, Gil-Nunez AC. Lipids and stroke: the opportunity of lipid-lowering treatment. Cerebrovasc Dis. 2005;20(suppl 2):53–67. doi: 10.1159/000089357. [DOI] [PubMed] [Google Scholar]