

Abstract
Aggregation of partially folded intermediates populated during protein folding processes has been described for many proteins. Likewise, partially unfolded chains, generated by perturbation of numerous proteins by heat or chemical denaturants, have also been shown to aggregate readily. However, the process of protein aggregation from native-state conditions is less well understood. Granulocyte-colony stimulating factor (G-CSF), a member of the four-helix bundle class of cytokines, is a therapeutically relevant protein involved in stimulating the growth and maturation of phagocytotic white blood cells. Under native-like conditions (37°C [pH 7.0]), G-CSF shows a significant propensity to aggregate. Our data suggest that under these conditions, native G-CSF exists in equilibrium with an altered conformation, which is highly aggregation prone. This species is enriched in 1–2 M GdmCl, as determined by tryptophan fluorescence and increased aggregation kinetics. In particular, specific changes in Trp58 fluorescence report a local rearrangement in the large loop region between helices A and B. However, circular dichroism, reactivity toward cyanylation, and ANS binding demonstrate that this conformational change is subtle, having no substantial disruption of secondary and tertiary structure, reactivity of the free sulfhydryl at Cys17 or exposure of buried hydrophobic regions. There is no indication that this altered conformation is important to biological activity, making it an attractive target for rational protein stabilization.
Keywords: GCSF, protein aggregation, protein folding intermediate, cysteine labeling
The process of protein aggregation presents a major problem in biotechnology (Mitraki and King 1989; De Bernardez Clark 2001) and has been implicated as being the causative action of several diseases (Baum and Brodsky 1999; Dobson 1999). Over the last ten years, great strides have been made toward understanding the nature of such aberrant protein association reactions. For many proteins, the mechanism of aggregation involves the self-association of an intermediate (or intermediates) along the folding pathway (Havel et al. 1986; Brems and Havel 1989; Fink 1998; Finke et al. 2000) or misfolded states (Chuang 1998; Canet et al. 1999). Aggregation can also be induced by substantial perturbation of the native state by heat or other denaturing conditions. In each of these cases, the surface of the aggregating species has exposed regions of the protein, which are buried in the properly folded native state. These exposed regions can be nonspecific hydrophobic patches or highly structured regions, capable of making very specific intermolecular contacts (Tandon and Horowitz 1986; Brems et al. 1987; Blake and Serpell 1996; Speed et al. 1996; Carrell and Lomas 1997). Exposure of either type of buried element will often render a protein molecule “sticky,” or prone to aggregation. Mutations in the amino acid sequence of a protein can have a major influence in these processes (Brems et al. 1988; Mitraki et al. 1991; Betts et al. 1997), thus explaining the hereditary nature of many “protein folding” diseases.
Some proteins have been shown to aggregate under mild solution conditions, where they appear to be in a properly folded native state. The mechanistic details that underlie protein aggregation in native-like conditions remain poorly understood. For many years, it was simply assumed that the protein concentration had surpassed its solubility limit. In light of what we now know about protein aggregation, it is likely that there are more subtle conformational aspects at work (Kendrick et al. 1998a,b; Krishnan et al. 2002). Although the rates of such processes are usually less dramatic, this type of aggregation has been implicated in some late-onset human pathologies wherein deposits of aggregated protein amass in the tissues of the body (Glenner et al. 1984; Polymeropoulos et al. 1997; Dobson 1999). Slow aggregation of proteins, in native conditions, can also be severe enough to affect the formulation stability or delivery of protein therapeutics (Tracy 1998; Carpenter et al. 1999).
Hematopoietins represent a class of proteins that signal progenitor stem cells in the bone marrow to regulate the growth and differentiation of various blood cell lines (Metcalf and Nicola 1983). Granulocyte-colony stimulating factor (G-SCF) is the hematopoietin, which specifically induces the maturation of neutrophils from precursor cells, and further proliferates neutrophil colonies (Metcalf and Nicola 1983). A recombinant form of the human protein is widely used to treat the condition of neutropenia (low white blood cell count), most commonly associated with chemotherapy, bone marrow transplants, or treatment of acute myeloid leukemia (http://www.neupogen.com).
Structurally, G-CSF belongs to a larger group of growth factors, which share a common four-helix-bundle architecture but often show very little sequence similarity (Hill et al. 1993). Recombinant G-CSF is 18.8 kDa, lacks glycosylation, and comprises 175 amino acids, including the N-terminal Met (residue number − 1) (Lu et al. 1988). The protein also contains two native disulfide bonds at positions 36–42 and 64–74, one free cysteine thiol at position 17, and two tryptophan residues at positions 58 and 118 (Lu et al. 1988). The crystal structure of recombinant human G-CSF has been solved to 3 A¢ª resolution (Hill et al. 1993) and is shown in Figure 1 ▶.
Figure 1.

Crystal structure of recombinant human G-CSF. Shown are ribbon diagrams of G-CSF. The diagram on the left provides a view orthogonal to the long axis of the protein. On the right, the diagram is rotated 90° to give a view down the axis of the 4-helix bundle. The two native disulfides (36–42 and 64–74) and tryptophans 58 and 118 are shown as stick representations. Cysteine 17, the only free thiol in the protein, is shown as a space-filling model. The disulfide bond 64–74 was removed from the image on the right for clarity.
The therapeutic agent Neupogen (Amgen, Inc.), is a liquid formulation containing recombinant human GCSF at pH 4.0; under these conditions the protein is stable for over 2 y at 2°–8°C (Herman et al. 1996). Above pH 5.0, however, recombinant G-CSF was found to aggregate at elevated temperatures (Herman et al. 1996; Krishnan et al. 2002; Chi et al. 2003). Spectroscopic analysis suggested that the protein may exist in very distinct conformational states between pH 5.0 and 7.0 (Narhi et al. 1991; Kolvenbach et al. 1997). Previous studies (Krishnan et al. 2002; Chi et al. 2003) have reported on the aggregation of GCSF under physiological conditions and that the aggregation prone species is a monomer with a structure that is only slightly perturbed compared to the native state. In this report we explore further this phenomenon and the properties of this aggregation-prone species.
Results
G-CSF aggregation
When incubated at 37°C in pH 7.0 buffer G-CSF aggregated slowly, but extensively, in a protein concentration-dependent manner (Fig. 2 ▶). This aggregation occurred under conditions that do not differ greatly from physiological, in the absence of chemical denaturants. The rate of aggregation was substantially decreased at protein concentrations lower than 1 mg/mL (not shown). The aggregation was inhibited at lower temperatures (2°– 10°C) and did not occur <pH 5.0 (Herman et al. 1996).
Figure 2.

Concentration dependence of G-CSF aggregation kinetics in vitro. The loss of soluble G-CSF at 1 mg/mL (▪), 5 mg/mL (○), and 20 mg/mL (•) was measured as a function of time incubated in 0.1 M MOPS (pH 7.0) at 37°C. Lines through the data points do not represent a curve fit but are present to guide the eye.
Equilibrium denaturation
At 0.05 mg/mL, G-CSF unfolded reversibly in 0.1 M MOPS (pH 7.0), 25°C. The unfolding transition appeared to be two-state when monitored using CD at 222 nm (Fig. 3 ▶). A best fit to Equation 1 yielded a free energy of unfolding of 9.6 kcal/mol with an m value of −3.9 kcal/mol/M. When intrinsic fluorescence of the protein was used to monitor conformation, a hyperfluorescent state was detected between 1 and 2 M GdmCl (Fig. 3 ▶). Hyperfluorescence was not induced by titrating with NaCl alone, suggesting that the hyperfluorescence was due to a protein conformational change rather than an effect of chloride ion binding (not shown). The major unfolding transition showed a midpoint at about 2.4 M GdmCl, regardless of the spectroscopic detection method. It is important to note that G-CSF has two native disulfide bonds, which remain intact throughout the denaturation experiments.
Figure 3.

A hyperfluorescent state of G-CSF is populated during equilibrium denaturation. The GdmCl-induced unfolding of G-CSF was monitored using tryptophan fluorescence, integrated intensity from 300–400 nm (□) and CD at 222 nm (•). The solid line through the CD data represents a curve fit to a two-state folding model. Denaturation was carried out in 0.1 M MOPS (pH 7.0) at 25°C. The protein concentration was 0.05 mg/mL. The data points represent the results from duplicate samples, and error bars showing the standard deviation were smaller than the data point symbols.
Biophysical characterization of the hyperfluorescent state
The fluorescence emission spectrum of native G-CSF has a wavelength of maximum fluorescence (λmax) of 344 nm, suggesting a high degree of solvent accessibility (Fig. 4A ▶), in good agreement with the previously published crystal structure (Hill et al. 1993). In 1.5 M GdmCl, G-CSF showed an increased fluorescence intensity, and showed only a modest red shift (1–2 nm) in λmax (Fig. 4A ▶). Figure 4A ▶ also showed that in 5.0 M GdmCl the fluorescence was quenched and λmax occurred at 350 nm, diagnostic of completely solvent-exposed tryptophans. This observation was consistent with the data presented in Figure 3 ▶, which suggested that G-CSF is fully denatured in 5.0 M GdmCl.
Figure 4.

Biophysical characterization of the hyperfluorescent state of G-CSF. (A) The fluorescence emission spectra of G-CSF in 0 M(solid line), 1.5M(dotted), and 5M(dashed) GdmCl. The excitation wavelength was 280 nm and the protein concentration was 0.05 mg/mL. (B) The far-UV CD spectra of G-CSF in 0M(□) and 1.5M(•) GdmCl. A protein concentration of 0.5 mg/mL was used. (C) Size-exclusion chromatography shows that G-CSF remains monomeric under native conditions (top) and in 1.5 M GdmCl (bottom). The arrow indicates where a dimer would be expected to elute, based on column calibration standards. (D) ANS binding to G-CSF in 0, 1, 2, and 5 M GdmCl. The difference spectra of 25 mM ANS in the presence and absence of 0.1 mg/mL G-CSF are shown; the excitation wavelength was 360 nm. All of the experiments in A–D were performed in 0.1 M MOPS (pH 7.0) at 25°C.
The far-UV CD spectrum of native G-CSF in pH 7.0 buffer demonstrated a high degree of helicity, as previously reported (Lu et al. 1989; Narhi et al. 1991). In 1.5 M GdmCl, where the hyperfluorescent state of G-CSF appeared to be maximally populated, the far-UV CD spectrum overlaid with that of the native protein (Fig. 4B ▶); thus, indicating that no global secondary structural changes occurred between 0 and 1.5 M GdmCl. High salt concentrations interfered with the collection of CD data in the far-UV region. Therefore, for protein samples containing GdmCl, meaningful CD data could not be obtained below 200 nm.
Analytical SEC run in 1.5 M GdmCl, 0.1 M MOPS (pH 7.0) indicated that the protein remained monomeric under these conditions (Fig. 4C ▶). There was a slight shift in retention of the hyperfluorescent G-CSF species. This change may be due to the 1.5 M GdmCl in the mobile-phase or an altered expanded conformation or oligomerization state that is in rapid equilibrium (Krishnan et al. 2002). An arrow in Figure 4C ▶ indicates where a dimer would be expected to elute based on calibration of the column under native conditions.
ANS binds to hydrophobic pockets on the surface of proteins, resulting in a large increase in fluorescence emission of the molecule (Lakowicz 1999). G-CSF was probed with ANS to report changes in hydrophobic surface area in the presence of 1, 2, and 5 M GdmCl. Figure 4D ▶ indicated that moderate concentrations (1–2 M) of GdmCl did not change the overall extent of ANS binding, consistent with there being no change in hydrophobicity on the surface of the protein. No ANS binding was observed in 5.0 M GdmCl, as would be expected from a fully unfolded protein having no ordered surface pockets.
Susceptibility of tryptophans to quenching molecules can be an indicator of protein conformation (Lakowicz 1999). G-CSF was subjected to quenching by acrylamide in 0, 1, and 2 M GdmCl. The extent of quenching in each of these denaturant concentrations was similar, indicating that the conformational changes induced by 1–2 M GdmCl did not result in an increased susceptibility to this quencher (not shown).
Aggregation of G-CSF in GdmCl
The aggregation propensity of the hyperfluorescent conformer was assessed by incubating 2 mg/mL G-CSF in various concentrations of GdmCl, 0.1 M MOPS (pH 7.0) at 37°C (Fig. 5A ▶). The aggregation was markedly increased in GdmCl concentrations ranging from 1 to 2.5 M. Aggregation outside of this concentration range (higher or lower) showed little deviation from the results in native buffer over the experimental time period (~2 d). The extent of aggregation after 18 h was plotted as a function of GdmCl concentration, and overlaid with a denaturation curve monitored by fluorescence (Fig. 5B ▶). A distinct trough in the plot of soluble protein aligned well with the maximal extent of hyperfluorescence, indicating that the hyperfluorescent state is aggregation prone. The GdmCl induced aggregation was not due solely to an ionic strength effect since incubation of G-CSF with increasing concentrations of NaCl, under identical conditions as above, only produced 20% aggregation at 2 M GdmCl (data not shown).
Figure 5.
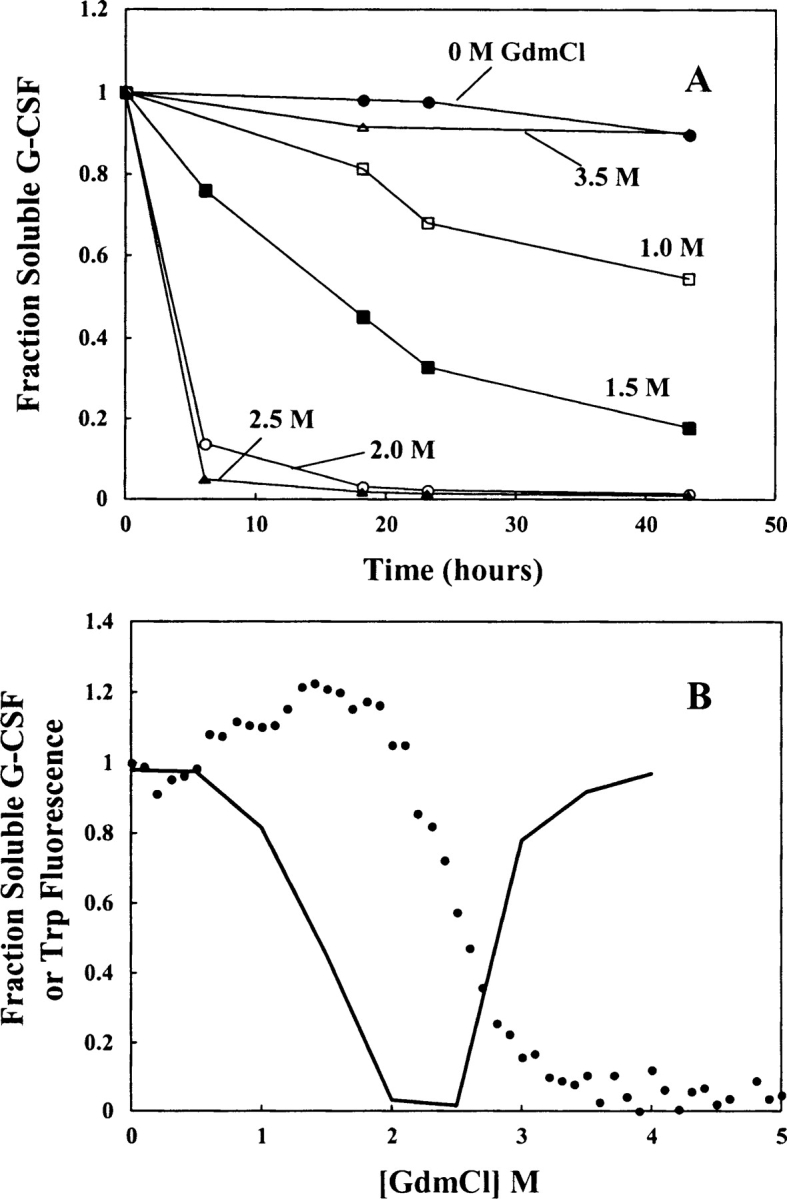
Aggregation propensity of G-CSF in various concentrations of GdmCl. (A) Aggregation kinetics of 2 mg/mL G-CSF in several concentrations of GdmCl (shown), 0.1 M MOPS (pH 7.0) at 37°C. Lines through the data points are provided to guide the eye. (B) An overlay of the fraction of soluble protein remaining after 18 h under the conditions described for A (solid line) with a denaturation curve of GCSF, where tryptophan fluorescence was used to monitor protein conformation (•). Conditions for the denaturation curve were 0.05 mg/mL protein, 0.1 M MOPS (pH 7.0) at 25°C.
Assessment of the Trp environments of G-CSF
Human G-CSF contains two tryptophan residues at positions 58 and 118 (Lu et al. 1988). Determination of the contribution of each tryptophan to the hyperfluorescence in 1–2 M GdmCl would provide valuable information about the specific conformational rearrangements that occur, leading to aggregation. Each tryptophan residue has been substituted by site-directed mutagenesis, Trp58 → Gln; Trp118 → Phe (Kolvenbach et al. 1993). Fluorescence emission spectra indicated that Trp58 is quenched compared to Trp118 in the native state of the protein; in addition the fluorescence from Trp58 is slightly more red-shifted (Kolvenbach et al. 1993). The sum of the fluorescence emission spectra of W58Q and W118F closely approximated the wild-type spectrum, both in intensity and spectral shape (data not shown). This indicates that the tryptophan environment in each mutant is the same as in the wild type.
Equilibrium denaturation of W58Q showed little or no hyperfluorescence in 1–2 M GdmCl (Fig. 6A ▶). In contrast, the relative hyperfluorescence exhibited by W118F in the same region of the curve was greater than that of wild type (Fig. 6B ▶). These results indicate that the hyperfluorescence observed in the wild-type denaturation curve is primarily due to Trp58. The mutant denaturation curves were added, prior to normalization, and superimposed on the wild-type curve (Fig. 6C ▶). The excellent agreement between the curves confirms that the hyperfluorescence of Trp58 accounts for the increased fluorescence in the wild type.
Figure 6.

Equilibrium denaturation of W58Q and W118F G-CSF in GdmCl. (A) W58Q denaturation curve, (B) W118F denaturation curve, and (C) wild-type denaturation curve (•) and the normalized sum of the two mutant curves (□). All denaturation experiments were performed using 0.05 mg/mL in 0.1 M MOPS (pH 7.0) at 25°C.
The G-CSF tryptophan environments were examined further using near-UV CD spectroscopy. The near-UV CD spectra of W58Q, W118F, and wild-type G-CSF were recorded in 0 and 1.5 M GdmCl (Fig. 7 ▶). While the spectra of W58Q were identical for the two conditions (Fig. 7A ▶), the spectra for W118F and wild type both showed a positive increase in ellipticity between 270 and 300 nm (Fig. 7B,C) for the samples in 1.5M GdmCl. These experiments further suggested that the environment around Trp58 was subtly altered in 1–2M GdmCl.
Figure 7.
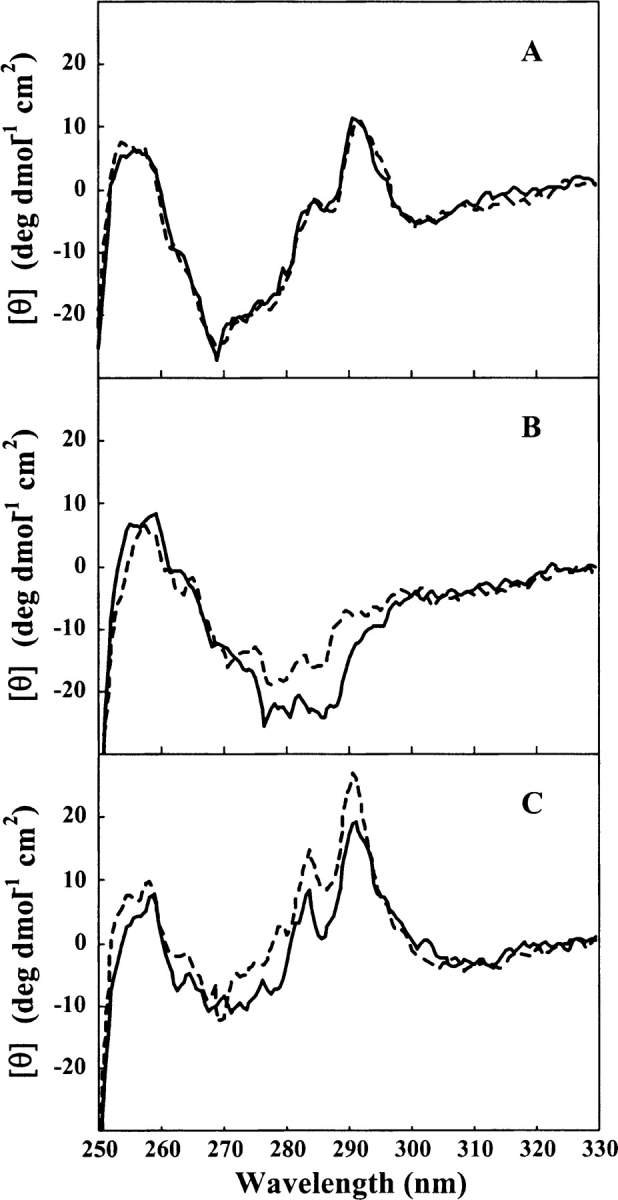
Near-UV CD spectra of W58Q, W118F, and wild-type GCSF. Near-UV CD spectra of G-CSF in 0 M (solid lines) and 1.5 M (dashed lines) GdmCl. (A) W58Q, (B) W118F, (C) wild type. All spectra were collected at a protein concentration of 1.0 mg/mL in 0.1 M MOPS (pH 7.0) at 25°C.
Reactivity of Cys17 in GdmCl
Cys17, the only unpaired cysteine in G-CSF, has been implicated in its aggregation mechanism (Oh-eda et al. 1990; Arakawa et al. 1993). 1-cyano-4-dimethylaminopyridinium (CDAP) is a modifying agent that specifically labels protein thiols with cyano groups at low and neutral pH (Wu and Watson 1998). G-CSF was reacted with CDAP at pH 7.0 as a function of GdmCl concentration to probe Cys17 chemical reactivity. Both the native and the altered conformation of G-CSF, demonstrated by hyperfluorescence and propensity to aggregate (Fig. 5 ▶), were equally susceptible to a small amount of chemical modification by CDAP (Table 1). However, the amount of modified Cys17 increased as the protein unfolded, reaching complete Cys17 modification in the fully unfolded state.4 The CDAP reactivity data follows the equilibrium denaturation curves generated by both CD and fluorescence. The Appendix contains important criteria for comparing denaturation, as detected by spectroscopy, to CDAP labeling. The intrinsic rate of cysteine cyanylation does not vary with GdmCl concentration (Appendix, Table 3), and peptide mapping of modified G-CSF confirmed that Cys17 was the only residue modified in this reaction (data not shown).
Table 1.
CDAP cyanylation of G-CSF as a function of GdmCl
| GdmCl concentration (M) | 0 | 1 | 1.5 | 2 | 2.5 | 3 | 4 |
| % Labeled G-CSF | 17 ± 3 | 17 ± 3 | 23 ± 3 | 67 ± 2 | 73 ± 5 | 100 | 100 |
Cys17 and G-CSF aggregation
A site-specific mutant protein that lacks a cysteine residue at position 17 was constructed. The aggregation kinetics of 2.5 mg/mL C17 AG-CSF was slower than the wild-type protein at the same concentration (Fig. 8A ▶). After 120 h, only 20% of the C17A G-CSF had aggregated, compared to>40% of the wild type. Although the aggregation kinetics were slower than wild type, both proteins did ultimately aggregate to the same extent (data not shown). It is also important to note that equilibrium denaturation of C17A with GdmCl indicated no significant difference in stability, compared to wild type (data not shown).
Figure 8.

Cysteine 17 and G-CSF aggregation. (A) Wild-type G-CSF (▪) and C17A (○) were subjected to the same aggregation assay depicted in Figure 2 ▶. All experimental conditions were the same, except that the protein concentration was 2.5 mg/mL. (B) The aggregated G-CSF from the 5 mg/mL experiment shown in Figure 2 ▶ was dissolved in SDS-containing buffer and analyzed by SEC. Protein peaks were detected by UV absorbance at 214 nm.
At various times during aggregation, the aggregated GCSF was resolublized in SDS-containing buffer and analyzed by SEC (Fig. 8B ▶). Even in the presence of the detergent, large aggregates remained. These aggregates ranged in oligomeric state from dimers to >100-mers, the exclusion limit of the column. However, the portion of the aggregate that remained after SDS treatment was converted to monomer by addition of DTT prior to the SEC analysis. Further, SEC analysis of C17A aggregates did not show the presence of these aggregates in SDS (data not shown). Therefore, it is reasonable to conclude that these persistent aggregates were disulfide cross-linked, and Cys17 played a significant role in their formation.
Discussion
Aggregation kinetics
At pH 7.0 and 37°C, G-CSF has been shown to aggregate quantitatively and in a concentration-dependent manner (Fig. 2 ▶). Under these conditions, the aggregation took days to reach completion, even at high protein concentrations. The slow kinetics suggest that processes other than simple intermolecular collisions govern the rate of G-CSF aggregation. There was no discernable lag phase in the kinetic profile (Fig. 2 ▶) and the rate was not enhanced by the addition of a seed aggregate (not shown). These observations indicate that the rate of aggregation is not dependent on a nucleation event (Jarrett and Lansbury 1992; Ferrone 1999; Krishnan et al. 2002). At protein concentrations greater than 2.5 mg/mL, the loss of soluble protein fit nicely to a single-exponential kinetic equation (data fit not shown). First-order aggregation kinetics suggests that the rate-limiting step may involve a unimolecular process.
Aggregation-prone conformation of G-CSF
Given that many proteins have been shown to aggregate specifically from non-native states, equilibrium denaturation experiments were performed to detect such conformations for G-CSF (Fig. 3 ▶). To inhibit aggregation during equilibrium denaturation, the experiments were conducted at 25°C with a low G-CSF concentration, 50 μg/mL. GCSF populates an altered conformation in 1–2 M GdmCl, which is hyperfluorescent relative to the native state, but shows native-like far-UV CD properties (Fig. 3 ▶, 4 ▶). Although the denaturation curve monitored by CD222 fit well to a two-state folding model (Equation 1) yielding a stability of 9.6 kcal/mol, residuals of the fit were nonrandom in the pre-transition region (not shown). Similarly, independent fitting of the pre-transition data (between 0 and 1 M GdmCl) to Equation 2 was not in good agreement with the best fit of the same region within the two-state model. Thus, the CD denaturation curves deviated froman ideal two-state system, consistent with the population of a third species, as reported by tryptophan fluorescence.
This species is structurally very similar to the native, showing no substantial loss of secondary structure, change in oligomerization state, increased hydrophobic surface area (Fig. 4 ▶) or reactivity toward cyanylation (Table 1). Quenching with acrylamide showed no increased tryptophan accessibility in the 1–2 M GdmCl range (data not shown). This is consistent with the absence of a red shift in 1–2 M GdmCl. Incubation of G-CSF in these denaturant concentrations, however, showed that this state had a much higher propensity to aggregate (Fig. 5 ▶).
In addition to hyperfluorescence, this conformer shows subtle changes in its near-UV CD spectrum (Fig. 7C ▶). This rearrangement can be detected by changes in the spectroscopic properties of Trp58 (Figs. 6 ▶, 7 ▶). A reasonable conclusion is that this conformational change involves localized perturbations in the large loop region of the protein that contains Trp58, between the A and B-helices (Fig. 1 ▶), while maintaining the native-helicity of the molecule.
Mechanism of aggregation
Although the hyperfluorescent species is like the native protein in many ways, population of this conformation in 1–2.5 M GdmCl dramatically increased the rate of GCSF aggregation (Fig. 5 ▶). The aggregation-prone conformation of G-CSF populated in 1–2 M GdmCl is also likely present, albeit to a far lesser extent, in the absence of denaturant. Using this assumption, Scheme 1 ▶ is suggested as a model for G-CSF aggregation, where N, the native protein, is in equilibrium with N′ the aggregation prone conformation. Only the N′ state aggregates and the rate of aggregation is rapid compared to the conversion of N to N′. This model is consistent with the observation that the rate of aggregation increased with temperature; higher temperatures would push the N→N′ equilibrium to the right. Such a mechanism also explains the first-order aggregation kinetics at higher protein concentrations.
Scheme 1.

There are some important features to note in Scheme 1 ▶, the most salient being that N′ does not represent an intermediate on the folding pathway of G-CSF. Instead, it represents an accessible and subtly altered conformation not too unlike the native state. Evidence for this includes the high degree of native secondary and tertiary structure.
Scheme 1 ▶ is a similar mechanism proposed earlier by Krishnan et al. (2002). N′ is likely the same species that leads to aggregation referred to by Chi et al. (2003) and Krishanan et al. (2002) as the “structurally expanded transition state.” This structural expanded species that is aggregation competent was shown by Krishnan et al. (2002) to be monomeric and has a surface increase from the native state of 15% compared to that for the unfolded state. Chi et al. (2003) described two types of forces that control G-CSF aggregation. One force is called “conformational stability” and is measured by the free energy of unfolding. Under certain solution conditions this conformational stability dominates and a conformational change is required for aggregation to proceed. The other force controlling aggregation is called “colloidal stability” and is measured by the osmotic second virial coefficient (B22). Under certain solution conditions (B22 values large and positive) the interactions are repulsive between protein molecules and aggregation is rate limited by colloidal stability. The aggregation studies reported here for G-CSF are under physiological type conditions (neutral pH and 37°C), the B22 values are negative (Chi et al. 2003), and aggregation is rate-limited by conformational stability. This conformational stability limited aggregation is very consistent with the increased population of aggregation-prone species that was observed in 1–2.5 M GdmCl of Figures 3 ▶ and 5 ▶.
Aggregation by Scheme 1 ▶ is not unique to G-CSF; other proteins such as transthyretin, γ-crystallins, and interferon-γ aggregate from species that seem to have little to do with the folding pathway. These proteins maintain a substantial amount of native structure in the aggregating species, and aggregation can occur under very mild solution conditions. In each of these situations, very subtle structural changes lead to aggregation. Transthyretin fibrilogenesis is induced by acid-dissociation of the native tetramer (Lai et al. 1996). Interferon-γ undergoes a subtle, nonspecific expansion prior to aggregation (Kendrick et al. 1998a,b). The aggregation of crystallin, the causative action in cataract formation, is not as well understood, but may be mediated by covalent chemical modification of the protein over many years (Thurston et al. 1997; National Eye Institute Report of the Lens and Cataract Panel 2001 [http://www.nei.nih.gov/resources/strategicplans/neiplan/frm%5Flens.htm]).
For many other proteins, such as growth hormone (Brems 1998), Rhodanese (Tandon and Horowitz 1986), P22 tailspike (Mitraki and King 1989; Mitraki et al. 1991; Betts and King 1999), and interleukin 1β (Finke et al. 2000), aggregate occurs via a mechanism closer to Scheme 2 ▶, where I represents an intermediate along the folding pathway, unfolding pathway or both. The significance of discerning between Scheme 1 ▶ and Scheme 2 ▶ comes into play when one attempts to inhibit the aggregation process. Aggregation via Scheme 2 ▶ is more likely to manifest itself during protein expression in vivo or refolding in vitro. In such cases, rational methods can be developed to limit the extent to which these species are populated, or attempts can be made to stabilize the intermediate against aggregation by altering the solution conditions (Betts and King 1998, 1999; De Bernardez Clark 2001). A recent study of the kinetics of G-CSF folding (Brems 2002) identified a late-stage intermediate on the folding pathway. This intermediate contained 100% native-like helical structure, but the fluorescence of the Trp58, and thus the loop connecting the A and B-helix (see Fig. 1 ▶), was not native-like. The similarities of the spectral properties, and in particular Trp58, between the neutral pH aggregation prone equilibrium species N′ or I in Scheme 1 ▶ or 2 and the kinetic intermediate is striking. Therefore, the neutral pH aggregation prone species may be a folding intermediate as depicted in Scheme 2 ▶.
Scheme 2.

Stabilization of the native state of a protein, relative to the aggregating species, will often inhibit aggregation. Specific binding of small molecules that stabilize the tetramer can inhibit transthyretin aggregation (Peterson et al. 1998). The simple addition of sucrose has been shown to favor a more compact native state of interferon-γ by preferential exclusion of sucrose from the protein surface (Kendrick et al. 1998a). Carpenter and coworkers (Krishnan et al. 2002) have recently published similar work on the aggregation of G-CSF under physiological conditions. They showed that aggregation was inhibited by sucrose. They concluded that a minor structural fluctuation resulted in a transition from the compact native state to an expanded native-like state that was responsible for aggregation. Regan and coworkers (Bishop et al. 2001) were successful at increasing the thermodynamic stability of native G-CSF by re-engineering the molecule using amino acids that have greater helix propensity.
The tendency of G-CSF and other members of this cytokine family to assume altered conformations with varying pH has been well established (Narhi et al. 1991; Kolvenbach et al. 1997; Hamburger et al. 1998). At low pH, G-CSF is resistant to aggregation, a characteristic which is key to its current liquid formulation as Neupogen (Herman et al. 1996). This state is compact and shows a high degree of α-helicity and is resistant to aggregation (Kolvenbach et al. 1997). The free energy of unfolding of G-CSF is increased substantially at pH 4 compared to pH 7. This compact state in acid may lock it in a state highly resistant to self-association.
Cys17 and G-CSF aggregation
G-CSF contains one unpaired cysteine that is not necessary for stability or biological activity. Interestingly, when Cys17 is removed by site-specific mutagenesis, the rate of aggregation slowed down significantly (Fig. 8A ▶). There is no evidence that Cys17 is susceptible to oxidation events that may shift the G-CSF equilibrium from N to N′ (Scheme 1 ▶). However, aggregated G-CSF contains a population that is disulfide cross-linked as determined by denaturing SEC (Fig. 8B ▶). The cross-linked aggregates were very large (~100-mers) and the extent of cross-linking increased with aggregation time. This suggests that disulfide shuffling occurred in the aggregate. When aggregated C17A G-CSF was analyzed, no disulfide-bonded aggregates were observed (data not shown).
The manner in which Cys17 may be influencing the aggregation kinetics is shown in Scheme 3 ▶, where N represents the native state, N′/I is a native-like aggregation prone conformation or an intermediate along the folding pathway, and [N′/I-S-S-N′/I] is a disulfide bound state. In this model, a dimerization event occurs between molecules in the N′/I state to form a disulfide-bonded aggregation intermediate. Once in the aggregated state disulfide bond exchange takes place, resulting in the very large cross-linked aggregates seen in Figure 8B ▶. For wild-type GCSF, the N′ or I is rate limiting. In the absence of a cysteine at position 17 the dimers may dissociate with a certain frequency; this back reaction would result in slower overall aggregation kinetics. For C17A G-CSF, the dimerization reaction is rate-limiting.
Scheme 3.

A dimeric aggregation intermediate of G-CSF has been suggested, but its role during aggregation, using SEC or native PAGE, has been elusive thus far. There is circumstantial evidence that such a dimer exists. For instance, an aggregation-prone dimer can be induced by the addition of Cu2+ (data not shown). Further work is being done to access the detailed role of disulfide bonding and dimer formation in G-CSF aggregation.
G-CSF aggregation involves conformational switching that occurs readily at physiological pH and temperature. This dynamic behavior may have some physiological function, like receptor binding. However, the crystal structure of G-CSF bound to its receptor shows no evidence of conformational switching between the bound and the unbound forms of G-CSF (Aritomi et al. 1999). Absent any active role of the N′ or I species, it should be possible to stabilize the native (N) state to inhibit aggregation. The aggregation of recombinant G-CSF demonstrates the drastic effect that even very subtle conformational changes can have on a protein’s solution behavior.
Materials and methods
Reagents
Sodium chloride and guanidinium chloride were obtained from Mallinckrodt. MOPS, SDS, Tris-HCl, ANS, and CDAP were from Sigma. Acrylamide was purchased from BioRad. All other salts and reagents were of the finest grade commercially available.
Protein
Recombinant human G-CSF, wild type, and mutant forms, were expressed and purified from Escherichia coli as previously described (Souza et al. 1986). Extinction coefficients for all proteins were calculated using the method described by Pace et al. (1995), based on amino acid extinction coefficients determined by Edelhoch (1967). The extinction coefficient for wild type and C17A G-CSF was 0.86 mL/mg × cm, and 0.53 mL/mg × cm was used for the Trp-substituted mutants.
Aggregation assay
Protein samples were incubated at 37°C in 0.1MMOPS with or without GdmCl, as indicated. For the aggregation experiments that did not contain denaturant, the G-CSF concentrations were varied. For the experiments that used GdmCl to induce aggregation, the protein concentration was 2 mg/mL. At specified times, samples were removed from 37°C and centrifuged for 20 min at 14,000 rpm in an Eppendorf 5415 C bench top centrifuge at 4°C. The supernatant was then diluted twofold in 0.1M MOPS buffer, and the soluble G-CSF remaining was measured by absorbance at 280 nm, using a Cary 50 spectrophotometer. Minor corrections in the UV absorbance were made due to light scattering (Leach and Scheraga 1960). In some cases the aggregate was suspended in 5% SDS and subjected to SEC analysis. The effects of ionic strength on the aggregation of G-CSF were also monitored using the same conditions and methods as above, but NaCl was substituted for GdmCl.
Equilibrium denaturation
All equilibrium denaturation experiments were performed using 0.05 mg/mL G-CSF in 0.1 M MOPS (pH 7.0) and GdmCl concentrations ranging from 0 to 5 M at 25°C. The experiments monitored by protein fluorescence were prepared as described by Pace et al. (Pace 1986). Briefly, stock solutions of 0.5 mg/mL GCSF and 8 M GdmCl in 0.1 M MOPS (pH 7.0) were mixed and diluted with buffer to create an array of 1.5-mL solutions, each containing 0.05 mg/mL G-CSF and the desired GdmCl concentration. Reversibility was verified by fluorescence spectroscopy of samples prepared from a 10X protein stock solution containing 5 M GdmCl that was diluted to refolding conditions. All samples used to generate data for the fluorescence denaturation curves were equilibrated 12–18 h at 25°C. Fluorescence spectra were recorded with a Hitachi F-4500 fluorescence spectrophotometer equipped with a Fisher Isotemp 1013P circulating water bath. Samples in a 1.0X 0.4-cm quartz cell were excited at 280 nm, and emission spectra were recorded from 300–400 nm, using a scan rate of 60 nm/sec. Instrument slit-widths and PMT voltage were set tomaximize signal. The fluorescence intensity, integrated over the entire spectral region, was plotted against GdmCl concentration to generate the curves.
Denaturation curves monitored by CD were performed in an Aviv 62A-DS CD spectrometer that included an automated titration system. The system consisted of a Hamilton pump and syringes programed to titrate denaturant by serial exchange of a native and denatured (7.0 M GdmCl) sample, while maintaining a constant G-CSF concentration. Denaturation was monitored at 222 nm using a stir time of 4 min between measurements and a signal averaging time of 15 sec.
Data fitting
Equilibrium denaturation of G-CSF monitored by far-UV CD showed a single unfolding transition. These data were fit to a model that assumes the protein can only exist in one of two states: the native state or the fully unfolded state (Equation 1) (Santoro and Bolen 1988), using Kaleida Graph software (Synergy) for the Macintosh.
 |
(1) |
Here ΔG represents the free energy of unfolding in the absence of denaturant, m is the dependence of ΔG on GdmCl concentration, R is the universal gas constant, and T is the temperature of the experiment. N and D are the ellipticities of the native and denatured states, respectively, and are defined as follows:
 |
(2) |
 |
(3) |
where N° and D° are the ellipticities in the absence of denaturant and mN and mD reflect the linear dependence of those signals on GdmCl concentration.
Circular dichroism spectra
CD wavelength spectra of G-CSF were acquired with an Aviv 202 spectrometer equipped with a NesLab CFT-33 circulating water bath. All samples were equilibrated, with or without GdmCl, at 25°C in 0.1 M MOPS (pH 7.0) for 1 h before CD spectra were taken. Data were collected every 0.5 nm with an averaging time of 2–4 sec. Near (250–320 nm) and far (180–250 nm) CD spectra were recorded using quartz cells of path-lengths 1 cm and 0.01 cm, respectively. The protein concentrations were 0.5–1.0 mg/mL, as indicated in the figure legends.
Size-exclusion chromatography
G-CSF samples, native and in 1.5 M GdmCl, were analyzed by SEC on an AKTA FPLC system (Amersham Pharmacia) equipped with a Superose 6 HR 30/10 column (Amersham Pharmacia). Themobile-phase was 0.1MOPS (pH 7.0) with either 150 mM NaCl or 1.5 M GdmCl run at 0.5 mL/min. One hundred (100) μL of a 0.05 mg/mL G-CSF solution was loaded on the column, and protein peaks were detected by UV absorbance at 280 nm.
Aggregated G-CSF was dissolved in pH 7.0 PBS with 5%SDS with or without 20 mM DTT. SEC was performed on the samples using a Hewlett-Packard 1050 ti HPLC system controlled by Chemstation software and a Superose 12 30/10 column (Amersham Pharmacia). The mobile-phase was 0.1 M Tris, 150 mM NaCl (pH 7.5), and 0.1% SDS, run at 0.6 mL/min. Twenty (20) μL of 1 mg/mL resolublized aggregate was loaded on the column; protein peaks were detected by UV absorbance at 214 nm. All SEC experiments were run at ambient temperature.
Acrylamide quenching
Fluorescence spectra of G-CSF were recorded (as described above) with and without GdmCl in increasing concentrations of acrylamide to quench fluorescence. Stern-Volmer plots were constructed to assess the extent of quenching in the various GdmCl concentrations (Lakowicz 1999).
ANS binding
Fluorescence emission spectra of 25 μM 8-anilinonaphthalene- 2-sulfonic acid (ANS) and 0.1 mg/mL G-CSF were recorded in the presence of several concentrations of GdmCl, 0.1 M MOPS (pH 7.0) at 25°C. Acquisition of these spectra was similar to those described above, except the excitation wavelength was 360 nm and the emission was scanned from 400–600 nm. The fluorescence of free ANS, in the presence of control concentrations of GdmCl, was subtracted from the spectra of the G-CSF/ANS mixtures to display any fluorescence of G-CSF-bound ANS.
Labeling Cys17 with CDAP
CDAP was used to cyanylate Cys17 in 20 mM Tris-HCl (pH 7.0), as described by Wu and Watson (Wu and Watson 1998). CDAP was dissolved in acetonitrile to obtain a stock solution of 51 mM. After combining G-CSF (0.5 mg/mL, final concentration) and GdmCl, CDAP was added to achieve a final concentration of 270 μM (a 10-fold molar excess over G-CSF) and incubated at room temperature for 15 min. Analysis was immediately carried out using reversed-phase LC/MS. Mass spectrometry was used to quantify labeled protein, using Xcalibur software on a Finnigan LCQ Deca system.
Acknowledgments
We gratefully acknowledge Prof. Alexander Rich (MIT) for the use of his CD spectrometer, the Amgen/MIT consortium for providing funding. Additional support was also provided by NIH GM17, 980 to J.K.
Abbreviations
ANS, 8-anilinonaphthalene-2-sulfonic acid
CD, circular dichroism
CDAP, 1-cyano-4-dimethylaminopyridinium
DTT, dithiothreitol
G-CSF, granulocyte-colony stimulating factor
GdmCl, guanidinium chloride
HPLC, high performance liquid chromatography
LC/MS, liquid chromatography/mass spectrometry
MOPS, 3-(N-morpholino) propanesulfonic acid
PBS, phosphate-buffered saline
PMT, photomultiplier tube
SDS, sodium dodecyl sulfate
SEC, size exclusion chromatography
Tris-HCl, tris(hydroxymethyl)-aminomethane hydrochloride
UV, ultraviolet
Appendix
Criteria for comparing denaturation as detected by spectroscopy to CDAP labeling
Comparing equilibrium denaturation by multiple detection methods is a useful means for identifying possible folding intermediates. For example, equilibrium denaturation curves detected by multiple methods that do not coincide may be interpreted as evidence for the presence of an intermediate state (Kim and Baldwin 1982). GdmCl-induced denaturation of G-CSF as detected by spectroscopy (CD and fluoresence) is an equilibrium measurement (see Fig. 3 ▶). The results were identical for unfolding and refolding, with each data point in the transition region representing some equilibrium value, Keq, where
 |
In contrast, the CDAP reaction is a kinetic measurement that requires a conformational adjustment to expose Cys17 for reactivity. The native state (absence of GdmCl) at pH 4 is unreactive where as at pH 7 partial labeling was obtained. In the presence of denaturant a local unfolding reaction is necessary for CDAP labeling and is illustrated as follows:
 |
(where N′ or I represents an altered native-like state or an intermediate state with Cys17 exposed and N*or I*represents the altered native-like state or an intermediate state labeled with CDAP).
The extent of CDAP labeling is defined by
 |
(where k12 and k21 are the microscopic rate constants for the partial unfolding and refolding, respectively, and k23 is the rate constant for CDAP labeling of exposed Cys17).
The extent of CDAP labeling may be used to measure the equilibrium concentration of [N′ or I]/[N] (i.e., k12/k21) if certain criteria are met. If N and N′ or I equilibrate rapidly compared to the rate of the CDAP labeling, then the extent of CDAP labeling is proportional to the fraction of the protein in the N′ or I state. For example, if k21>>k23 then:
 |
Providing that k23 is a constant, then the extent of CDAP labeling is proportional to the microscopic rate constants for the partial unfolding reaction. Since k23 is the only rate dependent on the concentration of CDAP, the criteria of k21>>k23 will be met if the extent of CDAP labeling is dependent on the concentration of CDAP (i.e., k23 is a second-order reaction which is rate-limiting). Table 2 shows that up to CDAP:G-CSF ratios of 400:1 the extent of labeling was directly dependent on the concentration of CDAP. Therefore, within this concentration range the reaction rate k23 is rate-limiting and is smaller than the rate k21. The results of Table 2 were obtained with 1 mg/mL G-CSF at pH 5.0 and a CDAP reaction time of 15 min at room temperature before analysis by LCMS. The criteria that rate k23 is a constant was determined by using a small peptide derived from G-CSF that contains Cys17 (FLLKCLE) and demonstrating that CDAP labeling was independent of GdmCl concentration. A stock solution of the peptide was made up at 0.1 mg/mL. CDAP was added to give a 1:2 (CDAP: peptide) molar ratio and incubated for 15 min at room temperature. Samples were analyzed using reversed-phase HPLC and mass spectrometry. Table 3 shows that the rate of CDAP labeling was independent of a GdmCl concentration from 0 Mto 5 M. Furthermore, no difference was found in the rate of CDAP labeling between pH 5.0 and 7.0 (data not shown).
Table 2.
Percent G-CSF labeled by CDAP
| CDAP ratio | ||||||
| CDAP : GCSF | 0 | 1 : 1 | 10 : 1 | 50 : 1 | 200 : 1 | 400 : 1 |
| % Labeled G-CSF | 0 | 15 | 28.6 | 46.8 | 63.2 | 85 |
Table 3.
Effects of GdmCl on the cyanylation reaction of CDAP
| GdmCl concentration (M) | 0 | 0.5 | 1 | 2 | 3 | 4 | 5 |
| % of peptide labeled | 48.4 | 44.9 | 51.65 | 43.5 | 40.65 | 40.95 | 42.7 |
Article and publication are at http://www.proteinscience.org/cgi/doi/10.1110/ps.051489405.
Footnotes
Cysteine 17 showed a negligible increase in the amount of chemical modification in solutions which contained 0–1.5 M GdmCl after incubation of 0.5 mg/mL G-CSF with 270 μM CDAP for 15 min at room temperature. The reaction was carried out in 20 mM Tris-HCl (pH 7.0) and various concentrations of GdmCl. The remaining data points correspond well with the unfolding transition monitored by tryptophan fluorescence and CD equilibrium denaturation curves (Fig. 3 ▶).
References
- Arakawa, T., Prestrelski, S.J., Narhi, L.O., Boone, T.C., and Kenney, W.C. 1993. Cysteine 17 of recombinant human granulocyte-colony stimulating factor is partially solvent-exposed. J. Protein Chem. 12 525–531. [DOI] [PubMed] [Google Scholar]
- Aritomi, M., Kunishima, N., Okamoto, T., Kuroki, R., Ota, Y., and Morikawa, K. 1999. Atomic structure of the GCSF-receptor complex showing a new cytokine-receptor recognition scheme. Nature 401 713–717. [DOI] [PubMed] [Google Scholar]
- Baum, J. and Brodsky, B. 1999. Folding of peptide models of collagen and misfolding in disease. Curr. Opin. Struct. Biol. 9 122–128. [DOI] [PubMed] [Google Scholar]
- Betts, S.D. and King, J. 1998. Cold rescue of the thermolabile tailspike intermediate at the junction between productive folding and off-pathway aggregation. Protein Sci. 7 1516–1523. [DOI] [PMC free article] [PubMed] [Google Scholar]
- ———. 1999. There’s a right way and a wrong way: In vivo and in vitro folding, misfolding and subunit assembly of the P22 tailspike. Structure Fold. Des. 7 R131–R139. [DOI] [PubMed] [Google Scholar]
- Betts, S., Haase-Pettingell, C., and King, J. 1997. Mutational effects on inclusion body formation. Adv. Protein Chem. 50 243–264. [DOI] [PubMed] [Google Scholar]
- Bishop, B., Koay, D.C., Sartorelli, A.C., and Regan, L. 2001. Reengineering granulocyte colony-stimulating factor for enhanced stability. J. Biol. Chem. 276 33465–33470. [DOI] [PubMed] [Google Scholar]
- Blake, C. and Serpell, L. 1996. Synchrotron X-ray studies suggest that the core of the transthyretin amyloid fibril is a continuous β-sheet helix. Structure 4 989–998. [DOI] [PubMed] [Google Scholar]
- Brems, D.N. 1998. Solubility of different folding conformers of bovine growth hormone. Biochemistry 27 4541–4546. [Google Scholar]
- ———. 2002. The kinetics of G-CSF folding. Protein Sci. 11 2504–2511. [DOI] [PMC free article] [PubMed] [Google Scholar]
- Brems, D.N. and Havel, H.A. 1989. Folding of bovine growth hormone is consistent with the molten globule hypothesis. Proteins 5 93–95. [DOI] [PubMed] [Google Scholar]
- Brems, D.N., Plaisted, S.M., Kauffman, E.W., Lund, M., and Lehrman, S.R. 1987. Helical formation in isolated fragments of bovine growth hormone. Biochemistry 26 7774–7778. [DOI] [PubMed] [Google Scholar]
- Brems, D.N., Plaisted, S.M., Havel, H.A., and Tomich, C.S. 1988. Stabilization of an associated folding intermediate of bovine growth hormone by site-directed mutagenesis. Proc. Natl. Acad. Sci. 85 3367–3371. [DOI] [PMC free article] [PubMed] [Google Scholar]
- Canet, D., Sunde, M., Last, A.M., Miranker, A., Spencer, A., Robinson, C.V., and Dobson, C.M. 1999. Mechanistic studies of the folding of human lysozyme and the origin of amyloidogenic behavior in its disease- related variants. Biochemistry 38 6419–6427. [DOI] [PubMed] [Google Scholar]
- Carpenter, J.F., Kendrick, B.S., Chang, B.S., Manning, M.C., and Randolph, T.W. 1999. Inhibition of stress-induced aggregation of protein therapeutics. Methods Enzymol. 309 236–255. [DOI] [PubMed] [Google Scholar]
- Carrell, R.W. and Lomas, D.A. 1997. Conformational disease. Lancet 350134–138. [DOI] [PubMed] [Google Scholar]
- Chi, E.Y., Krishnan, S., Kendrick, B.S., Chang, B.S., Carpenter, J.F., and Randolph, T.W. 2003. Roles of conformational stability and colloidal stability in the aggregation of recombinant human granulocyte colonystimulating factor. Protein Sci. 12 903–913. [DOI] [PMC free article] [PubMed] [Google Scholar]
- Chuang, D.T. 1998. Maple syrup urine disease: It has come a long way. J. Pediatr. 132 S17–S23. [DOI] [PubMed] [Google Scholar]
- De Bernardez Clark, E. 2001. Protein refolding for industrial processes. Curr. Opin. Biotech. 12 202–207. [DOI] [PubMed] [Google Scholar]
- Dobson, C.M. 1999. Protein misfolding, evolution and disease. Trends Biochem. Sci. 24 329–332. [DOI] [PubMed] [Google Scholar]
- Edelhoch, H. 1967. Spectroscopic determination of tryptophan and tyrosine in proteins. Biochemistry 6 1948–1954. [DOI] [PubMed] [Google Scholar]
- Ferrone, F. 1999. Analysis of protein aggregation kinetics. Methods Enzymol. 309 256–274. [DOI] [PubMed] [Google Scholar]
- Fink, A.L. 1998. Protein aggregation: Folding aggregates, inclusion bodies and amyloid. Fold. Des. 3 R9–R23. [DOI] [PubMed] [Google Scholar]
- Finke, J.M., Roy, M., Zimm, B.H., and Jennings, P.A. 2000. Aggregation events occur prior to stable intermediate formation during refolding of interleukin 1β. Biochemistry 39 575–583. [DOI] [PubMed] [Google Scholar]
- Glenner, G.G., Wong, C.W., Quaranta, V., and Eanes, E.D. 1984. The amyloid deposits in Alzheimer’s disease: Their nature and pathogenesis. Appl. Pathol. 2 357–369. [PubMed] [Google Scholar]
- Hamburger, J.B., Chen, E., Narhi, L.O., Wu, G.M., and Brems, D.N. 1998. Multiple conformational states of a new hematopoietic cytokine (megakaryocyte growth and development factor): pH- and urea-induced denaturation. Proteins 32 495–503. [PubMed] [Google Scholar]
- Havel, H.A., Kauffman, E.W., Plaisted, S.M., and Brems, D.N. 1986. Reversible self-association of bovine growth hormone during equilibrium unfolding. Biochemistry 25 6533–6538. [DOI] [PubMed] [Google Scholar]
- Herman, A.C., Boone, T.C., and Lu, H.S. 1996. Characterization, formulation, and stability of Neupogen (Filgrastim), a recombinant human granulocyte-colony stimulating factor. In Formulation, characterization and stability of protein drugs (eds. R. Pearlman and Y.J. Wang), pp. 303–328. Plenum Press, New York. [DOI] [PubMed]
- Hill, C.P., Osslund, T.D., and Eisenberg, D. 1993. The structure of granulocyte- colony-stimulating factor and its relationship to other growth factors. Proc. Natl. Acad. Sci. 90 5167–5171. [DOI] [PMC free article] [PubMed] [Google Scholar]
- Jarrett, J.T. and Lansbury Jr., P.T., 1992. Amyloid fibril formation requires a chemically discriminating nucleation event: Studies of an amyloidogenic sequence from the bacterial protein OsmB. Biochemistry 31 12345–12352. [DOI] [PubMed] [Google Scholar]
- Kendrick, B.S., Carpenter, J.F., Cleland, J.L., and Randolph, T.W. 1998a. A transient expansion of the native state precedes aggregation of recombinant human interferon-γ. Proc. Natl. Acad. Sci. 95 14142–14146. [DOI] [PMC free article] [PubMed] [Google Scholar]
- Kendrick, B.S., Cleland, J.L., Lam, X., Nguyen, T., Randolph, T.W., Manning, M.C., and Carpenter, J.F. 1998b. Aggregation of recombinant human interferon γ: Kinetics and structural transitions. J. Pharm. Sci. 87 1069–1076. [DOI] [PubMed] [Google Scholar]
- Kim, P.S. and Baldwin, R.L. 1982. Specific intermediates in the folding reactions of small proteins and the mechanism of protein folding. Annu. Rev. Biochem. 51 459–489. [DOI] [PubMed] [Google Scholar]
- Kolvenbach, C.G., Elliott, S., Sachdev, R., Arakawa, T., and Narhi, L.O. 1993. Characterization of two fluorescent tryptophans in recombinant human granulocyte-colony stimulating factor: Comparison of native sequence protein and tryptophan-deficient mutants. J. Protein Chem. 12 229–236. [DOI] [PubMed] [Google Scholar]
- Kolvenbach, C.G., Narhi, L.O., Philo, J.S., Li, T., Zhang, M., and Arakawa, T. 1997. Granulocyte-colony stimulating factor maintains a thermally stable, compact, partially folded structure at pH2. J. Pept. Res. 50 310–318. [DOI] [PubMed] [Google Scholar]
- Krishnan, S., Chi, E.Y., Webb, J.N., Chang, B.S., Shan, D., Goldenberg, M., Manning, M.C., Randolph, T.W., and Carpenter, J.F. 2002. Aggregation of granulocyte colony stimulating factor under physiological conditions: Characterization and thermodynamic inhibition. Biochemistry 41 6422–6431. [DOI] [PubMed] [Google Scholar]
- Lai, Z., Colon, W., and Kelly, J.W. 1996. The acid-mediated denaturation pathway of transthyretin yields a conformational intermediate that can self-assemble into amyloid. Biochemistry 35 6470–6482. [DOI] [PubMed] [Google Scholar]
- Lakowicz, J.R. 1999. Principles of fluorescence spectroscopy, 2nd ed. Plenum Press, New York.
- Leach, S.J., and Scheraga, H.A. 1960. Determination and analysis of urea and guanidine hydrochloride denaturation curves. J. Am. Chem. Soc. 82 4790–4792. [Google Scholar]
- Lu, H.S., Klein, M.L., and Lai, P.H. 1988. Narrow-bore high-performance liquid chromatography of phenylthiocarbamyl amino acids and carboxypeptidase P digestion for protein C-terminal sequence analysis. J. Chromatogr. 447 351–364. [PubMed] [Google Scholar]
- Lu, H.S., Boone, T.C., Souza, L.M., and Lai, P.H. 1989. Disulfide and secondary structures of recombinant human granulocyte colony stimulating factor. Arch. Biochem. Biophys. 268 81–92. [DOI] [PubMed] [Google Scholar]
- Metcalf, D. and Nicola, N.A. 1983. Proliferative effects of purified granulocyte colony-stimulating factor (G-CSF) on normal mouse hemopoietic cells. J. Cell. Physiol. 116 198–206. [DOI] [PubMed] [Google Scholar]
- Mitraki, A. and King, J. 1989. Amino acid substitutions influencing intracellular protein folding pathways. Bio/Technology 7 690–697. [DOI] [PubMed] [Google Scholar]
- Mitraki, A., Fane, B., Haase-Pettingell, C., Sturtevant, J., and King, J. 1991. Global suppression of protein folding defects and inclusion body formation. Science 253 54–58. [DOI] [PubMed] [Google Scholar]
- Narhi, L.O., Kenney, W.C., and Arakawa, T. 1991. Conformational changes of recombinant human granulocyte-colony stimulating factor induced by pH and guanidine hydrochloride. J. Protein Chem. 10 359– 367. [DOI] [PubMed] [Google Scholar]
- Oh-eda, M., Hasegawa, M., Hattori, K., Kuboniwa, H., Kojima, T., Orita, T., Tomonou, K., Yamazaki, T., and Ochi, N. 1990. Physicochemical and biological characterization of asialoerythropoietin. Suppressive effects of sialic acid in the expression of biological activity of human erythropoietin in vitro. J. Biol. Chem. 265 11432–11435. [PubMed] [Google Scholar]
- Pace, C.N. 1986. Determination and analysis of urea and guanidine hydrochloride denaturation curves. Methods Enzymol. 131 266–280. [DOI] [PubMed] [Google Scholar]
- Pace, C.N., Vajdos, F., Fee, L., Grimsley, G., and Gray, T. 1995. How to measure and predict the molar absorption coefficient of a protein. Protein Sci. 4 2411–2423. [DOI] [PMC free article] [PubMed] [Google Scholar]
- Peterson, S.A., Klabunde, T., Lashuel, H.A., Purkey, H., Sacchettini, J.C., and Kelly, J.W. 1998. Inhibiting transthyretin conformational changes that lead to amyloid fibril formation. Proc. Natl. Acad. Sci. 95 12956– 12960. [DOI] [PMC free article] [PubMed] [Google Scholar]
- Polymeropoulos, M.H., Lavedan, C., Leroy, E., Ide, S.E., Dehejia, A., Dutra, A., Pike, B., Root, H., Rubenstein, J., Boyer, R., et al. 1997. Mutation in the α-synuclein gene identified in families with Parkinson’s disease. Science 276 2045–2047. [DOI] [PubMed] [Google Scholar]
- Santoro, M.M. and Bolen, D.W. 1988. A test of the linear extrapolation of unfolding free energy changes over an extended denaturant concentration range. Biochemistry 27 8063–8068. [DOI] [PubMed] [Google Scholar]
- Souza, L.M., Boone, T.C., Gabrilove, J., Lai, P.H., Zsebo, K.M., Murdock, D.C., Chazin, V.R., Bruszewski, J., Lu, H., and Chen, K.K. 1986. Recombinant human granulocyte colony-stimulating factor: Effects on normal and leukemic myeloid cells. Science 232 61–65. [DOI] [PubMed] [Google Scholar]
- Speed, M.A., Wang, D.I.C., and King, J. 1996. Specific aggregation of partially folded polypeptide chains: The molecular basis of inclusion body composition. Nat. Biotech. 14 1283–1287. [DOI] [PubMed] [Google Scholar]
- Tandon, S. and Horowitz, P. 1986. Detergent-assisted refolding of guanidinium chloride-denatured rhodanese. The effect of lauryl maltoside. J. Biol. Chem. 261 15615–15618. [PubMed] [Google Scholar]
- Thurston, G.M., Hayden, D.L., Burrows, P., Clark, J.I., Taret, V.G., Kandel, J., Courogen, M., Peetermans, J.A., Bowen, M.S., Miller, D., et al. 1997. Quasielastic light scattering study of the living human lens as a function of age. Curr. Eye Res. 16 197–207. [DOI] [PubMed] [Google Scholar]
- Tracy, M.A. 1998. Development and scale-up of a microsphere protein delivery system. Biotechnol. Prog. 14 108–115. [DOI] [PubMed] [Google Scholar]
- Wu, J. and Watson, J.T. 1998. Optimization of the cleavage reaction for cyanylated cysteinyl proteins for efficient and simplified mass mapping. Anal. Biochem. 258 268–276. [DOI] [PubMed] [Google Scholar]