

Abstract
The evagination of Drosophila imaginal discs is a classic system for studying tissue level morphogenesis. Evagination involves a dramatic change in morphology and published data argues that this is mediated by cell shape changes. We have reexamined the evagination of both the leg and wing discs and find that the process involves cell rearrangement and that cell divisions take place during the process. The number of cells across the width of the ptc domain in the wing and the omb domain in the leg decreased as the tissue extended during evagination and we observed cell rearrangement to be common during this period. In addition, almost half of the cells in the region of the leg examined divided between 4 and 8 hr after white prepupae formation. Interestingly, these divisions were not typically oriented parallel to the axis of elongation. Our observations show that disc evagination involves multiple cellular behaviors, as is the case for many other morphogenetic processes.
Keywords: imaginal disc evagination, cell rearrangement, cell division, cell intercalation, Drosophila
Introduction
During the development of all multicellular animals groups of cells undergo coordinate behaviors that lead to the morphogenesis of embryonic axes and tissues (Keller, 2002; Keller, 2005; Keller, 2006). In principle, tissue level morphogenesis can be due to cell rearrangements (Bertet et al., 2004; Blankenship et al., 2006; Keller, 1986), changes in the shapes of individual cells (Condic et al., 1991), patterned cell divisions and patterned cell death (Baena-Lopez et al., 2005; Concha and Adams, 1998; Gong et al., 2004; Sausedo et al., 1997; Schoenwolf and Alvarez, 1989; Schoenwolf and Yuan, 1995). Evidence for all of these has been found in developing systems. One difficulty in analyzing the relative importance of these cell behaviors is that it is usually not possible to individually block one at a time. Further, cell migration or rearrangement often involves coordinated changes in cell shape (Keller, 2002). For example, during Xenopus gastrulation the cells that undergo mediolateral intercalation become elongated mediolaterally and polarized with large lamelliform protrusions both medial and laterally that are thought to mediate both the change in cell shape and rearrangement (Keller, 2006; Keller et al., 2003; Shih and Keller, 1992). Oriented cell divisions can also be related to asymmetric cell shape (Brown et al., 2003; Rose and Kemphues, 1998). For example, the classic observation that the mitotic spindle tends to be aligned parallel to the long axis of a cell (Wilson, 1900).
The imaginal discs of Drosophila were one of the early systems in which the importance of patterned cell division, cell shape changes and cell rearrangements to morphogenesis was studied (Fristrom and Fristrom, 1993). During the larval period imaginal discs grow by mitotic cell divisions (Baena-Lopez et al., 2005; Bryant, 1970; Garcia-Bellido and Merriam, 1971). The discs have distinctive shapes but are relatively flat compared to the adult appendages they form. During the process of pupation the leg and wing discs undergo an eversion, in which the tissue turns inside out so that the apical surface of the epithelial cells faces outward (Condic et al., 1991; Fristrom and Chihara, 1978; Pastor-Pareja et al., 2004) and a process of elongation. A representation of this is drawn in Figure 1. The combined effect of these two processes has been called evagination (Fristrom and Fristrom, 1993) and we will use this term. Evagination takes place over a period of approximately 8 hours. Early studies on the eversion of the leg disc led Fristrom and colleagues to propose that cell rearrangements played a key role in producing convergent extension-like movements during evagination (Fristrom, 1976; Fristrom and Chihara, 1978). However, later experiments from the same lab argued that cell shape changes were responsible for almost all of the morphogenesis (Condic et al., 1991) making this system unusual. After evagination the cells secrete a thin pupal cuticle from their apical surface and after apolysis from this cuticle the detailed morphogenesis of the adult appendages take place (Fristrom and Fristrom, 1993; von Kalm et al., 1995). Recently, it was found that oriented cell divisions play a role in the shaping of appendages in Drosophila (Baena-Lopez et al., 2005). However, this is thought to take place during larval life and not during the short period of evagination. Indeed, there is evidence that there is a lack of cell division in the wing during evagination (Milan et al., 1996), and reviews on evagination typically do not focus on or mention the possible contribution of cell division. We have reexamined this process using genetic tools and reagents that were not available to earlier workers (Condic et al., 1991). Our observations show that both cell rearrangement and cell division are prominent during disc evagination.
Fig. 1.

Cartoon models of wing and leg eversion. Panels A-D show a wing disc (en face (A) and cross section (B-D) as it begins to evert (D). Arrows show the direction of eversion. Panels E - J are of legs. Third instar leg discs are shown en face (E) and in cross section (F). Panels G - J are cross sections of legs at progressively later stages in eversion.
Materials and Methods
Fly stocks
The omb-Gal4, ptc-Gal4 and UAS-GFP fly stocks were obtained from the Drosophila Stock Center in Bloomington. The stocks for generating MARCM (Lee and Luo, 2001) and flip out clones were also obtained from the stock center.
Clonal Analysis
MARCM clones (Lee and Luo, 2001) were generated by heat shocking w hs-flp; FRT42B UAS-MCD8-GFP/FRT42B Pi-myc Tub-Gal-80; Tub-Gal4/+ containing larvae 1-2 days prior to pupation. FRT mediated mitotic recombination results in the loss of the Tub-Gal-80 transgene. This relieves the GAL80 inhibition of GAL4 leading to the expression of GFP in clone cells. White prepupae were collected and aged until used. Flip out clones (Struhl and Basler, 1993) (Buenzow and Holmgren, 1994) were generated by heat shocking w hs-flp; AyGal4 UAS-GFP containing larvae. Most of our experiments utilized MARCM clones as these were brighter. All of the data presented in detail are from MARCM clones.
Cytological techniques
For experiments that examined fixed material white prepupae were collected and aged till the desired time. They were then dissected in phosphate buffered saline (PBS) followed by fixation with 4% paraformaldehyde in PBS. Antibody and phalloidin staining were carried out by standard approaches as described previously (He and Adler, 2001). Fluorescent secondary antibodies and fluorescent phalloidin for staining the actin cytoskeleton were obtained from Molecular Probes. Confocal images were obtained on an ATTO CARV confocal unit attached to a Nikon microscope.
in vivo imaging
White prepupae were collected and aged for 2-3 hrs. At this time the animals evert their spiracles, stop moving and begin the process of disc evagination. The animals were washed to remove fly food, rinsed with 95% ethanol and then air dired on filter paper. The animals were then attached to a glass microscope slide using double stick tape. A chamber was built around the pupae and then a cover slip was attached. The coverslip contained a small amount of 10% gelatin, 2% glycerol which solidified between the coverslip and the pupae, which provided a good optical preparation. This procedure was refined during the period the experiments were carried out and early experiments used slight modifications of this protocol. The pupae/chambers were examined using either a 20X water immersion objective or a 40X superfluor objective on a Nikon TE200 microscope equipped with an Atto spining disc confocal attachment. The use of the spinning disc confocal proved better than a standard laser scanning confocal as there was much less bleaching with the former. The Metamorph software was used for image acquisition and the analysis was carried out using Metamorph and Image J. In all experiments 3-D stacks of images were acquired as the complex morphology of the leg made this essential. In some experiments we carried out an automated time lapse with stacks acquired every 4 - 20 minutes. In other experiments we manually acquired stacks approximately every hour. Experiments routinely covered the period from 4 - 8 hr after white prepupae and sometimes were extended to much later time points. We routinely tried to get images from 3 - 4 hrs but this was more difficult. The pulsatile motion of the leg at this time often resulted in blurred images and individual planes within a stack did not line up properly. Further, when we were imaging MARCM clones it was difficult to predict at early times which clones would be good for long term imaging. In experiments where we imaged the omb domain in the leg this latter issue was not a problem. We did not have a temperature controlled microscope stage to use during the time lapse experiments and room temperature varied. Since the rate of Drosophila development is related to temperature the developmental timing in these experiments may not be completely accurate. Bleaching was only a major problem in those experiments where we obtained large numbers of optical sections at frequent intervals. After approximately 400 optical sections a noticeable decrease in image quality was seen. In such experiments, cells that were faint to start with were often no longer detectable at the end of the experiment. The analysis of the time lapse 3-D movies was complicated by movement of the leg which often resulted in changes in which optical section neighboring cells were well detected in. We could usually follow individual cells by examining the image stacks but generating a long term continuous 2-D time lapse movie that contained large groups of neighboring cells all of which remained in focus was not possible. Other groups have imaged disc eversion in vivo at low magnification using somewhat different approaches and for different reasons (Fortier et al., 2006; Ward et al., 2003).
Measurement of Wing and Leg Distances
Individual confocal sections of images taken with a 20X objective were used for the distance measurements on the wing. Image J was used to get an distance in arbitrary units. To minimize the effects of differences in the size of individual wings (as much as 50% in length) we normalized the data for each wing to the width at position W1 (this distance varied the least between time points (mean varied 20%) and between individual wings from the same time point (approximately 30%). Variation in wing size was due to variation in fixation and subsequent swelling/shrinkage and in part to inherrent differences in the size of wings (e.g. female wings are larger than male wings). The fixed and stained wings for these measurements were mounted under a coverslip and were relatively flat (as shown by examination of single optical sections in the confocal microscope), which facilitated the measurements.
To measure the number of cells at various locations along the ptc domain in wings at each landmark we used single optical section confocal images obtained with a 60X oil immersion objective. A line was drawn at the landmark perpendicular to the proximal - distal axis of the wing and we counted the number of cells it crossed. To determine the number of cells between the M1-M2 and M4-M5 landmarks a line parallel to the proximal distal axis was drawn between the pair of landmarks and the number of cells it crossed was counted. For each of the time points at least 10 stained wings were prepared but in several cases folding prevented an accurate count. Such wings were not scored. To measure the width of the omb domain in the basitarsus and tibia a similar strategy was followed as for the wing. In this case we measured the number of cells at the mid point of the leg segments. Once again due to folding the basitarsus and/or tibia on some legs could not be counted accurately and were not measured.
For measuring width/length ratios of wing and leg cells a line was drawn across the relevant section of an image of the appendage and the all cells the line crossed were exaxmined. We measured the distance along each axis of a line going through the center of the cell using Image J. For the tibia more than 20 cells were examined on each of 5 legs/wings, thus more than 100 cells were scored for each time point.
Analysis of Cell Division
We typically did not take frequent enough time points and did not use a fluorescent tag that labeled the spindle so we could not directly image the mitotic spindle or cell division. We inferred cell division by an increase in the number of fluorescent cells in a region. In the case of MARCM clones (Lee and Luo, 2001) we can be confident that a division took place. In MARCM clones we could usually be confident of which cell divided to give rise to a pair of daughter cells as one large cell was replaced by two smaller ones. We also made use of the fact that cells within the clone often differed in GFP brightness and this property was retained in the daughters. To estimate the fraction of cells within a clone that divided during evagination we counted the number of cells in a clone at 3.5 - 4.5 hrs and later at 8 - 9 hr.
We carried out two types of clonal analysis experiments to try to detect cell division in the prepupal wing. In one we induced flip out clones using Ay-GAL4 and UAS-GFP and then assayed the size of clones in 32 hr pupal wings. This protocol can mark cells in either G1, S or G2 and depending on the stage of induction either one or both of the daughter cells can be marked. In the alternative experiment we induced FLP/FRT mediated recombintation to generate cells homozygous for multiple wing hairs (mwh), a cell autonomous hair marker. Mitotic recombination events can are only recovered from cells in G2 and only one of the two daughter cells is marked.
To estimate the orientation of the division plane we used the angle measure tool in Image J. We determined the proximal-distal axis of the leg, and drew a line parallel to this stopping in the center of one daughter cell. A second line segment was then extended to the center of the second cell and the angle measured. We did this in a way so that all division angles were between 0 - 90 degrees.
Results
Wing Evagination
As an initial step in the analysis of wing evagination we examined fixed wings. As landmarks we used several sensory neurons, which we detected by using the 22C10 monoclonal antibody (Fujita et al., 1982). We measured the distances between these landmarks and the distal tip of the wing and also the width of the wing at several landmarks (Fig. 2). The distance between the distal tip of the wing and each landmark increased in a progressive fashion (Fig. 3A). That is, the largest increase was for the most proximal landmark M4 (GSR neuron) with progressively smaller increases for more distal landmarks M2 (ACV neuron) and M1 (L3-2 neuron). These observations show that elongation happens all along the proximal-distal axis of the wing and not in just a single region. There was also a slight decrease in the width of the wing proximally. The elongation could in principle be due to changes in cell shape, arrangement or number.
Fig. 2.

Wing evagination. Shown are 2, 4 and 8 hr prepupal wings as well as a 28 hr pupal wing for comparison. The wings were stained with the 22C10 monoclonal antibody which stains neurons. The locations of the various landmark cells are shown on the 2 hr (and in most cases later) images. The downward arrow points to landmark M1, the downward arrowhead to M2, the upward arrowhead to M3, the upward arrow to M4 and the oblique arrow to M5. The lines in the 4 hr image are examples of the M1 through M4 measurements. The lines in the 8 hr image show how the W1 and W2 distances were obtained. Note the dramatic change in the relative position of landmark M3 as development proceeded.
Fig. 3.

Quantitation of wing and leg evagination. Panel A shows the change in the ratio of wing landmark distances as a function of time (see Methods for more details). Error bars show the standard error of the mean. Note that the relative distance for all of the wing landmark neurons to the distal margin increase over time and the increases are larger for the more proximal landmarks consistent with elongation happening throughout the proximal distal axis. Time is in hr after white prepupae (wpp). The number of wings measured was 5, 8, 6, 11, 6, 6 and 12 for the 1, 2, 3, 4, 5, 7 and 8 hr time points respectively. Panel B show the width of the ptc domain at landmark neurons in the wing at 2, 4 and 8 hrs. The number of cells separating the M1 and M2 landmarks and the M4 and M5 landmarks are also shown. As in panel A the error bars show the standard error of the mean. Each of the W1, W2 and 1to2 points represent 8 to 10 independent measurements. The W4, W5 and 4to5 points represent 6 to 8 indpendent measurements (in some cases a measurement could not be made accurately for a particular time point due to the tissue not being flat at that location). Measurements that are significantly different from the previous measurement are indicated by an asterisks (* < 0.05, ** < 0.01). Note that there is a decrease in the width of the ptc domain from 2 to 4 hrs at all landmarks and an increase in the width from 4 to 8 hrs for several landmarks. Also note the substantial increase in the distance between landmarks. Panel C shows the width of the omb domain in the basitarsus and tibia at 2, 4, 6 and 8 hr. Error bars and significance indicated as in earlier panels. Each point represents counts from 6 - 8 legs. Panel D shows the distribution of division planes in leg clones. The most common division planes were from 46-60 degrees. The angle of the division plane was estimated for seventy nine divisions.
In looking at the images it is clear that there is a substantial relative change in the position of several of the sensory cells (Fig. 2). In particular sensory cell M3 (TSM1 neuron), which was located near the anterior margin of the wing moved proximally with respect to sensory cells M1, M2 and M4 that were located medially. This requires either movement of the sensory neuron cell bodies or rearrangement and/or movement of the epidermal cells carrying the neurons with them. If it is due to movement of the epidermal cells, then this movement would have to be non-uniform. For example, more cells in the center of the wing (i.e. near the anterior posterior compartment boundary and proximal to the medial marker M1) could undergo rearrangement than cells located laterally near the anterior margin.
We next examined evagination using wings that expressed GFP in the patched (ptc) domain, which served as a marker for cells in the center of the wing (Fig. 4). In the wing anlagen of the third instar wing disc (Bryant, 1975) the ptc domain is roughly uniform in width, which is also true for wings from white prepupae (wpp). However, the width of the ptc domain becomes quite uneven during evagination. To analyze these changes we counted the number of cells between landmarks M1 and M2 and between landmarks M4 and M5, and we also measured the width of the ptc domain at positions M1, M2, M4 and M5 at 2, 4 and 8 hrs after white prepupae formation. The distance between landmarks increased throughout the period. From 2 to 4 hr we observed a significant decrease in the width of the ptc domain. Thus, from 2 - 4 hr there was both extension and thinning, which suggests a convergent-extension type of cell rearrangement. For 3 of the 4 landmarks the width of the ptc domain subsequently increased from 4 to 8 hrs. This increase was not expected and is likely due to cell division (see below). It remains possible that localized cell division and localized cell death could be responsible for the extension and thinning of the ptc domain but this seems unlikely as we and others have failed to see substantial evidence of cell death in the wing blade at this stage (Milan et al., 1997). There is substantial cell to cell variation in shape within the wing ptc domain. We did not see any obvious and consistent change in cell shape during the elongation, but as a more rigorous test of this possibility we compared the average cell length (length along proximal/distal axis)/cell width (length along anterior/posterior axis) ratio of ptc domain cells located between M4 and M5 at 2, 4 and 8 hrs after wpp. No significant change in the average cell shape was seen although there was a trend to an increased ratio (l/w ratio 0.94 (std error = 0.0258), 0.955 (0.0316) and 0.982 (0.0298) at 2, 4 and 8 hrs respectively (>20 cells in each of 5 wings were examined for each time point)). Consistent with the observations of Condic et al. (Condic et al., 1991), the cross sectional shape of wing cells varied substantially along their apical/basal axis (data not shown).
Fig. 4.

Changes in the ptc domain during wing evagination: Panels show a wing disc from a third instar larvae (L), a white prepupae and from 2 and 8 hr after white prepuae. All preparations are of fixed material. In all panels green is GFP expressed using ptc-Gal4. In the lower 4 panels 22C10 antibody staining is shown in red. This antibody stains sensory neurons in the wing. In the upper two panels red is actin staining. The positions of the M1 and M2 (middle panels) and M4 and M5 cells are indicated by arrows and arrowheads. Note the large increase in the distance between M1 and M2, and M4 and M5 from 2 to 8 hr. Note also the decrease in the width of the ptc domain.
Leg Evagination
The extension of the leg is more dramatic than that of the wing, but the geometry of the leg makes this a more complicated tissue to study (Fig. 5). We used omb to drive expression of GFP in a stripe down the leg, as this results in a single stripe (as opposed to two stripes for ptc), and the stripe is located favorably for in vivo imaging as described below. Observations on both fixed and living prepupal legs showed clear evidence of thinning of the omb domain and extension along the proximal distal axis during evagination (Fig. 6). We measured the maximum width (in terms of the number of cells) of the omb domain in both the basitarsus and tibia at 2, 4, 6 and 8 hr after white prepuae (Fig. 3C). We observed a decrease in the number of cells across both segments (i.e. thinning) from 2 to 4 and from 4 to 6 hr followed by an increase (i.e. thickening) from 6 to 8 hr (Fig. 3C, 6). This is similar to what we saw for the wing.
Fig. 5.

Leg evagination. Showns are fixed legs from third instar larvae (L)(panel A), white prepupae (0) (B), 2 (C), 4 (D) and 30 hr (F) after white prepupae. The omb domain is in green and the legs are counterstained in red with phallodin, which stains the actin cytoskeleton.
Fig. 6.
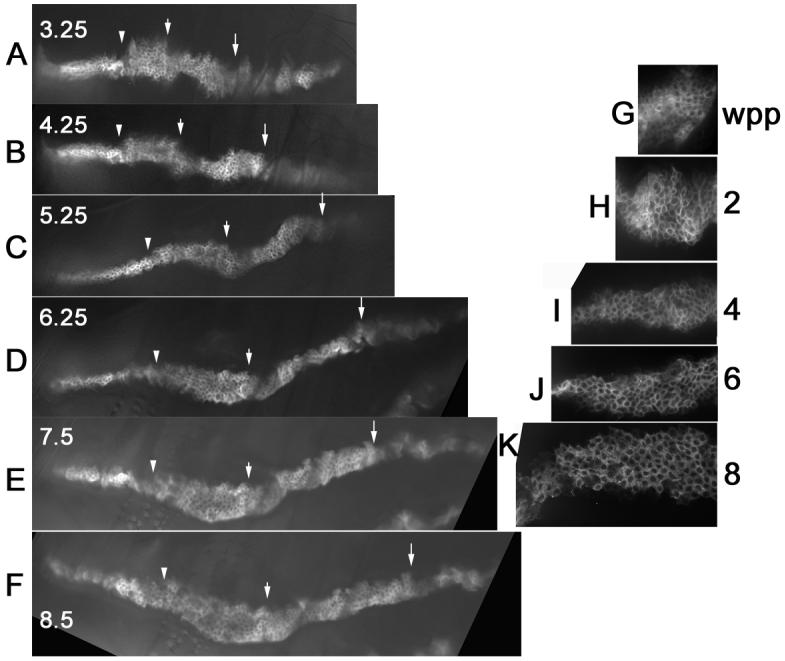
The omb domain and leg evagination. Panels A-F are from in vivo imaging of a prepupae that is expressing GFP in the omb domain. The panels show the tibia and basitarsus and parts of more distal tarsal segments. The time (in hr) after white prepupae is noted. The same location in the leg at the different time points is shown by arrowheads (mid-tibia), short arrows (tibia/basitarsus border) and long arrows (basitarsus/tarsus border). Note the lengthening and thinning of the omb domain from 3.25 to 5.25 hr. Note also the thickening and increase in cell number after 5.25 hr. Panels G-K show a fixed tibia from wpp, 2, 4, 6 and 8 hr legs. Note the early thinning and elongation followed by thickening. The spiral cell arrangement that is characteristic of pupal legs is visible by 6 hr.
We did not see consistent changes in cell shape, however, to explore this possibility further, we measured tibia cells within the omb domain along the proximal/distal axis (which we refer to as cell length) and along the anterior/posterior axis (which we refer to as cell width). Five legs were measured for each time point. The ratio of cell length to cell width was 0.914 (0.0222 (std error)) for tibial cells at 2 hr. This increased to 1.032 (0.0392) at 4 hr, 1.087 (0.0400) at 6 hr and 1.07 (0.0265) at 8 hr. The difference between the length/width ratio at 2 hr compared to the ratio at 6 (and 8) hr was significant (P<0.001). Thus, on average cells became more elongated along the proximal/distal axis and this should serve to elongate the tibia. The change was less than 20% and hence other factors such as cell rearrangement and division must also contribute to tibia elongation.
We found that we could follow some stages of leg evagination in vivo by imaging through the pupal case (Fig. 6). The moderately thick cuticle of the pupal case degraded the images but not so badly that we could not make useful observations. Additional difficulties in imaging leg evagination came from the legs being both three dimensional and not perfectly parallel to the surface of the pupal case. At early stages (0-2 hr) the legs were not close enough to the surface of the pupal case for us to image. By about 3 hrs we could detect the omb domain in legs in vivo by confocal microscopy, but the legs moved in a pulsatile fashion (see supplemental movie 1) which seriously hindered imaging. This pulsatile movement decreased over time and by around 4 hr after the white prepupae stage we could obtain good 3-D stacks of confocal images of the tibia and basitarsus. These leg segments were typically closest to the surface of the pupae. Observations from these time lapse experiments were consistent with our observations on fixed material (see supplemental movie 2). That is, we saw an initial thinning of the omb domain followed by a later increase in cell number (Fig. 5, 6). In some experiments we obtained 3-D stacks every 4-10 minutes using a 40X objective which allowed us to follow individual cells (see Methods). Analysis of these 4-D movies showed evidence for both cell rearrangement and cell division in cells of the omb domain ((Fig. 7, 8, 9) (Supplemental movies 3, 4, 5). One difficulty with this experimental approach was that almost all of the cells being followed were surrounded by cells that also expressed GFP. In other experiments, we generated clones of GFP expressing cells that served as a scattered label, which provided many labeled cells with at least some non-GFP expressing neighbors (see below). Only rarely did we detect the loss of a cell within the omb domain that appeared not to be due to the bleaching of a faint cell. The basis for this is unknown and the low frequency made it difficult to study.
Fig. 7.

Cell rearrangement during evagination. Shown are images from a prepupal leg at various times during a time lapse experiment. The experiment started at about 3 hrs awp. This is the same time lapse experiment that is presented in Supplementary Movie 3. The time in minutes since the beginning of the experiment is shown. The time points chosen were ones that were both informative and where essentially all of the 8 marked cells (and their progeny) were easily visible. Interpretive drawings are shown that identify 8 cells in each of the time points. The magenta cell from the interpretive drawing is marked on the micrographs by a small magenta circle. Two of the 8 cells divided and they are shown in the interpretive drawings as two cells of the same color.
Fig. 8.

Cell rearrangement and cell division: Panels A and B are of the same MARCM clone at 3.45 and 8 hr. A single optical plane from a stack is shown and some cells are out of the plane of focus. Panels a and b are interpretive drawings of the clone cells from panels A and B. Note the increase in cell number during this period. Panels C and D show a blow up of region 1 from panel A. The arrow in panel is parallel to the proximal/distal axis. The arrow in panel C points to a cell that has divided in panel D. The sister cells are indicated by arrowheads. Panels C and D were the time points right before and after the cell division. Interpretive drawings of the cells in panels C and D are shown in c and d. Panels E and F are a blow up of the cells from region 2 of panel A before and after these cells divide. Interpretive drawings of this are shown in panels e and f. Panels G, H and I are of a small region of the ptc domain from a tibia at three time points spread out over 30 minutes. Interpretive drawings of these images are shown in panels g, h and i. Note the rearrangement of cells resulting in the green and red cells touching each other in panel I, but not G. At the same time the purple and blue cells lose contact. Panels J and K are of part of a large MARCM clone 1 hr apart. Panels j and k are interpretive drawings. Once again note the change in cell neighbors with the purple and red cells losing contact with one another.
Fig. 9.

Cell movement during evagination. Panel A shows the initial and final positions of cells that could be followed throughout the movie provided in Supplemental Movie 4. The images were all aligned using the orange square cell (marked by an arrow) as an anchor. This simplified the analysis. The leg as a whole moved during the experiment and the slide needed to be re-centered several times. Cells are identified by the same symbols as in Supplementary Movie 4. The images are of cells in the omb domain of an evaginating tarsal segment. Panel B shows the position of a selected subset of cells every 4th time point (every 20 minutes). The earliest time point is identified by a thicker outline. Subsequent time points are over layed. Panel A shows the marked tendency for cells to move upward toward the anchored cell and both proximally and distally. This is as expected for elongation by cell intercalation. The movement was not consistent or sharply directed as is seen in Panel B. Panels C and D are the starting and final images from the movie. The asterisk marks the cell marked with an orange square in panels A and B.
We found that it was common for cells to change one or more neighbors during evagination. A number of time points from a small region of a tibia that we followed for about 4 hrs are shown in Fig. 7. Eight cells from this favorable region are marked. Only 2 of the marked cells divided during the experiment. The overall shape of this collection of cells goes from being slighted elongated across the omb domain (in a generally 3 by 3 cell array) to being elongated along the proximal distal axis (in a generally 2/3 by 4 cell array). Each of the 8 cells gained or lost at least one neighbor during this period, although these changes were sometimes transient and reversed. A good example of intercalation is the separation of the pink and magenta cells by the intercalation of the light blue and light green cells. A smaller and shorter example of cells changing neighbors, with somewhat better morphology is shown Fig. 8D. The rearrangements seen in the prepupal leg at least superficially resemble the junctional remodeling that is seen during germ band extension (Bertet et al., 2004; Pilot and Lecuit, 2005).
To analyze cell movement/rearrangement it was useful to anchor individual time points by using a single cell to align the images. The leg as a whole moved during experiments and the anchoring was used to correct for this. In the time lapse presented in Fig 9 we used the square orange cell as the anchor. This cell was located at one edge of the omb domain and in the middle of the region along the proximal distal axis of the tibia. Note that during the time lapse the omb domain thinned and elongated. This involved cells within the omb domain intercalating with one another perpendicular to the proximal/distal axis. There were 61 cells located below the square orange cell as pictured in Fig 9. Fifty six of these (∼92%) moved upward during the time lapse experiment. This resulted in almost all of the cells getting closer to the level of the anchored cell. This is as expected if intercalation was part of the mechanism that resulted in the omb domain thinning along the anterior/posterior axis. As expected for elongation by an intercalation mechanism, cells typically moved further away from the anchored cell along the proximal distal axis. There were 24 cells located distal to the anchored cell at the start of the time lapse and 23.5 (we counted daughter cells as ½ a cell) (∼98%) of these cells moved in the distal direction away from the anchored cell. There were 40 cells that were initially located proximal to the anchored cell. Twenty four (60%) moved in the proximal direction away from the anchored cell. Sixteen of the proximal cells moved distally toward (and in some cases past) the anchored cell. Most of these were located near the bottom of the omb domain in a region where all of the cells moved in a similar direction. It is important to note that the movement was not consistent or highly directed (Fib 9B). Between any time points cells could move opposite to the general trend or move barely if at all. There are many examples of cell intercalation and cells acquiring new neighbors that can be found in Figure 9. For example, on the proximal edge of the field the five tip yellow star cell is directly above the 4 tip dark blue star at time 0. At the end of the experiment five tip yellow star cell is proximal to the four tip dark blue cell and they are now separated by one of the pink circle daughter cells (and an unlabelled cell). Near by note the magenta circle cell is directly above the 5 tip dark blue star cell at time 0. At the end of the experiment the magenta circle cell is proximal to the dark blue 5 tip star cell and they have been separated by one of the daughters of the 4 tip light blue star cell. Quite a few of the cells followed in the experiment shown divided during the time course. In general daughter cells moved in a similar direction. For example, the cells marked by the pink and yellow circles in Fig. 9. Two pairs of daughter cells that did not follow this pattern (red triangle, green circle) were located close to the anchored cell along the proximal distal axis. In both cases one daughter cell moved proximally and one distally. Our results suggest that cells in the leg as a whole intercalate to thin and lengthen the tissue but that at the level of individual cells the detailed movement is variable and not strictly specified.
Cell Division in Evaginating Legs
The analysis of both fixed and living legs described above showed a clear increase in the number of omb domain cells in the tibia and basitarsus between 4-8 hr of development (Fig. 3C). A limitation of these studies is that the frequency of time points and the difficulties in imaging prevented us from following cells in the process of division (e.g. visualizing the mitotic spindle). Rather cell divisions were inferred from the presence of an additional cell that (usually) correlated with a decrease in size of a neighboring cell. An alternative possible explanation is that cells from outside the omb domain could migrate into the domain and start expressing omb and subsequently GFP. We thought this unlikely since many new cells were first seen in the middle of the omb domain and not at its edge. To get definitive data on this possibility we induced small clones of GFP expressing cells using the MARCM (Lee and Luo, 2001) or the flip out (Struhl and Basler, 1993) (Buenzow and Holmgren, 1994) techniques and followed these during evagination. We found that the size of the MARCM clones increased during evagination confirming that cell division was taking place during evagination (Fig. 8). We scored 34 MARCM clones (which contained a total of 358 cells at the earliest time point) and found an average increase in cell number of 1.4 fold during the 4 - 8/9 hr period. The fraction of cells that divided varied greatly from clone to clone. Five of the 34 clones did not increase in cell number. These were a minority of the small clones (5 of 16 clones that contained 6 cells or fewer when first detected failed to show an increase in cell number), while all clones larger than 6 cells in size showed an increase in cell number. The lack of cell division among the cells in these clones was not due to a problem with the animal, as all of the animals scored in these experiments survived to the pharate adult stage and other clones in the same animal did show cell division. In 11 of the 34 clones, a majority of the cells must have divided to account for the increase in cell number. The reason for the variation is unclear. Clones that fell into both of the above classes could be found on the same leg and on different legs in the same pupae. The fraction of dividing cells seen in these experiments is consistent with results from our time lapse imaging of cells within the omb domain (Fig. 5, 6, 7).
Cell Division in Evaginating Wings
The geometry of the wing in the prepupa did not allow us to successfully image its evagination. Our observations on the increase in the thickness of the ptc domain from 4 to 8 hrs after white prepupae suggested that wing cells were dividing during this time period. Since we could not confirm this by in vivo imaging of prepupal wing cells we used two alternative approaches to mark cells. In the first we induced flip-out clones that expressed GFP at white prepupae and in newly formed pupae shortly after head eversion (∼ 12-14 hrs apf) and then used confocal microscopy to scored clone size in 30 - 32 hr pupal wings. By this time all cell division in the wing has ended and the pupal wings are easy to dissect and examine. Clones induced at white prepupae averaged 2.4 cells/clone (n=143, SE=0.757) which was significantly (p>0.01) larger than clones induced in young pupae (1.7 cells/clone, n=136, SE=0.059). The difference is consistent with approximately 40% of wing blade cells dividing in the white prepupal period. As an alternative approach we used FLP/FRT to induce the formation of multiple wing hairs (mwh) clones at white prepupae and in young pupae. We found mwh clones in all wing regions showing that cell division is not restricted to a small part of the wing. The mwh clones induced at white prepupae averaged 2.06 cells/clone (n=232, SE 0.0585), which was significantly (p>0.01) larger than the mwh clones induced in the young pupae (average size 1.44 cells/clone, n=196, SE=0.0397). Once again, clone size was approximately 40% higher when clones were induced at white prepupae (see the methods for a discussion of why clone size measured in these two types of experiments are not expected to be the same). Thus, it also appears that cell division takes place in the prepupal wing during evagination.
Orientation of Leg Cell Divisions
Although our observations on the MARCM clones did not allow us to visualize the spindle in the dividing cells we could routinely identify the two daughter cells (one large cell replaced by 2 small ones) and hence infer the orientation of the spindle. The orientation of the cell divisions was not preferentially along the extending axis of the leg. Indeed, the divisions usually resulted in an increase in the number of cells both parallel and perpendicular to the axis of elongation. The most common orientations for the daughter cells were between 46-60 degrees (Fig. 3D). This could be related to the spiral arrangement of cells seen in pupal legs and the spiral patterns of preferential accumulation of planar polarity proteins in pupal legs (see Fig. 6 in (He and Adler, 2002)).
Discussion
Cell Rearrangement Plays a Major Role in Evagination
We have established that cell rearrangement takes place during leg and wing evagination and contributes to the thinning and extension of the appendages. Our observations are consistent with the pioneering results of Fristrom (Fristrom, 1976) on evagination. Our data also established that cell rearrangement takes place throughout the appendage and is not restricted to a particular region along the proximal-distal axis. However, our observations are also consistent with cell rearrangement being non-uniform as some regions appeared to “thin” more than others. For example, in the wing the width of the ptc domain at position M5 thinned more than at position M4 (Fig. 3). The evaginating leg and wing cells retain their epithelial morphology with extensive apical junctional complexes. Rearrangement requires that cells change neighbors and hence must remove old junctions and generate new ones while maintaining tissue integrity. This problem is not restricted to evaginating discs but is a general one for epithelial tissues, and is an issue that has concerned Developmental/Cell Biologists for many years (Fristrom, 1982). Important insights into how this could be accomplished come from recent observations on germ band elongation in the Drosophila embryo. Several groups have provided evidence that junctional remodeling plays a key role in cell rearrangement in this epithelial tissue (Bertet et al., 2004; Blankenship et al., 2006; Pilot and Lecuit, 2005). This mechanism also appears to function in the re-packing of pupal wing cells (Classen et al., 2005). We suggest it also plays a role in leg and wing evagination. We did not see clear evidence for the multi-cellular rosettes that Blankenship et al. have implicated in germ band extension (Blankenship et al., 2006). Perhaps this is due to disc evagination being substantially slower than germ band extension.
We did not see evidence of dramatic coordinated changes in cell shape (e.g. Fig. 4, 6). There was a small but significant increase in the length along the proximal/distal axis of evaginating omb domain tibia cells that should contribute to elongation. However, the change was not large enough to account for leg morphogenesis. We did not see a significant change in cell shape in evaginating ptc domain wing cells although there was a hint of a possible small effect. It is worth noting that in our measurements we included cells from all positions along the relevant part of the proximal/distal axis. Casual observation suggested that there might be small regions with consistent changes but these would likely be counter balanced by changes in shape elsewhere in the domain. It is not clear why our results differ from those of Condic et al. (Condic et al., 1991), although the two studies differed in the times and regions of the leg emphasized and in experimental approaches.
We were not able to image the earliest stages of leg disc evagination or the disc cells that form ventral thorax. Thus, our observations were not able to distinguish between the two proposed mechanisms of eversion (i.e spreading (Fristrom and Chihara, 1978) vs. invasion (Pastor-Pareja et al., 2004) hypotheses).
Patterned cell death could in principle play an important role in disc evagination. Previous studies have not seen evidence for patterned cell death during wing blade evagination (Milan et al., 1997) and our observations support this conclusion. Cell death has been detected in evaginating legs but this is restricted to the regions of the tarsal segments where the leg joints form (Manjon et al., 2007) and hence is unlikely to contribute to the overall thinning of the omb domain of leg segments.
Cell Division During Evagination
Based on the literature (e.g. (Milan et al., 1996)) we did not expect cell division to be taking place during evagination, but our observations showed that it occurred. Our most definitive experiments involved generating clones of cells marked by GFP expression and following these in vivo. These experiments provided compelling evidence for cell division. This was only done for the leg but other experiments provided strong evidence for cell division in evaginating wings. The size of wing clones was larger when they were induced at white prepupae than at the formation of the definitive pupae. Cell division was not rare in evaginating legs, and on average about 40% of the cells divided. Indeed, a majority of the cells divided in about 1/3 of clones examined. This amount of cell division is sufficient to account for the thickening of the omb domain that we observed from 6 to 8 hrs in developing legs. Our observations on the size of wing clones suggested a similar fraction of wing cells divided during evagination. A limitation is that our in vivo imaging technique only allowed us to effectively image clones on the leg surface juxtaposed to the pupal case in the basitarsus and tibia (and occasionally tarsal) segments. Thus, we could not obtain data for much of the leg disc derivatives, and hence we cannot confidently estimate the overall proportion of evaginating leg cells that divide. We did not image the spindle in these dividing cells but inferred that the spindle was not oriented parallel to the elongating axis based on the position of the resulting daughter cells shortly after division. The two daughter cells usually filled up the area taken up by the parental cell prior to division, which helped in assigning a lineage. The leg epidermis is continuous without free “space”. Hence, that daughter cells would occupy the space of the parental cell is not surprising. A parallel orientation for the spindle might be expected if the cell division plane was tightly linked to the mechanism of elongation. The inferred orientation of the cell divisions was most often between 46-60 degrees. Thus, they would increase the number of cells both along the proximal-distal and anterior/posterior (and dorsal/ventral) axes. In the second day pupal leg, the width of the omb domain was narrower than it was in the evaginating leg. This could be a reflection of a later stage of convergent extension. However, we have not followed legs throughout this period, so we cannot rule out other possibilities. It is interesting to note that cells in the pupal tibia and basitarsus have a spiral arrangement (He and Adler, 2002), and this appears to arise from 6 - 8 hr after white prepupae. Thus, this arrangement could be at least in part a consequence of the orientation of the cell divisions.
The fraction of dividing cells varied widely from one clone to another. This was not correlated with particular pupae or legs as both clones where a majority of the cells divided and clones where no cells divided were found in the same pupae and on the same leg. One possibility is that the variation is due to region specific differences. For example, cells in one region of the leg might never divide during evagination while a majority of cells in another region might always divide. We did not see evidence for this but our experiments were not compelling on this point. The observations on the omb domain did not examine a majority of leg cells and in the experiments where we followed MARCM clones we could not routinely tell exactly where on the leg a clone was located. A second possibility is that the variation is due to the clustered distribution of S phase and mitotic cells in wing and leg discs (Adler and MacQueen, 1981; Mathi and Larsen, 1988; Milan et al., 1996). Any small clone could comprise a cluster (or not contain a cluster) and this could lead to a great deal of variation in observed cell division. The basis for the clustering is uncertain but could simply represent a pseudo synchronization due to neighboring sister cells having been born at the same time.
Multiple Mechanisms of Evagination
Our observations suggest that several different factors play a role in evagination. At the start of evagination, the leg and wing discs are folded and some of the initial elongation is due to an unfolding of the tissue that presumably results from changes in the shape of cells along the apical-basal axis. During the period when leg discs evert and present the apical surface of their epithelial cells to the outside, elongation is also taking place (Fig.1) and there is active pulsatile movement. This appears to be related to the movement of hemolymph in the prepupae and blood cells can often be seen to move in step with the pulses. This suggests that hydraulic pressure could be playing a role in eversion and elongation. The leg resembles a cylinder closed on one side (distal tip) and open to the body on the other (proximal). Thus, we expect hemolymph pumped by the heart to produce a mechanical force that could help evert and/or elongate the leg. The pulsatile movement starts to decrease at about 4 - 4.5 hr after white prepupae and largely ends by about 5 hr. This is around the time of eversion, but the slowing clearly precedes eversion. We suggest that the hydraulic pressure of the hemolymph helps drive the early stages of evagination, when the leg is short and unfolding of the tissue plays a major role. It is possible that after this time the increased leg length or increased leg stiffness limits the effectiveness of hemolymph hydraulic pressure. Alternatively, it is possible that there is a decline in the hydraulic pressure due to changes in heart pumping or other prepupal events. The lack of hydraulic pressure may be one reason for the less than optimal evagination of discs seen during in vitro culture (JT and PNA, unpublished observations).
Genes That Might Regulate Cellular Rearrangement
Mutations in many Drosophila genes result in changes in appendage morphology. We expect that some of these produce their phenotype by interfering with the observed cell rearrangement. A particularly interesting candidate for such a gene is dachsous (ds), which encodes a large protein with many cadherin domains (Clark et al., 1995). Mutations in this gene result in shorter fatter wings and legs with an altered distribution of cells (e.g. an increase in the number of cells along the anteior posterior axis of the wing and a decrease in the number of cells along the proximal-distal axis) (unpublished observations). However, mutations in this gene are known to alter disc patterning and growth (Cho and Irvine, 2004; Matakatsu and Blair, 2004; Matakatsu and Blair, 2006; Rodriguez, 2004) and this may be the cause of the altered shape.
Another group of interesting candidate genes for altering cell rearrangement in evaginating legs are the cellular myosin encoded by zipper and the interacting Sqh (myosin regulatory light chain) (Karess et al., 1991) and RhoA proteins. Mutations in these genes give rise to a crooked leg phenotype that has been interpreted as being due to the mutations altering cell shape (Bayer et al., 2003; Edwards and Kiehart, 1996; Halsell et al., 2000; von Kalm et al., 1995). However, myosin has been implicated in the junctional remodeling associated with cell rearrangements in the extending germ band (Bertet et al., 2004; Blankenship et al., 2006; Zallen and Wieschaus, 2004) and it is possible that the leg phenotype is also due to an effect on junctional remodeling required for cell rearrangement. One of the interesting properties of extending germ band cells is the planar polarization of membranes so that the anterior/posterior edges of cells are distinct from the dorsal/ventral edges of cells in their content of proteins such as myosin (Blankenship et al., 2006; Zallen and Wieschaus, 2004). We did not see evidence for this in prepupal legs and wings but this point deserves further study as it is possible our experimental conditions were not favorable for seeing this.
Supplementary Material
Supplemental Movie 1. The movie is of a 4 hr awp prepupal leg and was taken with a 10X apo objective. The animal is omb-Gal4 UAS-mCD8-GFP. The time lapse consists of images taken every second for 40 seconds. The movie was made using Image J.
Supplemental Movie 2. The movie is from an experiment where a Z section series was obtained every 20 minutes for 4 hours. The images were obtained using a 20X multi-immersion objective. The best optical section from each section series was selected and a stack and movie created using Image J.
Supplemental Movie 3. The movie is from an experiment where a Z section was obtained every 5 minutes for 4 hr 10 min. The images were obtained using a 40X oil immersion objective. The best optical section was selected from each series section.
Supplemental Movie 4. The movie is an annotated version of Supplemental Movie 3. Individual cells were traced using the entire set of images in each stack and then marked on the image using Adobe Illustrator. Individual files were exported from Illustrator to tif files which were then combined into a movie. Each cell was given a unique shape/color.
Supplemental Movie 5. This movie consists of the cell lineages drawing from Movie 4 without the background images of the cells.
Acknowledgments
We thank Ray Keller for his encouragement and advice during the experiments and in writing up the paper. We also the reviewers for their many comments that helped improve the paper. This work was supported by a grant from the NIGMS to PNA.
Footnotes
Publisher's Disclaimer: This is a PDF file of an unedited manuscript that has been accepted for publication. As a service to our customers we are providing this early version of the manuscript. The manuscript will undergo copyediting, typesetting, and review of the resulting proof before it is published in its final citable form. Please note that during the production process errors may be discovered which could affect the content, and all legal disclaimers that apply to the journal pertain.
References
- Adler PN, MacQueen M. Partial coupling of the cell cycles of neighboring imaginal disc cells. Exp. Cell Res. 1981;133:452–456. doi: 10.1016/0014-4827(81)90340-2. [DOI] [PubMed] [Google Scholar]
- Baena-Lopez LA, Baonza A, Garcia-Bellido A. The orientation of cell divisions determines the shape of Drosophila organs. Curr Biol. 2005;15:1640–4. doi: 10.1016/j.cub.2005.07.062. [DOI] [PubMed] [Google Scholar]
- Bayer CA, Halsell SR, Fristrom JW, Kiehart DP, von Kalm L. Genetic interactions between the RhoA and Stubble-stubbloid loci suggest a role for a type II transmembrane serine protease in intracellular signaling during Drosophila imaginal disc morphogenesis. Genetics. 2003;165:1417–32. doi: 10.1093/genetics/165.3.1417. [DOI] [PMC free article] [PubMed] [Google Scholar]
- Bertet C, Sulak L, Lecuit T. Myosin-dependent junction remodelling controls planar cell intercalation and axis elongation. Nature. 2004;429:667–71. doi: 10.1038/nature02590. [DOI] [PubMed] [Google Scholar]
- Blankenship JT, Backovic ST, Sanny JS, Weitz O, Zallen JA. Multicellular rosette formation links planar cell polarity to tissue morphogenesis. Dev Cell. 2006;11:459–70. doi: 10.1016/j.devcel.2006.09.007. [DOI] [PubMed] [Google Scholar]
- Brown RC, Lemmon BE, Nguyen H. Events during the first four rounds of mitosis establish three developmental domains in the syncytial endosperm of Arabidopsis thaliana. Protoplasma. 2003;222:167–74. doi: 10.1007/s00709-003-0010-x. [DOI] [PubMed] [Google Scholar]
- Bryant PJ. Cell lineage relationships in the imaginal wing disc of Drosophila melanogaster. Dev Biol. 1970;22:389–411. doi: 10.1016/0012-1606(70)90160-0. [DOI] [PubMed] [Google Scholar]
- Bryant PJ. Pattern formation in the imaginal wing disc of Drosophila melanogaster: fate map, regeneration and duplication. J. exp. Zool. 1975;193:49–77. doi: 10.1002/jez.1401930106. [DOI] [PubMed] [Google Scholar]
- Buenzow D, Holmgren R. Characterization of gooseberry-proximal lineages in the CNS using FLP mediated site-specific recombination; A. Dros. Res. Conf. 35; 1994.p. 15. [Google Scholar]
- Cho E, Irvine KD. Action of fat, four-jointed, dachsous and dachs in distal-to-proximal wing signaling. Development. 2004;131:4489–500. doi: 10.1242/dev.01315. [DOI] [PubMed] [Google Scholar]
- Clark HF, Brentrup D, Schneitz K, Bieber A, Goodman C, Noll M. Dachsous encodes a member of the cadherin superfamily that controls imaginal disc morphogenesis in Drosophila. Genes Dev. 1995;9:1530–42. doi: 10.1101/gad.9.12.1530. [DOI] [PubMed] [Google Scholar]
- Classen AK, Anderson KI, Marois E, Eaton S. Hexagonal packing of Drosophila wing epithelial cells by the planar cell polarity pathway. Dev Cell. 2005;9:805–17. doi: 10.1016/j.devcel.2005.10.016. [DOI] [PubMed] [Google Scholar]
- Concha ML, Adams RJ. Oriented cell divisions and cellular morphogenesis in the zebrafish gastrula and neurula: a time-lapse analysis. Development. 1998;125:983–94. doi: 10.1242/dev.125.6.983. [DOI] [PubMed] [Google Scholar]
- Condic ML, Fristrom D, Fristrom JW. Apical cell shape changes during Drosophila imaginal leg disc elongation: a novel morphogenetic mechanism. Development. 1991;111:23–33. doi: 10.1242/dev.111.1.23. [DOI] [PubMed] [Google Scholar]
- Edwards KA, Kiehart DP. Drosophila nonmuscle myosin II has multiple essential roles in imaginal disc and egg chamber morphogenesis. Development. 1996;122:1499–511. doi: 10.1242/dev.122.5.1499. [DOI] [PubMed] [Google Scholar]
- Fortier TM, Chatterjee R, Klinedinst S, Baehrecke EH, Woodard CT. how functions in leg development during Drosophila metamorphosis. Dev Dyn. 2006 doi: 10.1002/dvdy.20852. [DOI] [PubMed] [Google Scholar]
- Fristrom D. The mechanism of evagination of imaginal discs of Drosophila melanogaster. III. Rvidence for cell rearrangement. Dev. Biol. 1976;54:163–171. doi: 10.1016/0012-1606(76)90296-7. [DOI] [PubMed] [Google Scholar]
- Fristrom D. Septate Junctions in Imaginal Disks of Drosophila: A Model for the Redistribution of Septa during Cell Rearrangement. J. Cell Biol. 1982;94:77–87. doi: 10.1083/jcb.94.1.77. [DOI] [PMC free article] [PubMed] [Google Scholar]
- Fristrom D, Chihara C. The mechanism of evagination of imaginal discs of Drosophila melanogaster. V. Evagination of disc fragments. Dev Biol. 1978;66:564–70. doi: 10.1016/0012-1606(78)90261-0. [DOI] [PubMed] [Google Scholar]
- Fristrom DK, Fristrom JW. The metamorphic development of the adult epidermis. Bate, Martinez Arias, 1993; 1993.pp. 843–897. [Google Scholar]
- Fujita SC, Zipursky SL, Benzer S, Ferrus A, Shotwell SL. Monoclonal antibodies against the Drosophila nervous system. Proc. Natl. Acad. Sci. USA. 1982;79:7929–7933. doi: 10.1073/pnas.79.24.7929. [DOI] [PMC free article] [PubMed] [Google Scholar]
- Garcia-Bellido A, Merriam JR. Parameters of the wing imaginal disc development of Drosophila melanogaster. Dev Biol. 1971;24:61–87. doi: 10.1016/0012-1606(71)90047-9. [DOI] [PubMed] [Google Scholar]
- Gong Y, Mo C, Fraser SE. Planar cell polarity signalling controls cell division orientation during zebrafish gastrulation. Nature. 2004;430:689–93. doi: 10.1038/nature02796. [DOI] [PubMed] [Google Scholar]
- Halsell SR, Chu BI, Kiehart DP. Genetic analysis demonstrates a direct link between rho signaling and nonmuscle myosin function during drosophila morphogenesis. Genetics. 2000;156:469. doi: 10.1093/genetics/156.1.469. [DOI] [PMC free article] [PubMed] [Google Scholar]
- He B, Adler PN. Cellular mechanisms in the development of the epithelial arista. Mechanisms of Development. 2001 doi: 10.1016/s0925-4773(01)00368-9. [DOI] [PubMed] [Google Scholar]
- He B, Adler PN. The frizzled pathway regulates the development of arista laterals. BMC Dev Biol. 2002;2:7. doi: 10.1186/1471-213X-2-7. [DOI] [PMC free article] [PubMed] [Google Scholar]
- Karess RE, Chang XJ, Edwards KA, Kulkarni SJ, Aguilera I, Kiehart DP. The regulatory light chain of nonmuscle myosin is encoded by spaghetti-squash, a gene required for cytokinesis in Drosophila. Cell. 1991;65:1177–1189. doi: 10.1016/0092-8674(91)90013-o. [DOI] [PubMed] [Google Scholar]
- Keller R. Shaping the vertebrate body plan by polarized embryonic cell movements. Science. 2002;298:1950–4. doi: 10.1126/science.1079478. [DOI] [PubMed] [Google Scholar]
- Keller R. Cell migration during gastrulation. Curr Opin Cell Biol. 2005;17:533–41. doi: 10.1016/j.ceb.2005.08.006. [DOI] [PubMed] [Google Scholar]
- Keller R. Mechanisms of elongation in embryogenesis. Development. 2006;133:2291–2302. doi: 10.1242/dev.02406. [DOI] [PubMed] [Google Scholar]
- Keller R, Davidson LA, Shook DR. How we are shaped: the biomechanics of gastrulation. Differentiation. 2003;71:171–205. doi: 10.1046/j.1432-0436.2003.710301.x. [DOI] [PubMed] [Google Scholar]
- Keller RE. The cellular basis of amphibian gastrulation. Dev Biol (N Y 1985) 1986;2:241–327. doi: 10.1007/978-1-4613-2141-5_7. [DOI] [PubMed] [Google Scholar]
- Lee T, Luo L. Mosaic analysis with a repressible cell marker (MARCM) for Drosophila neural development. Trends Neurosci. 2001;24:251–4. doi: 10.1016/s0166-2236(00)01791-4. [DOI] [PubMed] [Google Scholar]
- Manjon C, Sanchez-Herrero E, Suzanne M. Sharp boundaries of Dpp signalling trigger local cell death required for Drosophila leg morphogenesis. Nat Cell Biol. 2007;9:57–63. doi: 10.1038/ncb1518. [DOI] [PubMed] [Google Scholar]
- Matakatsu H, Blair SS. Interactions between Fat and Dachsous and the regulation of planar cell polarity in the Drosophila wing. Development. 2004;131:3785–94. doi: 10.1242/dev.01254. [DOI] [PubMed] [Google Scholar]
- Matakatsu H, Blair SS. Separating the adhesive and signaling functions of the Fat and Dachsous protocadherins. Development. 2006;133:2315–24. doi: 10.1242/dev.02401. [DOI] [PubMed] [Google Scholar]
- Mathi SK, Larsen E. Patterns of cell division in imaginal discs of Drosophila. Tissue Cell. 1988;20:461–72. doi: 10.1016/0040-8166(88)90077-8. [DOI] [PubMed] [Google Scholar]
- Milan M, Campuzano S, Garcia-Bellido A. Cell cycling and patterned cell proliferation in the wing primordium of Drosophila. Proc Natl Acad Sci U S A. 1996;93:640–5. doi: 10.1073/pnas.93.2.640. [DOI] [PMC free article] [PubMed] [Google Scholar]
- Milan M, Campuzano S, Garcia-Bellido A. Developmental parameters of cell death in the wing disc of Drosophila. Proc Natl Acad Sci U S A. 1997;94:5691–6. doi: 10.1073/pnas.94.11.5691. [DOI] [PMC free article] [PubMed] [Google Scholar]
- Pastor-Pareja JC, Grawe F, Martin-Blanco E, Garcia-Bellido A. Invasive cell behavior during Drosophila imaginal disc eversion is mediated by the JNK signaling cascade. Dev Cell. 2004;7:387–99. doi: 10.1016/j.devcel.2004.07.022. [DOI] [PubMed] [Google Scholar]
- Pilot F, Lecuit T. Compartmentalized morphogenesis in epithelia: from cell to tissue shape. Dev Dyn. 2005;232:685–94. doi: 10.1002/dvdy.20334. [DOI] [PubMed] [Google Scholar]
- Rodriguez I. The dachsous gene, a member of the cadherin family, is required for Wg-dependent pattern formation in the Drosophila wing disc. Development. 2004;131:3195–206. doi: 10.1242/dev.01195. [DOI] [PubMed] [Google Scholar]
- Rose LS, Kemphues K. The let-99 gene is required for proper spindle orientation during cleavage of the C. elegans embryo. Development. 1998;125:1337–46. doi: 10.1242/dev.125.7.1337. [DOI] [PubMed] [Google Scholar]
- Sausedo RA, Smith JL, Schoenwolf GC. Role of nonrandomly oriented cell division in shaping and bending of the neural plate. J Comp Neurol. 1997;381:473–88. [PubMed] [Google Scholar]
- Schoenwolf GC, Alvarez IS. Roles of neuroepithelial cell rearrangement and division in shaping of the avian neural plate. Development. 1989;106:427–39. doi: 10.1242/dev.106.3.427. [DOI] [PubMed] [Google Scholar]
- Schoenwolf GC, Yuan S. Experimental analyses of the rearrangement of ectodermal cells during gastrulation and neurulation in avian embryos. Cell Tissue Res. 1995;280:243–51. doi: 10.1007/BF00307795. [DOI] [PubMed] [Google Scholar]
- Shih J, Keller R. Cell motility driving mediolateral intercalation in explants of Xenopus laevis. Development. 1992;116:901–14. doi: 10.1242/dev.116.4.901. [DOI] [PubMed] [Google Scholar]
- Struhl G, Basler K. Organizing activity of wingless protein in Drosophila. Cell. 1993;72:527–540. doi: 10.1016/0092-8674(93)90072-x. [DOI] [PubMed] [Google Scholar]
- von Kalm L, Fristrom D, Fristrom J. The making of a fly leg: a model for epithelial morphogenesis. Bioessays. 1995;17:693–702. doi: 10.1002/bies.950170806. [DOI] [PubMed] [Google Scholar]
- Ward RE, Reid P, Bashirullah A, D’Avino PP, Thummel CS. GFP in living animals reveals dynamic developmental responses to ecdysone during Drosophila metamorphosis. Dev Biol. 2003;256:389–402. doi: 10.1016/s0012-1606(02)00100-8. [DOI] [PubMed] [Google Scholar]
- Wilson EB. The Cell in Development and Inheritance. Macmillan Company; Norwood, MA: 1900. [Google Scholar]
- Zallen JA, Wieschaus E. Patterned gene expression directs bipolar planar polarity in Drosophila. Dev Cell. 2004;6:343–55. doi: 10.1016/s1534-5807(04)00060-7. [DOI] [PubMed] [Google Scholar]
Associated Data
This section collects any data citations, data availability statements, or supplementary materials included in this article.
Supplementary Materials
Supplemental Movie 1. The movie is of a 4 hr awp prepupal leg and was taken with a 10X apo objective. The animal is omb-Gal4 UAS-mCD8-GFP. The time lapse consists of images taken every second for 40 seconds. The movie was made using Image J.
Supplemental Movie 2. The movie is from an experiment where a Z section series was obtained every 20 minutes for 4 hours. The images were obtained using a 20X multi-immersion objective. The best optical section from each section series was selected and a stack and movie created using Image J.
Supplemental Movie 3. The movie is from an experiment where a Z section was obtained every 5 minutes for 4 hr 10 min. The images were obtained using a 40X oil immersion objective. The best optical section was selected from each series section.
Supplemental Movie 4. The movie is an annotated version of Supplemental Movie 3. Individual cells were traced using the entire set of images in each stack and then marked on the image using Adobe Illustrator. Individual files were exported from Illustrator to tif files which were then combined into a movie. Each cell was given a unique shape/color.
Supplemental Movie 5. This movie consists of the cell lineages drawing from Movie 4 without the background images of the cells.