

Abstract
Upon drug activation, the nuclear pregnane X receptor (PXR) regulates not only hepatic drug but also energy metabolism. Using Pxr-/- mice, we have now investigated the PXR-mediated repression of lipid metabolism in the fasting livers. Treatment with PXR activator pregnenolone 16α-carbonitrile (PCN) down-regulated the mRNA levels of carnitine palmitoyltransferase 1 A (CPT1A, in β-oxidation) and mitochondrial 3-hydroxy-3-methylglutarate CoA synthase 2 (HMGCS2, in ketogenesis) in the wild type (Pxr+/+) mice only. In contrast, the stearoyl-Coenzyme A desaturase 1 (SCD1, in lipogenesis) mRNA was up-regulated in the PCN-treated Pxr+/+ mice. Reflecting these up-and down regulations and consistent with decreased energy metabolism, the levels of hepatic triglycerides and of serum 3-hydroxybutylate were increased and decreased, respectively in the PCN-treated Pxr+/+ mice. Using gel shift, GST pull down and cell-based reporter assays, we then examined whether PXR could cross talk with the insulin response forkhead factor FoxA2 to repress the transcription of the Cpt1a and Hmgcs2 genes, since FoxA2 activates these genes in fasting liver. PXR directly bound to FoxA2 and repressed its activation of the Cpt1a and Hmgcs2 promoters. Moreover, ChIP assays showed that PCN treatment attenuated the binding of FoxA2 to these promoters in fasting Pxr+/+ but not Pxr-/- mice. These results are consistent with the conclusion that PCN-activated PXR represses FoxA2-mediated transcription of Ctp1a and Hmgcs2 genes in fasting liver.
The nuclear receptors CAR (NR1I3) and PXR (NR1I2) were first characterized as xenobiotic-sensing transcription factors (1-3) coordinately inducing the expression of hepatic genes that encode various enzymes and proteins involved in drug metabolism and excretion (4-8). Those enzymes include cytochromes P450 (9,10), UDP-glucuronosyltransferases (11-13), sulfotransferases (14) and drug transporters (15). However, our studies have now shown CAR represses the genes encoding enzymes such as phosphoenoylpyruvate carboxykinase 1 (PEPCK1), carnitine palmitoyltransferase 1A (CPT1A) and enoyl-CoA isomerase (ECI) (16,17). It is also known that PXR can regulate the expression of the Pepck1 and Cpt1a genes (17,18). Thus, in addition to drug metabolism, these nuclear receptors modulate hepatic energy metabolism, glucogenogenesis and fatty acid oxidation (6). The molecular mechanism of how CAR and PXR mediate the drug-induced repression of energy metabolism is currently a strong research interest.
The liver is the major organ that metabolizes lipids to produce energy sources. Through β-oxidation and ketogenesis the liver supplies the major energy sources ketone bodies (acetoacetate and 3-hydroxybutylate) to the extra-hepatic tissues and organs when blood glucose levels are low after fasting and prolonged exercise (19-22). The genes such as Cpt1a and mitochondrial 3-hydroxy-3-methylglutarate CoA synthase 2 (Hmgcs2) are activated to increase the supply of ketone bodies (23,24). Recently, FoxA2, a winged -helix/forkhead transcription factor, is found to be the key regulatory factor that activates these genes in fasting mouse liver (25). Insulin decreases lipid metabolism by inactivating the transcription factor FoxA2 to control energy metabolism (26,27). Treatment with drugs such as phenobarbital (PB) can modulate lipid metabolism in an insulin independent manner by changing the expression of many genes under control of insulin signaling cascade (28), suggesting that there may be cross talk between the xenobiotic-sensing transcription and insulin regulated transcription factors. Recently, the molecular mechanism by which both CAR and PXR decrease gluconeogensis was elucidated. Both receptors directly bind to FoxO1, preventing its interaction with the insulin response sequence (IRS) and repressing the FoxO1-mediated activation of IRS-bearing genes such as Pepck1(17). However, the molecular mechanism by which CAR and PXR represses lipid metabolism remains unexplored.
We have investigated the molecular mechanism of PXR-mediated regulation of hepatic lipid metabolism in fasting mouse. Pxr-/- mice were used to demonstrate that the activation of PXR down-regulated the key enzymes in β-oxidation and ketogenesis, CPT1A and HMGCS2 respectively, while up-regulating stearoyl-Coenzyme A desaturase 1 (SCD1), the key enzyme in lipogenesis. By cloning and characterizing the promoters of the mouse Cpt1a and Hmgcs2 genes, we deciphered the repression mechanism by PXR of FoxA2-mediated transcription of these genes. Here we present experimental considerations to propose the regulatory mechanism by which the drug activation of PXR can result in decreased energy metabolism by up-regulating lipogenesis and by down-regulating β-oxidation and ketogenesis in fasting mouse liver.
Experimental procedures
Materials
Dimethyl sulfoxide (DMSO) and pregnenolone 16α-carbonitrile (PCN) were purchased from Sigma-Aldrich. The plasmids pGL3-basic, pBIND and pACT were obtained from Promega. Restriction endonucleases and DNA-modifying enzymes were purchased from New England Biolabs, Inc.
Plasmid construction
pGem1/rat FOXA2/Hnf3β and 6xFoxA TATA-Luc were kindly provided by Robert H. Costa (29,30). In all plasmid, m and h denote mouse and human, respectively. The following plasmids were described previously: pCMX/hRXR(1), pcDNA/mPXR(31), and pcDNA3.1/mPXR ΔAF2-V5-His (31). Rat FoxA2 coding DNA was amplified using proper primer sets with pGem1/rat Hnf3β/FoxA2 as the template and subcloned into pcDNA3.1/V5-His-Topo (Invitrogen), pGEX4T-1 (Amersham Biosciences), and pACT to generate pcDNA3.1/FoxA2, pGEX/FoxA2 and pACT/FoxA2, respectively. pBind/mPXR were constructed by cloning of mPXR into pBIND. The following deletion mutants were also constructed based on the previous report (29): pGEX/FoxA2 7-94, pGEX/FoxA2 144-279, pGEX/FoxA2 361-458, pcDNA3.1/mPXR-LBD-V5-His (amino acid 141 to 431), pcDNA3.1/mPXR-DBD-V5-His (amino acid 1 to 104). Reporter plasmids pGL3/CPT1a-2.4k and pGL3/HMGCS2 -3.0k were constructed using PCR amplified Cpt1a promoter (-2432 to +1) and Hmgcs2 promoter (-2984 to +40) from mouse genomic DNA, respectively. Primers used for these cloning are 5′-GCATATCTCGAGAGATCACTCAAGCTGGCCTCAAACTTGTGG-3′ and 5′-TTCTTGAAGCTTCTTGGAGGAGGGGCAAGAGATGGCTTTGAG for Cpt1a and 5′-GCATATGGTACCTCTACTACAATAAGACATGGCAGAGG-3′ and 5′-CGGCTACTCGAGATCAACAGAAAGCCAGCAGTCCACAG-3′ for Hmgcs2. The amplified DNA fragments are cloned into pGL3 basic at XhoI-HindIII and KpnI-XhoI sites, respectively, utilizing the recognition sequences incorporated in the primers as indicated by underlines.
Cell culture and transfection
HepG2 and Huh7 cells were cultured in minimum essential medium supplemented with 10% fetal bovine serum, 2 mM L-glutamine, 100 U/ml penicillin, and 100 μg/ml streptomycin in an atmosphere of 5% CO2 at 37°C. The cells on 24-wells plates were transfected with Fugene 6 (Roche Diagnostics) according to the manufacture's instruction. Twenty four h after transfection, cells were treated with drug in the media without FBS for an additional 24 h before harvest. Luciferase activity was measured using the Dual-Luciferase reporter assay system (Promega) and normalized against Renilla reniformis luciferase activity from pRL-CMV (10 ng/well) (Promega). The experiments were carried out in triplicate, and the results are expressed as the mean ± standard deviation.
Mammalian two-hybrid assay
Mammalian two-hybrid assay was performed using CheckMate Mammalian Two Hybrid System (Promega) according to the manufacturer's instructions. Expression plasmids for GAL4 DNA binding domain (pBIND) fusion protein and VP16 (pACT) fusion protein were cotransfected into HepG2 cells with pG5Luc reporter plasmid, and luciferase activity was determined as described above.
GST pull-down
Gluthathione S-transferase (GST) fusion proteins, GST-FoxA2, GST-FoxA2 7-94, GST-FoxA2 144-279 and GST-FoxA2 361-458 were expressed in Escherichia coli strain BL21 cells and were purified with glutathione-Sepharose 4B (Amersham Biosciences). mPXR, mPXR DBD, mPXR LBD and mPXR ΔAF2 were labeled with [35S] methionine using the TNT T7 quick-coupled transcription/translation system (Promega). GST-FoxA2 was incubated with 35S-labeled mPXR or the mutants, and then GST pull down procedure was performed as previously reported (32). Bound proteins were detected by autoradiography after SDS-PAGE separation.
Gel shifts
PXR, RXR and FoxA2 proteins were produced by in vitro translation using appropriate expression plasmid and a TNT T7 quick-coupled transcription/translation system. For the probes, double-stranded oligonucleotides containing a FoxA2 binding site of hIGFBP-1 promoter at the position -124 to -96 (5′-GATCCACTAGCAAAACAAACTTATTTTGAACACGATC-3′) (33), the putative FoxA2 binding sites within Cpt1a promoter, C1 at the position -1910 to -1886 (5′-GATCAAGCTAAACAGGCATGATC-3′), C2 at the position -1823 to -1809 (5′-GATCCATATAAATATGCAGGATC-3′), C3 at the position -1733 to -1719 (5′-GATCATACCTATTGGTTTTGATC-3′), the binding sites within Hmgcs2 promoter, H1 at the position -179 to -162 (5′-GATCAAGGCCAACAATGAAGATC-3′), and H2 at the position -112 to -98 (5′-GATCCATGATGTTTTCCTTGATC-3′) were labeled with [α-32P] dATP and DNA polymerase Klenow fragment (New England Biolabs). The underlined sequences indicate additional sequences for filled in by Klenow fragment. Gel shift assay were carried out as described previously (1).
Animal treatments
All animals were housed in a room maintained at 22°C with a 12:12-h light-dark cycle (7:00 AM to 7:00 PM). Mice were fed ad libitum with NIH-31 Open Formula Autoclavable diet (Zeigler). PXR wild type (Pxr+/+) or null (Pxr-/-) mice (10 weeks old) obtained from Jeff L. Staudinger were randomly divided into two groups and mice were intraperitoneally treated with PCN (20 mg/kg of body weight) or vehicle only (DMSO). After injection, mice (four mice per group) were fasted with food withdrawn but drinking water ad libitum until sacrificed. All animal procedures were approved by the Animal Ethics Committee of National Institute of Environmental Health Sciences.
Real-time PCR
Mouse liver cDNAs were prepared using High Capacity cDNA Archive Kit (Applied Biosystems) with total RNA prepared with TRIZOL reagent (Invitrogen). Real-time PCR was performed with 7900HT Fast Real-Time PCR System (Applied Biosystems) with the following probes and primers: 5′-6FAM-ACCCTAGACACCACTGGCCGCATGT-TAMR A-3′, 5′-CCCTGGGCATGATTGCAA-3′, 5′-AAGAGGACGCCACTCACGAT-3′ for Cpt1a; 5′-6FAM-CATCACGGCCAATGTTATCTGCTCCA-TAMRA-3′, 5′-ACCCCACGTTCCTCTTCCA-3′, 5′-CAGCAGGCGCAAGAACTGA-3′ for Cyp2b10 (34). In addition, the following pre-synthesized probes from Applied Biosystems were used: Cyp3a11, Mm00731567_m1; Foxa2, Mm00839704_mH; Hmgcs2, Mm00550050_ml; Srebp1, Mm00550338_m1; Fasn, Mm00662319_m1; Acc1, Mm01304260_m1; Scd1, Mm00772290_m1; Mttp, Mm01321412_g1; Dgat2, Mm00499530_m1; Cpt2, Mm00432403_01, Ppara; Mm00440939_m1. The TaqMAN rodent GAPDH control reagent (Applied Biosystems) was used as internal control.
Chromatin Immunoprecipitation (ChIP)
ChIP assays were preformed according to the method previously reported (35) with some modifications. The liver nuclei were prepared according to previously reported method (36). Nuclear pellets were suspended with PBS containing 3 mM MgCl2 and treated with 1.0% formaldehyde at room temperature for 15 min for cross-linking. To quench the reaction, glycin (final 125mM) was added and incubated for 5 min. After wash with PBS containing 3 mM MgCl2, the nuclei were suspended in lysis buffer (50 mM Tris-HCl, pH 8.1, 1.0% SDS, 10 mM EDTA, 1 mM PMSF and one Complete Protease inhibitor minitablet (Roche Diagnostics) per 10 ml) for 10 min on ice, and the nuclear lysate was sonicated to shear chromosomal DNA to a size of average 500 bp. Insoluble material was removed by centrifugation and the soluble supernatant solution (200 μl) was diluted 10-fold with ChIP dilution buffer (50 mM HEPES, pH7.5, 150 mM NaCl, 1 mM EDTA, 1.0% Triton X-100, 0.1% sodium deoxycholate, 0.1% SDS, 1 mM PMSF and one Complete Protease inhibitor minitablet per 10 ml). The diluted chromatin was precleared by incubating for 4h with 4 mg sheared salmon sperm DNA, 40 μl of pre-immune serum and 25 μl Protein G-agarose beads saturated with BSA (1 mg/ml). The mixture was spun at 3,000 rpm for 2 min at 4°C, and the supernatant was allowed to bind to either 5 μg of normal goat IgG or anti-FOXA2 antibody (IMGENEX Co.) overnight at 4°C. Immunocomplexes on protein G-agarose were pulled down and washed 4 times with the ChIP dilution buffer. DNA precipitated in the anti-FOXA2 antibody complex was decrosslinked and eluted by incubating at 65°C for at 6 h, and treated by Proteinase K for 2 h at 42°C. The purified DNAs using Qiaquick DNA purification columns (Qiagen) were used for semi-quantitative PCR analysis using α-32P-dATP (Amersham Bioscience) with gene-specific primers as followed. 5′-TACAGCCTAGAACCCTGACTGC-3′, 5′-CTTTCCTACTGAGGCCCAGATAG-3′ for Cpt1a promoter, 5′-TGAGCCACTCAGCAGAGGAATCAG-3′, 5′-CTGGGTTGGGCTTTATAAGACTCC-3′ for Hmgcs2 promoter.
Serum and liver parameters analysis
Blood samples were collected from the submandibular cheek-pouch area of mice, using 5.5mm Golden Rod animal lancets (Medipoint, Inc.) and micotainer Serum Separator Tube (Becton Dickinson). The serum levels of triglyceride, non-esterified fatty acid (NEFA) free fatty acid and 3-hydroxybuthylate were measured using assay kits (L-type TG H, NEFA C and Autokit 3-HB, respectively) from Wako chemicals USA, Inc. Serum glucose and cholesterol were measured using reagents and controls from Olympus America Inc. and the chemistry-immuno AU400e analyzer (Olympus). Serum levels of insulin and glucagon were quantified using RIA kits for these hormone from Linco Research, Inc. Total liver lipids were extracted from homogenate prepared from 100 mg liver using methanol-chloroform (1:2 v/v) according to Bligh and Dyer's method (37). After centrifugation, the chloroform fraction was collected and dried. The remaining pellet was dissolved in 10% SDS in isopropanol and triglyceride was assayed using L-type TG H (Wako Chemicals USA, Inc).
Statistical analysis
Statistical analysis was performed by Student's t-test for the drug responses in Pxr+/+ mice or Pxr-/- mice and the differences between Pxr+/+ mice and Pxr-/- mice.
Results
Regulation of the Cpt1a, Hmgcs2 and Scd1 genes
First, we have measured the expression of Cpt1a and Hmgcs2, which are known to be regulated by FoxA2, in mouse liver. Consistent with previous reports (23,24), expression of Cpt1a and Hmgcs2 were induced (3.5 and 2.5 folds, respectively) by 24 hr fasting in mouse livers, apparently through insulin-Akt-FoxA2 pathway regulation (Fig. 1). Interestingly, roughly 40% of the induction was compromised by PCN treatment. Hence, to find PXR roles in the xonobiotics dependent suppression of Cpt1a and Hmgcs2 genes in mouse liver, we compared the expressions of the genes between Pxr+/+ and Pxr-/- after PCN treatment in fasting condition (Fig. 2). Only in Pxr+/+ mice, PCN treatment repressed Cpt1a (35%) and Hmgcs2 (45%) mRNA expression significantly. In contrast, the same treatment increased mRNA for Scd1 (4 fold) in fasting Pxr+/+ mice (Fig. 2). The down-regulation of the Cpt1a and Hmgcs2 genes and the up-regulation of the Scd1 gene were not observed in the PCN-treated Pxr-/- mice, indicating these PCN-induced regulations were PXR-dependent. As expected, treatment with PCN induced Cyp3A11 mRNA more than 10-fold only in WT mice, providing the excellent control of the function of PXR and its activation by PCN in the animal model used (Fig. 2). Since these three genes are hormonally regulated, we measured serum insulin and also glucagon and confirmed that PCN treatment did not change their levels (Table 1). Thus, these results clearly indicated that PXR directly down-regulated Cpt1a and Hmgcs2 genes and up-regulated the Scd1 gene. We also examined the effect of PCN treatment on PPARα that regulates the Cpt1a and Hmgcs2 genes and found that PCN did not change the levels of PPARα mRNA in the Pxr+/+ and Pxr-/- mice (data not shown). Several genes involved in lipid metabolism (Cpt2, Srebp1, Fasn, Acc1, Mttp, and Dgat2) were analyzed (Table 2). None of these genes except Cpt2 and Srebp1, which are weakly down-regulated in PCN treated Pxr+/+ mice and weakly up-regulated in Pxr-/- mice, respectively, has differential expression in the treatment groups.
Fig. 1.
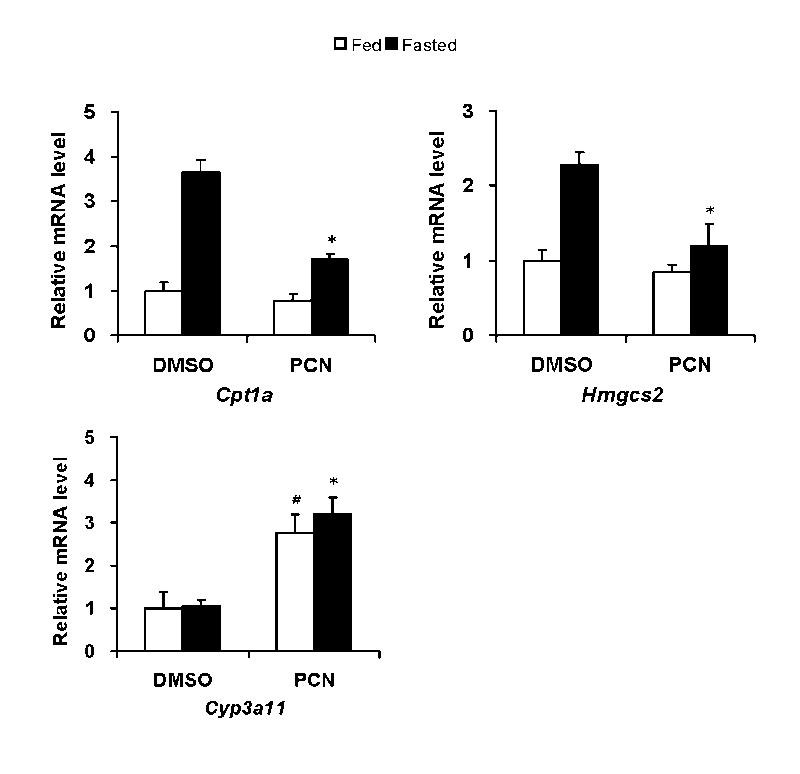
PCN treatment represses mRNA levels of Cpt1a and Hmgcs2 in fasting mice. Cr1: CD-1 (ICR) BR male mice were intraperitoneally injected with PCN (20 mg/kg of body weight) or DMSO, and were either fed at libitum or fasted with drinking water for 24 hours. The mRNA levels in these mouse livers were determined by real-time RT-PCR and were expressed by taking those in the fed mice treated with DMSO as one. Values express mean ± standard deviations (n=4). *p< 0.005 for vehicle injected fasted group vs PCN injected fasted group. # p<0.005 for vehicle injected fed group vs PCN injected fed group.
Fig. 2.
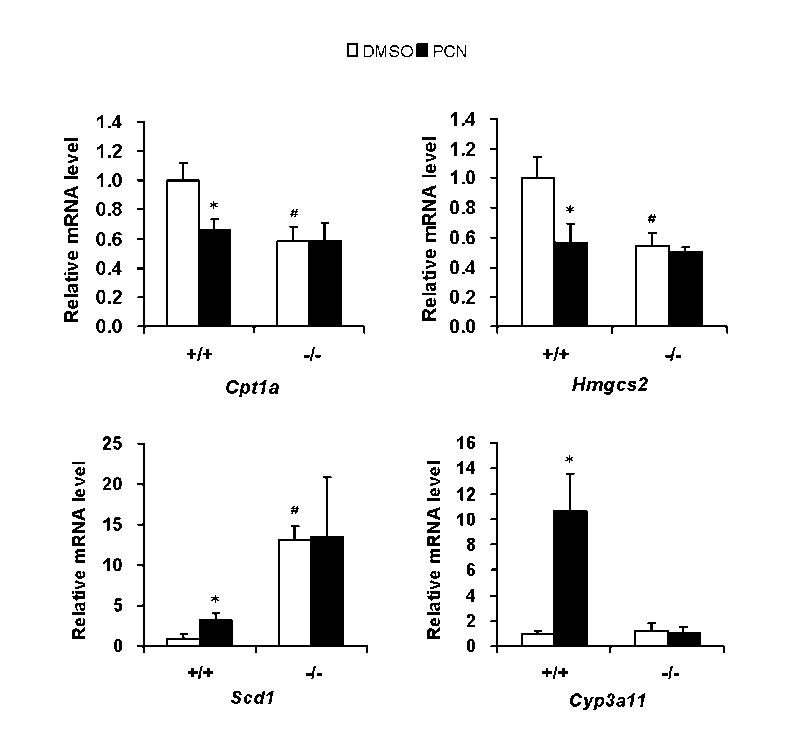
PXR diversely regulates gene expressions of Cpt1a, Hmgcs2 and Scd1 in fasting mouse liver. Pxr+/+ (+/+) or Pxr-/- (-/-) mice were treated by intraperitoneal injection with PCN or vehicle (DMSO). The mice were fasted for 24 hours after the injection. Cpt1a, Hmgcs2, Scd1 and Cyp3a11 mRNA levels in these mice liver were determined by real-time RT-PCR. Relative mRNA quantity for each gene was expressed by taking those with DMSO as one. Values express mean ± standard deviations. *p< 0.005 for vehicle injected Pxr+/+ group vs PCN injected Pxr+/+ group. #p<0.005 for vehicle injected Pxr+/+ group vs vehicle injected Pxr-/- group.
Table 1.
Serum levels of insulin and glucagon in wild type and Pxr -/- mice
| 0hr | 12hr | 24hr | |||
|---|---|---|---|---|---|
| Insulin
(ng/ml) |
Pxr+/+ | 0.8± 0.20* | DMSO | 0.24± 0.16** | 0.08± 0.04 |
| PCN | 0.21± 0.13# | 0.09± 0.07 | |||
|
| |||||
| Pxr -/- | 1.5± 0.33* | DMSO | 0.54± 0.24** | 0.06± 0.05 | |
| PCN | 0.68± 0.34# | 0.17± 0.12 | |||
|
| |||||
| Glucagon
(pg/ml) |
Pxr +/+ | 50.4± 9.8 | DMSO | 46.5± 13.9 | 48.8± 17.0 |
| PCN | 62.4± 30.7 | 37.5± 5.7 | |||
|
| |||||
| Pxr -/- | 62.5± 6.5 | DMSO | 59.0± 17.2 | 50.8± 12.1 | |
| PCN | 60.2± 49.2 | 76.7± 16.2 | |||
Each value shows mean±SD(n=4).
P<0.05 for Pxr+/+ group vs Pxr-/- group.
P<0.05 for Pxr +/+ vehicle treated group vs Pxr-/- vehicle treated group.
P<0.05 for Pxr+/+ PCN treated group vs Pxr-/- PCN treated group.
Table 2.
Relative mRNA expressions of several key genes involved in lipid homeostasis
| Pxr+/+ | Pxr -/- | |||
|---|---|---|---|---|
| Genes | DMSO | PCN | DMSO | PCN |
| Fatty acid synthesis | ||||
| Srebp1 | 100 ±18.5 | 95.3 ±14.1 | 172 ±21.8# | 158 ±27.8 |
| Fas | 100 ±47.5 | 76.5 ±11.9 | 84.5 ±19.3 | 100 ±14.2 |
| Acc1 | 100 ±38.9 | 94.2 ±14.3 | 105 ±14.1 | 113 ±21.3 |
| TG synthesis and secretion | ||||
| Mttp | 100 ±10.6 | 96.6 ±6.2 | 111 ±13.4 | 113 ±14.1 |
| Dgat2 | 100 ±14.2 | 111 ±12.6 | 127 ±44.0 | 120 ±16.8 |
| β-oxidation | ||||
| Cpt2 | 100 ±25.4 | 78.2 ±11.5 | 97.7 ±34.7 | 105 ±23.3 |
Each value (mean ±SD (n=4)) stands for relative mRNA expression level which was calculated taking that in vehicle injected Pxr +/+ group as 100 for each gene.
p<0.03 for vehicle injected Pxr +/+ group vs vehicle injected Pxr -/- group.
Unexpectedly, the serum levels of insulin were found to be 2-fold higher in the Pxr-/- mice compared with these in the Pxr+/+ mice (Table 1). This higher level of insulin might have caused the expressions of the Cpt1a and Hmgcs2 genes attenuated and of the Scd1 gene augmented in the non-treated Pxr-/- mice (Fig. 2). Whether the lack of PXR is directly responsible for this higher insulin levels remained unsolved, since it is still possible at the present time that the mouse with this phenotype happened to be selected during production of this line of Pxr-/- mice.
Repression of the trans-activation activity of FoxA2
To explore molecular mechanism underlying the Cpt1a and Hmgcs2 regulation seen in Fig. 1 and 2, the functional interaction between mPXR and FoxA2 was analyzed in a transient reporter assay using Cpt1a and Hmgcs2 reporters. For the purpose, we cloned mouse Cpt1a gene promoters (-2.4k to +1) into a luciferase reporter plasmid and co-transfected the reporter with the expression plasmids for FoxA2 and mPXR into Huh7 cells (Fig. 3A). FoxA2 activated the Cpt1a reporters over 20-fold compared with control vector and mPXR repressed this FoxA2-dependent trans-activation with more than 80 % repression in the presence of PCN and RXR. In the absence of FoxA2 co-expressed, mPXR did not affect the activity of Cpt1a promoter. Thus, the results suggest mPXR needs to be activated to repress the FoxA2 trans-activation. Next, we identified FoxA2 binding sites in the promoter of the genes. The results using serial deletion mutants of the reporter constructs suggested FoxA2 binding sites located between -2.1k and -1.6 k in Cpt1a gene (Fig. 3B). To further establish the FoxA2 binding sites, candidate binding sequences (C1, C2, and C3 shown in Fig. 3) that have similarity with consensus FoxA2 binding sites were analyzed by gel shift assay and reporter assays using deletion mutants. FoxA2 interacted with both C1 and C3 sites but not C2 site in gel shift analysis (Fig. 3C). C1 and C3 deletion from the -2.4 k reporter diminished more than 70% of FoxA2 activation (Fig 3D).
Fig. 3.

PXR represses FoxA2 trans-activation of the mouse Cpt1a promoter in Huh7 cells. A. Reporter plasmid, pGL3/CPT1A -2.4k was co-transfected with or without FoxA2 in the presence or absence of mPXR and hRXR as indicated. At 24 h after the transfection, cells were treated with DMSO or PCN and incubated for additional 24 h. Relative luciferase activities were calculated by taking the activity of the DMSO treated cells transfected with the reporter plasmid alone as one. B. A series of pGL3/CPT1A reporter plasmids as indicated were co-transfected with or without FoxA2 for 48 h. Numbers on the vertical ax indicate lengths of the Cpt1a promoter cloned into the reporter plasmids. Relative luciferase activities were calculated by taking the activity of the cells transfected with the pGL3/CPT1A -2.4k without FoxA2 as one. C. In vitro-translated FoxA2 was incubated with 32P-labeled double-stranded putative FoxA2 binding sites, C1, C2 and C3 within the Cpt1a promoter and FoxA2 binding site of IGFBP-1 promoter. Cold probes stand for the one hundred-fold molar excess competitor co-incubation. Shifted bands were separated by electrophoresis on a 4% polyacrilamide gel. Bands were detected by autoradiography. D. Reporter plasmid, pGL3/CPT1A -2.4k and the deletion mutants of the putative FoxA2 binding sites, C1 and C3, were co-transfected with or without FoxA2 for 48 h. Relative luciferase activities were calculated by taking the activity of the cells transfected with the pGL3/CPT1A -2.4k without FoxA2 as one. Bars indicate mean ± standard deviations in A, B, and D.
Similar experiments using Hmgcs2 reporters suggest activated mPXR also attenuates FoxA2 activation of this gene (Fig. 4). The Hmgcs2 reporter (-3.0k to +40) was constructed and co-transfected with mPXR and hRXR (Fig. 4A). FoxA2 activated the Hmgcs2 reporters around 4-fold and mPXR inhibited this trans-activation in the presence of PCN. Using similar strategy as shown Fig. 3, we identified FoxA2 binding site in this gene and named H2 site (-112- -98) (Figs. 4B, 4C and 4D). In the absence of exogenous FoxA2 co-expressed, PXR repressed the constitutive activity of Hmgcs2 reporter activity (Fig. 4A). It is not known whether this constitutive activity was regulated by the endogenous FoxA2 or the other transcription factor. Taken together, the results clearly established that Cpt1a and Hmgcs2 promoters have FoxA2 binding sites and activated mPXR represses FoxA2 dependent trans-activation in transient reporter assay using -2.4k Cpt1a reporter and -3.0k Hmgcs2 reporter.
Fig. 4.

PXR represses FoxA2 trans-activation of the mouse Hmgcs2 promoter in Huh7 cells. A. Reporter plasmid, pGL3/HMGCS2 -3.0k was co-transfected with or without FoxA2 in the presence or absence of mPXR and hRXR as indicated. Cell treatments and data analyses were done as in Fig 2A. A series of pGL3/HMGCS2 reporter plasmids as indicated were co-transfected with or without FoxA2 for 48 h. Numbers on the vertical ax indicate lengths of the Hmgcs2 promoter cloned into the reporter plasmids. Relative luciferase activities were calculated by taking the activity of the cells transfected with the pGL3/HMGCS2 -3.0k without FoxA2 as one. C. In vitro-translated FoxA2 was incubated with 32P-labeled double-stranded putative FoxA2 binding sites, H1 and H2 within the Hmgcs2 promoter and a FoxA2 binding site of IGFBP-1 promoter. Gel shift analyses were performed as in Fig 2C. D. Reporter plasmid, pGL3/HMGCS2 -3.0k and the deletion mutants of the putative FoxA2 binding sites, H1 and H2, were co-transfected with or without FoxA2 for 48 h. Relative luciferase activities were calculated by taking the activity of the cells transfected with the pGL3/HMGCS2 -3.0k without FoxA2 as one. Bars indicate mean ± standard deviations in A, B, and D.
Binding of PXRLBD to FoxA2DBD
To explore the molecular mechanism for the repression of FoxA2 by mPXR, we analyzed interaction of mPXR with FoxA2 in mammalian two-hybrid assay. The reporter activity was increased around 2.5 fold by PCN when GAL4-PXR (pBind/mPXR) was cotransfected with VP16-FoxA2 (pAct/FoxA2, Fig. 5A). However, no PCN effect was observed when only one of these was co-expressed with empty vectors. Since the activation was not seen without the PXR ligand, these results imply mPXR could interact with FoxA2 only when the receptor was activated by PCN.
Fig. 5.

PXR directly interacts with the DBD of FoxA2 to inhibit its binding to the responsible elements in vitro and in vivo. A. Mammalian two-hybrid assay was performed by co-transfecting pG5-Luc reporter plasmid with various combinations of pBIND, pACT, pBIND/mPXR and pACT/FoxA2 into HepG2 cells. At 24 h after transfection, cells were treated with DMSO or PCN for an additional 24 h. Relative luciferase activities were calculated by taking the activity obtained from the GAL4DBD- and VP16AD-transfected cells in the presence of DMSO as one. Bars indicate mean ± standard deviations. B. Schematic structure of FoxA2 and mPXR (Upper panel). In vitro translated 35S-labeled mPXR was incubated with bacterially expressed GST-FoxA2 and its deletion mutants (middle panel). In vitro translated 35S-labeled mPXR or the deletion mutants was incubated with bacterially expressed GST-FoxA2 (lower panel). GST-pull down assay was carried out as in EXPERIMENTL PROCEDURES. Bound proteins were detected by autoradiography. C. PXR LBD represses the FoxA2-mediated activation of mouse Cpt1a -2.4k reporter. pGL3/CPT1a -2.4k reporter plasmid and pcDNA3.1/FoxA2 were co-transfected with and without pcDNA3.1/mPXR-LBD-V5-His or pcDNA3.1/mPXR-DBD-V5-His into HepG2 cells. After 24 h, DMSO or PCN was added to the cells cultured for additional 24 h. Relative luciferase activities were calculated by taking the activity of the DMSO-treated cells transfected with pGL3/CPT1a -2.4k reporter plasmid alone as one. D. In vitro-translated FoxA2, mPXR and hRXR were incubated with 32P-labeled double-stranded FoxA2 binding site of IGFBP-1 promoter. Competitor stands for fifty-fold excess cold probe co-incuabation. Shifted bands were separated by electrophoresis on a 4% polyacrilamide gel. Bands were detected by autoradiography. E. Activated PXR inhibits FoxA2 binding to Cpt1a and Hmgcs2 promoter in ChIP assay. Chromatin fragments were immunoprecipitated with anti-FoxA2 antibody from liver nuclear extracts. Precipitated Cpt1a and Hmgcs2 promoter DNA was semi-quantified by PCR as in EXPERIMENTAL PROCEDURES. D and P stands for DMSO and PCN treated mouse liver, respectively.
GST-Pull down assay was performed to determine which regions are required for the interaction between mPXR and FoxA2. We generated GST fusion proteins for full-length FoxA2 and its three deletion mutants, which have a transcriptional activation domain (FoxA2 7-94), the winged-helix DNA binding domain (144-279), or C-terminal region (361-458, Fig. 5B). These GST fusion proteins were purified from bacteria extracts and pull down assay was performed with 35S-labeled in vitro translated mPXR. Consistent with the mammalian two hybrid assay results, FoxA2 interacted with mPXR strongly. Furthermore, the winged-helix DNA binding domain showed high affinity with mPXR while N-and C-terminus regions did not. Next, to identify regions in PXR required for the interaction with FoxA2, GST-pull down assays were performed using a set of deletion mutants of mPXR (Fig. 5B). Ligand binding domain (LBD) of mPXR showed strong affinity with GST-FoxA2 fusion protein but the DNA binding domain did not. Interestingly, ΔAF2 still possessed the high affinities with GST-FoxA2 fusion protein, suggesting that AF2 domain is not necessary for the interaction between FoxA2 and the receptors. To provide the additional evidence supporting the binding of the LBD with FoxA2, transient transfection assays using the -2.4k Cpt1a reporter were performed. The LBD of mPXR, but not the DBD repressed the reporter activity (Fig. 5C). Collectively these results strongly suggested that mPXR LBD directly interact with FoxA2 winged-helix DNA binding domain in vitro.
Inhibition of FoxA2 binding to the promoters
The results showing mPXR bind to the winged-helix DNA binding domain of FoxA2 (Fig. 5B and 5C) suggest possible inhibition of FoxA2 DNA binding by mPXR. Thus, we examined FoxA2 DNA binding activity using gel shift assay in the presence or absence mPXR. Incubating in vitro translated FoxA2 with an established FoxA2 binding site probe, one major shifted band was observed (Fig.5D). The shifted band was disappeared in the presence of excess cold competitor. Neither hRXR nor mPXR alone inhibited FoxA2/DNA complex significantly. In contrast, by co-incubating mPXR with hRXR, the shifted band was dramatically decreased. Thus mPXR and RXR heterodimer could inhibit FoxA2 DNA binding. To establish this inhibition is occurring in liver in vivo, we did ChIP analysis using mouse liver extracts from Pxr+/+ and Pxr-/- mice treated with PCN. If the repression of Cpt1a and Hmgcs2 by PXR was due to inhibition of FoxA2 recruitment to the cis-elements, ChIP assay could detect the FoxA2 occupancy change at the promoter sites for the genes by PCN treatment. FoxA2 responsible elements on Cpt1a and Hmgcs2 promoter determined in Figs. 3 and 4 were amplified from immunoprecipitated material using anti-FoxA2 from mouse liver extracts. As shown in Fig. 5E, both amplified DNA fragments of the Cpt1a and Hmgcs2 genes were decreased only in Pxr+/+ mice treated with PCN but not in Pxr-/- mice. Semi quantification of the band intensities from multiple ChIP assays suggested that PCN treatment decreased the FoxA2 occupations on the Cpt1a and Hmgcs2 promoters by 60 ± 27% and 30 ± 16%, respectively. Taken together, with the earlier results these data suggested inhibition of FoxA2 DNA binding on Cpt1a and Hmgcs2 promoters by the direct interaction between activated PXR and FoxA2 in nucleus.
Liver and serum parameters
The gene regulation difference we found in the previous experiments might be reflected in blood and/or hepatic lipid content differences caused by PCN treatment. Therefore, we analyzed blood chemistry and hepatic triglyceride content (Table 3 and Fig. 6A) of PCN treated or untreated Pxr+/+ and Pxr-/- mice in fasting condition. Serum glucose and ketone body (3-hydroxybutylate) levels were significantly decreased in Pxr+/+ mice treated with PCN (Table 3). Moreover the treatment increased hepatic triglyceride quantity only in WT mice livers nearly two fold (Fig. 6A), while serum triglyceride and NEFA amounts were not affected (Table 3). Consistent with the hepatic triglyceride increase, a remarkable multiplication of microvesicular lipid droplets was observed panlobularly in PCN treated WT mice liver sections (Fig. 6B).
Table 3.
Blood chemistry
| Parameter | Pxr +/+ | Pxr -/- | |||
|---|---|---|---|---|---|
| Control | PCN | Control | PCN | ||
| Glucose | (mg/dl) | 97.5± 10.9 | 69.3± 18.4 * | 107± 27.7 | 88.0± 12.3 |
| Total cholesterol | (mg/dl) | 127± 23.3 | 142± 9.5 | 133± 26.1 | 149± 24.1 |
| Triglycerides | (mg/dl) | 50.1± 23.1 | 65.0± 20.5 | 44.0± 23.0 | 52.5± 13.6 |
| NEFA | (mEq/l) | 1.06± 0.13 | 1.13± 0.18 | 1.07± 0.59 | 1.05± 0.17 |
| 3-hydroxybutylate | (mM) | 2.10± 0.45 | 1.17± 0.21 ** | 1.45± 0.55 | 1.64± 0.27 |
Each value shows mean ± SD (n=4).
p<0.05.
p<0.001 for vehicle injected Pxr +/+ group vs PCN injected Pxr +/+ group
Fig. 6.
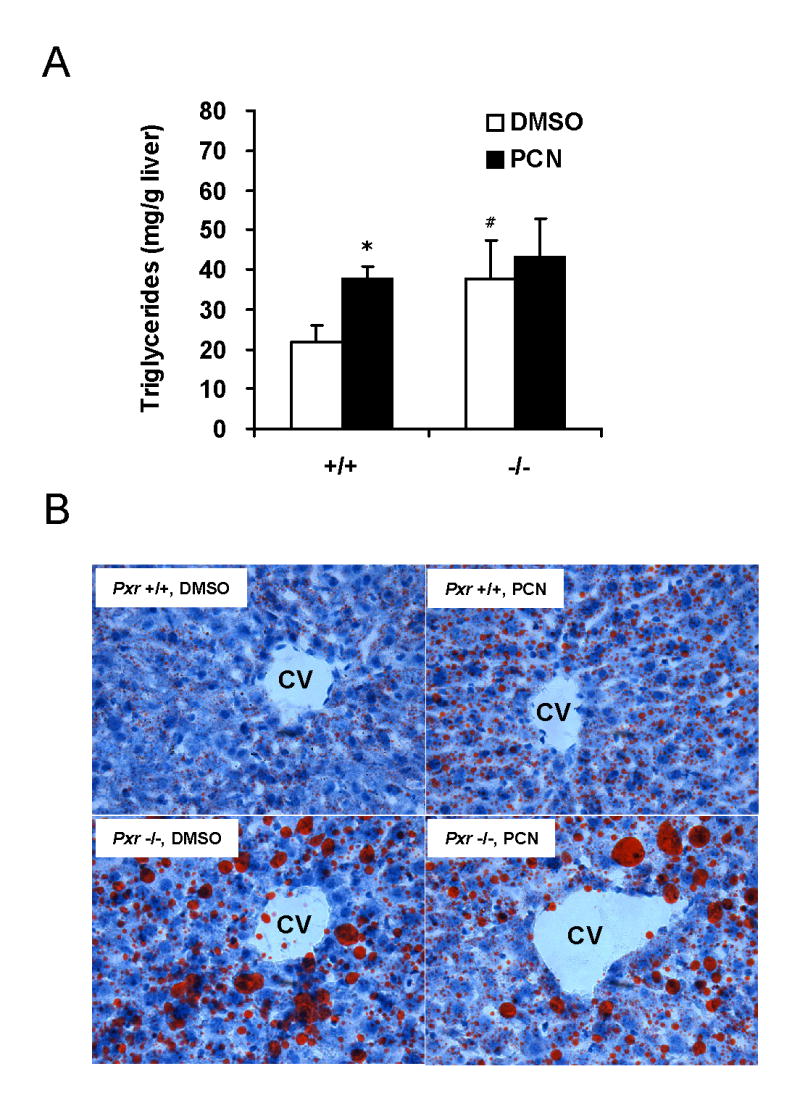
PXR activation by PCN and disruption of PXR gene accumulates hepatic triglyceride in mice. A. Hepatic triglyceride from Pxr+/+ (+/+) and Pxr-/- (-/-) fasted mice treated with DMSO or PCN (n = 4 for each group) were measured as described in EXPERIMENTAL PROCEDURES. Bars indicate mean ± standard deviations. *p<0.005 for vehicle injected Pxr+/+ group vs PCN injected Pxr+/+ group, #p<0.05 for vehicle injected Pxr+/+ group vs vehicle injected Pxr-/- group. B. Oil-red-O staining for neutral lipids in livers of fasted Pxr+/+ and Pxr-/- mice treated with DMSO or PCN. Magnitude: ×200. CV: central vein.
Surprisingly, hepatic triglyceride contents in Pxr-/- mice were much higher than those of Pxr+/+ mice (about 2 fold). Furthermore, lipid staining of the sections from these mice showed dramatic difference from those in WT sections. As shown in figure 6B, Pxr-/- mice had macrovescular lipid droplets dominantly localized in centrilobular areas. In addition, panlobular microvescular droplets were also increased significantly compare to WT untreated mice livers. As expected, PCN treatment gave no significant change either in blood chemistry, in hepatic triglyceride, or in lipid staining in Pxr-/- mice livers. Collectively, these results suggest that PXR plays critical roles in lipid metabolism/synthesis in fasting mouse liver and the gene expression changes we found in Fig. 1 (Cpt1a, Hmgcs2 and Scd1) may explain at least partially these physiological changes in mice.
Discussion
We have demonstrated that activation of PXR up-regulates the Scd1 gene and down-regulates the Ctp1a and Hmgsc2 genes in the liver of fasting mice. Concomitantly, the level of hepatic triglycerides is increased and that of serum 3-hydroxybutylate decreased. Thus, activated PXR represses hepatic energy metabolism by increasing triglyceride synthesis and decreasing β-oxidation and ketogenesis in the fasting mice (Fig. 7). This regulation by PXR is similar to that by insulin, which also increases the level of SCD1 and decreases that of CPT1A and HMGCS2 (23,24,38,39). PXR represses the FoxA2-mediated transcription of the Cpt1a and Hmgcs2 genes by directly binding to FoxA2, which differs from insulin that indirectly represses this transcription by activating the Akt-dependent signal pathway (25). Thus, PXR can repress hepatic energy metabolism in an insulin-independent manner, providing the basis for future investigations to understand and treat insulin-insensitive liver diseases.
Fig. 7.
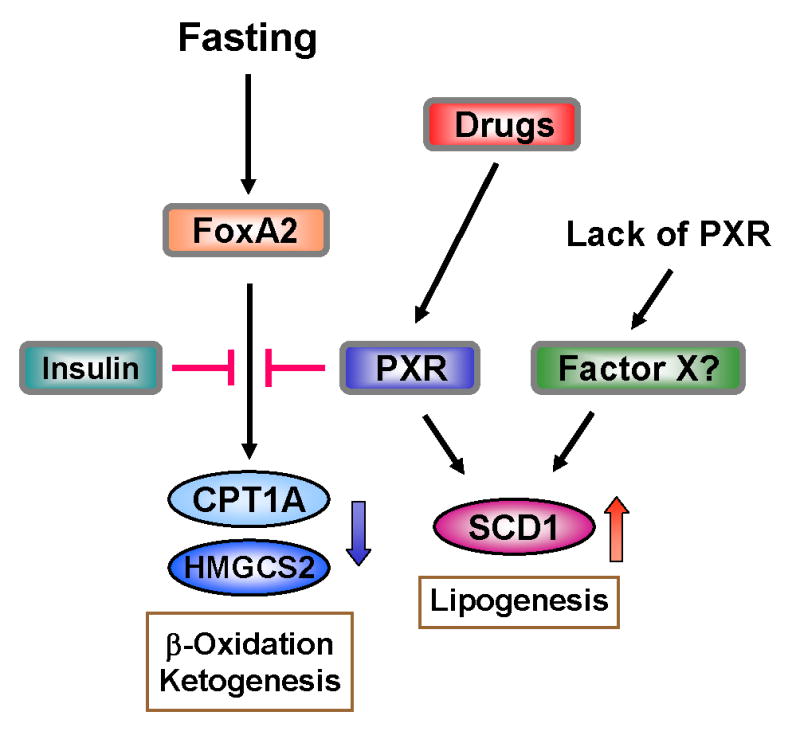
Schematic representation of cross talk between PXR and FoxA2 for regulation of lipid metabolism. Arrows indicate activation and stop bar indicate repression. Activated PXR represses FoxA2 activity to down regulate gene expressions of CPT1A or HMGCS2 while activating that of SCD1. Regulatory mechanism of SCD1 gene expression by PXR is not known at the present time.
The Cpt1a promoter contains the two FoxA-binding sequences in the distal region (-1910/-1886 and -1733/-1719), while the Hmgcs2 promoter bears the one active sequence in the proximal region (-176/-182). Deletion of these sequences abrogated the FoxA2-mediated transcription of these promoters. Through its LBD, PXR directly binds to the DBD (residues 144/279) of FoxA2 and prevents the FoxA2 binding to its response sequences of the promoters, repressing the transcription of the Cpt1a and Hmgcs2 gene. PXR and also CAR are known to repress another insulin response transcription factor FoxO1 that plays the major role in the regulation of hepatic gluconeogenesis (17). Mechanistically resembling the repression of FoxA2 activity, PXR directly binds to FoxO1 and down-regulates the FoxO1-mediated transcription of the Pepck1 gene. In fact, it has recently been reported the Pepck1 and G6Pase genes are up-regulated in the transgenic mice expressing constitutively activated PXR (40). Thus, the xenobiotic sensing nuclear receptors make use of a similar molecular mechanism to repress gluconeogenesis, β-oxidation and ketogenesis through direct binding to members of the forkhead transcription factor family FoxO1 and FoxA2.
The rate-limiting enzymes FAS and ACC1 in fatty acid synthesis were not regulated by PXR. Therefore, the hepatic level of triglycerides does not seem to be due to an increase of fatty acid synthesis in the liver. In addition to SCD1, the other enzymes DGAT2 and MTTP involved in triglyceride synthesis and secretion were examined and found not to be regulated by PXR. Thus, SCD1 is the major enzyme responsible for the hepatic accumulation of triglycerides and lipid droplets in the present animal model. The Scd1 gene was up-regulated in the transgenic mouse bearing the constitutively activated PXR (40). SCD1 has long been known to play the key role in triglyceride synthesis: the Scd1 null mice have a lower level of triglyceride in the liver than Scd1 wild type mice and over-expressing SCD1 in CHO cells elevated the cellular level of triglycerides (41,42). The molecular mechanism of PXR-mediated activation of the Scd1 gene remains uninvestigated at the present time (Fig. 7). Insulin treatment also up-regulates the Scd1 gene, in which insulin activates the SREBP-SRE mediated transcription (43). Whether or not PXR cross talks with the SREBP signal pathway to up-regulate the Scd1 gene will be an interesting question for future investigations. The down-regulation of Cpt1a by PXR may also have had additionally contributed to the increase of hepatic triglycerides in the PCN-treated mice. It has been shown that treating mice with the CPT1A inhibitor tetradecylglycidic acid elevated hepatic triglycerides (44). Moreover, the heterozygous Cpt1a-null mouse exhibited an elevated level of serum triglycerides (45). By up-regulating and down-regulating SCD1 and CPT1A, respectively, drug activation of PXR can effectively lead the liver to develop steatosis.
The serum glucose level in the fasting Pxr+/+ mouse was reduced by PCN treatment, indicating that the activated PXR mediates the drug-induced decrease of serum glucose. As previously shown, PXR can directly down-regulate FoxO1-mediated transcription, thus repressing gluconeogenesis (17). Given the finding that PXR down-regulates the Cpt1a gene, xenobiotics and drugs such as PCN that activate PXR may also repress gluconeogenesis by down-regulating the genes such as Cpt1a and β-oxidation. Since β-oxidation produces chemical energy and reducing agents such as ATP and NADH, its decline limits the supply of these chemicals required for gluconeogenesis to proceed. With the simultaneous decreases of both glucose and ketone bodies, the PCN-treated mice develop a similar phenotype to the hypoketoic hypoglycemia observed in CPT1A- or HMGCS2-deficient patients (46,47), and thus provide us with an animal model to investigate the relevant human diseases.
A most intriguing finding from our present study was the fact that the untreated Pxr-/- mice developed severe steatoses, as indicated by the accumulation of triglycerides and large lipid droplets in the liver. Consistently, the Scd1 and Cpt1a gene were up- and down-regulated, respectively in the liver of these mice. The Hmgcs2 gene was also constitutively down-regulated and the serum level of 3-hydroxybutylate was decreased in Pxr-/- mice. The phenotypes observed in the Pxr-/- mouse appear to be comparable to those observed in the PCN-treated Pxr+/+ mice; both the activation and lack of PXR regulate these genes similarly, resulting in the development of steatosis. These phenotypes were correlated with the high levels of serum insulin in the Pxr-/- mice. Although it remains further investigated, there is the possibility that the endogenous PXR (PXR not activated by drugs) is capable of protecting insulin to elevate its serum levels, thus preventing the liver from developing steatosis and to control ketogenesis. The mechanism of how endogenous PXR regulates serum insulin levels is beyond speculation at the present time. In conclusion, drug-activated PXR is capable of increasing lipogenesis in the liver and of decreasing hepatic β-oxidation and ketogenesis by regulating the genes encoding the key enzymes that catalyze these hepatic metabolic pathways (Fig. 7). The PXR, in part, regulates these genes through cross-talk with the insulin response transcription factor FoxA2, functionally mimicking the effect of insulin. Endogenous PXR also regulates the same set of genes that are regulated by the drug-activated PXR, for which the molecular mechanism is not known. If, in fact, the endogenous PXR is to regulate serum insulin levels, considering the repressive role of the endogenous PXR in the development of steatoses in the untreated Pxr+/+ mice, we are urged to identify the ligand and/or signal pathway that regulate this function of endogenous PXR.
Acknowledgments
This research was supported by the Intramural Research Program of the NIH, National Institute of Environmental Health Sciences.
The abbreviations used are
- CAR
constitutive active/androstane receptor
- PXR
Pregnane X receptor
- PB
Phenobarbital
- RXR
retinoid X receptor
- FoxA2
forkhead box A2
- CPT1A
carnitine palmitolytransferase 1
- HMGCS2
motchondrial 3-hydroxy-3-methylglutarate CoA synthase 2
- PCN
pregnenolone 16α-carbonitrile
- SCD1
stearoyl CoA desaturase 1
- PEPCK1
phosphoenoylpyruvate carboxykinase 1
- G6Pase
glucose-6-phosphatase
- DMSO
dimethyl sulfoxide
- GST
glutathione S-transferase
- DBD
DNA binding domain
- LBD
ligand binding domain
- AF2
activation function 2
- SREBP1
sterol regulatory element-binding protein 1
- ACC1
acetyl CoA carboxylase 1
- FAS
fatty acid synthase
- DGAT2
diglycerol acyltransferase 2
- MTTP
microsomal triacylglyceride transfer protein
- Akt
protein kinase B
- IRS
insulin response sequence
- ChIP
Chromatin immunoprecipitation assay
- NEFA
non-esterified fatty acids
References
- 1.Honkakoski P, Zelko I, Sueyoshi T, Negishi M. Mol Cell Biol. 1998;18(10):5652–5658. doi: 10.1128/mcb.18.10.5652. [DOI] [PMC free article] [PubMed] [Google Scholar]
- 2.Sueyoshi T, Kawamoto T, Zelko I, Honkakoski P, Negishi M. J Biol Chem. 1999;274(10):6043–6046. doi: 10.1074/jbc.274.10.6043. [DOI] [PubMed] [Google Scholar]
- 3.Kliewer SA, Moore JT, Wade L, Staudinger JL, Watson MA, Jones SA, McKee DD, Oliver BB, Willson TM, Zetterstrom RH, Perlmann T, Lehmann JM. Cell. 1998;92(1):73–82. doi: 10.1016/s0092-8674(00)80900-9. [DOI] [PubMed] [Google Scholar]
- 4.Honkakoski P, Sueyoshi T, Negishi M. Ann Med. 2003;35(3):172–182. doi: 10.1080/07853890310008224. [DOI] [PubMed] [Google Scholar]
- 5.Willson TM, Kliewer SA. Nat Rev Drug Discov. 2002;1(4):259–266. doi: 10.1038/nrd753. [DOI] [PubMed] [Google Scholar]
- 6.Yamamoto Y, Kawamoto T, Negishi M. Arch Biochem Biophys. 2003;409(1):207–211. doi: 10.1016/s0003-9861(02)00456-3. [DOI] [PubMed] [Google Scholar]
- 7.Sonoda J, Rosenfeld JM, Xu L, Evans RM, Xie W. Curr Drug Metab. 2003;4(1):59–72. doi: 10.2174/1389200033336739. [DOI] [PubMed] [Google Scholar]
- 8.Wei P, Zhang J, Egan-Hafley M, Liang S, Moore DD. Nature. 2000;407(6806):920–923. doi: 10.1038/35038112. [DOI] [PubMed] [Google Scholar]
- 9.Sueyoshi T, Negishi M. Annu Rev Pharmacol Toxicol. 2001;41:123–143. doi: 10.1146/annurev.pharmtox.41.1.123. [DOI] [PubMed] [Google Scholar]
- 10.Goodwin B, Redinbo MR, Kliewer SA. Annu Rev Pharmacol Toxicol. 2002;42:1–23. doi: 10.1146/annurev.pharmtox.42.111901.111051. [DOI] [PubMed] [Google Scholar]
- 11.Sugatani J, Kojima H, Ueda A, Kakizaki S, Yoshinari K, Gong QH, Owens IS, Negishi M, Sueyoshi T. Hepatology. 2001;33(5):1232–1238. doi: 10.1053/jhep.2001.24172. [DOI] [PubMed] [Google Scholar]
- 12.Sugatani J, Sueyoshi T, Negishi M, Miwa M. Methods Enzymol. 2005;400:92–104. doi: 10.1016/S0076-6879(05)00006-6. [DOI] [PubMed] [Google Scholar]
- 13.Xie W, Yeuh MF, Radominska-Pandya A, Saini SP, Negishi Y, Bottroff BS, Cabrera GY, Tukey RH, Evans RM. Proc Natl Acad Sci U S A. 2003;100(7):4150–4155. doi: 10.1073/pnas.0438010100. [DOI] [PMC free article] [PubMed] [Google Scholar]
- 14.Runge-Morris M, Kocarek TA. Curr Drug Metab. 2005;6(4):299–307. doi: 10.2174/1389200054633871. [DOI] [PubMed] [Google Scholar]
- 15.Klaassen CD, Slitt AL. Curr Drug Metab. 2005;6(4):309–328. doi: 10.2174/1389200054633826. [DOI] [PubMed] [Google Scholar]
- 16.Ueda A, Hamadeh HK, Webb HK, Yamamoto Y, Sueyoshi T, Afshari CA, Lehmann JM, Negishi M. Mol Pharmacol. 2002;61(1):1–6. doi: 10.1124/mol.61.1.1. [DOI] [PubMed] [Google Scholar]
- 17.Kodama S, Koike C, Negishi M, Yamamoto Y. Mol Cell Biol. 2004;24(18):7931–7940. doi: 10.1128/MCB.24.18.7931-7940.2004. [DOI] [PMC free article] [PubMed] [Google Scholar]
- 18.Rosenfeld JM, Vargas R, Jr, Xie W, Evans RM. Mol Endocrinol. 2003;17(7):1268–1282. doi: 10.1210/me.2002-0421. [DOI] [PubMed] [Google Scholar]
- 19.Bartlett K, Eaton S. Eur J Biochem. 2004;271(3):462–469. doi: 10.1046/j.1432-1033.2003.03947.x. [DOI] [PubMed] [Google Scholar]
- 20.Laffel L. Diabetes Metab Res Rev. 1999;15(6):412–426. doi: 10.1002/(sici)1520-7560(199911/12)15:6<412::aid-dmrr72>3.0.co;2-8. [DOI] [PubMed] [Google Scholar]
- 21.Fukao T, Lopaschuk GD, Mitchell GA. Prostaglandins Leukot Essent Fatty Acids. 2004;70(3):243–251. doi: 10.1016/j.plefa.2003.11.001. [DOI] [PubMed] [Google Scholar]
- 22.Eaton S, Bartlett K, Pourfarzam M. Biochem J. 1996;320(Pt 2):345–357. doi: 10.1042/bj3200345. [DOI] [PMC free article] [PubMed] [Google Scholar]
- 23.Hegardt FG. Biochem J. 1999;338(Pt 3):569–582. [PMC free article] [PubMed] [Google Scholar]
- 24.Louet JF, Le May C, Pegorier JP, Decaux JF, Girard J. Biochem Soc Trans. 2001;29(Pt 2):310–316. doi: 10.1042/0300-5127:0290310. [DOI] [PubMed] [Google Scholar]
- 25.Wolfrum C, Asilmaz E, Luca E, Friedman JM, Stoffel M. Nature. 2004;432(7020):1027–1032. doi: 10.1038/nature03047. [DOI] [PubMed] [Google Scholar]
- 26.Wolfrum C, Besser D, Luca E, Stoffel M. Proc Natl Acad Sci U S A. 2003;100(20):11624–11629. doi: 10.1073/pnas.1931483100. [DOI] [PMC free article] [PubMed] [Google Scholar]
- 27.Wang H, Wollheim CB. Trends Mol Med. 2005;11(6):262–265. doi: 10.1016/j.molmed.2005.04.003. [DOI] [PubMed] [Google Scholar]
- 28.Kiyosawa N, Tanaka K, Hirao J, Ito K, Niino N, Sakuma K, Kanbori M, Yamoto T, Manabe S, Matsunuma N. Arch Toxicol. 2004;78(8):435–442. doi: 10.1007/s00204-004-0565-0. [DOI] [PubMed] [Google Scholar]
- 29.Rausa FM, Tan Y, Costa RH. Mol Cell Biol. 2003;23(2):437–449. doi: 10.1128/MCB.23.2.437-449.2003. [DOI] [PMC free article] [PubMed] [Google Scholar]
- 30.Pani L, Overdier DG, Porcella A, Qian X, Lai E, Costa RH. Mol Cell Biol. 1992;12(9):3723–3732. doi: 10.1128/mcb.12.9.3723. [DOI] [PMC free article] [PubMed] [Google Scholar]
- 31.Squires EJ, Sueyoshi T, Negishi M. J Biol Chem. 2004;279(47):49307–49314. doi: 10.1074/jbc.M407281200. [DOI] [PubMed] [Google Scholar]
- 32.Kobayashi K, Sueyoshi T, Inoue K, Moore R, Negishi M. Mol Pharmacol. 2003;64(5):1069–1075. doi: 10.1124/mol.64.5.1069. [DOI] [PubMed] [Google Scholar]
- 33.Allander SV, Durham SK, Scheimann AO, Wasserman RM, Suwanichkul A, Powell DR. Endocrinology. 1997;138(10):4291–4300. doi: 10.1210/endo.138.10.5268. [DOI] [PubMed] [Google Scholar]
- 34.Kakizaki S, Karami S, Negishi M. Drug Metab Dispos. 2002;30(2):208–211. doi: 10.1124/dmd.30.2.208. [DOI] [PubMed] [Google Scholar]
- 35.Ishii S, Iizuka K, Miller BC, Uyeda K. Proc Natl Acad Sci U S A. 2004;101(44):15597–15602. doi: 10.1073/pnas.0405238101. [DOI] [PMC free article] [PubMed] [Google Scholar]
- 36.Gorski K, Carneiro M, Schibler U. Cell. 1986;47(5):767–776. doi: 10.1016/0092-8674(86)90519-2. [DOI] [PubMed] [Google Scholar]
- 37.Bligh EG, Dyer WJ. Can J Biochem Physiol. 1959;37(8):911–917. doi: 10.1139/o59-099. [DOI] [PubMed] [Google Scholar]
- 38.Waters KM, Ntambi JM. J Biol Chem. 1994;269(44):27773–27777. [PubMed] [Google Scholar]
- 39.Mounier C, Posner BI. Can J Physiol Pharmacol. 2006;84(7):713–724. doi: 10.1139/y05-152. [DOI] [PubMed] [Google Scholar]
- 40.Zhou J, Zhai Y, Mu Y, Gong H, Uppal H, Toma D, Ren S, Evans RM, Xie W. J Biol Chem. 2006;281(21):15013–15020. doi: 10.1074/jbc.M511116200. [DOI] [PMC free article] [PubMed] [Google Scholar]
- 41.Listenberger LL, Han X, Lewis SE, Cases S, Farese RV, Jr, Ory DS, Schaffer JE. Proc Natl Acad Sci U S A. 2003;100(6):3077–3082. doi: 10.1073/pnas.0630588100. [DOI] [PMC free article] [PubMed] [Google Scholar]
- 42.Miyazaki M, Kim YC, Gray-Keller MP, Attie AD, Ntambi JM. J Biol Chem. 2000;275(39):30132–30138. doi: 10.1074/jbc.M005488200. [DOI] [PubMed] [Google Scholar]
- 43.Tabor DE, Kim JB, Spiegelman BM, Edwards PA. J Biol Chem. 1999;274(29):20603–20610. doi: 10.1074/jbc.274.29.20603. [DOI] [PubMed] [Google Scholar]
- 44.Grefhorst A, Hoekstra J, Derks TG, Ouwens DM, Baller JF, Havinga R, Havekes LM, Romijn JA, Kuipers F. Am J Physiol Gastrointest Liver Physiol. 2005;289(3):G592–598. doi: 10.1152/ajpgi.00063.2005. [DOI] [PubMed] [Google Scholar]
- 45.Nyman LR, Cox KB, Hoppel CL, Kerner J, Barnoski BL, Hamm DA, Tian L, Schoeb TR, Wood PA. Mol Genet Metab. 2005;86(12):179–187. doi: 10.1016/j.ymgme.2005.07.021. [DOI] [PubMed] [Google Scholar]
- 46.Olpin SE. Prostaglandins Leukot Essent Fatty Acids. 2004;70(3):293–308. doi: 10.1016/j.plefa.2003.06.003. [DOI] [PubMed] [Google Scholar]
- 47.Rinaldo P, Matern D, Bennett MJ. Annu Rev Physiol. 2002;64:477–502. doi: 10.1146/annurev.physiol.64.082201.154705. [DOI] [PubMed] [Google Scholar]